
95% of researchers rate our articles as excellent or good
Learn more about the work of our research integrity team to safeguard the quality of each article we publish.
Find out more
ORIGINAL RESEARCH article
Front. Sports Act. Living , 17 April 2023
Sec. Exercise Physiology
Volume 5 - 2023 | https://doi.org/10.3389/fspor.2023.1139065
This article is part of the Research Topic The Effects of Various Myofascial Techniques on Muscle-tendon Function, Neuro-mechanical Properties, Pain, Injury, and Recovery View all 4 articles
 Tim Wohlann1*
 Konstantin Warneke1
 Martin Hillebrecht2
 Astrid Petersmann3,4
 Alexander Ferrauti5Stephan Schiemann1
Purpose: Static stretch training (SST) with long stretching durations seems to be sufficient to increase flexibility, maximum strength (MSt) and muscle thickness (MTh). However, changes in contraction properties and effects on muscle damage remain unclear. Consequently, the objective of the study was to investigate the effects of a 6-week self-performed SST on MSt, MTh, contractile properties, flexibility, and acute response of creatine kinase (CK) 3 days after SST.
Methods: Forty-four participants were divided into a control (CG, n = 22) and an intervention group (IG, n = 22), who performed a daily SST for 5 min for the lower limb muscle group. While isometric MSt was measured in leg press, MTh was examined via sonography and flexibility by functional tests. Muscle stiffness and contraction time were measured by tensiomyography on the rectus femoris. Additionally, capillary blood samples were taken in the pretest and in the first 3 days after starting SST to measure CK.
Results: A significant increase was found for MSt (p < 0.001, η2 = 0.195) and flexibility in all functional tests (p < 0.001, η2 > 0.310). Scheffé post hoc test did not show significant differences between the rectus femoris muscle inter- and intragroup comparisons for MTh nor for muscle stiffness and contraction time (p > 0.05, η2 < 0.100). Moreover, CK was not significantly different between IG and CG with p > 0.05, η2 = 0.032.
Discussion: In conclusion, the increase in MSt cannot be exclusively explained by muscular hypertrophy or the increased CK-related repair mechanism after acute stretching. Rather, neuronal adaptations have to be considered. Furthermore, daily 5-min SST over 6 weeks does not seem sufficient to change muscle stiffness or contraction time. Increases in flexibility tests could be attributed to a stretch-induced change in the muscle–tendon complex.
In animal studies, chronic static stretch training (SST) performed for 30 min up to 24 h for more than 4 weeks induced significant increases of up to 95% in maximal strength (MSt) (1) and muscle mass of up to 318% (2, 3). In humans, it is well established that SST leads to improved flexibility, but the literature shows conflicting results regarding MSt. While some authors measured long-term increases of +16.8% (p < 0.001) in the plantar flexors (4) and +32.4% in the knee extensors (p < 0.001) (5) following several weeks of stretching, others were not able to find significant increases (6, 7). There are different explanatory approaches for enhanced stretch-induced MSt, such as morphological, physiological, or neural adaptation (4, 8). Smith et al. (9) showed that SST has the potential to produce high mechanical stress that can cause microtraumatization in the muscle, leading to an increase in creatine kinase (CK) (p < 0.05). It is hypothesized that the subsequent repair mechanisms are an anabolic stimulus that contributes to increased MSt by resulting in muscle hypertrophy (10).
However, the current literature shows varied results on muscle thickness (MTh) following SST, ranging from 0% (7, 11) to +15.3% (4). These conflicting results could be attributed to high heterogeneity in study design regarding stretching intensity and stretching duration. The training volume ranges from 4 × 30 s, three times per week (12, 13) to a daily 60 min stretch training for 6 weeks (4). Nevertheless, since MSt increases were found after stretching interventions without improved MTh (14), enhanced MSt after SST cannot be exclusively explained by a hypertrophy effect. There is still insufficient knowledge about further physiological and functional adaptions due to SST over several weeks in humans, such as contraction velocity and muscle stiffness. Apart from stretch-induced MSt increases in animal research, Alway (1) showed a significantly reduced contraction velocity, which was accompanied by a shift in fiber contribution to slower myosin heavy chains in animals. The question arises whether the effects of daily stretching on muscle–tendon structures are transferable to humans since—to the best knowledge of the authors—no previous studies have addressed the long-term effects of daily stretching on contraction velocity in humans.
Currently, little is known about the change in muscle stiffness following several weeks of SST. While there is evidence of decreased muscle stiffness (15, 16), other studies found no changes in muscle stiffness (17, 18). This may be explainable by different study designs. Literature is lacking on whether long-term SST alters muscle stiffness when the goal of SST is to increase MSt. Studies that measure stretch-induced increases in MSt due to SST often examined single muscles only, e.g., the plantar flexors, or used a stretching device (4, 12–14). However, in most activities in daily life and sports, several muscle groups are involved in one complex movement. Therefore, the practical relevance of studies investigating single-joint muscles seems limited. To increase the practical applicability of results, the question arises whether and to which extent self-performed SST of multiple muscles can increase MSt in complex movements involving multiple muscles.
To improve understanding of stretch-induced adaptations of the muscle, it is hypothesized that 6-week self-performed SST using daily 5-min stretching per muscle in four different exercises will increase MSt, MTh, and flexibility. Further hypotheses are that SST will lead to muscle microtraumatization, which can be assessed by increases in CK values following the first 3 days of SST, and that 6 weeks of SST will lead to a decrease in contraction velocity and lower muscle stiffness.
To test the hypotheses, participants underwent a daily static stretching routine in a pre- and post-test design. First, ultrasound images of the rectus femoris were obtained, followed by an examination of contractile properties using tensiomyography (TMG). Subsequently, flexibility tests were performed. A small amount of capillary blood was drawn from the subjects for CK measurements. Capillary blood collection and CK measurements were performed at pretest and 24, 48, and 72 h after the start of the intervention. A warm-up set was followed by MSt measurements.
Based on previous studies performed by Kokkonen et al. (5) and Nelson et al. (13), a high effect size of d = 0.8 can be assumed. Ad hoc sample size calculations using G-Power showed a minimum sample size of 27 with an effect size of f = 0.4. A total of 44 active participants were recruited from the university sports center and physical education classes of the university and assigned to an intervention group (IG) or a control group (CG), Participants characteristics are shown in Table 1. Participants stating chronic pain in the lower extremity, injury, or surgery during the last 6 months as well as regular stretching routines were excluded from the study. Participants who were used to regular stretch training and were classified as active if they participated in or performed physical activities such as running, trained at the gym at least twice per week, or joined any university sports. All participants were informed about the procedure and purpose of the present study at the pretest meeting and gave their informed consent. The study was performed in accordance with the Declaration of Helsinki and approved by the Oldenburg Medical Ethics Committee 2021-089.
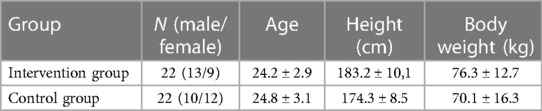
Table 1. Characteristics of participants.
Before testing MSt, a warm-up program was performed with running for 5 min, followed by 10 deep bodyweight squats. Isometric MSt was measured unilaterally for both legs against an immovable platform from AST (model KAC) with an integrated strain gauge using a 13-bit AD converter (NI6009) with a measuring range of 5000 N. Participants were positioned on their backs with a hip angle of 80°, a knee angle of 70°, an ankle angle of 90° and performed as many trials until no further increase in MSt values could be obtained. They completed at least three trials with a 90-s rest between trials to avoid fatigue. To counteract a habituation effect, an appointment before the pretest was given where the subjects could practice the MSt tests.
The flexibility of the knee joint was tested using the modified Thomas test. This test has a high test–retest reliability, with a reported intraclass correlation coefficient (ICC) value of 0.87–0.91 (19). For this purpose, the subjects lay down with their coccyx on the edge of a medical bed so that the legs were not on the medical bed. The non-measured leg was then bent with the hands on the knee toward the umbilicus until the measured leg was parallel to the floor and the angle between the two legs did not change due to a seesaw motion (Figure 1A). After reaching this position, a digital goniometer was used to measure the angle between the lower leg and the unbent upper leg. The goniometer was held at the knee joint and was in line with the thigh (parallel to the ground) and the lateral malleolus.
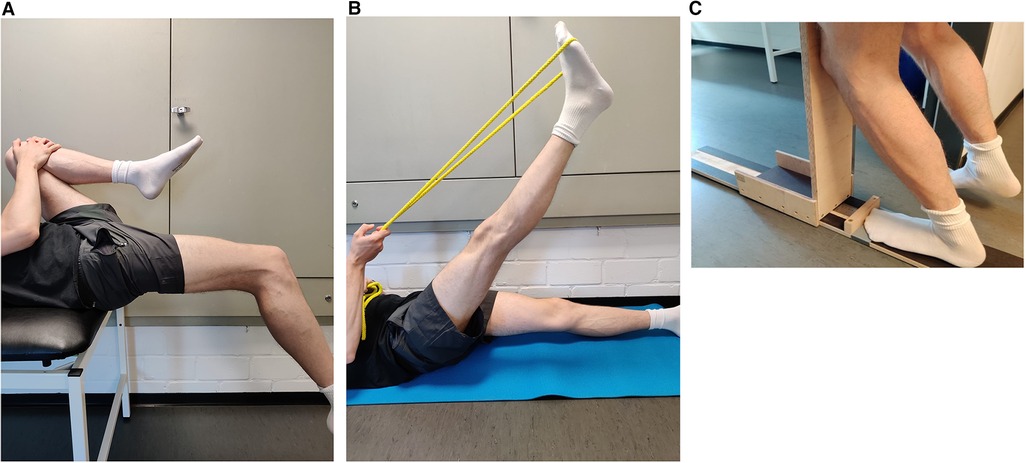
Figure 1. Flexibility tests of the knee joint (A), hamstrings muscles (B), and ankle joint (C).
The hamstring flexibility test was performed as described by Cejudo et al. (19). Subjects lay flat on the floor and raised one leg fully extended as high as possible. The other leg was placed fully extended on the floor (Figure 1B). A digital goniometer was used to measure the angle at the hip between the raised leg and the non-raised leg on the floor. The reliability of this test can be classified as high, with an ICC value of 0.87–0.94 (19).
A knee-to-wall test consisting of a track motion sled was used to determine flexibility in the ankle joint. The measured leg was positioned on the board, and a piece of paper was placed underneath the heel; participants were instructed to bend the knee and push the sled forward until the paper pulled away from the heel. Subsequently, the centimeters were read off the measuring scale (Figure 1C). The reliability of this test is considered high, with ICC ranging between 0.979 and 0.992 and CV ranging between 0.94 and 1.81 (4).
To measure MTh changes, ultrasound images of the rectus femoris muscle were acquired using a DC 30 Full HD device from MINDRAY with a 5–14 MHz linear probe. A point 15 cm above the superior patella in the direction of the spina iliaca anterior inferior was marked with a waterproof felt-tip pen. This measurement method is described by e Lima et al. (20) with a high-reliability ICC value of 0.88–0.99. For the measurement of MTh, the transducer was positioned in the middle of the muscle belly in a horizontal line orthogonal to the leg (Figure 2A). Three images of the rectus femoris muscle were acquired per leg and test day, each with three subsequent distance measurements centered in the image. Two reliability values were calculated for the present study: First, reliability of the measured distances within 1 image (Figure 2B) and second the average distances between 3 images (Table 2).

Figure 2. Sonography to measure muscle thickness of m. rectus femoris (A) and image analysing of three subsequent distances (B).
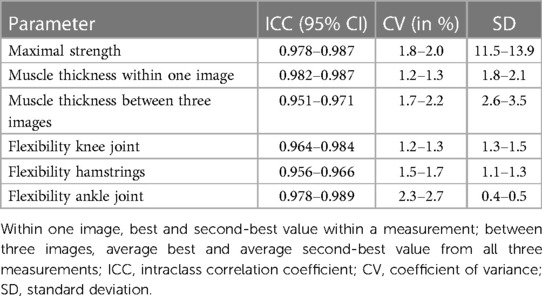
Table 2. Reliability of the methods used.
TMG was used to examine contractile properties. The measurement point of the TMG was placed on the same spot as the measurement point of the sonography. Before the electrodes were positioned, the skin was shaved, disinfected with alcohol, and dried. Afterward, the electrodes were placed at an interelectrode distance of 6 cm in a longitudinal direction along the leg, as recommended by Wilson et al. (21) (Figure 3). Two straps were used to fix the leg to avoid leg movements in response to the electric impulse. Electric stimulation started with 60 mA and successively increased by 10 mA until the tmg curve did not change in three consecutive trials. This procedure was used in pre- and post-tests. Parameters were calculated based on the maximal radial displacement curve over time. First, muscle displacement (Dm) expressed in millimetres represents the maximal radial displacement and provides information about the stiffness of the muscle (Simunič et al. (22)). Reliability for rectus femoris was shown by Paula Simola et al. with ICC: 0.92; CV: 9.30% and ICC: 0.92; CV: 5.7% (Wilson et al. (21)). Second, contraction time (Tc) measured in milliseconds provides information about the velocity of muscle contraction and is calculated by the deformation time between 10% and 90% of DM (Paula Simola et al. (24)). Reliability for rectus femoris was shown by Paula Simola et al. (23) with ICC: 0.86; CV: 4.90% and Wilson et al. (21) with CV: 2.0%.
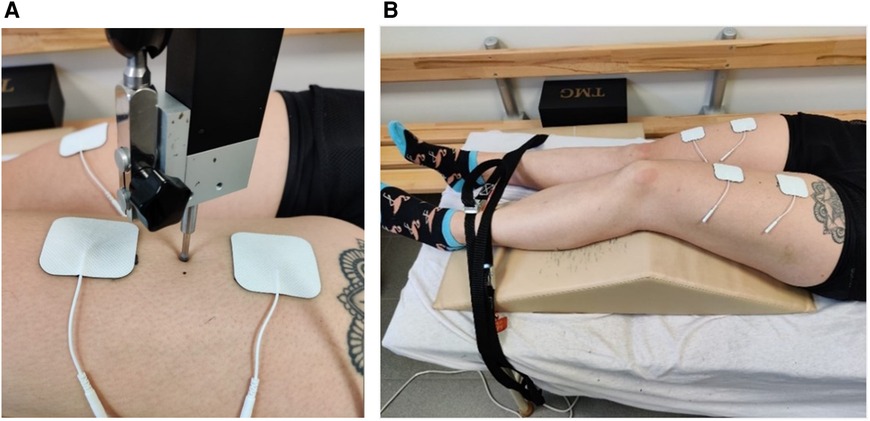
Figure 3. Measuring point of the TMG sensor position (A) and setup of the TMG measurement (B).
CK was measured before and 24, 48, and 72 h after the intervention started. In total, 150 mL of blood was collected from the fingertip using a sterile disposable device and an EDTA-coated capillary. Samples were transferred to a tube immediately after collection and centrifuged. The plasma supernatant, approximately 70 mL, was removed and used to determine CK activity. The analysis was performed on a CobasPro (Roche Diagnostics Deutschland GmbH, Mannheim, Germany). A photometric assay in which the activity of CK was inferred by measuring NADPH in a defined reaction mixture was conducted.
The intervention group performed a standardized 6-week SST mainly targeting m. quadriceps—rectus femoris, m. gastrocnemius, hamstrings, and m. gluteus maximus for the dominant leg (preferred side for kicking a ball). Each stretch exercise was performed continuously for 5 min, resulting in a daily stretch time of 20 min. The intensity was regulated using a subjective visual analog scale (VAS) ranging from 1 to 10, with 10 defined as the maximal stretch pain. Participants were instructed to perform each stretch exercise at maximum tolerated stretch pain and protocolled each training session. A supervised group stretch training session was offered 3 days per week to improve compliance. It was mandatory to participate in at least one group training session per week.
Statistical analysis was performed using SPSS 28 (IBM SPSS Statistics, version 28). All data are provided as mean ± standard deviation. Normal distribution was approved by using the Shapiro–Wilk test (p > 0.05). For reliability, the intraclass correlation coefficient and the coefficient of variance were calculated (Table 2). One-way analysis of variance (ANOVA) was used to ensure the absence of significant differences in pretest values. Two-way ANOVA with repeated measurements of factor time and group with a Scheffé post hoc test was performed to reveal significant differences within and between groups. Significant differences were tested bilaterally. Effect sizes [eta square (η2)] were categorized as small effect η2 < 0.06, medium effect η2 = 0.06–0.14, and high effect η2 > 0.14, as well as Cohen's d with d < 0.5 indicating small effect, 0.5–0.8 indicating medium effect, and >0.8 indicating high effect (Cohen, 25). The critical level of significance was set at p = 0.05 in this study.
One-way ANOVA showed no significant differences between pretest values for all parameters (p > 0.05). In Tables 3–5, legs are listed as follows: dominant leg of the IG, non-dominant leg of the IG, dominant leg of the CG, and non-dominant leg of the CG. The reliability values of the used methods are shown in Table 2.
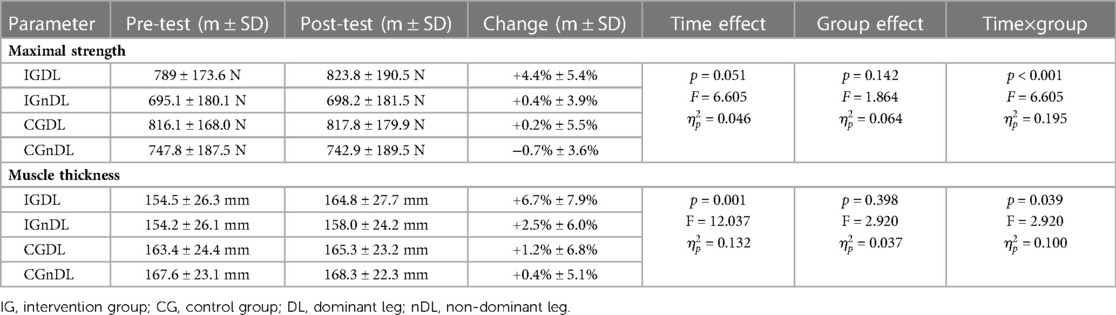
Table 3. Descriptive statistics and two-way ANOVA of maximal strength tests and muscle thickness.
Comparisons of mean values of isometric MSt and MTh in pre- and post-tests for both groups and each leg and the results of ANOVA are presented in Table 3.
The Scheffé test revealed significant increases in mean differences between pre- and post-test values of the stretched leg versus control leg of the IG (p = 0.006, d = 0.651), stretched leg versus dominant leg of the CG (p = 0.031, d = 0.55), and stretched leg versus non-dominant leg of the CG (p = 0.002, d = 0.71). No further significant differences were determined.
MTh via sonography Scheffé post hoc test showed no significant increases between pre- and post-test values in the stretched leg versus control leg of the IG (p = 0.325, d = 0.344) or stretched leg versus dominant leg of the CG (p = 0.136, d = 0.438) nor in the stretched leg versus non-dominant leg of the CG (p = 0.066, d = 0.505).
Comparisons of mean values and statistics of ANOVA for flexibility in the measured movement tasks from pre- to post-tests for both groups and each leg are presented in Table 4.
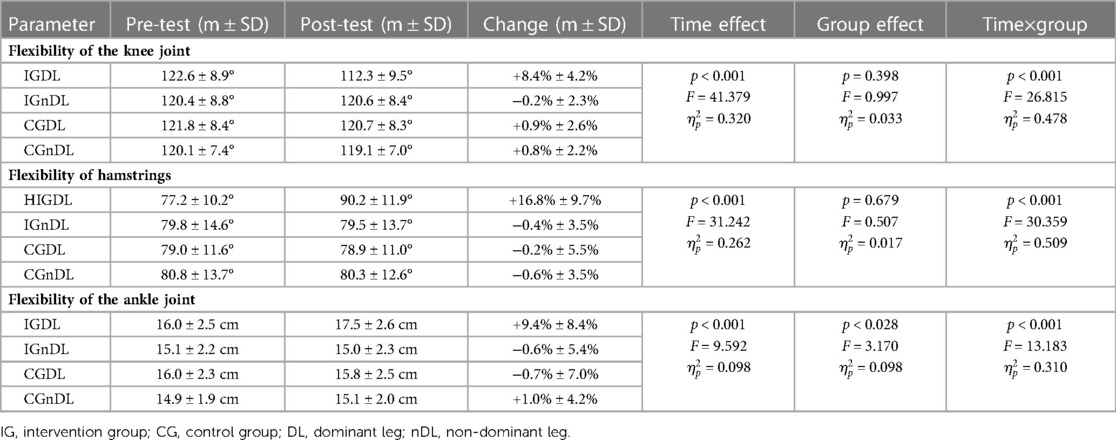
Table 4. Descriptive statistics and two-way ANOVA of flexibility.
The Scheffé test showed significant increases in the stretched leg compared to the control leg within IG in all flexibility tests (Kj: p < 0.001, d = 1.239; Ham: p < 0.001, d = 1.247; Aj: p < 0.001, d = 0.926) as well as compared to the dominant leg of the CG (Kj: p < 0.001, d = 1.374; Ham: p < 0.001, d = 1.39; Aj: p < 0.001, d = 0.844) and the non-dominant leg of the CG (Kj: p < 0.001, d = 1.216; Ham: p < 0.001, d = 1.409; Aj: p < 0.001, d = 0.904). No further significant differences were obtained.
Comparisons of mean values and changes in TMG Dm and Tc in pre- and post-tests for both groups and each leg are presented in Table 5. The intervention did not cause any significant change in these parameters.
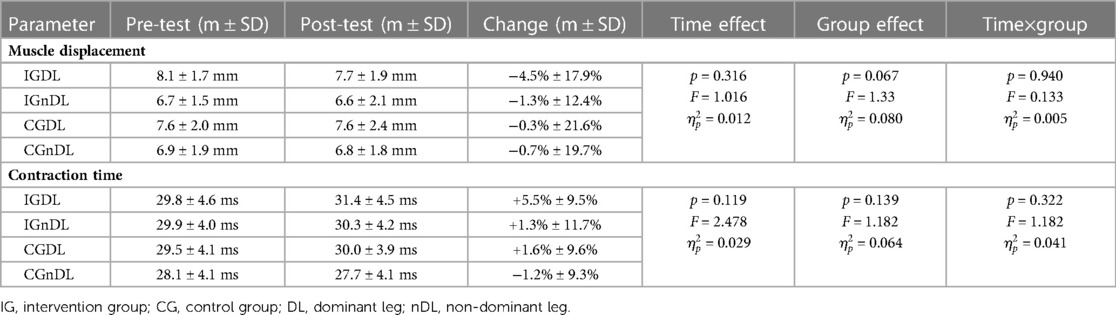
Table 5. Descriptive statistics and two-way ANOVA of TMG Dm and Tc.
Comparisons of mean values of CK from the pretest to 3 days after the start of the intervention are presented in Table 6. No significant changes were obtained.

Table 6. Descriptive statistics and two-way ANOVA of creatine kinase.
The present study aimed to investigate the effects of a self-performed, daily SST for 5 min on leg muscles over 6 weeks on MSt, MTh, and flexibility. Since there is a lack of knowledge on physiological and functional changes following SST, acute changes of serum CK and measurements of contraction properties were included. The results confirm the hypothesis of an increase in MSt and flexibility in the stretched leg compared to the control leg (contralateral and in the control group). However, the results do not confirm the hypotheses concerning an increase in MTh, a decrease in contraction velocity, and a reduction in muscle stiffness. Since CK values are not significantly different, the hypothesis that SST can lead to acute microtraumtization of the muscle is not confirmed. Increases in MSt found in the present study are in line with previous studies (4, 5, 12–14) and could possibly be explained by neuronal or morphological changes due to high mechanical tensile tension. Since an increase in muscle protein synthesis due to stimulated anabolic signaling pathways such as PI3K/Akt/mTOR was reported in animal studies using chronic stretching (26–28), it could be speculated that similar adaptations could occur in humans. Some authors describe a possible stretch-induced stimulation of the PI3K/AkT/mTOR signaling pathway in a muscle through the release of growth factors, such as insulin-like growth factor I and hepatocyte growth factor (28–30). However, the stimulation of anabolic pathways would probably mainly promote hypertrophy, which failed to reach the significance level in this study. Thus, further research seems necessary to investigate the underlying mechanisms of stretch-mediated MSt increases since the contribution of MTh increases to enhanced MSt was limited in this study.
Smith et al. (9) could show a significant increase in CK after static stretching in humans, indicating microtraumatization of the muscles, which may initiate repair mechanisms and stimulate anabolic processes (10, 32), e.g., increase muscle protein synthesis. Even though there seems to be a link between microtraumatization after resistance training—so-called exercise-induced muscle damage and increased hypertrophy (33)—results of the present study were unable to show stretch-induced increases in CK values nor increased MTh. When interpreting increased CK values as a predictor of muscle microtraumatization, a distinction has to be made between statistical evaluation and clinical relevance. There is a wide range of measured CK values in training studies, varying from 20 to 35 to 200–400 U/L at the base level (34, 35) up to 25.000 U/L 1 day after eccentric exercise (36). The mean CK values measured in the present study were 153.1 U/L at the pretest to 180.8 U/L one day after the stretch, while Smith et al. (9) measured a mean CK of 84.5 U/L at the pretest and 126.7 U/L one day after static stretching, which was the highest measured CK value. However, the CK values of Smith et al. (9) are still within the range of an average base level of CK and can be considered within a normal non-muscle-damaged physiological range of variation. exercise-induced changes in CK have their peak 3 days after training (37). Therefore, in the present study, CK was measured before intervention, 1, 2 and 3 days after the start of the intervention. However, all CK values are within an average base level of CK (34) and can be classified as a non-muscle-damaged physiological range of variation. Therefore, it can be assumed that 4 × 5 min of daily SST on the first 3 days of the intervention period did not lead to a clinically relevant increase in CK values, indicating no acute microtraumatization response of muscle tissue.
Goldspink and Harridge (10) describes a link between cross-sectional area of the muscle and the force production potential of the muscle. However, muscle hypertrophy can also occur without microtraumatization of the muscles (38). Previous studies observed significant MTh increases following SST; a hypertrophy effect could possibly explain the MSt increases (4, 8, 39). Yahata et al. (14) examined the effect of SST on the gastrocnemius using 6 × 5 min per session on 2 days per week for 5 weeks and observed a significant increase in MSt but not in MTh, which was similar to the present study. The present results suggest that too low stretch intensity could be responsible for no changes in MTh. In self-performed SST, stretch intensity is limited by the subjective level of tolerated pain. On a VAS of 1–10, which describes the maximum stretch pain that can be tolerated, participants in the present study were instructed to perform the exercises to the maximum tolerated stretch pain. However, since the VAS is subjective and the perception of pain varies greatly from person to person (40), it can be speculated that the stretch intensity may not be sufficient. Lim and Park pointed out no correlation between passive peak torque and stretch pain. In contrast to the present study, Warneke et al. (4) observed a +15.3% increase in MTh of the calf muscle. As participants stretched the calf muscles for 7 h every week, the training volume was more extensive than the present study. A study by Simpson et al. (8) used an external stretching device and observed a significant increase in MTh. However, they performed a stretch volume of 900 s compared to the 2100 s per muscle used in the current study. It can be hypothesized that passive SST with an external stretching device leads to greater MSt and MTh increases than self-performed SST.
Since this is the first study examining muscle stiffness and contraction velocity by tensiomyography following 6-week SST, there is limited comparability to the results of other studies. In the present study, no stretch-induced increase in Tc was measured, indicating no decrease in contraction velocity. Since in animal models, Alway (1) used a stretching duration of 24 h per day, compared to 5 min per day in the present study, an insufficient stretch time could be assumed to induce a change in contraction velocity.
Literature provides different results about changes in muscle stiffness after several weeks of long-term SST. While there is evidence that stiffness of the muscle–tendon complex decreases after several weeks of SST (15, 16, 41), other studies did not find any changes in stiffness (17, 18). There are different methods of examining muscle stiffness, like dynamometer and sonography (16–18) or shear wave elastography (42). In the present study, muscle stiffness was determined via TMG with an involuntary contraction by measuring muscle belly displacement. Nakamura et al. (41) measured a significant decrease in muscle stiffness following 6 weeks of SST on 3 days per week. The participants performed stretching using a stretch board and reached maximal stretch pain. In the present study, participants stretched without any stretch device. It could be hypothesized that the intensity of the stretch was also not sufficient to induce changes in muscle stiffness.
As expected, in all measured flexibility tests after 6 weeks, stretch training resulted in an improvement of flexibility. Weppler and Magnusson (43) suggested considering two underlying mechanisms: First, an increase in pain tolerance due to a change in the sensitivity of peripheral nociceptors, which is supported by other Authors (44, 45), and second, structural adaptations of the muscle, e.g., decreased muscle stiffness or increased muscle fascicle length (43). The explanation for an increase in pain tolerance could be less important for flexibility tests that do not reach maximum pain tolerance. The measured flexibility of the knee joint in the Thomas test in the present study was not limited by maximum tolerated pain but rather by gravitational force. Since the rectus femoris muscle–tendon complex is connected to the patella and tibialis, the only force that bends the lower leg at the knee joint to achieve a change in flexibility is the gravitational force. Gravitational force can be assumed to not change, and muscle stiffness in the rectus femoris measured via TMG remains also unchanged from pre- to post-tests (Dm: p = 0.94). Animal studies show an increased number of sarcomeres in series in response to stretching (28). A fascicle length increase can be hypothesized due to adding sarcomeres in series. However, there is very limited evidence for longitudinal hypertrophy in humans. Since no structural or neuromuscular testing was performed to explain increased flexibility, explanatory approaches for increased flexibility remain hypothetical. Further research is necessary with flexibility tests measuring a change in flexibility without limitation by maximum pain.
In conclusion, self-performed SST for 5 min per muscle group over 6 weeks led to significant increases in MSt and flexibility. Since acute CK did not increase, microtraumatization of the muscle due to SST can be considered unlikely. Similarly, no significant increase in MTh compared to the non-stretched leg could be detected. Therefore, morphological adaptations cannot explain the increased MSt in the current study.
More research is required to explain increases in MSt and flexibility. Future studies should include comparisons of passive SST with an external stretch device and self-performed SST since the literature shows greater MSt and MTh increases when using an external stretch device. Since changes in muscle stiffness were found in human studies, and contraction velocity was found in animal studies using longer stretch durations, further studies should include longer stretch durations to investigate physiological changes of SST. If stretch time is greater than 5 min, oxygen saturation decreases to 36% (hypoxia condition) (46). Therefore, a long-term effect on contraction velocity due to hypoxic conditions could be hypothesized if stretching is held for more than 5 min, especially using an external stretch device.
It should be mentioned that sonography for MTh determination has some weaknesses in terms of reliability, such as how much probe pressure is applied to measure tissue or water retention. Especially in longitudinal studies, the reliability of ultrasound images should be considered critically (47). To counteract this problem as best as possible, we took three images of one leg and plotted three distances each. This resulted in nine measured values for MTh per test, from which a mean value was calculated. The tester was always the same. Furthermore, muscle architecture changes, for instance, fascicle length and pennation angle, were not measured in the present study, which limited the interpretation of MTh. Therefore, further studies should implement measuring the fascicle length and pennation angle in combination with the evaluation of MTh. Moreover, the participants in the present study were not randomized because it was difficult to find subjects willing to perform intensive stretch training daily for 6 weeks. In addition, TMG as a non-invasive method to measure contraction properties due to surface electrodes should be viewed critically when used in longitudinal studies. Electrode placement, the amount of water in the tissue, and the subcutaneous fat could influence the measurement (24, 25). Muscle stiffness is also not measured directly with TMG. The measurement of the amount of muscle displacement using TMG can only provide indirect information on muscle stiffness during an involuntary contraction. In further studies, it is recommended to measure passive muscle stiffness too by using, e.g., shear wave elastography. Since CK was measured 3 days following SST, there are no long-term data on potential muscle microtraumatization.
The raw data supporting the conclusions of this article will be made available by the authors, without undue reservation.
The studies involving human participants were reviewed and approved by Carl von Ossietzky Universität Oldenburg Medizinische Ethikkommission Ammerländer Heerstr. 114-118 26129 Oldenburg. The patients/participants provided their written informed consent to participate in this study.
TW and MH initiated the study. TW carried out the experiment. TW and MH performed the analytic calculations. TW took the lead in writing the manuscript with the support of KW and SS. AP, AF, KW, and SS included their expertise. AP performed the CK measurements, while AF provided the TMG device. KW and SS contributed to the discussion and helped write the final version. MH and SS supervised the project and provided critical feedback on the test design and statistical analysis. All authors contributed to the article and approved the submitted version.
This publication was funded by the German Research Foundation (DFG).
The authors declare that the research was conducted in the absence of any commercial or financial relationships that could be construed as a potential conflict of interest.
All claims expressed in this article are solely those of the authors and do not necessarily represent those of their affiliated organizations, or those of the publisher, the editors and the reviewers. Any product that may be evaluated in this article, or claim that may be made by its manufacturer, is not guaranteed or endorsed by the publisher.
1. Alway SE. Force and contractile characteristics after stretch overload in quail anterior latissimus dorsi muscle. J Appl Physiol. (1994) 77(1):135–41. doi: 10.1152/jappl.1994.77.1.135
2. Bates GP. The relationship between duration of stimulus per day and the extent of hypertrophy of slow-tonic skeletal muscle in the fowl, Gallus gallus. Comp Biochem Physiol Comp Physiol A Physiol. (1993) 106(4):755–8. doi: 10.1016/0300-9629(93)90393-i
3. Antonio J, Gonyea WJ. Progressive stretch overload of skeletal muscle results in hypertrophy before hyperplasia J. Appl. Physiol. (Bethesda, Md.: 1985) (1993b) 75(3):1263–71. doi: 10.1152/jappl.1993.75.3.1263
4. Warneke K, Brinkmann A, Hillebrecht M, Schiemann S. Influence of long-lasting static stretching on maximal strength, muscle thickness and flexibility. Front Physiol. (2022a) 13:878955. doi: 10.3389/fphys.2022.878955
5. Kokkonen J, Nelson AG, Eldredge C, Winchester JB. Chronic static stretching improves exercise performance. Med Sci Sports Exercise. (2007) 39(10):1825–31. doi: 10.1249/mss.0b013e3181238a2b
6. Sato S, Hiraizumi K, Kiyono R, Fukaya T, Nishishita S, Nunes JP, et al. The effects of static stretching programs on muscle strength and muscle architecture of the medial gastrocnemius. PLoS One. (2020) 15(7):e0235679. doi: 10.1371/journal.pone.0235679
7. Nakamura M, Yoshida R, Sato S, Yahata K, Murakami Y, Kasahara K, et al. Comparison between high- and low-intensity static stretching training program on active and passive properties of plantar flexors. Front Physiol. (2021) 12:796497. doi: 10.3389/fphys.2021.796497
8. Simpson CL, Kim BDH, Bourcet MR, Jones GR, Jakobi JM. Stretch training induces unequal adaptation in muscle fascicles and thickness in medial and lateral gastrocnemii. Scand J Med Sci Sports. (2017) 27(12):1597–604. doi: 10.1111/sms.12822
9. Smith LL, Brunetz MH, Chenier TC, McCammon MR, Houmard JA, Franklin ME, et al. The effects of static and ballistic stretching on delayed onset muscle soreness and creatine kinase. Res Q Exerc Sport. (1993) 64(1):103–7. doi: 10.1080/02701367.1993.10608784
10. Goldspink G, Harridge S. Cellular and molecular aspects of adaptation in skeletal muscle. In: Komi PV, editors. Strength and power in sport. 2nd ed. Oxford, Malden, MA, United States: Blackwell Science, Osney Mead (2003). p. 231–51.
11. Akagi R, Takahashi H. Effect of a 5-week static stretching program on hardness of the gastrocnemius muscle. Scand J Med Sci Sports. (2014) 24(6):950–7. doi: 10.1111/sms.12111
12. Mizuno T. Combined effects of static stretching and electrical stimulation on joint range of motion and muscle strength. J Strength Cond Res. (2019) 33(10):2694–703. doi: 10.1519/JSC.0000000000002260
13. Nelson AG, Kokkonen J, Winchester JB, Kalani W, Peterson K, Kenly MS, et al. A 10-week stretching program increases strength in the contralateral muscle. J Strength Cond Res. (2012) 26(3):832–6. doi: 10.1519/JSC.0b013e3182281b41
14. Yahata K, Konrad A, Sato S, Kiyono R, Yoshida R, Fukaya T, et al. Effects of a high-volume static stretching programme on plantar-flexor muscle strength and architecture. Eur J Appl Physiol. (2021) 121(4):1159–66. doi: 10.1007/s00421-021-04608-5
15. Guissard N, Duchateau J. Effect of static stretch training on neural and mechanical properties of the human plantar-flexor muscles. Muscle Nerve. (2004) 29(2):248–55. doi: 10.1002/mus.10549
16. Nakamura M, Ikezoe T, Takeno Y, Ichihashi N. Effects of a 4-week static stretch training program on passive stiffness of human gastrocnemius muscle-tendon unit in vivo. Eur J Appl Physiol. (2012) 112(7):2749–55. doi: 10.1007/s00421-011-2250-3
17. Blazevich AJ, Cannavan D, Waugh CM, Miller SC, Thorlund JB, Aagaard P, et al. Range of motion, neuromechanical, and architectural adaptations to plantar flexor stretch training in humans. J Appl Physiol. (2014) 117(5):452–62. doi: 10.1152/japplphysiol.00204.2014
18. Konrad A, Tilp M. Increased range of motion after static stretching is not due to changes in muscle and tendon structures. Clin Biomech. (2014) 29(6):636–42. doi: 10.1016/j.clinbiomech.2014.04.013
19. Cejudo A, Sainz de Baranda P, Ayala F, Santonja F. Test-retest reliability of seven common clinical tests for assessing lower extremity muscle flexibility in futsal and handball players. Phys Ther Sport. (2015) 16(2):107–13. doi: 10.1016/j.ptsp.2014.05.004
20. e Lima KMM, da Matta TT, de Oliveira LF. Reliability of the rectus femoris muscle cross-sectional area measurements by ultrasonography. Clin Physiol Funct Imaging. (2012) 32(3):221–6. doi: 10.1111/j.1475-097X.2011.01115.x
21. Wilson HV, Johnson MI, Francis P. Repeated stimulation, inter-stimulus interval and inter-electrode distance alters muscle contractile properties as measured by Tensiomyography. PLoS One. (2018) 13(2):e0191965. doi: 10.1371/journal.pone.0191965
22. Simunič B, Degens H, Rittweger J, Narici M, Mekjavić IB, Pišot R. Noninvasive estimation of myosin heavy chain composition in human skeletal muscle. Med Sci Sports Exercise. (2011) 43(9):1619–25. doi: 10.1249/MSS.0b013e31821522d0
23. de Paula Simola RÁ, Harms N, Raeder C, Kellmann M, Meyer T, Pfeiffer M, et al. Tensiomyography reliability and prediction of changes in muscle force following heavy eccentric strength exercise using muscle mechanical properties. Sports Technol. (2015) 8(1–2):58–66. doi: 10.1080/19346182.2015.1117475
24. de Paula Simola RÁ, Raeder C, Wiewelhove T, Kellmann M, Meyer T, Pfeiffer M, et al. Muscle mechanical properties of strength and endurance athletes and changes after one week of intensive training. J Electromyogr Kinesiol. (2016) 30:73–80. doi: 10.1016/j.jelekin.2016.05.005
25. Cohen J. Statistical power analysis for the behavioral sciences. 2nd ed. Hoboken: Taylor and Francis. (1988).
26. Folland JP, Williams AG. The adaptations to strength training: morphological and neurological contributions to increased strength. Sports Med. (2007) 37(2):145–68. doi: 10.2165/00007256-200737020-00004
27. Gonyea WJ, Sale D. Physiology of weight-lifting exercise. Arch Phys Med Rehabil. (1982) 63(5):235–7. https://europepmc.org/article/med/7073463.7073463
28. Warneke K, Freund PA, Schiemann S. Long-lasting stretching induces muscle hypertrophy: a meta-analysis of animal studies. J Sci Sport Exerc. (2022b). doi: 10.1007/s42978-022-00191-z. https://www.ncbi.nlm.nih.gov/pmc/articles/PMC9174468/.
29. Tatsumi R. Mechano-biology of skeletal muscle hypertrophy and regeneration: possible mechanism of stretch-induced activation of resident myogenic stem cells. Anim Sci J. (2010) 81(1):11–20. doi: 10.1111/j.1740-0929.2009.00712.x
30. Tyganov S, Mirzoev T, Shenkman B. An anabolic signaling response of rat soleus muscle to eccentric contractions following hindlimb unloading: a potential role of stretch-activated Ion channels. Int J Mol Sci. (2019) 20(5):1165. doi: 10.3390/ijms20051165
31. Spangenburg EE, McBride TA. Inhibition of stretch-activated channels during eccentric muscle contraction attenuates p70S6K activation. J Appl Physiol. (2006) 100(1):129–35. doi: 10.1152/japplphysiol.00619.2005
32. Brentano MA, Martins Kruel LF. A review on strength exercise-induced muscle damage: applications, adaptation mechanisms and limitations. J Sports Med Phys Fitness. (2011) 51(1):1–10. https://pubmed.ncbi.nlm.nih.gov/21297557/.21297557
33. Schoenfeld BJ. The mechanisms of muscle hypertrophy and their application to resistance training. J Strength Cond Res. (2010) 24(10):2857–72. doi: 10.1519/JSC.0b013e3181e840f3
34. Baird MF, Graham SM, Baker JS, Bickerstaff GF. Creatine-kinase- and exercise-related muscle damage implications for muscle performance and recovery. J Nutr Metab. (2012) 2012:960363. doi: 10.1155/2012/960363
35. Giechaskiel B. Weight training and creatine kinase (CK) levels: a literature review. Int J Sci Res. (2020) 9(1):303–11. https://www.ijsr.net/archive/v9i1/ART20203985.pdf.
36. Nosaka K, Clarkson PM. Variability in serum creatine kinase response after eccentric exercise of the elbow flexors. Int J Sports Med. (1996) 17(2):120–7. doi: 10.1055/s-2007-972819
37. Totsuka M, Nakaji S, Suzuki K, Sugawara K, Sato K. Break point of serum creatine kinase release after endurance exercise. J Appl Physiol. (2002) 93(4):1280–6. doi: 10.1152/japplphysiol.01270.2001
38. Flann KL, LaStayo PC, McClain DA, Hazel M, Lindstedt SL. Muscle damage and muscle remodeling: no pain, no gain? J Exp Biol. (2011) 214(Pt 4):674–9. doi: 10.1242/jeb.050112
39. Panidi I, Bogdanis GC, Terzis G, Donti A, Konrad A, Gaspari V, et al. Muscle architectural and functional adaptations following 12-weeks of stretching in adolescent female athletes. Front Physiol. (2021) 12:701338. doi: 10.3389/fphys.2021.701338
40. Carlsson AM. Assessment of chronic pain. I. Aspects of the reliability and validity of the visual analogue scale. Pain. (1983) 16(1):87–101. doi: 10.1016/0304-3959(83)90088-X
41. Nakamura M, Sato S, Hiraizumi K, Kiyono R, Fukaya T, Nishishita S. Effects of static stretching programs performed at different volume-equated weekly frequencies on passive properties of muscle-tendon unit. J Biomech. (2020) 103:109670. doi: 10.1016/j.jbiomech.2020.109670
42. Ichihashi N, Umegaki H, Ikezoe T, Nakamura M, Nishishita S, Fujita K, et al. The effects of a 4-week static stretching programme on the individual muscles comprising the hamstrings. J Sports Sci. (2016) 34(23):2155–9. doi: 10.1080/02640414.2016.1172725
43. Weppler CH, Magnusson SP. Increasing muscle extensibility: a matter of increasing length or modifying sensation? Phys Ther. (2010) 90(3):438–49. doi: 10.2522/ptj.20090012
44. Støve MP, Hirata RP, Palsson TS. The tolerance to stretch is linked with endogenous modulation of pain. Scand J Pain. (2021) 21(2):355–63. doi: 10.1515/sjpain-2020-0010
45. Freitas SR, Mendes B, Le Sant G, Andrade RJ, Nordez A, Milanovic Z. Can chronic stretching change the muscle-tendon mechanical properties? A review. Scand J Med Sci Sports. (2018) 28(3):794–806. doi: 10.1111/sms.12957
46. McCully KK. The influence of passive stretch on muscle oxygen saturation. Adv Exp Med Biol. (2010) 662:317–22. doi: 10.1007/978-1-4419-1241-1_45
47. Warneke K, Keiner M, Lohmann LH, Brinkmann A, Hein A, Schiemann S, et al. Critical evaluation of commonly used methods to determine the concordance between sonography and magnetic resonance imaging: a comparative study. Front Imaging. (2022c) 1. doi: 10.3389/fimag.2022.1039721. https://www.frontiersin.org/articles/10.3389/fimag.2022.1039721/full.
Keywords: static stretching, maximal strength, hypertrophy, muscle damage, contraction time, muscle stiffness
Citation: Wohlann T, Warneke K, Hillebrecht M, Petersmann A, Ferrauti A and Schiemann S (2023) Effects of daily static stretch training over 6 weeks on maximal strength, muscle thickness, contraction properties, and flexibility. Front. Sports Act. Living 5:1139065. doi: 10.3389/fspor.2023.1139065
Received: 6 January 2023; Accepted: 6 March 2023;
Published: 17 April 2023.
Edited by:
Emiliano Cè, University of Milan, ItalyReviewed by:
Nikos Apostolopoulos, University of Toronto, Canada© 2023 Wohlann, Warneke, Hillebrecht, Petersmann, Ferrauti and Schiemann. This is an open-access article distributed under the terms of the Creative Commons Attribution License (CC BY). The use, distribution or reproduction in other forums is permitted, provided the original author(s) and the copyright owner(s) are credited and that the original publication in this journal is cited, in accordance with accepted academic practice. No use, distribution or reproduction is permitted which does not comply with these terms.
*Correspondence: Tim Wohlann dGltLndvaGxhbm5AdW9sLmRl
Specialty Section: This article was submitted to Exercise Physiology, a section of the journal Frontiers in Sports and Active Living
Disclaimer: All claims expressed in this article are solely those of the authors and do not necessarily represent those of their affiliated organizations, or those of the publisher, the editors and the reviewers. Any product that may be evaluated in this article or claim that may be made by its manufacturer is not guaranteed or endorsed by the publisher.
Research integrity at Frontiers
Learn more about the work of our research integrity team to safeguard the quality of each article we publish.