 Weijia Zhan
94% of researchers rate our articles as excellent or good
Learn more about the work of our research integrity team to safeguard the quality of each article we publish.
Find out more
ORIGINAL RESEARCH article
Front. Astron. Space Sci. , 11 March 2025
Sec. Space Physics
Volume 12 - 2025 | https://doi.org/10.3389/fspas.2025.1528624
This article is part of the Research Topic Uncertainty Quantification and Model Validation in Space Weather Modeling View all 5 articles
Introduction: The north-south difference, or interhemispheric asymmetry (IHA), in the ionosphere-thermosphere (IT) system serves as an indicator of the complex responses to various asymmetric factors between the Northern and Southern Hemispheres. While previous studies have documented IHA in multiple parameters—such as polar plasma convection, neutral wind, and field-aligned currents—little attention has been given to the asymmetric behaviors of uncertainties or variability in these parameters. A comprehensive study of these uncertainties could provide deeper insights into the impacts of source factors on the IT system.
Methods: In this study, we build upon prior work on quantifying uncertainties in the IT system using the Whole Atmosphere Model-Ionosphere-Plasmasphere Electrodynamics (WAM-IPE) simulations and a polynomial chaos expansion-based uncertainty quantification (UQ) framework. Our focus shifts to the IHA of uncertainties in the IT system. Specifically, we present the uncertainties of electron density, plasma drifts and neutral winds obtained by applying uncertainty representation and propagation methods to the WAM-IPE model under moderately quiet conditions.
Results and discussion: The estimated uncertainties exhibit clear north-south asymmetry in the mid-to-high-latitude regions, with the asymmetry sometimes reversing at different times. A prominent feature is that uncertainties in plasma density, plasma drifts, and neutral winds show larger enhancements or broader distributions in the Southern Hemisphere. Vertical variations of IHA in plasma density are also observed, with larger values at lower altitudes (250 km) across most universal and local times, and at 300 km in the Southern Hemisphere at specific local times. While north-south asymmetry in electron density, plasma drifts, and neutral winds at mid-to-high latitudes has been previously reported, this study is the first to reveal the asymmetric uncertainties in the mid-to-high-latitude ionosphere. We offer potential explanations for these distinctive features, although further theoretical analyses are necessary to understand the underlying mechanisms better.
Similarities of ionospheric phenomena between the north and south hemispheres have been reported to provide significant information in terms of the coupling of conjugate ionosphere regions connected through the magnetic fields (Weimer et al., 2023; Martinis et al., 2019). Asymmetries between the northern and southern hemispheres have also been reported to exist in cross polar cap potential, plasma convection, plasma density, conductivity, field-aligned current, Poynting flux, particle precipitation, Joule heating, neutral density and wind, and so on in the ionosphere-thermosphere system (IT) (Lu et al., 1994; Ercha et al., 2012; Förster and Cnossen, 2013; Chen et al., 2015; Förster and Haaland, 2015; Cnossen and Förster, 2016; Laundal et al., 2017; Laundal and Richmond, 2017; Streltsov, 2018; Jin and Xiong, 2020; Hatch et al., 2020; Knipp et al., 2021; Laundal et al., 2022; Hong et al., 2021; Hong et al., 2024; Kim et al., 2023; Smith et al., 2023; Chen et al., 2024; Wang et al., 2024; Yu et al., 2024). These asymmetries are suggested to result from several different factors such as magnetic field strength at conjugate points, seasons, offset between the magnetic and geographic grids, and the interaction between solar wind and Earth’s magnetic field. North-south asymmetry in solar wind and geomagnetic activity has also been reported (Nair and Nayar, 2008). IHA in the IT system has also been reported to be associated with sources from the lower atmosphere, such as tides, sudden stratospheric warming, and seismic waves (Xiong and Lühr, 2013; Liu et al., 2018; Stober et al., 2021; Meng et al., 2022; Gogoi et al., 2024). While previous studies focused on the statistical average or individual event, studies on the north-south asymmetry of uncertainty or variability in those parameters have not been done. With the advanced uncertainty quantification method developed in our previous study (Zhan et al., 2024), we have a chance to find the most sensitive regions in the IT system and the most important contributing factors. In this paper, we report the global distribution and temporal variation of uncertainties of plasma and neutral parameters as a follow-up to our previous paper. While in that paper, we focused on the equatorial and low-latitude regions, we will focus on the mid and high-latitude areas, and the north-south asymmetry or interhemispheric asymmetry (IHA) of parameters interest to the community in this study.
As mentioned above, north-south asymmetry comes from the geomagnetic field configuration, the strength of the geomagnetic field at conjugate points, the offset between magnetic pole and geographic poles, solar illumination over the two hemispheres (i.e., one in summer and one in winter), and the solar wind-magnetosphere interaction (Laundal et al., 2017; Laundal and Richmond, 2017; Laundal et al., 2022; Cnossen and Förster, 2016). It will be difficult to resolve the impacts of all these source factors on the IT system in one study. In this study, we will focus on a simulation study made by WAM-IPE on a specific day of 16 March 2013. Therefore, the asymmetry due to seasons or solar illumination will be minimized in the two hemispheres due to similar solar illumination. We can investigate in detail the impacts of solar wind and the interaction of solar wind and Earth’s magnetic field on the north-south asymmetry of ionospheric and thermospheric parameters. It has been reported that the direction of interplanetary magnetic field Bx, By component, will lead to asymmetries in particle precipitation and cross-polar cap potential (Chen et al., 2024, and references therein). To make the problem less complicated, IMF Bx and By are also set to fixed values. We will focus on the solar wind parameters of IMF Bz, solar wind velocity, and solar wind density and have a chance to reveal the most sensitive regions in terms of latitude, longitude, altitude, and times (universal time, local time) to the solar wind.
The paper is organized as follows. The second section briefly described the numerical experiments and the way to obtain uncertainties. The third section presents the results from two conjugate points and global coverage. The fourth section discusses some possible sources of the asymmetry, and the last section summarizes the main findings.
The ultimate goal of our project is to identify the most significant drivers, whether they originate from solar-magnetosphere interactions above or from disturbances caused by tides and waves of varying periods in the lower atmosphere. Through this process, we aim to identify the temporal and spatial distributions of uncertainties and variabilities in key parameters of the ionosphere-thermosphere (IT) system, pinpointing the most sensitive regions and times influenced by changing external drivers. Following this uncertainty quantification and sensitivity analysis, predictions of typical IT parameters can be streamlined by varying only the most critical drivers. Given the numerous input drivers of the WAM-IPE model, this study specifically focuses on solar wind drivers to simplify the analysis. Drivers from the lower atmosphere will be the focus of subsequent studies. In our previous paper (Zhan et al., 2024), we introduced in detail the WAM-IPE model, the polynomial chaos expansion-based UQ method and the numerical experiment we conducted. This paper is based on the same dataset obtained from the experiment, so we only give a brief introduction here and more details of methods can be found in Zhan et al. (2024).
The WAM-IPE model consists of two interconnected components: the Whole Atmosphere Model (WAM) and the Ionosphere-Plasmasphere Electrodynamics (IPE). WAM simulates the neutral atmospheric composition and dynamics, covering the region from the Earth’s surface up to approximately 500 km. The extent of the model depends on the solar flux conditions, capturing the interactions between the lower atmosphere and the upper thermosphere. IPE models the plasma dynamics and electrodynamics of the ionosphere and plasmasphere, extending to several Earth radii. It describes the transport of plasma along and perpendicular to magnetic field lines in 170 flux tubes, providing a detailed depiction of the coupled ionosphere-plasmasphere system (Hysell et al., 2022; Zhan et al., 2024).
In our numerical experiment, we focus on the uncertainty of ionosphere and thermosphere responses to varying solar wind drivers while keeping the lower atmosphere and solar activity constant (F10.7 = 120 solar flux unit). Using solar wind data from 1981 to 2021 obtained from OmniWeb, we build a variational autoencoder (VAE), resample the latent space, and generate solar wind parameters—including the interplanetary magnetic field north component (IMF Bz), solar wind speed, and solar wind density. Since we care more about the sensitivity of the IT system under quiet conditions (Kp
The output quantities of interest (QoIs), such as plasma density, plasma drifts, and neutral winds, are approximated by conducting Polynomial Chaos Expansion (PCE), where the polynomials are constructed using the samples drawn from the VAE’s latent space. After solving for the coefficient matrix or surrogate model, we can calculate the mean and variance of the QoIs and perform a sensitivity analysis based on this matrix. A brief introduction of the derivation of variance of a QoI
The polynomial basis is constructed according to the distribution of the input drivers. In our case, the distributions of solar wind drivers follow the Gaussian distribution, and the corresponding polynomial basis functions are of Hermite type. Trough solving the linear system in Equation 1 to obtain the coeffficient matrix
The obtained uncertainty of the electron density is the standard deviation of the logarithmic values. The data are in geographic coordinates with a resolution of 90 by 91 in longitude-latitude global grids. Due to the large cost of computing time and resources, we only select results from 3 typical altitudes of 250, 300, and 350 km which cover the F region bottom and F region and peak and from representative universal times. The uncertainties of plasma drifts and neutral winds are the standard deviations of the WAM-IPE outputs at 300 km.
In our previous paper (Zhan et al., 2024), we present the universal time and local time evolution of uncertainties of plasma density, plasma drifts, and neutral winds, and the focus was given to equatorial and low-latitude regions under varying solar wind conditions. In this study, we present the results, with a specific emphasis on the mid-and high-latitude regions. The results for the Northern and Southern Hemispheres are presented separately using a polar coordinate system.
To support our analysis, we include in Figure 1 the solar wind drivers—interplanetary magnetic field north component (IMF Bz), solar wind density, and solar wind speed—that were used to drive the WAM-IPE model. We summarize the main features of solar wind drivers as follows. The average IMF Bz exhibits weak positive (northward) values in two intervals between 00–08 UT and 14–00 UT and becomes around 0 between 08–14 UT and 20–00 UT. Solar wind density also exhibits enhancements and weakening in similar intervals to IMF Bz, while solar wind speed does not show obvious UT variation.
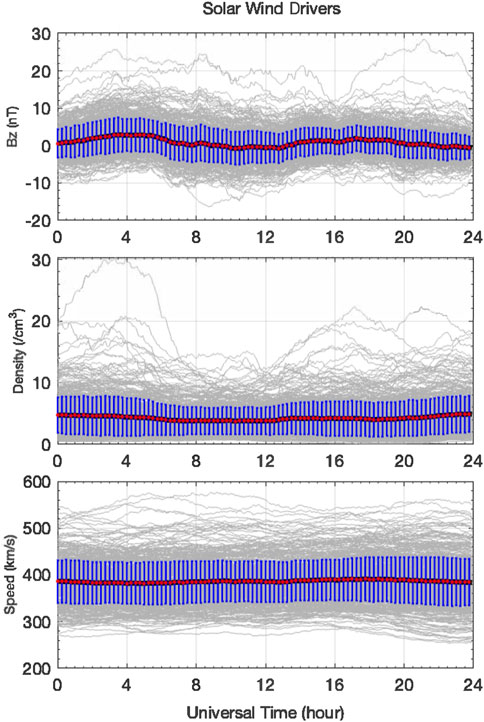
Figure 1. The input solar wind drivers—IMF Bz, solar wind density, and solar wind speed (from top to bottom)—as a function of universal time. The gray lines represent all sample drivers used to drive WAM-IPE and the red lines and blue error bars represent the averages and the corresponding 1 standard deviations of each driver.
In this section, we show the uncertainties of electron density, plasma drift, and neutral winds. Before we focus on the north-south asymmetry of the electron density uncertainty, we will first show its local time and geographic latitude dependence for 12 unique universal times (UTs) and 3 different altitudes. Uncertainties of electron density, plasma drift, and neutral wind from 4 typical UTs will be selected to show the north-south differences in detail.
We present the uncertainty of electron density from 3 altitudes (250, 300, and 350 km) as a function of geographic latitude and local time (UT + longitude/15) from 01 to 23 UT every 2 hours in Figure 2. The white lines correspond to the magnetic latitudes of
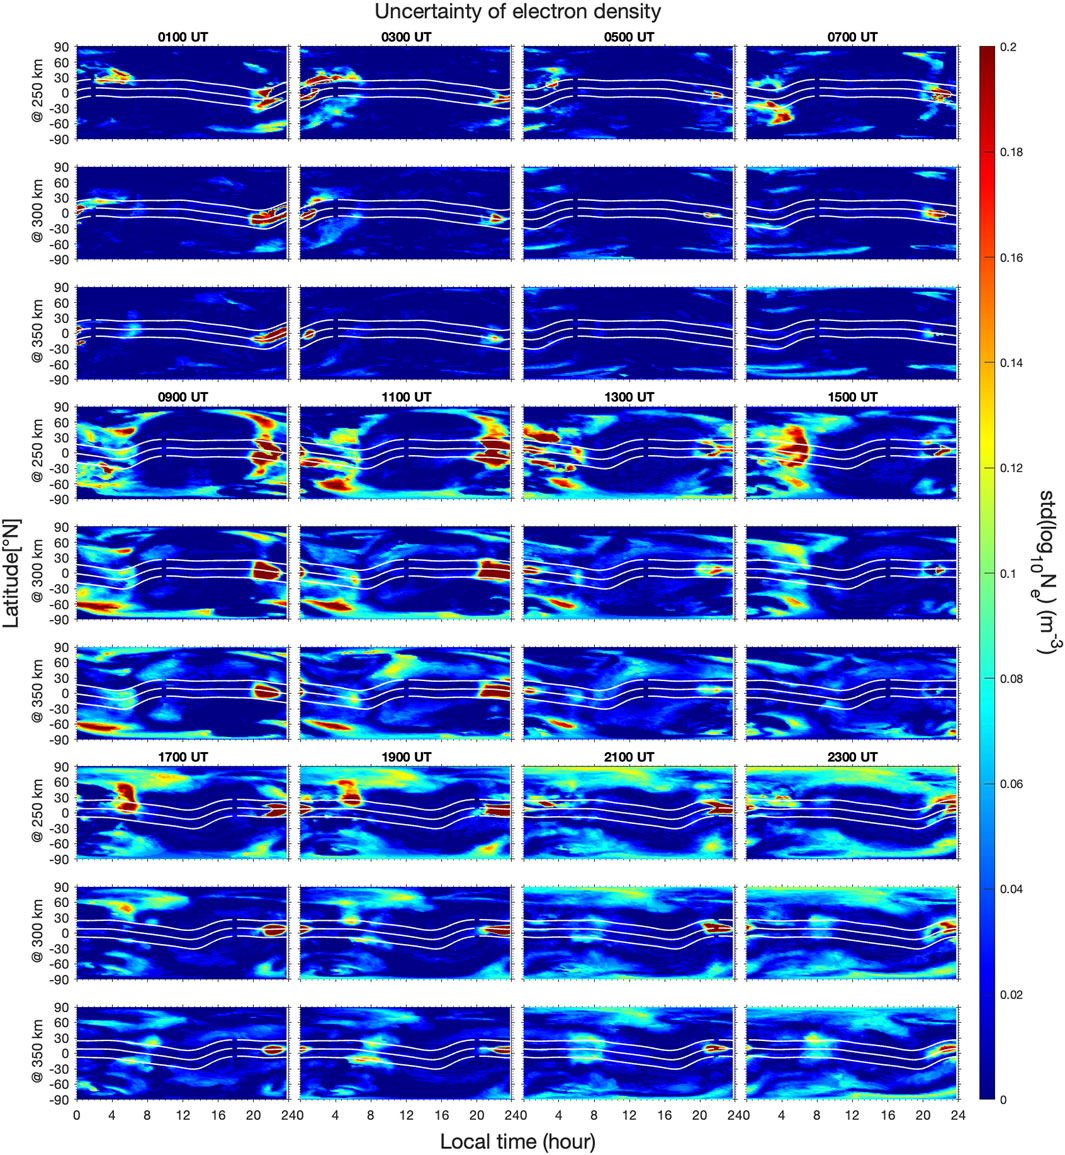
Figure 2. Uncertainty of electron density in logarithmic scale
Uncertainties in the equatorial and low latitude regions show some symmetry on both sides of the magnetic equator related to the equatorial ionization anomaly in the evening sector (Zhan et al., 2024) (i.e., 11 UT). However, the uncertainties at mid and high-latitude regions show strong asymmetrical patterns with different strengths or spatial-temporal coverages. For example, at 01 UT, the electron density uncertainty shows weakly enhanced values in the evening sector between
To better visualize the asymmetrical patterns in the polar regions of the northern and southern hemispheres, we present the uncertainty of electron density in polar coordinates as a function of local time (LT) from 3 altitudes (250, 300, and 350 km) between
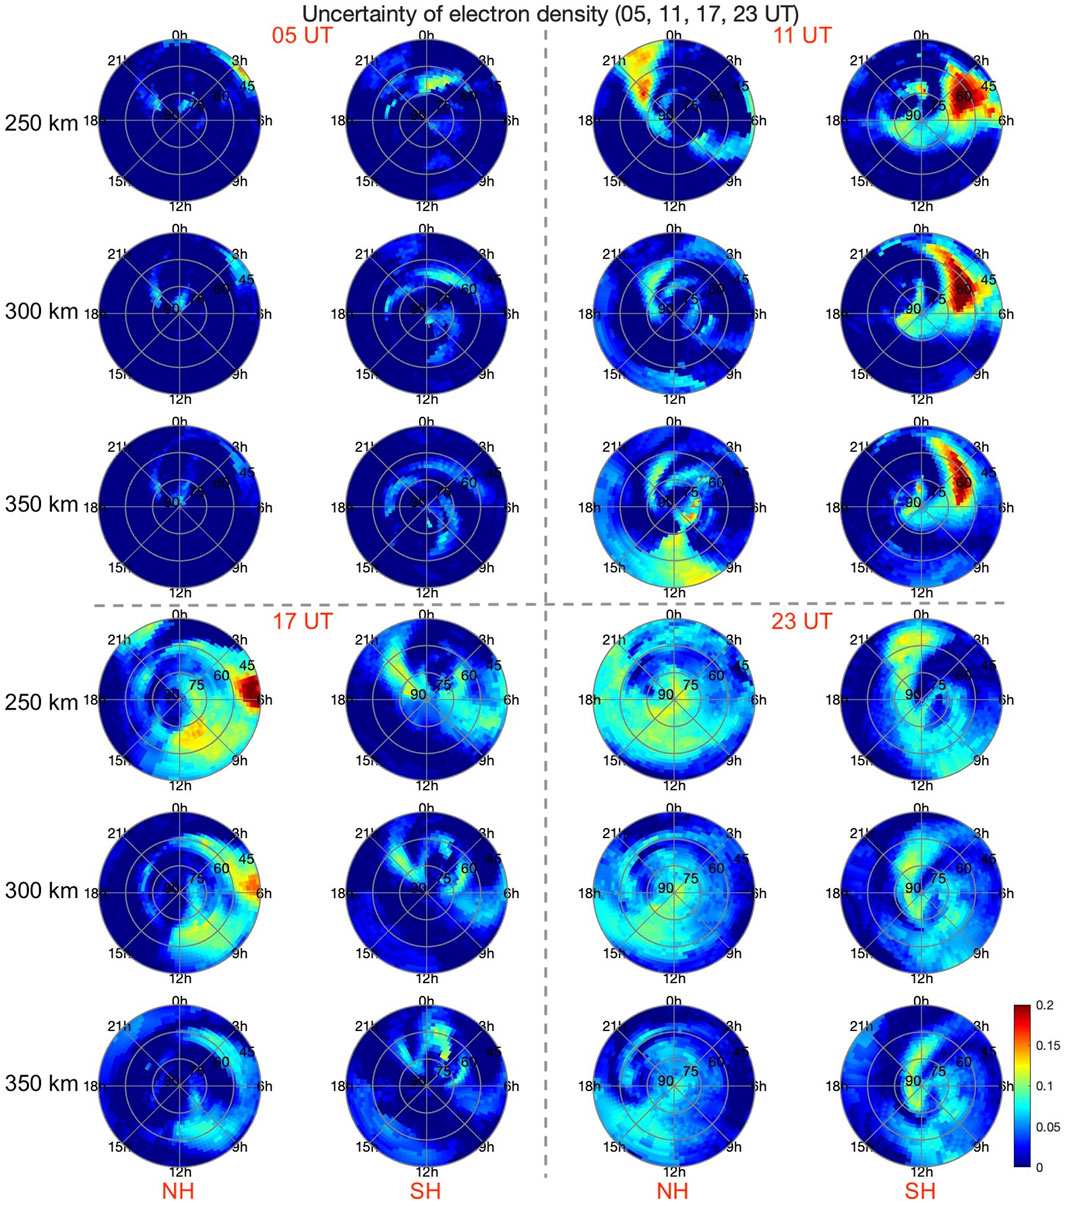
Figure 3. Universal time evolution of the electron density uncertainty
At 05 UT in the NH (top three rows in the first column), weak uncertainties are observed around 75°N and 19 LT, extending to lower latitudes with local time at an altitude of 250 km. This distribution exhibits vertical differences, with a faster-spreading speed at lower altitudes. Another region of weak uncertainties appears between 0 and 03 LT, showing slight latitudinal expansion at higher altitudes but no noticeable spreading with local time. In the SH (top three rows in the second column), moderate uncertainties at 250 km are observed between 60° and 75°S from 23 to 03 LT. At higher altitudes of 300 and 350 km, uncertainties decrease and are primarily seen in three regions: one beginning around 18 LT at 68°S and spreading to higher latitudes until midnight; another appearing around 21 LT at 65°S and spreading to lower latitudes until 06 LT; and a third region emerging near the geographic pole around 03 LT, spreading to lower latitudes until 12 LT. This distribution pattern differs from that observed in the Northern Hemisphere at the same altitude.
At 11 UT in the Northern Hemisphere (third column in the top row), strong uncertainties primarily appear in two regions: one beginning around 12 LT at 85°N and spreading to lower latitudes near 45°N until midnight, and another beginning around 07 LT at 45°N and spreading to higher latitudes near 75°N by around 09 LT. At higher altitudes, weak uncertainties are concentrated in three polar regions between 60° and 90°N: one beginning around 18 LT at 80°N and spreading to lower latitudes near 60°N until midnight; another beginning around 21 LT at 80°N and spreading to around 65°N by 03 LT; and a third region beginning around 03 LT, covering 75°to 85°N, and spreading to 10 LT. At 350 km, uncertainties in the third region become moderately enhanced. A larger region with moderate uncertainties also appears between 10 and 14 LT, spanning latitudes from 45° to 75°N.
In the SH (fourth column), uncertainties are primarily observed in three regions: one between 12 and 18 LT from 75° to 90°S, another around midnight from 70° to 90°S, with vertical variations, and a third region with significantly enhanced uncertainties between 00 and 09 LT, mainly between 45° and 75°S across all three altitudes. This distribution differs considerably from that in the Northern Hemisphere.
At 17 UT and 250 km in the NH (first column in the bottom row), strong uncertainties appear in the post-midnight sector between 45° and 60°N and between 09 and 12 LT, spanning latitudes from 45° to 75°N. At higher altitudes, these uncertainties weaken and appear in smaller regions. In the SH, uncertainties at 250 km are primarily concentrated in the evening sector around 21 LT, spanning 50°to 90°S and extending from 03 to 09 LT. As altitude increases, the regions with moderate uncertainty reduce in size, although uncertainties between 00 and 03 LT, from 50° to 75°S, become stronger at higher altitudes. This distribution pattern is markedly different from that in the Northern Hemisphere.
At 23 UT and 250 km in the NH (third column in the bottom row), moderate uncertainties appear across a broad region from 06 LT to 21 LT between 50° and 90°N, with slightly stronger uncertainties centered around 15 LT. At higher altitudes, this region contracts and centers more closely around 15 LT. In the SH, moderate uncertainties appear starting at 12 LT in the polar region between 75° and 90°S, extending to lower latitudes until 02 LT. This region of moderate uncertainties also contracts at higher altitudes. This distribution pattern differs from that observed in the Northern Hemisphere.
In Figure 4, we present the uncertainties of plasma drift at 300 km for 05, 11, 17, and 23 UT (from top to bottom), as plasma drift shows minimal vertical variation in the F region. The results for vertical and zonal drifts are displayed in the left and right columns, respectively. The NH results are shown in the first and third columns, while the SH results are in the second and fourth columns.
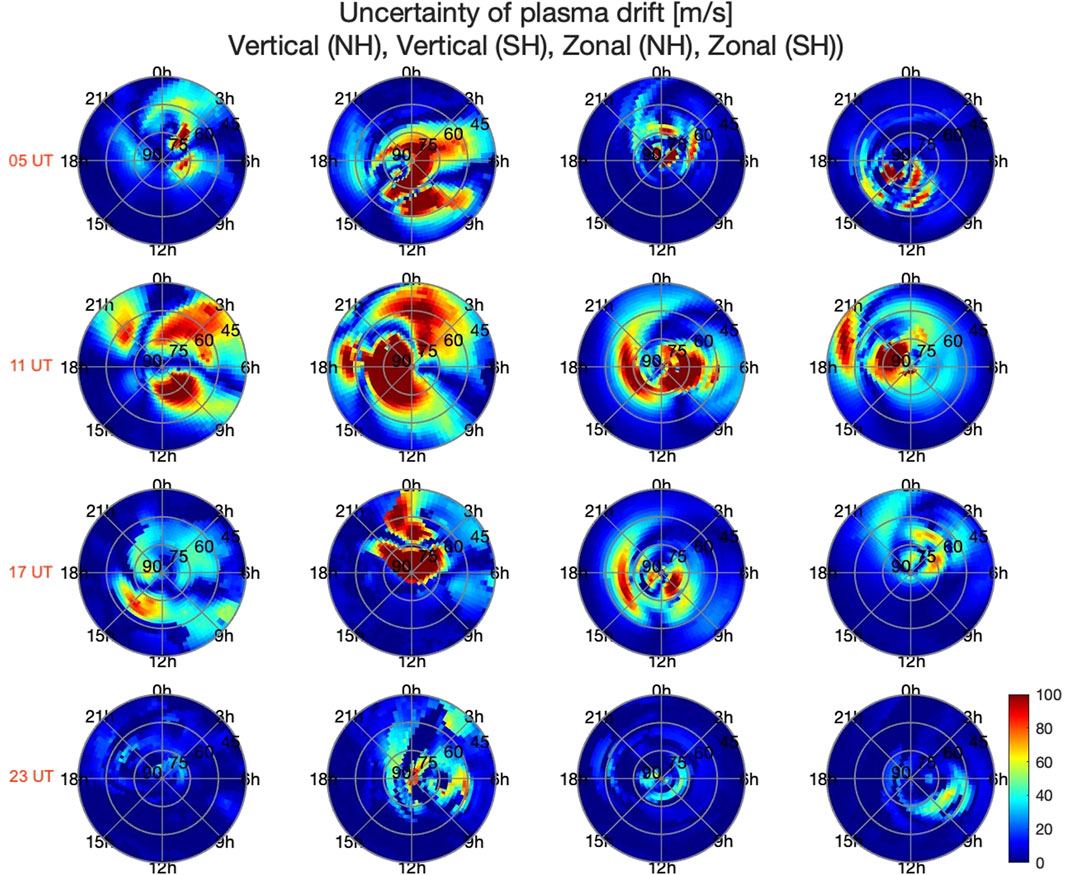
Figure 4. Uncertainty of vertical (left two columns) and zonal (right two columns) plasma drifts in the northern (first and third columns) and southern (second and fourth columns) hemispheres. The unit is m/s.
At 05 UT, vertical drifts in the NH show large uncertainties in the dawn sector, around 03 LT, and between 05 and 09 LT at latitudes between 70° and 85°N. In the SH, uncertainties appear over a much larger region, spanning 60°to 90°S, and extend to lower latitudes between 03 and 06 LT and again between 08 and 09 LT. For the zonal drift, large uncertainties in the NH primarily occur between 21 and 06 LT, appearing in four isolated small regions between 60° and 90°N. In the SH, large uncertainties are observed between 09 and 18 LT and in four isolated small regions between 60° and 90°S. Notably, the isolated small regions in both hemispheres exhibit similar patterns with a 12-hour difference in local time, which corresponds to the geographic longitude difference between the north and south magnetic poles.
At 11 UT, vertical drifts in the NH show large uncertainties across much larger regions compared to those at 05 UT. Significant uncertainties are observed between 20 and 23 LT at latitudes between 45° and 70°N; from 21 to 06 LT between 45° and 85°N, spreading to lower latitudes at later times; and from 07 to 15 LT, primarily between 60° and 85°N, with moderate uncertainties extending to lower latitudes between 07 and 09 LT. In the SH, large uncertainties are present in three regions: one from approximately 16–20 LT between 45° and 60°S; another from 09 LT to midnight, mainly between 60° and 90°S; and a third region starting around 21 LT between 50° and 60°S, extending to higher and lower latitudes until 06 LT.
For the zonal drift, large uncertainties also appear in three regions in the NH: one beginning around 12 LT between 65° and 80°N, extending to 02 LT near 50°N; a second centered around 06 LT between 65° and 90°N; and a third from 06 to 09 LT around 60°N. In the SH, large uncertainties appear in three regions as well: one between 15 LT and midnight from 65° to 90°S; another between 16 and 21 LT from 45° to 60°S; and a third from 00 to 03 LT around 75°S. The distribution patterns in the Northern and Southern Hemispheres exhibit a 12-h difference in local time.
At 17 UT, vertical drifts in the NH show moderate uncertainties primarily in three regions: between 12 and 18 LT from 60° to 75°N, between 15 and 23 LT from 70° to 90°N, and between 03 and 06 LT from 60° to 80°N. In the SH, much stronger uncertainties appear in the polar region from 75° to 90°S, with some extension to lower latitudes around 21 LT and from 03 to 06 LT. Additionally, large uncertainties appear around midnight between 45° and 75°S. For zonal drifts in the NH, large uncertainties are observed between 13 and 23 LT from 60° to 75°N, from 06 to 09 LT between 75° and 85°N, from 15 to 18 LT, and from 80° to 90°N. In the SH, zonal drifts exhibit moderate uncertainties from 00 to 06 LT between 60° and 90°S.
At 23 UT, in the NH, vertical drifts show very weak uncertainties in the polar region, while moderate uncertainties appear in the SH between 12 LT and midnight around 75°S, with a spread to lower latitudes at later times, between 03 and 09 LT from 60° to 75°S, and over the pole. For zonal drifts, moderate uncertainties are observed in the NH between 03 and 15 LT from 75° to 80°N and around 18 LT between 80° and 90°N. In the SH, moderate uncertainties appear between 06 and 12 LT, spreading from approximately 55°–75°S.
Figure 5 illustrates the uncertainty in zonal (left two columns) and meridional (right two columns) neutral winds at 05, 11, 17, and 23 UT (from top to bottom), similar to the plasma drift uncertainty shown in Figure 4. Please note the different color bar ranges.

Figure 5. The same as Figure 4 but for the uncertainty of neutral winds. The left two columns are for zonal winds and the right two columns are for meridional winds). The unit is m/s.
At 05 UT, zonal winds in the NH exhibit large uncertainties in isolated regions, particularly in the polar region between 75° and 90°N from 15 to 06 LT and around 60°N from 21 to 06 LT. In the SH, large uncertainties are observed in the polar region between 75° and 90°S from 03 to 18 LT, between 60° and 70°S from 08 to 13 LT, and again between 60° and 70°S from 14 LT to midnight. For meridional winds, large uncertainties in the NH spread across latitudes between 60° and 90°N around 21 LT and from 02 to 03 LT. In the SH, uncertainties spread across 60°to 90°S around 09 LT, from 12 to 15 LT, and from 14 LT to midnight.
At 11 UT, zonal winds in the NH show large uncertainties across all local time sectors between 60° and 90°N, with some extension to lower latitudes from 01 to 03 LT. Moderate uncertainties are also present around 06 LT between 45° and 60°N. In the SH, large uncertainties appear throughout the polar region across all local time sectors, with increased latitudinal coverage during nighttime. Additional large uncertainties are observed between 45° and 65°S from 16 to 00 LT, spreading to lower latitudes at later local times. For meridional winds, the NH shows large uncertainties in multiple isolated regions from 21 to 09 LT. In the SH, large uncertainties appear between 45° and 75°S from 15 to 21 LT, spreading to lower latitudes over time, and spread across 45°to 90°S from approximately 21 to 03 LT.
At 17 UT, zonal winds in the NH display large uncertainties across all local time sectors, mainly between 60° and 75°N from 12 LT to midnight and between 75° and 90°N from 21 to 12 LT. In the SH, large uncertainties occur between 45° and 90°S from 21 to 03 LT. For meridional winds, large uncertainties in the NH are present between 60° and 90°N from 03 to 09 LT, between 70° and 85°N from 09 to 14 LT, and between 75° and 90°N around 18 LT. In the SH, uncertainties mainly appear between 45° and 90°S from 21 to 00 LT and around 03 LT.
At 23 UT, zonal winds show weak uncertainties in both the NH and SH. In the NH, these weak uncertainties tend to appear at lower latitudes in the dusk sector, while in the SH, they tend to appear at lower latitudes in the dawn sector. For meridional winds, moderate uncertainties appear in very small regions in both hemispheres. Uncertainties are observed above 60°N around 03 LT in the NH and from 12 to 15 LT in the SH.
From the description, we observed the following: (1) all three parameters exhibit the largest uncertainties at 11 UT. In Figure 1, at 11 UT, the mean IMF Bz is around 0, indicating that more simulations are driven by southward Bz during this time; (2) at 11 UT, uncertainties in plasma density, plasma drifts, and neutral winds show greater enhancement or broader distribution in the latitude-local time plane in the SH; (3) uncertainties in plasma density (at 17 and 23 UT) and meridional winds (at 11 and 17 UT) show more latitudinal expansion in the SH compared to the NH; and (4) plasma density uncertainties are larger at 250 km than at higher altitudes.
These features suggest that while the direction of IMF Bz plays a primary role in determining the intensity of uncertainties, the north-south asymmetry also contributes to both the intensity and distribution of uncertainties. Additionally, the vertical variation in plasma density uncertainties highlights the significant influence of ion-neutral coupling, which is more pronounced at lower altitudes in the F region.
In this section, we present the local time evolution of uncertainties. Since large uncertainties primarily occur at night, we will focus on results for plasma density, plasma drifts, and neutral winds from 20 to 06 LT (20, 22, 00, 02, 04, and 06 LT).
In Figure 6, electron density uncertainties at three altitudes (250, 300, and 350 km) for both the Northern Hemisphere (NH) and Southern Hemisphere (SH) are shown as a function of longitude and latitude. The top, middle, and bottom sets of three rows display results for 20 LT (left two columns) and 22 LT (right two columns), 00 LT and 02 LT, and 04 LT and 06 LT, respectively.
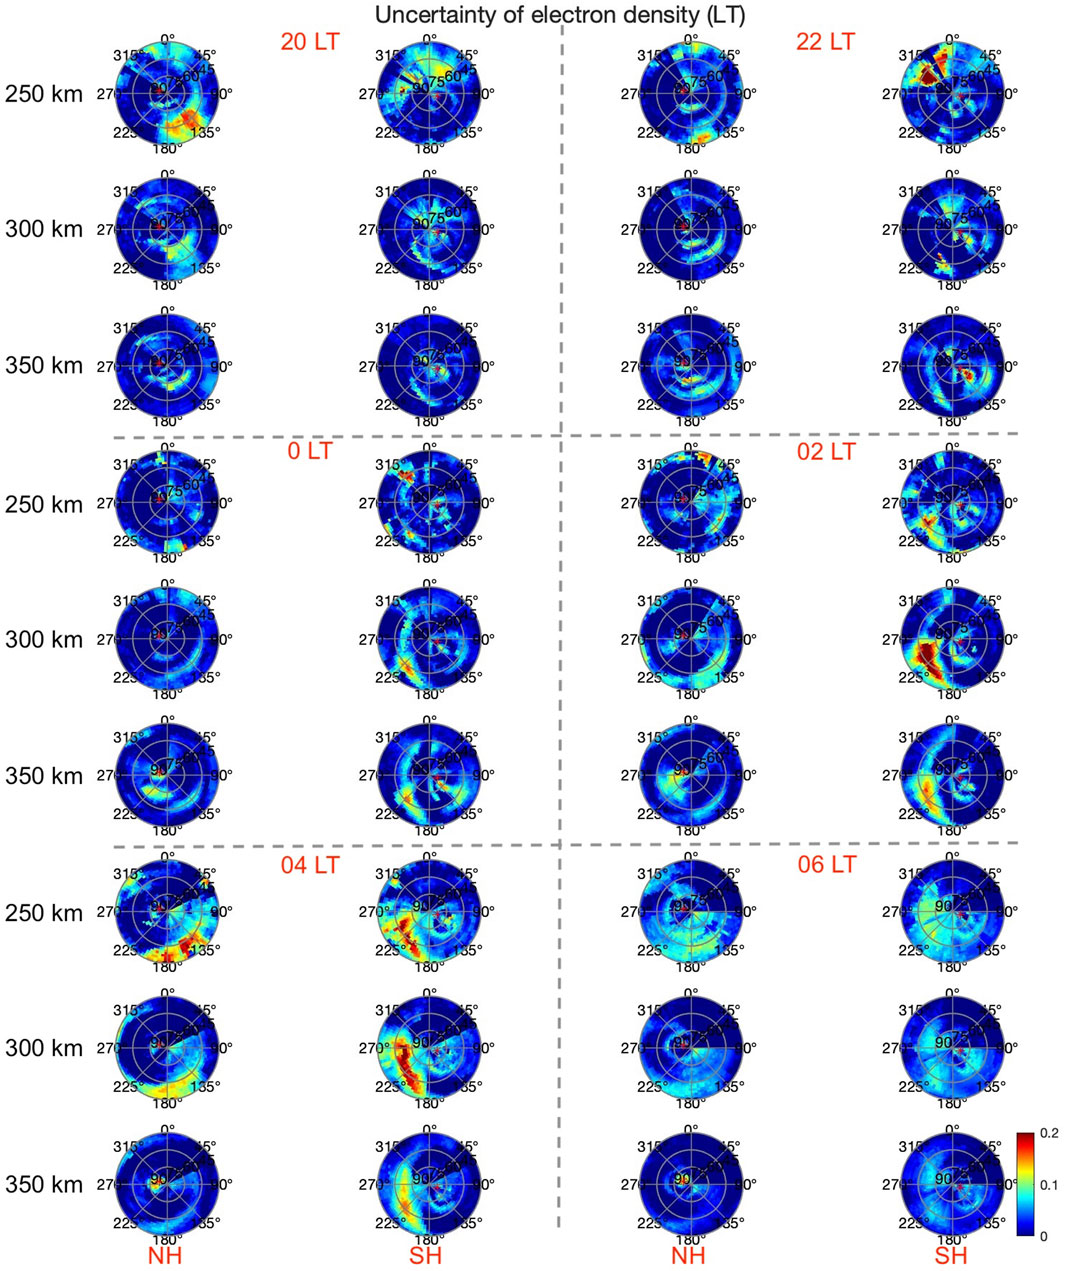
Figure 6. Uncertainty of electron density in logarithmic scale
In the NH, large uncertainties primarily appear between 135° and 180°E at 250 km and 20 LT, spanning latitudes from 45° to 75°N, and between 135° and 200°E from 45° to 60°N at 04 LT. In the SH, a clear pattern of local time evolution is observed in the uncertainties. At 20 LT, uncertainties between 180° and 225°E are weak and confined to a narrow latitude range. They become more pronounced at 00 LT, extending over a broader longitude range from 180° to 315°E. By 02 LT and 04 LT, uncertainties are strongly enhanced within this same longitude range, with additional spread in latitude.
In Figure 7, we present the uncertainties in vertical drift (left two columns) and zonal drift (right two columns) for the Northern Hemisphere (NH; first and third columns) and Southern Hemisphere (SH; second and fourth columns) as a function of longitude and latitude in a polar coordinate system, spanning local times from 20 to 06 LT from top to bottom.
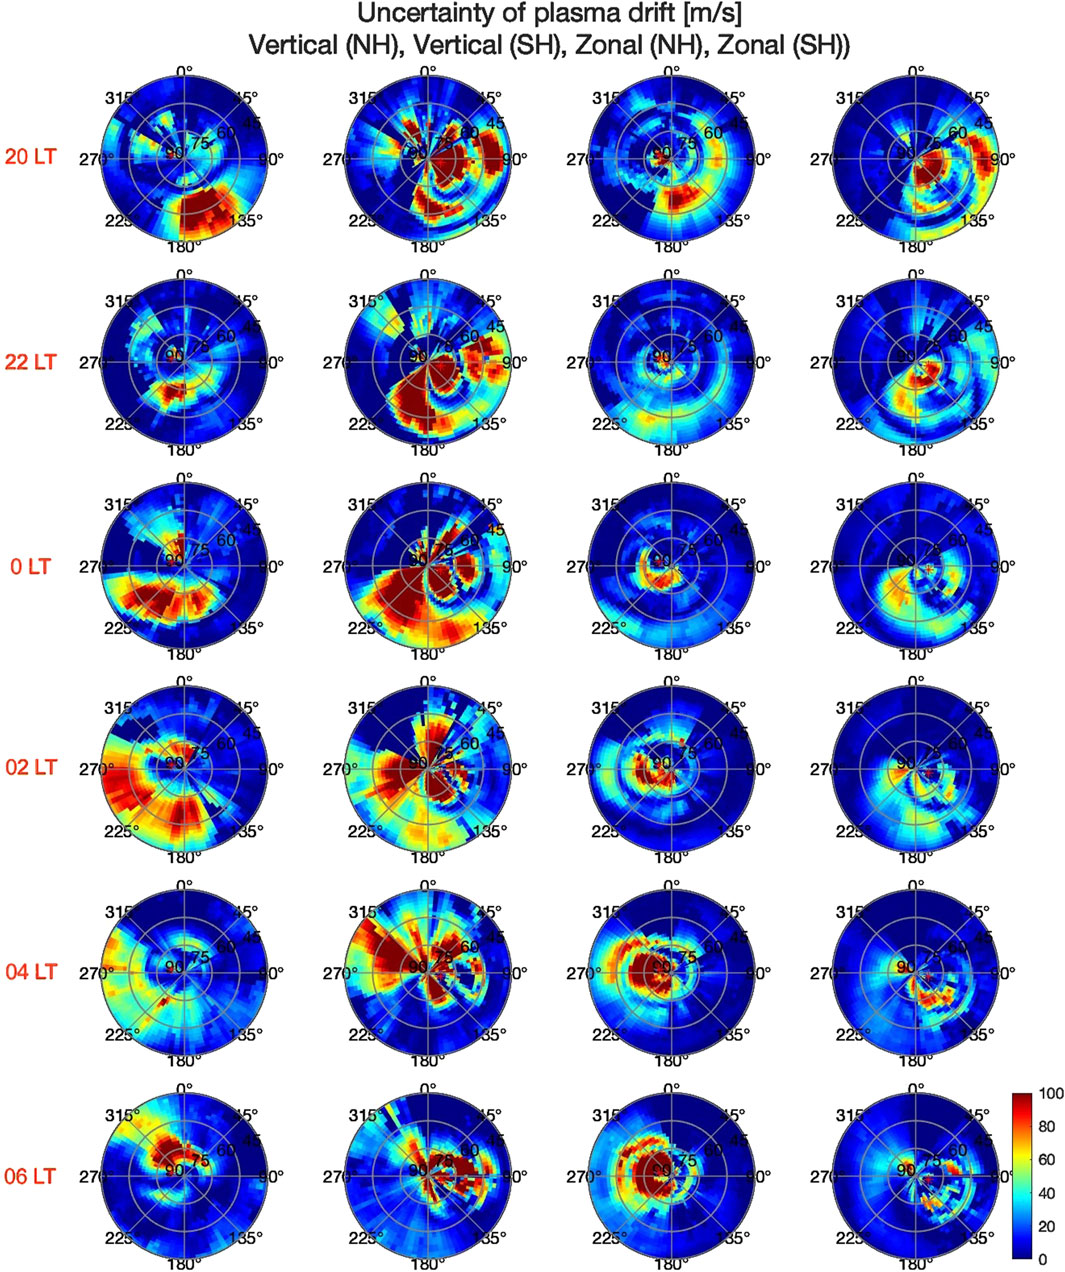
Figure 7. The same as Figure 6 but for the uncertainty of vertical (left two columns) and zonal drifts (right two columns). The 1st and 3rd columns are for the northern hemisphere, and the 2nd and 4th columns are for the SH. The unit is m/s.
In the NH, vertical drifts show large uncertainties between 135° and 200°E and from 45° to 70°N at 20 LT. This region contracts toward 75°N at 22 LT, expands to lower latitudes, and reaches 270°E at 00 LT. By 02 LT and 04 LT, it extends further to around 300°E, though with smaller uncertainties at 04 LT. At 06 LT, large uncertainties appear around 325°E, spanning from 45° to 90°N. In the SH, vertical drifts exhibit large uncertainties mainly between 60° and 90°E from 45° to 60°S, between 30° and 180°E above 65°S, and between 135° and 200°E from 60° to 75°S. These regions of large uncertainties persist at 22, 00, 02, and 04 LT, with slight spreads in longitude. Meanwhile, uncertainties between 315° and 45°E become more pronounced at 00 LT and continue to be evident at 06 LT.
For zonal drifts in the NH at 20 LT, large uncertainties appear between 60° and 75°N and from 135° to 200°E, with moderate uncertainties observed between 60° and 70°N from 30° to 135°E. At 22 LT, these uncertainties weaken. From 00 to 06 LT, the weak uncertainties in the polar region above 75°N intensify and spread to latitudes down to 60°N. In the SH, local time evolution is also evident. Large uncertainties between 90° and 180°E from 75° to 90°S weaken and contract to smaller regions over time. Moderate uncertainties were observed between 135° and 200°E around 60°S at 20 LT spread to a longitude range of 180°–225°E and extend poleward of 60°S by 22 LT. By 00 LT, they spread over a broader longitude range from 135° to 270°E. These uncertainties then weaken at 02 LT and become negligible at 04 and 06 LT.
We present the uncertainties of zonal and meridional winds from 6 different local times in Figure 8 similarly to plasma drifts. For zonal winds in the NH, large uncertainties appear in a latitude range between 60 and 75 °N and a longitude range between 0 and 180 E at 20 LT. This region spreads toward the east at 22 LT with slightly smaller uncertainties. It spreads to lower latitudes, toward the east, between 135 and 225 E at 0 LT, and disappears at later local times. At 0 LT, moderate uncertainties appear above 75 N between 90 and 225 E and become enhanced at 02, 04, and 06LT. In the SH, large uncertainties appear in the polar region above 75°S and between 90 and 180 E, as well as between 45 and 60°S and between 45 and 180 E. The uncertainties become weak at later local times.
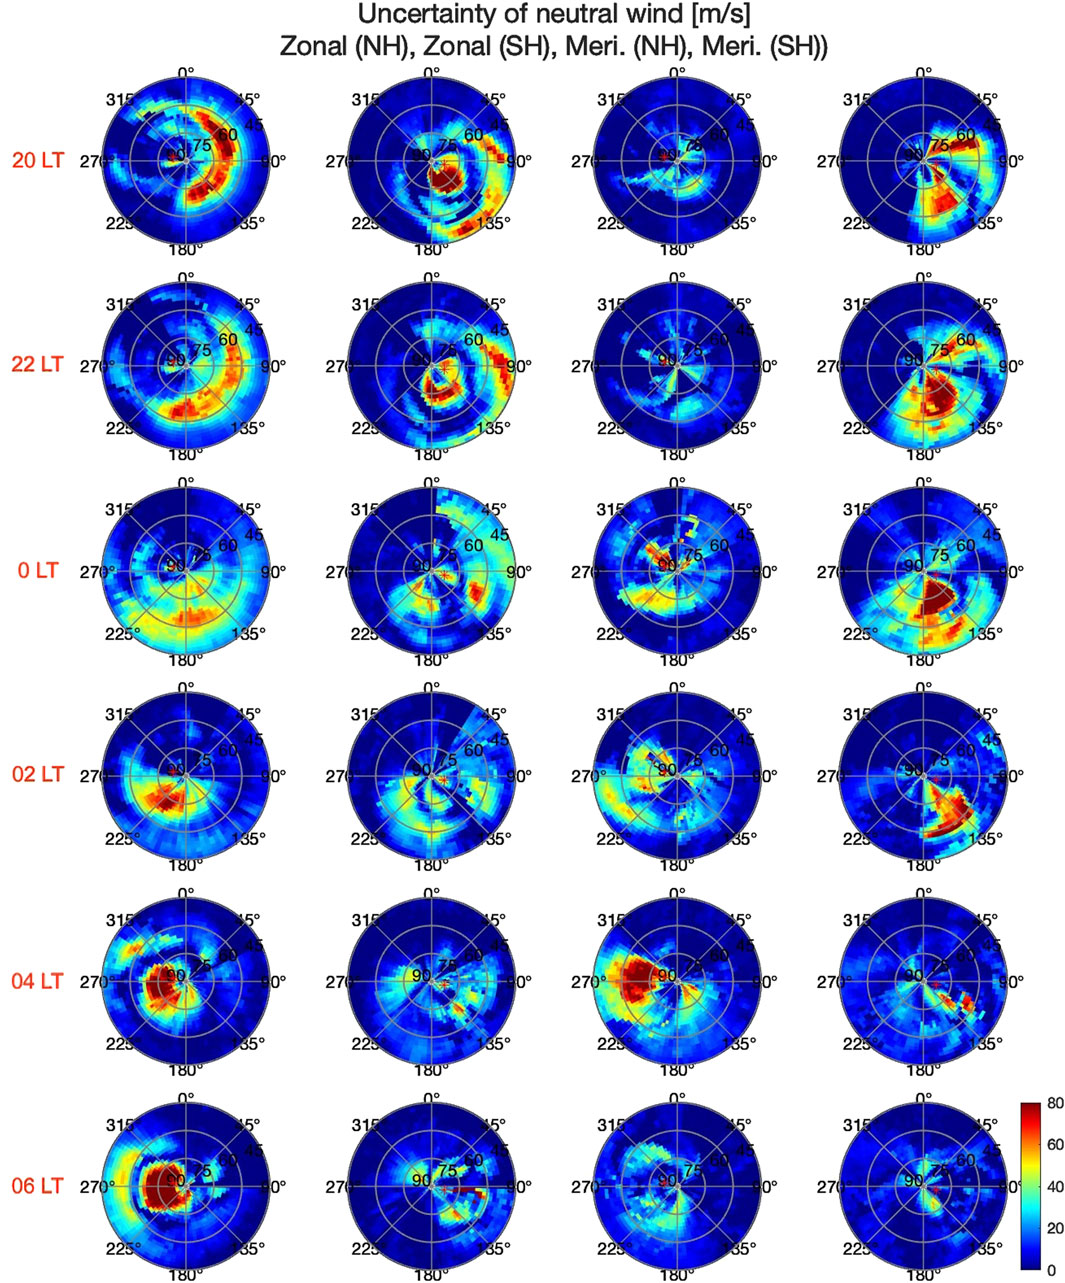
Figure 8. The same as Figure 7 but for the uncertainty of neutral winds. The left two columns are for zonal winds, and the right two columns are for meridional winds. The unit is m/s.).
For meridional winds, the uncertainty in the NH becomes enhanced mainly at 0 LT between 180 and 270 E between 60 and 75N, and the region with large uncertainties spreads toward the east at 02 and 04 LT. The uncertainty becomes weak at 06 LT. In the SH, large uncertainties appear between 45 and 90 E above 60°S and between 135 and 180 above 60°S. The large uncertainty still exists at 22 LT and contracts at 0 LT and 02 LT. The uncertainty becomes weak at 04 and 06 LT.
From the description above, we observed the following:
Plasma Density Uncertainty: In the SH, moderate plasma density uncertainties appear in a concentrated region near the magnetic south pole from 00 to 06 LT, while larger uncertainties are observed around 60°S, spreading eastward with local time from 20 to 04 LT. This behavior is not observed in the NH.
Altitude Dependence of Plasma Density Uncertainty: Unlike the NH, where larger plasma density uncertainties consistently appear at 250 km across all local times, the SH shows larger uncertainties at 300 km at 02 and 04 LT. This difference could result from thermospheric expansion at certain altitudes, leading to stronger ion-neutral coupling at 300 km.
Zonal Drift Uncertainty: In the NH, zonal drift uncertainties appear in a concentrated region around 75°N near the magnetic pole from 00 to 06 LT. In contrast, in the SH, these uncertainties are distributed across a more widespread region from 02 to 04 LT.
Vertical Plasma Drift Uncertainty: Vertical plasma drift uncertainties are observed in isolated regions, particularly in the SH. This feature, consistent with the UT evolution of uncertainties shown in Figure 4, is likely linked to variations in field-aligned currents and particle precipitation, which are closely tied to solar wind driver variability.
Zonal Neutral Winds: In the SH, zonal neutral wind uncertainties appear in a concentrated region near 75°S in the polar region at 20 and 22 LT, while in the NH, they appear at 04 and 06 LT. Meridional Neutral Winds: Enhanced meridional wind uncertainties are observed over more widespread regions, particularly in the SH.
In the section above, we reported the hemispheric and vertical differences of uncertainties of plasma and neutral parameters in the IT system. In this section, we intend to suggest some potential factors that could be associated with the hemispheric differences based on previous theoretical and observational studies. However, this paper does not aim to give a conclusive answer to the causes or to what degree these causes contribute to the hemispheric differences of uncertainties. Our study could provide insight into where and when the IT system is most sensitive to the solar wind drivers.
We showed that plasma density, plasma drift, and neutral wind uncertainties appear in a more broadened region in the SH as shown in Figures 3–5. This could result from the larger offset between the magnetic and geographic poles in the SH. It has been reported that the spatial variance of neutral winds is smaller in the NH due to the smaller offset (Cnossen and Förster, 2016). Cnossen and Förster (2016) further explained that forces acting on the neutral wind in a geographic reference frame, such as the pressure gradient force and Coriolis force, will be more closely aligned with forces acting in a magnetic reference frame, such as the ion drag force in the NH. It is the opposite in the SH. This factor could also explain the broadened region with large uncertainties in the SH we observed above. This could also explain that the plasma drift uncertainties in Figures 4, 7 and neutral wind uncertainties in Figures 5, 8 in the NH are mostly located in the auroral oval regions centered around the magnetic poles. In contrast, the uncertainties in the SH show distributions either cover the polar cap above the magnetic pole or spread across the polar cap and auroral oval.
We showed that the uncertainties of plasma density become more enhanced at 250 km at most UTs and LTs while plasma density uncertainty becomes more enhanced at 300 km at 02 and 04 LT. This vertical variation of plasma density uncertainty could be due to stronger ion-neutral coupling at 250 km. The large ion-neutral coupling could be associated with the larger neutral density at lower altitudes and the enhanced particle precipitation during disturbed conditions which is also more evident at lower altitudes. The expansion of the thermosphere during moderately disturbed conditions could push the sensitive region to higher altitudes, 300 km in our case.
The other reason for the hemispheric differences of plasma convection is suggested to be the different response times of the ionospheric conductivity to the magnetic reconnection, especially the nightside reconnection (Laundal et al., 2017). The IMF Bz direction exhibits large variation from one simulation to another as shown in Figure 1, we can expect this behavior will contribute to the different response times of conductivity in the polar ionosphere and to the IHA of plasma drift and neutral wind uncertainties. However, it is difficult to resolve how these different response times in the NH and SH contribute to the observed north-south differences in uncertainties in this study.
The study investigates interhemispheric asymmetries in the uncertainties within the ionosphere-thermosphere (IT) system, focusing on electron density, plasma drift, and neutral winds. The research uses WAM-IPE simulations and uncertainty quantification techniques to highlight significant differences in these uncertainties across hemispheres, varying by altitude, local time, and universal time. Key findings include:
Distinct variations in electron density uncertainties were observed across different altitudes (250, 300, and 350 km). Northern Hemisphere (NH) uncertainties exhibit an eastward spread and contraction over time, while Southern Hemisphere (SH) uncertainties show more stable yet progressively diminishing regional patterns.
Vertical plasma drift uncertainties differ in scale and location across hemispheres, with NH uncertainties initially appearing over specific longitudes and spreading eastward. In contrast, SH uncertainties are more widespread, showing only slight positional spreads over time. Zonal drift uncertainties in the NH concentrate at higher latitudes, intensifying around midnight, whereas SH uncertainties diminish gradually from initially larger regions.
Zonal wind uncertainties in the NH move eastward and tend to contract with time, while the SH exhibits large polar uncertainties that eventually weaken. Meridional winds follow a similar eastward spread in the NH, whereas SH uncertainties initially appear at specific latitudes and longitudes but reduce and contract by early morning.
NH uncertainties often spread eastward and contract as time progresses, while SH uncertainties tend to show persistent patterns that reduce gradually, exhibiting notable hemispheric differences that underscore asymmetries in the IT system responses to solar wind and geomagnetic forces.
We propose that the observed IHA in uncertainties—mainly characterized by larger values and a broader distribution in the SH—may result from the smaller offset between the magnetic and geographic poles in the NH compared to the SH. This smaller offset allows forces in the geographic reference frame to align more closely with those in the magnetic reference frame, leading to reduced spatial variance.
Another contributing factor could be differences in ion-neutral coupling between the NH and SH. For example, larger plasma density uncertainties are observed at 250 km across most UTs and LTs, whereas at 300 km, larger uncertainties are specifically evident at 02 and 04 LT. This variation in ion-neutral coupling may arise from two key processes: (1) a north-south asymmetry in solar wind-magnetosphere interactions, which results in differing plasma densities in the NH and SH due to variations in particle precipitation, and (2) disparities in neutral winds or tides between hemispheres, potentially driven by differences in the lower atmospheric conditions.
This study’s findings reveal critical patterns in interhemispheric asymmetry and variability within the IT system, highlighting how solar wind and geomagnetic field differences shape these asymmetries. The research provides a foundation for refining predictive models of space weather, emphasizing the importance of incorporating these uncertainties for improved modeling accuracy. As the first study to examine such variability, it opens avenues for further research to explore the mechanisms behind these asymmetries.
The datasets presented in this study can be found in online repositories. The names of the repository/repositories and accession number(s) can be found below: Zenodo, https://doi.org/10.5281/zenodo.10072266.
WZ: Writing–original draft, Writing–review and editing, Conceptualization, Data curation, Formal Analysis, Funding acquisition, Investigation, Methodology, Project administration, Resources, Software, Supervision, Validation, Visualization.
The author(s) declare that financial support was received for the research, authorship, and/or publication of this article. The works by WZ were supported through the National Science Foundation (NSF) SWQU AGS 2028032. We would like to acknowledge high-performance computing support from Cheyenne (https://doi.org/10.5065/D6RX99HX) provided by NCAR’s Computational and Information Systems Laboratory, sponsored by the National Science Foundation. We acknowledge the use of NASA/GSFC’s Space Physics Data Facility’s OMNIWeb (or CDAWeb or ftp) service, and OMNI data.
The authors declare that the research was conducted in the absence of any commercial or financial relationships that could be construed as a potential conflict of interest.
The authors declare that no Generative AI was used in the creation of this manuscript.
All claims expressed in this article are solely those of the authors and do not necessarily represent those of their affiliated organizations, or those of the publisher, the editors and the reviewers. Any product that may be evaluated in this article, or claim that may be made by its manufacturer, is not guaranteed or endorsed by the publisher.
Chen, Y., Liu, L., Le, H., Wan, W., and Zhang, H. (2015). Dusk-to-nighttime enhancement of mid-latitude NmF2 in local summer: inter-hemispheric asymmetry and solar activity dependence. Ann. Geophys. 33, 711–718. doi:10.5194/angeo-33-711-2015
Chen, Y.-J., Heelis, R., Hairston, M., and Valladares, C. (2024). The hemispheric difference in electric potential and electron precipitation observed by DMSP in the auroral zone. J. Geophys. Res. Space Phys. 129, e2023JA031733. doi:10.1029/2023JA031733
Cnossen, I., and Förster, M. (2016). North-south asymmetries in the polar thermosphere-ionosphere system: solar cycle and seasonal influences. J. Geophys. Res. Space Phys. 121, 612–627. doi:10.1002/2015JA021750
Ercha, A., Ridley, A. J., Zhang, D., and Xiao, Z. (2012). Analyzing the hemispheric asymmetry in the thermospheric density response to geomagnetic storms. J. Geophys. Res. Space Phys. 117, 2011JA017259. doi:10.1029/2011JA017259
Förster, M., and Cnossen, I. (2013). Upper atmosphere differences between northern and southern high latitudes: the role of magnetic field asymmetry. J. Geophys. Res. Space Phys. 118, 5951–5966. doi:10.1002/jgra.50554
Förster, M., and Haaland, S. (2015). Interhemispheric differences in ionospheric convection: cluster EDI observations revisited. J. Geophys. Res. Space Phys. 120, 5805–5823. doi:10.1002/2014JA020774
Gogoi, J., Bhuyan, K., Kalita, B. R., and Vaishnav, R. (2024). Conjugate hemispheric response of Earth’s ionosphere due to 2019 antarctic minor sudden stratospheric warming (SSW): comparison with 2013 arctic major SSW. Adv. Space Res. 73, 2999–3013. doi:10.1016/j.asr.2023.12.031
Hatch, S. M., Haaland, S., Laundal, K. M., Moretto, T., Yau, A. W., Bjoland, L., et al. (2020). Seasonal and hemispheric asymmetries of F region polar cap plasma density: swarm and CHAMP observations. J. Geophys. Res. Space Phys. 125, e2020JA028084. doi:10.1029/2020JA028084
Hong, Y., Deng, Y., Maute, A., Lu, G., Zhu, Q., Waters, C., et al. (2024). Relative contributions of field-aligned currents and particle precipitation to inter-hemispheric asymmetry at high latitudes during the 2015 St. Patrick’s day storm. J. Geophys. Res. Space Phys. 129, e2023JA032279. doi:10.1029/2023JA032279
Hong, Y., Deng, Y., Zhu, Q., Maute, A., Sheng, C., Welling, D., et al. (2021). Impacts of different causes on the inter-hemispheric asymmetry of ionosphere-thermosphere system at mid- and high-latitudes: GITM simulations. Space weather. 19, e2021SW002856. doi:10.1029/2021SW002856
Hysell, D. L., Fang, T. W., and Fuller-Rowell, T. J. (2022). Modeling equatorial F-region ionospheric instability using a regional ionospheric irregularity model and WAM-IPE. J. Geophys. Res. Space Phys. 127, e2022JA030513. doi:10.1029/2022JA030513
Jin, Y., and Xiong, C. (2020). Interhemispheric asymmetry of large-scale electron density gradients in the polar cap ionosphere: UT and seasonal variations. J. Geophys. Res. Space Phys. 125, e2019JA027601. doi:10.1029/2019JA027601
Kim, E., Jee, G., Wang, W., Kwak, Y.-S., Shim, J.-S., Ham, Y.-B., et al. (2023). Hemispheric asymmetry of the polar ionospheric density investigated by ESR and JVD radar observations and TIEGCM simulations for the solar minimum period. J. Geophys. Res. Space Phys. 128, e2022JA031126. doi:10.1029/2022JA031126
Knipp, D., Kilcommons, L., Hairston, M., and Coley, W. R. (2021). Hemispheric asymmetries in poynting flux derived from DMSP spacecraft. Geophys. Res. Lett. 48, e2021GL094781. doi:10.1029/2021GL094781
Laundal, K. M., Cnossen, I., Milan, S. E., Haaland, S. E., Coxon, J., Pedatella, N. M., et al. (2017). North–south asymmetries in Earth’s magnetic field. Space Sci. Rev. 206, 225–257. doi:10.1007/s11214-016-0273-0
Laundal, K. M., Madelaire, M., Ohma, A., Reistad, J., and Hatch, S. (2022). The relationship between interhemispheric asymmetries in polar ionospheric convection and the magnetic field line footpoint displacement field. Front. Astronomy Space Sci. 9. doi:10.3389/fspas.2022.957223
Laundal, K. M., and Richmond, A. D. (2017). Magnetic coordinate systems. Space Sci. Rev. 206, 27–59. doi:10.1007/s11214-016-0275-y
Liu, M., Zhang, X.-X., He, F., and Wang, W. (2018). Hemispheric asymmetry of the vertical ion drifts at dawn observed by DMSP. J. Geophys. Res. Space Phys. 123 (10), 213. doi:10.1029/2018JA025733
Lu, G., Richmond, A. D., Emery, B. A., Reiff, P. H., de la Beaujardière, O., Rich, F. J., et al. (1994). Interhemispheric asymmetry of the high-latitude ionospheric convection pattern. J. Geophys. Res. Space Phys. 99, 6491–6510. doi:10.1029/93JA03441
Martinis, C., Baumgardner, J., Mendillo, M., Wroten, J., MacDonald, T., Kosch, M., et al. (2019). First conjugate observations of medium-scale traveling ionospheric disturbances (MSTIDs) in the europe-africa longitude sector. J. Geophys. Res. Space Phys. 124, 2213–2222. doi:10.1029/2018JA026018
Meng, X., Ravanelli, M., Komjathy, A., and Verkhoglyadova, O. P. (2022). On the north-south asymmetry of co-seismic ionospheric disturbances during the 16 september 2015 illapel m8.3 earthquake. Geophys. Res. Lett. 49, e2022GL098090. doi:10.1029/2022GL098090
Nair, V. S., and Nayar, S. R. (2008). North-south asymmetry in solar wind and geomagnetic activity and its solar cycle evolution. Indian J. Radio Space Phys. 37, 391–395.
Smith, A. R., Ozturk, D. S., Delamere, P., Lu, G., and Kim, H. (2023). Investigating the interhemispheric asymmetry in Joule heating during the 2013 St. Patrick’s day geomagnetic storm. Space weather. 21, e2023SW003523. doi:10.1029/2023SW003523
Stober, G., Kuchar, A., Pokhotelov, D., Liu, H., Liu, H.-L., Schmidt, H., et al. (2021). Interhemispheric differences of mesosphere–lower thermosphere winds and tides investigated from three whole-atmosphere models and meteor radar observations. Atmos. Chem. Phys. 21, 13855–13902. doi:10.5194/acp-21-13855-2021
Streltsov, A. V. (2018). On the asymmetry between upward and downward field-aligned currents interacting with the ionosphere. J. Geophys. Res. Space Phys. 123, 9275–9285. doi:10.1029/2018JA025826
Wang, H., Cheng, Q., Lühr, H., Zhong, Y., Zhang, K., and Xia, H. (2024). Local time and hemispheric asymmetries of field-aligned currents and polar electrojet during may 2024 superstorm periods. J. Geophys. Res. Space Phys. 129, e2024JA033020. doi:10.1029/2024JA033020
Weimer, D. R., Clauer, C. R., Xu, Z., Coyle, S., and Hartinger, M. D. (2023). Magnetic field observations on interhemispheric conjugate chains. Earth Space Sci. 10, e2023EA003046. doi:10.1029/2023EA003046
Xiong, C., and Lühr, H. (2013). Nonmigrating tidal signatures in the magnitude and the inter-hemispheric asymmetry of the equatorial ionization anomaly. Ann. Geophys. 31, 1115–1130. doi:10.5194/angeo-31-1115-2013
Yu, C., Zhang, X.-X., Wang, W., and He, F. (2024). Hemispheric asymmetry of ionospheric poynting flux during geomagnetically quiet periods. J. Geophys. Res. Space Phys. 129, e2024JA032519. doi:10.1029/2024JA032519
Keywords: WAM-IPE, uncertainty quantification, ionosphere-thermosphere, solar wind, inter-hemispheric asymmetry
Citation: Zhan W (2025) Interhemispheric asymmetry of uncertainties in the ionosphere-thermosphere system . Front. Astron. Space Sci. 12:1528624. doi: 10.3389/fspas.2025.1528624
Received: 15 November 2024; Accepted: 20 February 2025;
Published: 11 March 2025.
Edited by:
Nithin Sivadas, National Aeronautics and Space Administration, United StatesReviewed by:
Agnit Mukhopadhyay, MathWorks, United StatesCopyright © 2025 Zhan. This is an open-access article distributed under the terms of the Creative Commons Attribution License (CC BY). The use, distribution or reproduction in other forums is permitted, provided the original author(s) and the copyright owner(s) are credited and that the original publication in this journal is cited, in accordance with accepted academic practice. No use, distribution or reproduction is permitted which does not comply with these terms.
*Correspondence: Weijia Zhan, d2VpamlhLnpoYW5AY29sb3JhZG8uZWR1
Disclaimer: All claims expressed in this article are solely those of the authors and do not necessarily represent those of their affiliated organizations, or those of the publisher, the editors and the reviewers. Any product that may be evaluated in this article or claim that may be made by its manufacturer is not guaranteed or endorsed by the publisher.
Research integrity at Frontiers
Learn more about the work of our research integrity team to safeguard the quality of each article we publish.