 Denny M. Oliveira
 Eftyhia Zesta
 Dibyendu Nandy
- 1Goddard Planetary Heliophysics Institute, University of Maryland, Baltimore, MD, United States
- 2Geospace Physics Laboratory, NASA Goddard Space Flight Center, Greenbelt, MD, United States
- 3Department of Physical Sciences, Indian Institute of Science Education and Research Kolkata, Kolkata, India
- 4Center of Excellence in Space Sciences India, Indian Institute of Science Education and Research Kolkata, Kolkata, India
In this short communication, we qualitatively analyze possible effects of the 10 October 2024 geomagnetic storm on accelerating the reentry of a Starlink satellite from very low-Earth orbit (VLEO). The storm took place near the maximum of solar cycle (SC) 25, which has shown to be more intense than SC24. Based on preliminary geomagnetic indices, the 10 October 2024, along with the 10 May 2024, were the most intense events since the well-known Halloween storms of October/November 2003. By looking at a preliminary version of the Dst index and altitudes along with velocities extracted from two-line element (TLE) data of the Starlink-1089 (SL-1089) satellite, we observe a possible connection between storm main phase onset and a sharp decay of SL-1089. The satellite was predicted to reenter on 22 October, but it reentered on 12 October, 10 days before schedule. The sharp altitude decay of SL-1089 revealed by TLE data coincides with the storm main phase onset. We compare the deorbiting altitudes of another three satellites during different geomagnetic conditions and observe that the day difference between actual and predicted reentries increases for periods with higher geomagnetic activity. Therefore, we call for future research to establish the eventual causal relationship between storm occurrence and satellite orbital decay. As predicted by previous works, SC25 is already producing extreme geomagnetic storms with unprecedented satellite orbital drag effects and consequences for current megaconstellations in VLEO.
1 Introduction
Intense solar wind perturbations, such as coronal mass ejections (CMEs), can greatly disturb the Earth’s magnetic field due to the occurrence of geomagnetic storms (Akasofu, 1966; Gonzalez et al., 1994). Geomagnetic storms are global phenomena characterized by intense magnetospheric energy input into the ionosphere-thermosphere (IT) system. During active times, the primary energy sources that heat the atmosphere are Joule heating and particle precipitation (Knipp et al., 2004; Prölss, 2011). Such magnetospheric energy primarily leads the thermosphere to heat and upwell globally driving the propagation of large-scale gravity waves and atmospheric wind surges (Bruinsma and Forbes, 2007; Prölss, 2011; Emmert, 2015). The atmosphere first responds to energy input at high latitudes within minutes of the storm main phase onset (Shi et al., 2017), whereas it responds globally
SpaceX is a private company that has recently launched thousands of satellites into LEO. That satellite megaconstellation is named Starlink, with the primary goal to provide internet service worldwide (Ren et al., 2022). One of the most recent examples of storm-time satellite orbital drag effects experienced in LEO is provided by Starlink satellites. According to Hapgood et al. (2022), 49 Starlink satellites were deployed on 3 February 2022 while a weak geomagnetic storm, classified as a G1 event, was raging on. As a result, 38 satellites did not make it to their intended altitude due to storm effects. Prior to early February 2022, SpaceX launched their satellites to very-low Earth orbit (VLEO) altitudes near 210 km where electric thrusters were turned on to uplift the satellite to operational altitudes around 500 km (Hapgood et al., 2022). However, the satellites typically perform a few orbits before being lifted up, but the environment was quite perturbed due to the minor geomagnetic storm occurrence (Dang et al., 2022; Fang et al., 2022; Berger et al., 2023).
If a weak geomagnetic storm can bring down satellites from VLEO, what can an extreme event do? In this short communication, we briefly discuss possible effects of the extreme geomagnetic storm of 10 October 2024 on forcing the premature reentry of a Starlink satellite, and compare it with the reentries of three other Starlink satellites during periods of less intense geomagnetic activity. Although our observations were performed with preliminary versions of and limited data sets, it is very likely that the storm cut short the reentry process of the satellite. However, solid causal relationships can only be achieved with further investigations using multi-data sets and conduction of numerical/empirical simulations. As predicted before, solar activity is increasing in the current solar cycle and they are already impacting satellite orbits in VLEO, as recently shown by Starlink satellites.
2 Data
We use OMNI IMF (interplanetary magnetic field) and selected solar wind parameter data, along with SYM-H geomagnetic index data, for the period 10–11 October 2024. Both OMNI and SYM-H data have resolution of 1 min (King and Papitashvili, 2005; Iyemori, 1990).
Geomagnetic activity is also represented by long-term 1-h Dst indices (Sugiura, 1964). Although with different resolutions, both Dst and SYM-H are frequently used to expresses ring current activity and geomagnetic storm intensities (Wanliss and Showalter, 2006). According to the World Data Center for Geomagnetism, Kyoto et al. (2015), final versions of the Dst index are only available from 1957 to 2020, whereas a provisional version of the index is available from 2021 to 2023. The 2024 version of the index is termed real-time/quick-look index. The key difference between the provisional Dst index and the real-time Dst index is that the provisional index is a more accurate representation of geomagnetic activity because it undergoes additional quality checks and manual corrections for data errors, while the real-time Dst is a quicker, less refined measurement used for immediate monitoring and forecasting, potentially containing inaccuracies due to unverified raw data. For these reasons, World Data Center for Geomagnetism, Kyoto et al. (2015), recommends use of real-time (quick-look) Dst data only for forecasting, diagnostic, and monitoring purposes (https://wdc.kugi.kyoto-u.ac.jp/dst_realtime/index.html).
For specification of satellites’ orbital parameters represented by altitudes and velocities, we use Two-Line Element (TLE) data provided by the U.S. Space Force. TLE is a standardized format used to describe a satellite’s orbital parameters, containing all the necessary information to calculate its position in space at a given time, presented in two lines of text. Each character in the file represents a specific orbital element like inclination, eccentricity, and mean anomaly, allowing for easy data exchange and prediction of a satellite’s future path (e.g., Kizner and Belotserkovskiy, 2005). Altitudes and velocities are extracted from TLE data with the pyephem Python package (https://pypi.org/project/pyephem/). pyephem extracts satellite orbital parameters from TLE files based on physical principles of orbital mechanics, particularly Kepler’s laws of planetary motion. The package then uses numerical methods to propagate the satellite’s position over time, accounting for perturbative effects like gravitational anomalies, drag, and radiation pressure. This enables the accurate prediction of the satellite’s trajectory and position at any given time based on the initial conditions provided in the TLE data (Rhodes, 2010). Satellite velocities are calculated from coverting the satellite’s position from geodetic to cartesian coordinates, where
3 Observations
A CME associated with an X1.8 solar flare was observed by Solar and Heliospheric Observatory (SOHO) to be ejected from active region AR3848 on 9 October 2024 at 0212 UT (https://kauai.ccmc.gsfc.nasa.gov/CMEscoreboard/prediction/detail/3670). This particular CME impacted Earth on 10 October 2024 at around 1500 UT. Thus, the average speed of the CME on its way to 1 AU was
The IMF
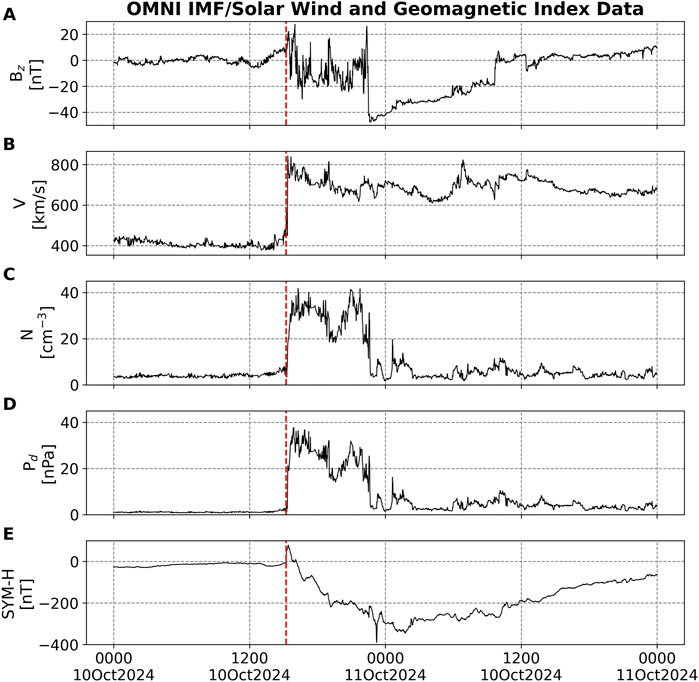
Figure 1. OMNI interplanetary magnetic field (IMF) and solar wind parameter profiles along with geomagnetic index data for the period 10–11 October 2024. (A): IMF
Unusually low-latitude auroras were seen during 10-11 October 2024. According to aurorasaurus.org, preliminary results show that the most equatorward observation of the aurora took place in the northern hemisphere near Jerome, Florida (N25
Altitudes and velocities for the satellites and Dst data are shown in Figure 2. The reference satellite is Starlink-1089 (SL-1089), whose deorbiting process was the most severe. We take a reference altitude as 280 km because SL-1089 started its sharp decay at that altitude during the storm. Another three satellites, SL-2652, SL-1472, and SL-2360, are chosen for comparisons due to three reasons: 1) the satellites reentered during different geomagnetic conditions; 2) they were around the reference altitude (horizontal dashed black line) near the onset of some geomagnetic activity Figures 2C–F 3) the satellites had similar altitudes and orbital decay rates before reaching the reference altitude (Figure 2A; also see Supplementary Figures S1–S4 for lifetime altitudes of all satellites). Thus, this suggests all four satellites were already reentering before reaching the reference altitude. The highlighted grey area corresponds to 1 day to 4 days around the reference altitude epoch time to represent quiet- and storm-times during the October 2024 event. In addition, as shown in Figure 2B, the velocity rate of each satellite generally increases as the satellite decays due to change of gravitational potential energy into kinetic energy.
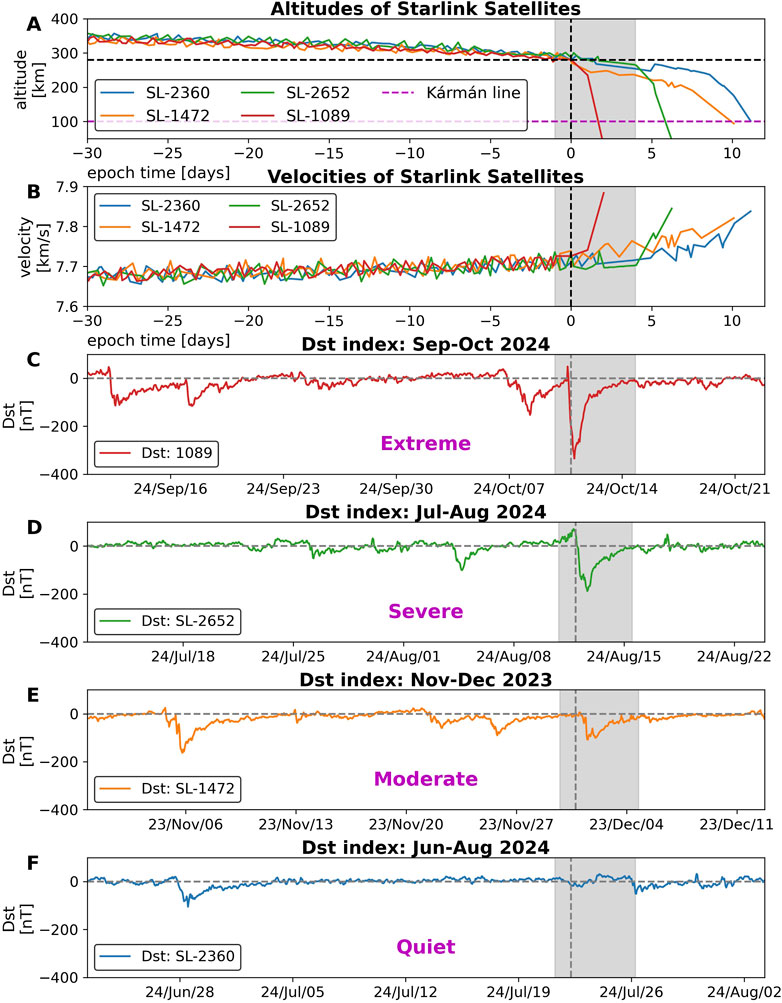
Figure 2. Altitudes/velocities and Dst data for four different Starlink satellites during their corresponding decay periods. (A): Starlink altitudes; and (B): Starlink velocities. The following panels indicate Dst index for the corresponding Starlink satellite. (C): Sep-October 2024 (SL-1089); (D): Jul-August 2024 (SL-2652); (E): Nov-December 2023 (SL-1472); and (F): Jun-August 2024 (SL-2360). The dashed vertical lines indicate a reference altitude at 280 km for each satellite. Data are plotted 30 and 10 days around the reference altitude. The grey highlighted area covers 1–4 days around the reference altitude onset.
The satellites that passed through the reference altitude under different geomagnetic conditions are: SL-2360, quiet conditions; SL-1472, moderate conditions; SL-2652, severe conditions; and SL-1089, extreme conditions. Such storm classifications are based on minimum values of Dst during the storm period (Zesta and Oliveira, 2019). Figure 2A shows that the more intense the geomagnetic activity level, the sharper the orbital decay rate. We consider a satellite renters the atmosphere when it crosses the Kármán line at
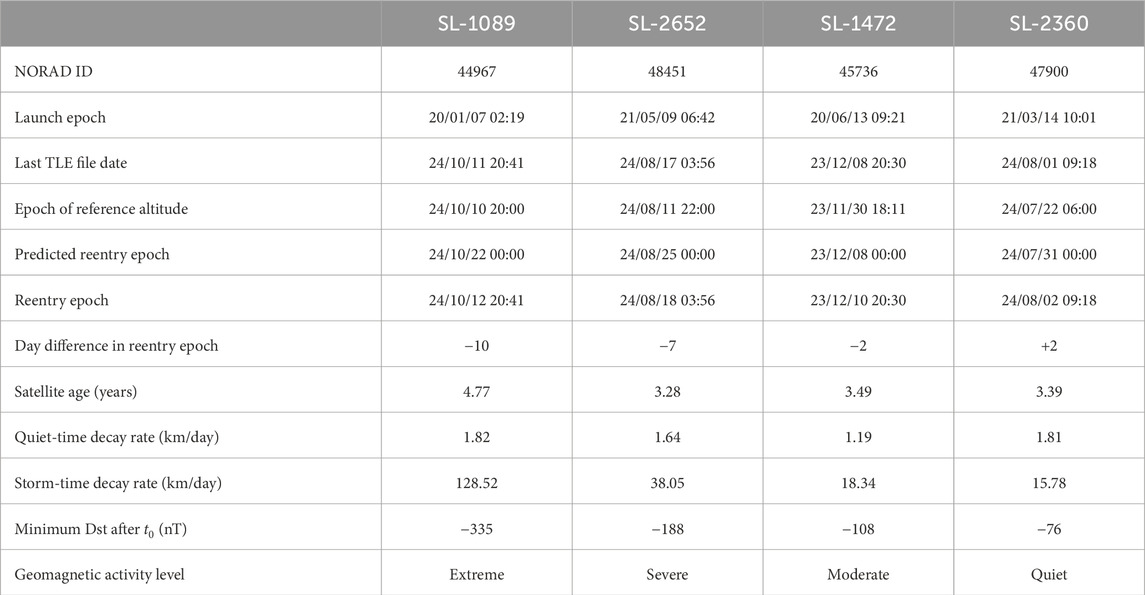
Table 1. IDs and orbital information of the four Starlink satellites used in this study. Satellite launch dates were obtained from https://aerospace.org/reentries/ followed by the satellite NORAD ID. Estimates of the reentry dates are obtained from the last TLE by propagating predictions in time until the satellite reaches the Karman line.
4 Discussion, conclusion, and suggestions
Space Era is defined to have begun with the launching of Sputnik, the first satellite sent to space (Launius, 2004). Sputnik was launched in 1957, the solar maximum year of SC19 (Clette et al., 2023). Ephemeris data provided by one of the first Sputnik satellites was used by Jacchia (1959) to, as best we can see from published literature, observe storm-time drag effects in LEO for the first time in history. Curiously, the highest yearly sunspot number observation also occurred in SC19 during 1957 (Clette et al., 2023). Zesta and Oliveira (2019) define geomagnetic storms with minimum Dst/SYM-H indices below the threshold of −250 nT to cause extreme effects on thermospheric neutral mass density and subsequent satellite orbital drag (Oliveira and Zesta, 2019), and it is well known that higher density enhancements result from more intense storms (Krauss et al., 2018; Oliveira and Zesta, 2019; Krauss et al., 2020). Although Meng et al. (2019) reported on the occurrence of nearly 40 extreme geomagnetic storms recorded with minimum Dst
Oliveira et al. (2021) suggested two possible approaches that can be undertaken in order to improve our understanding of extreme satellite orbital drag: look into extreme events and superstorms of the past or expect for new extreme events in the upcoming solar cycles. The first approach was already taken by Oliveira et al. (2020), who studied drag effects in LEO on hypothetical satellites flying in the atmosphere during three historical superstorms (October/November 1903; September 1909; and May 1921) along with the well-known, space-era geomagnetic storm of March 1989. The authors defined two storm characteristics: storm intensity, defined by the minimum Dst value at the beginning of the recovery phase, and storm duration, defined as the time between the (presumably) impact of the driving CME on the magnetosphere and the end of the main phase. The authors concluded that storm duration can be more effective in comparison to storm intensity when determining the severity of drag effects, as occurred in the case of the March 1989 event. As pointed out by Bhowmik and Nandy (2018), Nandy (2021), McIntosh et al. (2023), SC25 was expected to be stronger than SC24 based on sunspot number predictions. The magnetic activity causally connects solar phenomena to space weather effects around planetary objects such as the Earth and consequent impacts on human technologies (Nandy et al., 2023). The National Oceanic and Atmospheric Administration (NOAA) announced in mid October 2024 that the Sun has reached the solar maximum period of SC25 (https://tinyurl.com/3vcpt947). So far, two extreme geomagnetic storms have occurred in SC25: the event of May 2024 (Hayakawa et al., 2024) and the event of October 2024. We expect more intense solar-driven geomagnetic storms to occur over the next few years around the peak of the current sunspot cycle.
The Starlink event of February 2022 taught us that even a minor/moderate geomagnetic storm can significantly enhance satellite orbital drag in VLEO. For instance, Fang et al. (2022) demonstrated with Starlink density data and empirical model results that the thermosphere was quite perturbed between the altitudes of 200 km and 400 km, with density increases of 50%–125% with respect to pre-storm values. Since the satellites were flying low in the thermosphere (at altitudes mostly around 200 km), the satellites encountered downfall before the thrusters were activated for further uplift to higher altitudes (Hapgood et al., 2022). As clearly seen in Figure 1 of Oliveira et al. (2021), orbital drag effects dramatically increase at altitudes below 300 km (see CHAMP and GOCE altitudes during decommissioning) due to increasing density levels, even during quiet times. Therefore, decommissioning satellite operations deserve special attention for tracking during orbital decay, particularly during geomagnetic storms for safe and accurate reentry operations.
SpaceX has made a commitment to safely de-orbit Starlink satellites in a time period of 2–5 years in order “to keep [ing] space safe, sustainable and accessible, protect [ing] astronauts and satellites in orbit and the public on the ground”, as found in the document “Commitment to Space Sustainability (https://api.starlink.com/public-files/Commitment%20to%20Space%20Sustainability.pdf). Since SL-1089 was commissioned in January 2020, most likely it was already in reentry process at its fourth lifetime year when the October 2024 storm took place. As clearly seen in Figure 2A, SL-1089 decayed nearly 200 km within 48 h (10 October to 12 October). Although the satellite was scheduled to be decommissioned on 22 October 2024, as clearly seen in the smooth altitude decay since early September 2024 and reported by space-track.org, the satellite reentered on 12 October 2024. Ashruf et al. (2024) attributed the losses of 12 Starlink satellites to space weather conditions surrounding the 10 May 2024 extreme geomagnetic storm. However, though those satellites decayed nearly 200 km in 3 days, the authors did not make it clear whether the satellites had already begun their reentries before the storm. As seen in Figure 2C, the extreme storm of October 2024 event had a minimum (quick-look) Dst value of −335 nT. Although the main phase of extreme geomagnetic storms tend to develop quite fast within a few hours (Aguado et al., 2010; Cid et al., 2013), the October 2024 event had a relatively long storm development duration (
Finally, it should be pointed out that this is a preliminary analysis of the premature reentry of Starlink-1089 in October 2024. This is due to the use of preliminary data (2024 quick-look/real-time Dst data), and the current lack of density data provided by the satellite. Moreover, the use of less-refined Dst data is enough to determine the storm intensity (represented by minimum Dst values), and the occurrence time of storm main phase onset. Therefore, we recommend further analyses of this event as performed before for the Starlink event of February 2022 by approaching data analyses and numerical/empirical model investigations (Dang et al., 2022; Fang et al., 2022; Berger et al., 2023; Baruah et al., 2024).
Data availability statement
Publicly available datasets were analyzed in this study. This data can be found here: space-track.org.
Author contributions
DO: Conceptualization, Data curation, Formal Analysis, Funding acquisition, Investigation, Methodology, Writing–original draft, Writing–review and editing. EZ: Funding acquisition, Resources, Supervision, Validation, Writing–review and editing. DN: Conceptualization, Formal Analysis, Funding acquisition, Investigation, Validation, Writing–review and editing.
Funding
The author(s) declare that financial support was received for the research, authorship, and/or publication of this article. DMO acknowledges financial support provided by UMBC’s START (Strategic Awards for Research Transitions) program (grant # SR25OLIV). DMO and EZ thank the financial support provided by the NASA HGIO program through grant 80NSSC22K0756. DMO and EZ also acknowledge financial support by NASA’s Space Weather Science Applications Operations 2 Research. DN’s involvement in space weather research is sustained by the Ministry of Education, Government of India and a private philanthropic grant at the Center of Excellence in Space Sciences India, IISER Kolkata.
Conflict of interest
The authors declare that the research was conducted in the absence of any commercial or financial relationships that could be construed as a potential conflict of interest.
Generative AI statement
The author(s) declare that no Generative AI was used in the creation of this manuscript.
Publisher’s note
All claims expressed in this article are solely those of the authors and do not necessarily represent those of their affiliated organizations, or those of the publisher, the editors and the reviewers. Any product that may be evaluated in this article, or claim that may be made by its manufacturer, is not guaranteed or endorsed by the publisher.
Supplementary material
The Supplementary Material for this article can be found online at: https://www.frontiersin.org/articles/10.3389/fspas.2024.1522139/full#supplementary-material
Footnotes
1This information was visually obtained by clicking on the date/time tabs on the top right of the screen. We then selected early hours of 11 October 2024 (e.g., 1:00am). The geographic coordinates and location names were then obtained from Google Maps and by zooming in and clicking on the nearest pinned location.
References
Aguado, J., Cid, C., Saiz, E., and Cerrato, Y. (2010). Hyperbolic decay of the Dst index during the recovery phase of intense geomagnetic storms. J. Geophys. Res. 115. doi:10.1029/2009JA014658
Akasofu, S.-I. (1966). Electrodynamics of the magnetosphere: geomagnetic storms. Space Sci. Rev. 6, 21–143. doi:10.1007/BF00213406
Ashruf, A. M., Bhaskar, A., Vineeth, C., Pant, T. K., and M, A. V. (2024). Loss of 12 Starlink satellites due to pre-conditioning of intense space weather activity surrounding the extreme geomagnetic storm of 10 may 2024. arXiv:2410.16254. doi:10.48550/arXiv.2410.16254
Baruah, Y., Roy, S., Sinha, S., Palmerio, E., Pal, S., Oliveira, D. M., et al. (2024). The loss of Starlink satellites in february 2022: how moderate geomagnetic storms can adversely affect assets in low-earth orbit. Space. Weather 22, e2023SW003716. doi:10.1029/2023SW003716
Berger, T. E., Dominique, M., Lucas, G., Pilinski, M., Ray, V., Sewell, R., et al. (2023). The thermosphere is a drag: the 2022 Starlink incident and the threat of geomagnetic storms to low Earth orbit space operations. Space. Weather 21, e2022SW003330. doi:10.1029/2022SW003330
Bhaskar, A., Hayakawa, H., Oliveira, D. M., Blake, S., Silverman, S., and Ebihara, Y. (2020). An analysis of trouvelot’s auroral drawing on 1/2 March 1872: plausible evidence for recurrent geomagnetic storms. J. Geophys. Res. Space Phys. 125, e2020JA028227. doi:10.1029/2020JA028227
Bhowmik, P., and Nandy, D. (2018). Prediction of the strength and timing of sunspot cycle 25 reveal decadal-scale space environmental conditions. Nat. Commun. 9, 5209. doi:10.1038/s41467-018-07690-0
Boteler, D. H. (2019). A 21st century view of the March 1989 magnetic storm. Space Weather. 17, 1427–1441. doi:10.1029/2019SW002278
Bruinsma, S. L., and Forbes, J. M. (2007). Global observation of traveling atmospheric disturbances (TADs) in the thermosphere. Geophys. Res. Lett. 34. doi:10.1029/2007GL030243
Chen, G.-m., Xu, J., Wang, W., Lei, J., and Burns, A. G. (2012). A comparison of the effects of CIR– and CME–induced geomagnetic activity on thermospheric densities and spacecraft orbits: case studies. J. Geophys. Res. 117. doi:10.1029/2012JA017782
Cid, C., Palacios, J., Saiz, E., Cerrato, Y., Aguado, J., and Guerrero, A. (2013). Modeling the recovery phase of extreme geomagnetic storms. J. Geophys. Res. 118, 4352–4359. doi:10.1002/jgra.50409
Clette, F., Lefvre, L., Chatzistergos, T., Hayakawa, H., Carrasco, V. M. S., Arlt, R., et al. (2023). Recalibration of the sunspot-number: status report. Sol. Phys. 298, 44. doi:10.1007/s11207-023-02136-3
Dang, T., Li, X., Luo, B., Li, R., Zhang, B., Pham, K., et al. (2022). Unveiling the space weather during the Starlink satellites destruction event on 4 february 2022. Space Weather. 20, e2022SW003152. doi:10.1029/2022SW003152
Emmert, J. T. (2015). Thermospheric mass density: a review. Adv. Space Res. 56, 773–824. doi:10.1016/j.asr.2015.05.038
Fang, T.-W., Kubaryk, A., Goldstein, D., Li, Z., Fuller-Rowell, T., Millward, G., et al. (2022). Space weather environment during the SpaceX Starlink satellite loss in february 2022. Space Weather. 20, e2022SW003193. doi:10.1029/2022SW003193
Gonzalez, W. D., Joselyn, J. A., Kamide, Y., Kroehl, H. W., Rostoker, G., Tsurutani, B. T., et al. (1994). What is a geomagnetic storm? J. Geophys. Res. 99, 5771–5792. doi:10.1029/93JA02867
Gopalswamy, N., Barbieri, L., Lu, G., Plunkett, S. P., and Skoug, R. M. (2005). Introduction to the special section: violent Sun-Earth connection events of October-November 2003. Geophys. Res. Lett. 32. doi:10.1029/2005GL022348
Hapgood, M., Liu, H., and Lugaz, N. (2022). SpaceX – sailing close to the space weather? Space Weather. 20, e2022SW003074. doi:10.1029/2022SW003074
Hayakawa, H., Ebihara, Y., Mishev, A., Koldobskiy, S., Kusano, K., Bechet, S., et al. (2024). The solar and geomagnetic storms in may 2024: a flash data report. Astrophysical J. doi:10.3847/1538-4357/ad9335
Hayakawa, H., Ebihara, Y., Willis, D. M., Toriumi, S., Iju, T., Hattori, K., et al. (2019). Temporal and spatial evolutions of a large sunspot group and great auroral storms around the Carrington event in 1859. Space Weather 17, 1553–1569. doi:10.1029/2019SW002269
Iyemori, T. (1990). Storm-time magnetospheric currents inferred from mid–latitude geomagnetic field variations. J. Geomagnetism Geoelectr. 42, 1249–1265. doi:10.5636/jgg.42.1249
Jacchia, L. G. (1959). Corpuscular radiation and the acceleration of artificial satellites. Nature 183, 1662–1663. doi:10.1038/1831662a0
King, J. H., and Papitashvili, N. E. (2005). Solar wind spatial scales in and comparisons of hourly Wind and ACE plasma and magnetic field data. J. Geophys. Res. 110, 1–9. doi:10.1029/2004JA010649
Kizner, Z., and Belotserkovskiy, A. (2005). Orbital mechanics of satellites: two-line elements and their usage. Acta Astronaut. 56, 43–54. doi:10.1016/j.actaastro.2004.07.001
Knipp, D., Tobiska, W., and Emery, B. (2004). Direct and indirect thermospheric heating sources for solar cycles 21—23. Sol. Phys. 224, 495–505. doi:10.1007/s11207-005-6393-4
Krauss, S., Behzadpour, S., Temmer, M., and Lhotka, C. (2020). Exploring thermospheric variations triggered by severe geomagnetic storm on 26 august 2018 using GRACE follow-on data. J. Geophys. Res. Space Phys. 125. doi:10.1029/2019JA027731
Krauss, S., Temmer, M., and Vennerstrom, S. (2018). Multiple satellite analysis of the Earth’s thermosphere and interplanetary magnetic field variations due to ICME/CIR events during 2003-2015. J. Geophys. Res. Space Phys. 123, 8884–8894. doi:10.1029/2018JA025778
Krauss, S., Temmer, M., Veronig, A., Baur, O., and Lammer, H. (2015). Thermospheric and geomagnetic responses to interplanetary coronal mass ejections observed by ACE and GRACE: statistical results. J. Geophys. Res. Space Phys. 120, 8848–8860. doi:10.1002/2015JA021702
McDowell, J. C. (2018). The edge of space: revisiting the karman line. Acta Astronaut. 151, 668–677. doi:10.1016/j.actaastro.2018.07.003
McIntosh, S. W., Leamon, R. J., and Egeland, R. (2023). Deciphering solar magnetic activity: the (solar) hale cycle terminator of 2021. Front. Astronomy Space Sci. 10. doi:10.3389/fspas.2023.1050523
Mehta, P. M., Paul, S. N., Crisp, N. H., Sheridan, P. L., Siemes, C., March, G., et al. (2023). Satellite drag coefficient modeling for thermosphere science and mission operations. Adv. Space Res. 72, 5443–5459. doi:10.1016/j.asr.2022.05.064
Meng, X., Tsurutani, B. T., and Mannucci, A. J. (2019). The solar and interplanetary causes of superstorms (minimum Dst –250 nT) during the space age. J. Geophys. Res. Space Phys. 124, 3926–3948. doi:10.1029/2018JA026425
Nandy, D. (2021). Progress in solar cycle predictions: sunspot cycles 24–25 in perspective. Sol. Phys. 296, 54. doi:10.1007/s11207-021-01797-2
Nandy, D., Baruah, Y., Bhowmik, P., Dash, S., Gupta, S., Hazra, S., et al. (2023). Causality in heliophysics: magnetic fields as a bridge between the Sun’s interior and the Earth’s space environment. J. Atmos. Solar-Terrestrial Phys. 248, 106081. doi:10.1016/j.jastp.2023.106081
Oliveira, D. M., and Zesta, E. (2019). Satellite orbital drag during magnetic storms. Space Weather. 17, 1510–1533. doi:10.1029/2019SW002287
Oliveira, D. M., Zesta, E., Hayakawa, H., and Bhaskar, A. (2020). Estimating satellite orbital drag during historical magnetic superstorms. Space Weather. 18, e2020SW002472. doi:10.1029/2020SW002472
Oliveira, D. M., Zesta, E., Mehta, P. M., Licata, R. J., Pilinski, M. D., Kent Tobiska, W., et al. (2021). The current state and future directions of modeling thermosphere density enhancements during extreme magnetic storms. Front. Astronomy Space Sci. 8. doi:10.3389/fspas.2021.764144
Oliveira, D. M., Zesta, E., Schuck, P. W., and Sutton, E. K. (2017). Thermosphere global time response to geomagnetic storms caused by coronal mass ejections. J. Geophys. Res. Space Phys. 122 (10), 762–10782. doi:10.1002/2017JA024006
Prölss, G. (2011). Density perturbations in the upper atmosphere caused by the dissipation of solar wind energy. Surv. Geophys. 32, 101–195. doi:10.1007/s10712-010-9104-0
Ren, Y., Jin, S., Lu, Y., Gao, H., and Sun, S. (2022). The development status of Starlink and its countermeasures. Mod. Def. Technol. 50, 11–17. doi:10.3969/j.issn.1009-086x.2022.02.002
Shi, Y., Zesta, E., Connor, H. K., Su, Y.-J., Sutton, E. K., Huang, C. Y., et al. (2017). High-latitude thermosphere neutral density response to solar wind dynamic pressure enhancement. J. Geophys. Res. Space Phys. 122 (11), 11,559–11,578. doi:10.1002/2017JA023889
Sugiura, M. (1964). “Hourly values of equatorial Dst for the IGY,” in Annals of the international geophysical year (Oxford, United Kingdom: Pergamon Press), 35, 9–48.
Sutton, E. K., Forbes, J. M., and Nerem, R. S. (2005). Global thermospheric neutral density and wind response to the severe 2003 geomagnetic storms from CHAMP accelerometer data. J. Geophys. Res. 110, 1–10. doi:10.1029/2004JA010985
Wanliss, J. A., and Showalter, K. M. (2006). High-resolution global storm index: Dst versus SYM–H. J. Geophys. Res. 111. doi:10.1029/2005JA011034
World Data Center for Geomagnetism Kyoto, , Nose, M., Iyemori, T., Sugiura, M., and Kamei, T.(2015). Geomagnetic Dst index. [Data Set]. (Version v1). World Data Center. doi:10.17593/14515-74000
Keywords: geomagnetic storms, satellite megaconstellations, thermospheric mass density, satellite orbital drag, satellite reentry
Citation: Oliveira DM, Zesta E and Nandy D (2025) The 10 October 2024 geomagnetic storm may have caused the premature reentry of a Starlink satellite. Front. Astron. Space Sci. 11:1522139. doi: 10.3389/fspas.2024.1522139
Received: 04 November 2024; Accepted: 13 December 2024;
Published: 06 January 2025.
Edited by:
Andrey Samsonov, University College London, United KingdomReviewed by:
Ravindra Desai, University of Warwick, United KingdomMike Hapgood, Rutherford Appleton Laboratory, United Kingdom
Copyright © 2025 Oliveira, Zesta and Nandy. This is an open-access article distributed under the terms of the Creative Commons Attribution License (CC BY). The use, distribution or reproduction in other forums is permitted, provided the original author(s) and the copyright owner(s) are credited and that the original publication in this journal is cited, in accordance with accepted academic practice. No use, distribution or reproduction is permitted which does not comply with these terms.
*Correspondence: Denny M. Oliveira, ZGVubnlAdW1iYy5lZHU=