- Remote Sensing Division, U. S. Naval Research Laboratory, Washington, DC, United States
Introduction: Accurate primary beam calibration is essential for precise brightness measurements in radio astronomy. The VLA Low-band Ionosphere and Transient Experiment (VLITE) faces challenges in calibration due to the offset Cassegrain optics used in its commensal observing system. This study aims to develop a novel calibration method to improve accuracy with no impact on the Very Large Array (VLA) primary science observations.
Methods: We used the apparent brightness of standard candles identified in VLITE’s commensal data to develop 1D and 2D primary beam response models. These models accounted for operational changes and asymmetries caused by the subreflector and were validated against holographic methods and compact source light curves.
Results: The models achieved calibration accuracy within 3% across the field of view, significantly improving the precision of brightness measurements. The results were consistent with holography-derived solutions and performed reliably under different operational conditions.
Discussion: This improved calibration technique expands VLITE’s capabilities for studying active galactic nuclei, transients, and pulsars. It offers a cost-effective alternative to traditional holographic methods, facilitating broader use in commensal observing systems.
1 Introduction
Radio astronomy is a crucial field in studying astrophysical plasmas through the detection and analysis of radio waves emitted by cosmic ionized gases. These radio emissions offer valuable insights into particle acceleration mechanisms, temperature, density, magnetic fields, and interactions with other forms of matter and energy. Radio astronomy has led to significant breakthroughs, such as the discovery of pulsars, detection of the Milky Way’s diffuse synchrotron radiation, and identification of radio galaxies and quasars. It has also been instrumental in studying solar flares, coronal mass ejections, and the interstellar medium.
In radio astronomy, the fundamental detector element is the antenna. The antenna’s sensitivity to radio emissions from the sky is referred to as the primary beam response. In a typical astronomical antenna with a reflecting surface designed to enhance gain in the pointing direction, the primary beam features a prominent peak, known as the main lobe, surrounded by nulls and weaker sidelobes. The primary beam defines the solid angle over which the antenna effectively collects and measures radio emissions from celestial sources.
Radio astronomy uses interferometers to measure Fourier components of the sky brightness distribution by correlating the observed complex voltages between all pairs of antennas in an array. Inverse Fourier transform techniques are employed to construct images of the sky that are convolved with the point-spread function of the array and multiplied by the average primary beam of the antennas. Knowledge of the primary beam is needed to correct for the attenuation and achieve accurate brightness measurements of sources across the field of view. Typically, a singular, symmetric, and non varying model for the primary beam can be assumed and divided out.
The National Radio Astronomy Observatory’s Karl G. Jansky Very Large Array (VLA) is a reconfigurable array of 27 antennas situated along the three arms of a rail wye. Each antenna is a 25 m diameter telescope employing Cassegrain optics, as illustrated in Figure 1, with reflecting surfaces specially shaped to improve Cassegrain efficiency. The quasi-parabolic reflector dish redirects incident radio light from the pointing direction toward the prime focus. Four struts hold a rotating quasi-hyperbolic subreflector in front of the prime focus which reflects the light to radio receivers at the Cassegrain focus at the dish center. The frequency range from 1 to 50 GHz is covered by eight high frequency receivers arranged around a feed ring at the center of the reflector. The name, frequency range and angle in the ring for each of these high frequency receivers is given in Table 1. A more detailed description of the VLA and receivers is given in Perley et al. (2011).
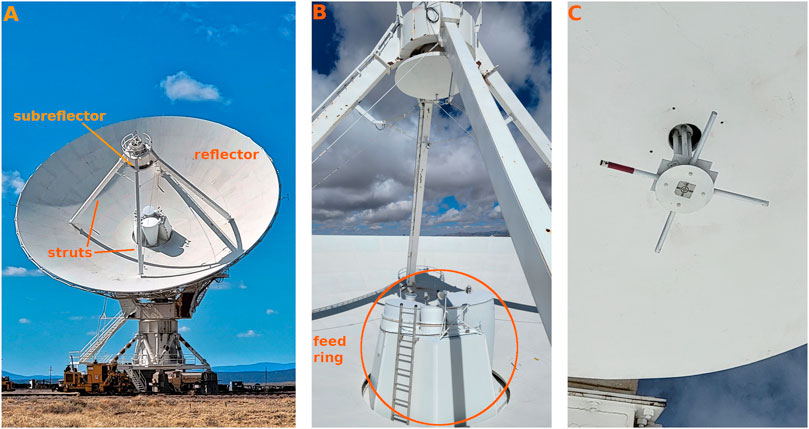
Figure 1. Each VLA antenna is an off-axis Cassegrain telescope. (A) The subreflector is held by four struts in front of the parabolic reflector’s prime focus. (B) The subreflector is oriented slightly off-axis, rotates, and changes height above the reflector to focus high frequency light to one of eight receivers in the central feed ring at the Cassegrain focus. (C) Close-up of the low frequency P-band receiver, consisting of a pair of crossed dipole antennas protruding from the subreflector and oriented perpendicular to the antenna’s pointing axis along the elevation and azimuth axes. The dark band marks the vertically aligned dipole.
Observations in the 224–480 MHz range (P-band) are enabled by a receiver consisting of a pair of linearly polarized dipole antennas located near the prime focus of the reflector. The dipoles are mounted to the antenna structure, protrude from the subreflector along the pointing axis of the reflector and are aligned perpendicular to this axis. The subreflector acts as a ground plane for the dipoles but also creates complications for the P-band primary beam pattern.
The first complication is that the P-band receiver is never precisely at the prime focus but is instead positioned significantly in front of it. This offset causes the primary beam to become defocused, resulting in a broad plateau surrounding the central Gaussian-shaped main lobe (Perley, 2016). Additionally, while the P-band dipoles remain fixed, the subreflector adjusts its distance from the reflector to focus light correctly on the desired feed height in the central ring. These subreflector adjustments alter both the shape and strength of features within the P-band primary beam, as the dipoles are positioned at a non-standard distance from the ground plane, deviating from the canonical quarter-wavelength separation.
The subreflector is also tilted relative to the pointing axis to focus high frequency light to the receivers on the feed ring. The tilt offsets the center of the P-band beam from the pointing axis by
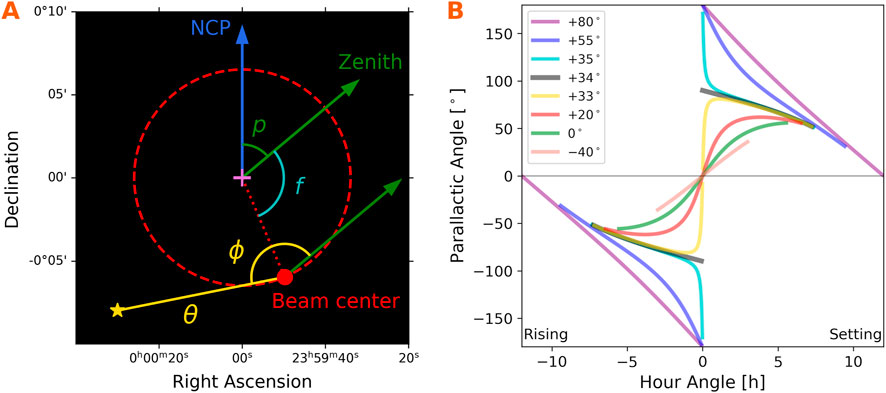
Figure 2. (A) Illustration of the offset, rotating VLA P-band primary beam for a pointing direction of
A novel approach in radio astronomy is commensal observations, where an independent data collection system utilizes the existing infrastructure of an instrument. The VLA Low-band Ionosphere and Transient Experiment (VLITE) is a pioneering instrument in this domain. VLITE records data using the P-band feed near the prime focus while the VLA records data using the high-frequency feeds at the Cassegrain focus. Operating on a subset of antennas and the available bandwidth, VLITE has been recording data during nearly all routine operations on the VLA for the last 10 years.
The VLA’s offset Cassegrain optics pose challenges for primary beam calibration in VLITE. The VLITE primary beam is asymmetric and varies in shape depending on the high-frequency receiver in use. It is also offset from the pointing axis and rotates around it, with the rotation pattern determined by the receiver and parallactic angles of the primary observations. These factors result in a unique attenuation pattern which must be individually computed for each VLITE image.
This paper is organized as follows: in Section 2 we describe our technique to map the VLITE primary beam and compute the unique calibration function for each VLITE image. We present the resulting primary beam maps in Section 3, compare to the map obtained from traditional methods and test the accuracy of our calibration. We conclude in Section 4 with a discussion of the impact primary beam calibration has on astrophysical plasma research with VLITE.
2 Methods
A traditional approach for measuring the primary beam is holography, where a bright, unresolved source is observed with a pair of antennas acting as a two element interferometer (Scott and Ryle, 1977). One antenna tracks the source while the other points in an offset direction, allowing for the measurement of the amplitude and phase of its voltage pattern. By taking multiple measurements at various offsets, a comprehensive map of the primary beam can be constructed and analyzed. This method offers the advantage of detailed beam mapping for each antenna in the array and can identify reflector deformations and optical misalignments, which can then be corrected to enhance antenna performance (Mayer et al., 1983).
The holographic method, however, requires significant observing time, which conflicts with VLITE’s goal of not interfering with the VLA’s primary science observations. Instead, we use the apparent brightness of a population of standard candles identified within the commensal data. By comparing the apparent brightness of the ensemble of sources scattered across the field of view with their known values, we can statistically determine the primary beam attenuation. With additional data on the sources’ distances from the beam center and their position angles, we can map and model the two-dimensional primary beam response for each subreflector position.
We opted to use source brightness rather than flux density for two main reasons. First, source brightness derived from fitting 2D elliptical Gaussians to pixel clusters is not affected by the uncertainties in fitted sizes compared to flux density, which is influenced by both signal-to-noise ratio (S/N) and the fitted sizes (Condon, 1997). Second, fitted Gaussians are often biased to larger sizes due to the inclusion of noise pixels around the island perimeter (Hales et al., 2012; Hopkins et al., 2015). This bias is particularly significant for VLITE sources due to the highly non-Gaussian noise in VLITE images. Our tests showed that brightness ratios produced a consistent attenuation pattern across different S/N bins, whereas flux density ratios did not. However, using brightness requires a sample of unresolved sources, as the apparent brightness of extended sources can be affected by the absence of short baselines in the array.
Our objective is to model the VLITE primary beam with sufficient accuracy to minimize beam calibration uncertainty in total intensity images across a large field of view. Although this method relies on total intensity images rather than measuring the complex voltage patterns of each dipole in the P-band feed, it effectively meets our requirement for achieving accurate beam calibration, even though it does not allow us to assess the quality of the VLA optics.
2.1 Catalog selection
The VLA is a reconfigurable array with four main configurations, labeled A through D. One complete cycle through all four configurations takes approximately 16 months. VLITE achieves its highest sensitivity and resolution when the VLA antennas are in the A configuration, which features the longest baselines of
To achieve accurate VLITE primary beam calibration over the largest possible solid angle, we require a catalog of standard candles that is both modest in resolution and extensive in coverage. The catalog should also be at a frequency similar to that of VLITE to minimize uncertainties arising from differences in source spectra. The Westerbork Northern Sky Survey (WENSS, Rengelink et al., 1997) meets these requirements effectively. WENSS covers 10,000 square degrees (declination
To identify unresolved sources, we use a well-established method (e.g., Intema et al., 2017; de Gasperin et al., 2018; Frail et al., 2024) based on a compactness metric derived from the flux density-to-brightness ratio
We define a high-quality sample of unresolved sources in WENSS by selecting single-component sources with compactness
Given the sensitivity of the WENSS survey, our source sample predominantly consists of active galactic nuclei (AGN, Condon et al., 1998). However, because WENSS observations were conducted between 1991 and 1997 — about 20–30 years prior to VLITE observations—there are concerns about using these sources as standard candles. Over this period, sources may have experienced brightness variations due to intrinsic factors such as changes in accretion physics or jet orientation, as well as extrinsic factors like scintillations from electron density irregularities in the interstellar medium. These variations can both increase and decrease source brightness. We thus expect that a sufficiently large sample will statistically balance out these variations and provide an accurate measure of the primary beam, albeit with greater scatter than expected from measurement error alone.
2.2 VLITE data
VLITE began science operations in November 2014, running commensally with 10 VLA antennas during nearly all regular VLA observations at GHz frequencies. In July 2017, VLITE expanded to 18 antennas to significantly enhance its sensitivity and imaging fidelity. For this study, we use only data collected after this expansion. VLITE images produced by the standard imaging pipeline have an effective bandwidth of approximately 40 MHz centered at 340 MHz due to design limitations and persistent radio frequency interference (RFI).
The VLITE Database Pipeline (VDP, Polisensky et al., 2019) processes images by cataloging sources with S/N
Compactness metrics are calculated for VLITE sources in a similar manner as for WENSS but statistical methods are used rather than injection simulations (e.g., Williams et al., 2013). Compactness analysis is performed separately for each array configuration within each 16-month cycle to account for variations in the VLITE antenna distribution and source fitting bias. The VDP stores compactness data, source finding products, and catalog matches in a Structured Query Language (SQL) database for efficient access and selection.
We select VLITE source detections that match the WENSS unresolved source sample based on the following criteria: sources must be fit as single-component Gaussians, have compactness
Longer-duration observations improve sensitivity and measurement precision but also cause sources to sample a smeared beam due to the changing parallactic angle. To assess the impact of including long-duration images, we compared our fitted models with those derived from images where the change in parallactic angle was kept below
Shorter-duration images, while providing better sampling of the unsmeared beam due to minimal parallactic angle change, tend to be less sensitive and more affected by noise. Our testing indicates that applying a minimum parallactic angle change
We define a coordinate system where each source’s position in the primary beam is specified by the angles
To determine the coordinates for each source, a single parallactic angle for the image is first computed as the average of the angles at the beginning and end of the observation. The location of the beam center is calculated from this parallactic angle, the subreflector rotation angle of the high frequency feed used during the observation, and the offset magnitude of
Using the coordinates
2.3 Data combination
The phase centers of the high-frequency feeds are positioned at different heights above the reflector. The subreflector adjusts its distance from the reflector to focus light on these phase centers. Additionally, the orientation of the asymmetric subreflector with respect to the P-band dipoles varies with the feed ring angle of the high-frequency feed.
However, since we are modeling the total intensity primary beam profiles, any dependency in the responses of the individual, linear polarized dipoles due to changes in the subreflector orientation should average out. By accounting for the feed ring position angle and calculating the polar angle
The L and S-band feeds, being at distinct heights, are modeled separately as the “L″ and “S″ VLITE primary beams. In contrast, the Ku, K, Ka, and Q-band feeds share the same height and are combined into the “KQ” primary beam. Although the C and X-bands differ by about 4% of a VLITE wavelength, testing showed no significant benefit from fitting them separately, so they are grouped together as the “CX” beam. Combining data from feeds at the same or similar subreflector distances enhances the number of samples and the robustness of the model fits. Specifically, the S beam has about 9,000 samples, the L beam has about 42,000, and both the CX and KQ beams have approximately 14,000 samples each.
2.4 1D primary beam model
We first describe our model for the primary beam as a function of radial distance from the beam center,
The main lobe is modeled as a Gaussian:
The parameter
To determine
The distribution reveals a significant number of outliers with brightness ratios
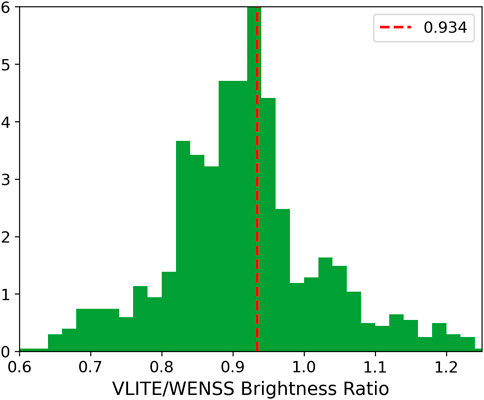
Figure 3. Histogram of the brightness ratios of unresolved WENSS sources detected within
Since
To determine
We fit the intricate shape of the outer beam with a penalized cubic spline using the ALGLIB1 library. Penalized splines are effective for handling complexity in noisy data and offer ease of tuning, with only two free parameters: the number of spline nodes
We define
The parameter
The final 1D beam model with the smoothing applied is calculated as in Equation 3.
Figure 4A illustrates the 1D model fitted to the L-band subreflector position, while Figure 4B presents the slope of the fit. The model transitions from the Gaussian shape of the main lobe to the outer spline at
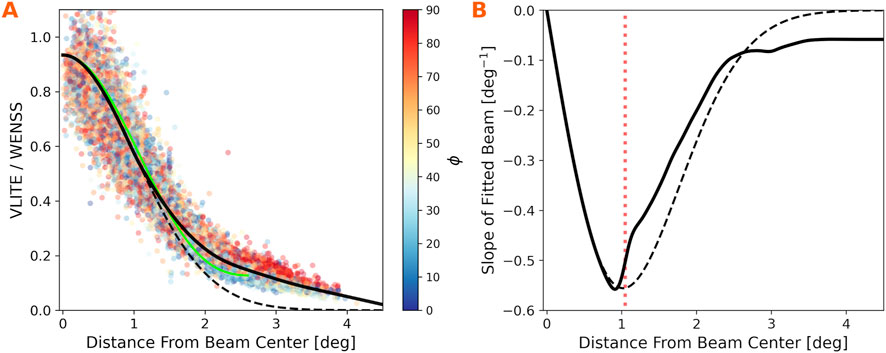
Figure 4. (A) Brightness ratios with distance from beam center
The data points in Figure 4A are color-coded by polar angle
2.5 2D primary beam model
To address beam asymmetries, we generate a 2D primary beam model by applying the 1D model to data binned by polar angle
We sample
2.6 Image primary beam calibration
This section describes how the unique beam attenuation function for each VLITE image is computed from the tabulated primary beam models.
Each VLITE image consists of one or more observation “blocks” during which the position on the sky is tracked continuously. The VLITE imaging pipeline generates data products that detail the number of blocks, their start and stop times, and the number of recorded visibilities. The continuous smear of the rotating primary beam within each block is approximated by discrete sampling. At a minimum, each block is sampled at its start and end. If a block’s duration exceeds a specified “smear time,” additional samples are taken. The number of extra samples is determined by the integer ratio of the block duration to the smear time, with sample times evenly spaced. We adopt a smear time of 900 s and evaluate the accuracy of this sampling in Section 3.3.
At each sample time, the parallatic angle is computed and used to determine
Each block is assigned a weight based on the ratio of its visibilities to the total number of visibilities in the observation. This weight is distributed among the beam samples within the block. The primary beam value for each pixel at each sample time is then weighted and summed to create an image of the primary beam attenuation across the field of view. Efficient computations are performed using NumPy array methods. While long-duration observations with many blocks can take several minutes, most VLITE images have their beam attenuation computed in
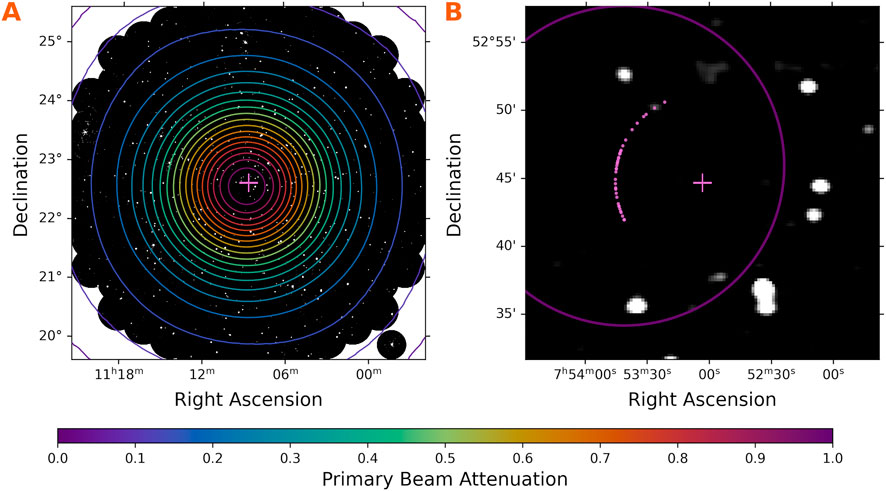
Figure 5. Contours of primary beam attenuation overlain on VLITE images. Crossed lines indicate the pointing center for each image. (A) A
Special considerations are required for images from the VLITE Commensal Sky Survey (VCSS, Peters et al., 2022), a low-frequency survey conducted alongside the 3 GHz VLA Sky Survey (VLASS, Lacy et al., 2020). VLASS is a large, multi-epoch sky survey conducted at S-band with the VLA in the B configuation. VLASS scans the sky at declinations
The data is then correlated and imaged with the midpoint of the antenna motion used as the phase center. This results in short snapshot images with an elongated primary beam response. Calculating the primary beam attenuation for VCSS snapshots requires accounting for the lateral motion in right ascension. The data are treated as a single observing block and sampled at 14 intervals, equally spaced in time, across the
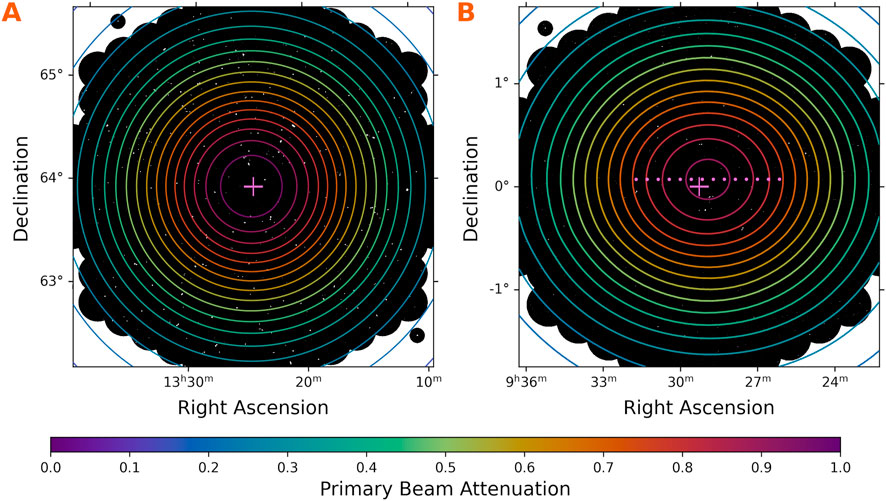
Figure 6. Contours of primary beam attenuation overlain on
3 Results
In this section we show the fitted primary beam models, compare to the beam model from holography, and test the accuracy of our image calibration method.
3.1 Primary beam models
Figure 7 displays the 2D models fitted to the data for the four VLITE primary beams. The white contours represent half, quarter, and one-eighth power levels, highlighting the size and asymmetries of the beams. The beams are narrower in altitude due to the tilt of the subreflector, which presents an elongated ground plane to the P-band dipoles in this direction. Additionally, the beam widens as the subreflector is positioned closer to the dipoles.
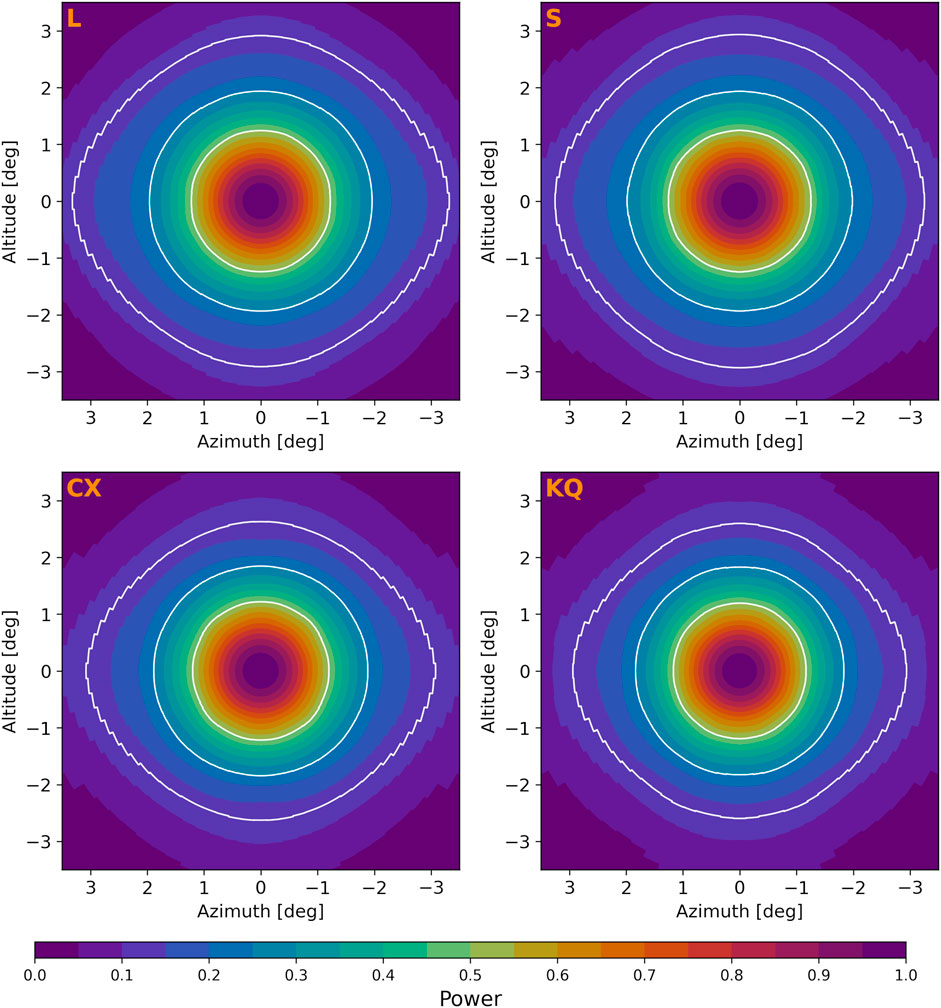
Figure 7. The four VLITE primary beams derived from 2D model fitting the source data. Shown are the subreflector positions for the L-band, S-band, C and X-bands (CX), and the Ka, K, Ku, and Q-band feeds (KQ). The subreflector positions are arranged with increasing proximity to the prime focus from left to right and top to bottom. White contours represent the half-power, quarter-power, and one-eighth-power levels. The beams exhibit notable asymmetry beyond
The struts are aligned horizontally and vertically along the azimuth and altitude axes in these plots. Comparing the patterns in the outer beams along diagonal versus horizontal and vertical directions reveals asymmetries likely attributable to these struts.
3.2 Comparison to the VLA model
During dedicated P-band observations with the VLA, the subreflector is positioned as close to the prime focus as possible, maximizing its distance from the P-band dipoles. This setup differs from its position during high-frequency observations. The primary beam has been mapped in this configuration using the holographic technique and modeled with symmetric eighth-degree polynomials across the full P-band frequency range (Perley, 2016). These models achieve about 1.5% accuracy for distances from center up to
We use the polynomial coefficients from the 344 MHz holographic model for comparison with our 340 MHz VLITE models. We extend the polynomial beyond
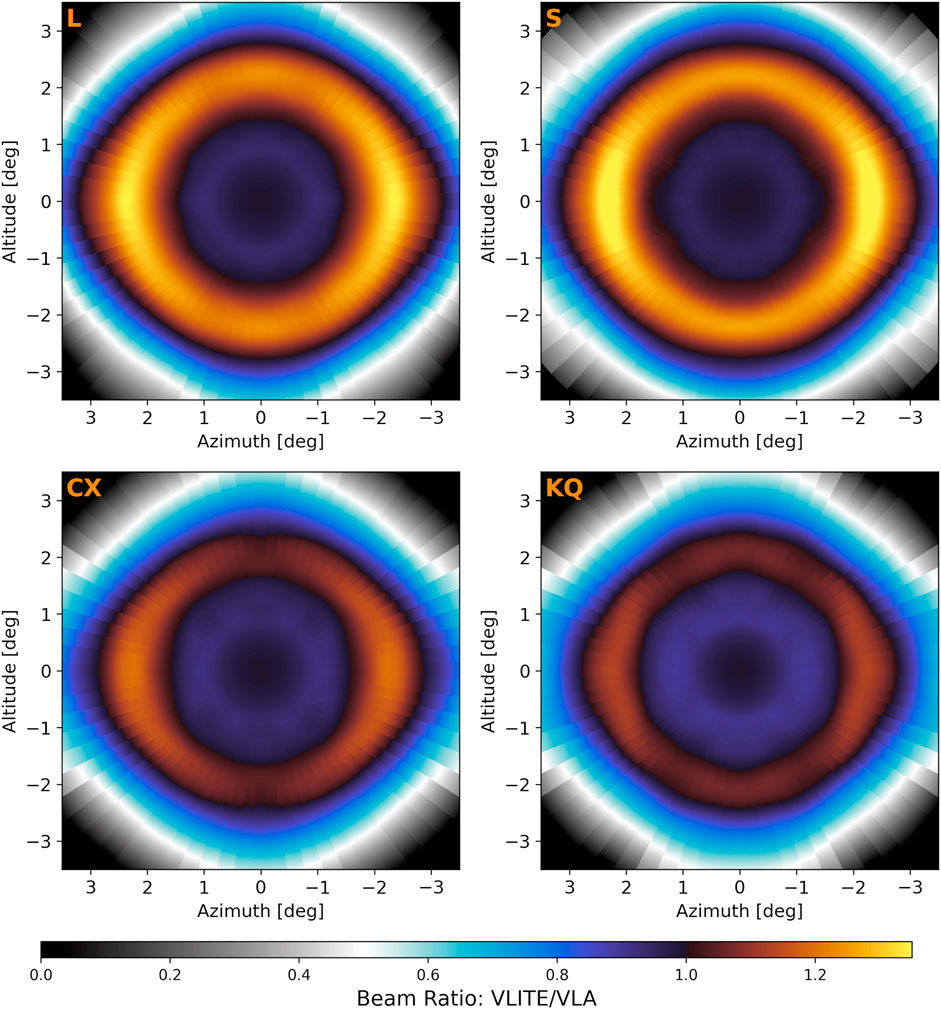
Figure 8. Illustration of the ratio of VLITE to VLA primary beam models. In the main lobe
The situation is reversed in the inner
The model ratios decrease rapidly beyond
3.3 Image calibration accuracy
We next evaluate the accuracy of our image calibration method calculated with the primary beam models, as described in Section 2.6.
First, we assess the impact of using different smear times for image attenuation functions: our chosen smear time of 900 s versus a shorter, 2-second smear. The 2-second smear approximates a continuous beam rotation by matching the VLITE data integration time. Our analysis reveals that inaccuracies from using the coarser smear time arise primarily from less precise sampling during long observing blocks, particularly at declinations and hour angles where the parallactic angle changes rapidly. In contrast, long-duration observations with multiple blocks are less affected due to increased sampling frequency. The greatest discrepancies occur in images shorter than 900 s and consisting of a single observing block. Figure 9 illustrates the ratio of primary beam attenuation using the 900-second smear compared to the 2-second smear.
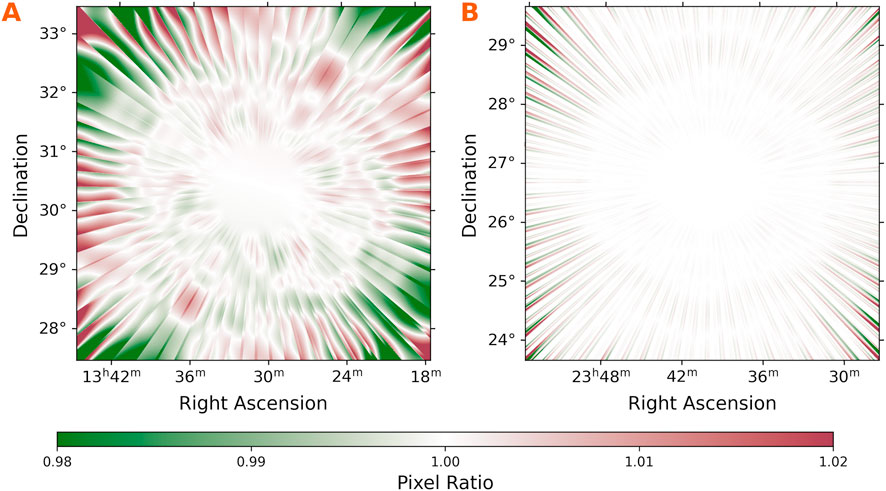
Figure 9. Tests of image calibration using discrete sampling of the smeared beam. The primary beam attenuation ratio across the field is calculated using our adopted smear time of 900 s and a fine sampling of 2 s. (A) A 389 s observation of the 3C286 field. The observation was conducted in one continuous block during which the beam rotated by
Figure 9A depicts a
Figure 9B shows a similar scenario where the primary beam rotated
We next evaluated the accuracy of our primary beam calibration using source light curves. Our beam models were derived from data collected across 5 C configuration cycles between July 2017 and January 2023. To mitigate potential bias from unequal sampling—where some VLITE fields are observed more frequently than others, potentially skewing results if a small subset of sources is sampled more often and has experienced systematic brightness changes since WENSS observations—we verify the accuracy of our primary beam calibration by assessing sources outside the WENSS footprint.
We selected bright, unresolved sources from the VLITE C configuration catalog, ensuring each had 15 or more detections and had no matches in the WENSS catalog. Selection criteria included a median S/N
Figure 10A shows the calibrated brightness of each detection normalized by the average brightness of the source, plotted by its distance from image center. The detections are colored according to the primary beam attenuation value at each source location. The binned averages reveal a slight bias, with values approximately 2% higher around
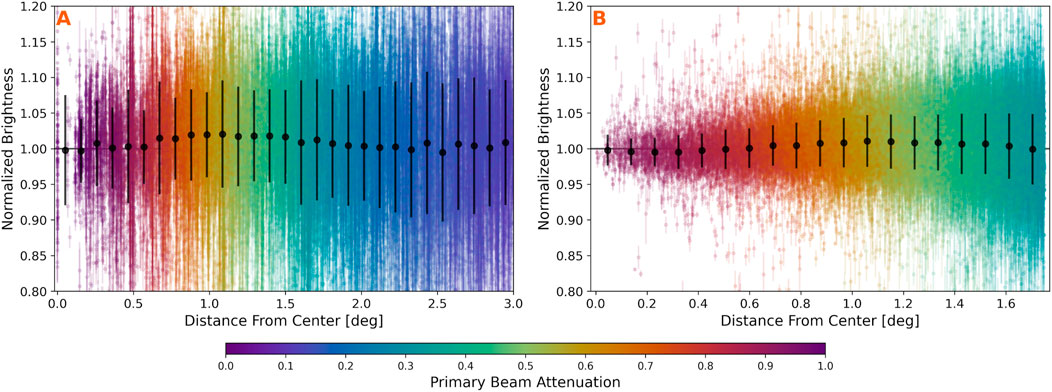
Figure 10. Primary beam calibration tests using detections of well-sampled unresolved sources. Each detection is normalized by the average source brightness and plotted according to its distance from the image center. Detections are colored by the primary beam attenuation at their location. (A) C configuration sources outside the WENSS footprint. (B) Bright sources from VCSS epoch 2. Binned averages (black points) show that calibration uncertainty is approximately 1%–2% up to
Figure 10B presents similar data for sources from the VCSS snapshots catalog during the second observing epoch. The high overlap of VCSS snapshots makes them ideal for testing image calibration with the S-band beam model. Bright sources are typically sampled by
We analyzed 33,715 detections from 839 sources, each with an average brightness exceeding 1 Jy/bm, more than 10 detections, median compactness
To investigate whether the spline method used for the outer beam fits contributed to this bias, we recalculated the beam models using the LOWESS algorithm (Cleveland, 1979). The fitted values were up to
Overall, this bias is minimal, and we conclude that the image calibration solutions derived from the primary beam models are accurate to
4 Discussion
In this paper, we presented a novel technique for mapping and calibrating the primary beam response of VLITE, a commensal telescope situated near the prime focus of an offset Cassegrain optical path. We demonstrated that our method for deriving the unique calibration function for each VLITE image achieves total intensity source measurements with an accuracy of 3% across a 25 square degree solid angle. This calibration advancement allows for the utilization of VLITE’s distinctive defocused primary beam characteristics–specifically, the absence of nulls and the broad plateau surrounding the main lobe–for astrophysical plasma research.
One of VLITE’s primary scientific objectives is to detect radio transient and variable sources. Achieving accurate measurement of source light curves across a large field of view significantly advances this goal. For example, Figure 11 displays the calibrated VLITE light curve of a compact AGN potentially exhibiting interplanetary scintillations (IPS) caused by turbulence in the Solar Wind plasma. IPS enables the measurement of electron density irregularities in the heliosphere (Tappin, 1986), which supports space weather research. Moreover, IPS can probe radio sources with sub-arcsecond components without requiring very long baseline interferometry (Morgan et al., 2018). This capability is valuable for analyzing the size of structures in radio galaxies, aiding in their evolutionary study and potentially providing a new method for identifying high-redshift radio galaxies (Sadler et al., 2019).
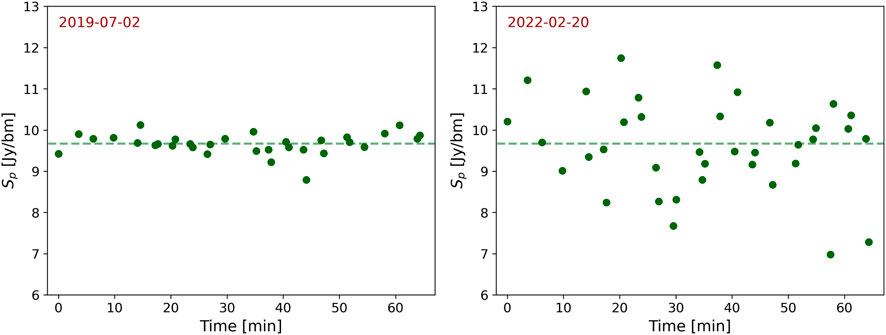
Figure 11. Calibrated VCSS light curves for the compact source PKS 2135-20. Left: observation on 2019-07-02, when the source was
The opening of the field of view through accurate primary beam calibration has revolutionized the search for transient emissions with VLITE. Polisensky et al. (2023) utilized the initial two VCSS epochs to search for explosive flaring events attributed to the centrifugal breakout of stellar wind plasma trapped in the magnetospheres of early-type stars with
Calibrated VLITE images also open new possibilities for discovering radio transients based on their spectral index. Incorporating spectral information into the selection of transient candidates in radio surveys is a largely unexplored concept, mainly due to the difficulty of obtaining simultaneous measurements across widely separated frequencies. Chen et al. (2024) conducted a proof-of-concept study by searching for transients with inverted spectra (i.e., brighter at higher frequencies) in epoch 1 of VLASS and VCSS. Inverted spectra typically indicate synchrotron self-absorption in optically thick and dynamically young synchrotron-emitting plasma. Their search identified 22 bright, slow-evolving extragalactic transient candidates unassociated with known AGN. These candidates are likely relativistic tidal disruption events (Somalwar et al., 2023) of stars by supermassive black holes (SMBH), though highly variable or transient AGN (Nyland et al., 2020) are also possible. This work highlights the powerful technique of using simultaneous survey data to identify new transient radio phenomena.
Primary beam calibration allows for the combination of images to enhance sensitivity. Polisensky et al. (in preparation) analyzed 136 h of observations of the Hubble Ultra Deep Field (HUDF) collected over 45 days during two consecutive A configuration cycles. By combining a 20-hour subset of high-quality data, they created a deep integration image with a root mean square sensitivity of 158
Nyland et al. (in preparation) present Very Long Baseline Array imaging of one of these sources, J0330-2730, revealing a double-lobed morphology with an extent of 140 pc–over an order of magnitude smaller than predictions based on standard synchrotron self-absorbed jet models. They propose that J0330-2730 is likely a frustrated jet, suggesting that alternative energy loss mechanisms are significant. This research underscores VLITE’s potential for conducting large-scale systematic searches for compact AGN jets, providing new insights into the evolution and life cycles of AGN and the complex interplay between SMBH growth and stellar formation over cosmic time.
Morphological and spectral analysis of extended radio emission in dying and restarted radio galaxies has also been enabled by primary beam calibration (Giacintucci et al., 2021). These galaxies exhibit large-scale, extended emission resulting from intermittent jet activity throughout their lifetimes. However, they are relatively rare due to rapid radiative and adiabatic expansion losses that cause their emission to fade within
The advancement in primary beam calibration has opened new possibilities for pulsar discovery with VLITE. Low-frequency imaging surveys leverage pulsars’ compact size and steep radio spectra, offering significant advantages over traditional time-domain surveys. Pulsar detection is favored at low frequencies due to their brightness, but dispersive smearing and scattering at these frequencies can hinder detection by time-domain methods. Imaging surveys, however, are unaffected by these distortions and can detect fast-spinning pulsars in compact or highly eccentric orbits missed by timing surveys.
Recent efforts have focused on expanding the pulsar census using VLITE’s capabilities to survey compact, steep-spectrum sources. An initial search of VLITE images from 97 globular clusters led to the discovery of the first pulsar in cluster GLIMPSE-C01 and marked VLITE’s inaugural pulsar discovery (McCarver et al., 2024).
Data availability statement
The raw data supporting the conclusions of this article will be made available by the authors, without undue reservation.
Author contributions
EP: Conceptualization, Data curation, Formal Analysis, Investigation, Methodology, Software, Validation, Visualization, Writing–original draft. TC: Conceptualization, Funding acquisition, Resources, Writing–review and editing. SG: Conceptualization, Validation, Writing–review and editing. WP: Data curation, Software, Validation, Writing–review and editing.
Funding
The author(s) declare that financial support was received for the research, authorship, and/or publication of this article. Basic research in radio astronomy at the U.S. Naval Research Laboratory is supported by 6.1 Base funding. Construction and installation of VLITE was supported by the NRL Sustainment Restoration and Maintenance fund. The National Radio Astronomy Observatory is a facility of the National Science Foundation operated under cooperative agreement by Associated Universities, Inc.
Acknowledgments
We acknowledge the contribution of Emily Richards to the development of VDP by an appointment to the NRC Research Associateship Program at the US Naval Research Laboratory, administered by the Fellowships Office of the National Academies of Sciences, Engineering, and Medicine. Many student interns supported through the Naval Research Enterprise Internship Program (NREIP) contributed to early efforts to map the VLITE primary beam, including: Lee Bernick, Alice Zhang, and Errol Rochester. Parts of the results in this work make use of the colormaps in the CMasher package (van der Velden, 2020).
Conflict of interest
The authors declare that the research was conducted in the absence of any commercial or financial relationships that could be construed as a potential conflict of interest.
Publisher’s note
All claims expressed in this article are solely those of the authors and do not necessarily represent those of their affiliated organizations, or those of the publisher, the editors and the reviewers. Any product that may be evaluated in this article, or claim that may be made by its manufacturer, is not guaranteed or endorsed by the publisher.
Footnotes
References
Chen, Y., Gaensler, B. M., Clarke, T., Peters, W., Polisensky, E., and Rose, K. (2024). Searching for radio transients with inverted spectra in epoch 1 of VLASS and VCSS, and identification of a sample of candidate relativistic nuclear transients. arXiv e-prints, arXiv:2410.06210. doi:10.48550/arXiv.2410.06210
Cleveland, W. S. (1979). Robust locally weighted regression and smoothing scatterplots. J. Am. Stat. Assoc. 74, 829–836. doi:10.1080/01621459.1979.10481038
Condon, J. J. (1997). Errors in elliptical Gaussian fits. Publ. Astron. Soc. Pac. 109, 166–172. doi:10.1086/133871
Condon, J. J., Cotton, W. D., Greisen, E. W., Yin, Q. F., Perley, R. A., Taylor, G. B., et al. (1998). The NRAO VLA sky survey. Astron. J. 115, 1693–1716. doi:10.1086/300337
de Gasperin, F., Intema, H. T., and Frail, D. A. (2018). A radio spectral index map and catalogue at 147-1400 MHz covering 80 per cent of the sky. Mon. Not. R. Astron. Soc. 474, 5008–5022. doi:10.1093/mnras/stx3125
Frail, D. A., Polisensky, E., Hyman, S. D., Cotton, W. D., Kassim, N. E., Silverstein, M. L., et al. (2024). An image-based search for pulsar candidates in the MeerKAT bulge survey. Survey 975, 34. doi:10.3847/1538-4357/ad74fd
Giacintucci, S., Clarke, T., Kassim, N. E., Peters, W., and Polisensky, E. (2021). Radio and X-ray observations of the restarted radio galaxy in the galaxy cluster CL 0838+1948. Galaxies 9, 108. doi:10.3390/galaxies9040108
Hales, C. A., Murphy, T., Curran, J. R., Middelberg, E., Gaensler, B. M., and Norris, R. P. (2012). BLOBCAT: software to catalogue flood-filled blobs in radio images of total intensity and linear polarization. Mon. Not. R. Astron. Soc. 425, 979–996. doi:10.1111/j.1365-2966.2012.21373.x
Hopkins, A. M., Whiting, M. T., Seymour, N., Chow, K. E., Norris, R. P., Bonavera, L., et al. (2015). The ASKAP/EMU source finding data challenge. Publ. Astron. Soc. Aust. 32, e037. doi:10.1017/pasa.2015.37
Intema, H. T., Jagannathan, P., Mooley, K. P., and Frail, D. A. (2017). The GMRT 150 MHz all-sky radio survey. First Altern. data release TGSS ADR1 598, A78. doi:10.1051/0004-6361/201628536
Lacy, M., Baum, S. A., Chandler, C. J., Chatterjee, S., Clarke, T. E., Deustua, S., et al. (2020). The Karl G. Jansky very large array sky survey (VLASS). Science case and survey design. Sci. Case Surv. Des. 132, 035001. doi:10.1088/1538-3873/ab63eb
Mayer, C. E., Davis, J. H., Peters, W. L., and Vogel, W. J. (1983). A holographic surface measurement of the Texas 4.9-m antenna at 86 GHz. IEEE Trans. Instrum. Meas. 32, 102–109. doi:10.1109/TIM.1983.4315018
McCarver, A. V., Maccarone, T. J., Ransom, S. M., Clarke, T. E., Giacintucci, S., Peters, W. M., et al. (2024). A VLITE search for millisecond pulsars in globular clusters: discovery of a pulsar in GLIMPSE-C01. Astrophys. J. 969, 30. doi:10.3847/1538-4357/ad4461
Morgan, J. S., Macquart, J. P., Ekers, R., Chhetri, R., Tokumaru, M., Manoharan, P. K., et al. (2018). Interplanetary scintillation with the murchison widefield array I: a sub-arcsecond survey over 900 deg2 at 79 and 158. MHz 473, 2965–2983. doi:10.1093/mnras/stx2284
Nyland, K., Dong, D. Z., Patil, P., Lacy, M., van Velzen, S., Kimball, A. E., et al. (2020). Quasars that have transitioned from radio-quiet to radio-loud on decadal timescales revealed by VLASS and FIRST. Astrophys. J. 905, 74. doi:10.3847/1538-4357/abc341
Perley, R. (2016). Jansky very large array primary beam characteristics. VLA Expansion Project Memorandum 195. Natl. Radio Astron. Obs.
Perley, R. A., Chandler, C. J., Butler, B. J., and Wrobel, J. M. (2011). The expanded very large array: a new telescope for new. Science 739, L1. doi:10.1088/2041-8205/739/1/L1
Peters, W., Clarke, T., Giacintucci, S., Nyland, K., and Polisensky, E. (2022). The VLITE commensal sky survey (VCSS) epoch 1 bright catalog release. Available at: https://ws.cadc-ccda.hia-iha.nrc-cnrc.gc.ca/files/vault/cirada/VCSS_Catalogue/VCSS_Bright_Catalog_Memo.pdf.
Polisensky, E., Das, B., Peters, W., Shultz, M. E., Semenko, E., and Clarke, T. E. (2023). Unstable phenomena in stable magnetospheres: searching for radio flares from magnetic OBA stars using VCSS. Astrophys. J. 958, 152. doi:10.3847/1538-4357/ad0295
Polisensky, E., Richards, E., Clarke, T., Peters, W., and Kassim, N. (2019). The VLITE database pipeline. In astronomical data analysis Software and systems XXVII, eds P. J. Teuben, M. W. Pound, B. A. Thomas, and E. M. Warner vol. 523 of Astronomical society of the pacific conference series, 441
Rengelink, R. B., Tang, Y., de Bruyn, A. G., Miley, G. K., Bremer, M. N., Roettgering, H. J. A., et al. (1997). The westerbork northern sky survey (WENSS): I. A 570 square degree mini-survey around the north EclipticPole. Mini-Survey around North Ecliptic Pole 124, 259–280. doi:10.1051/aas:1997358
Sadler, E. M., Chhetri, R., Morgan, J., Mahony, E. K., Jarrett, T. H., and Tingay, S. (2019). Interplanetary scintillation studies with the Murchison Wide-field Array - IV. The hosts of sub-arcsecond compact sources at low radio frequencies. Mon. Not. R. Astron. Soc. 483, 1354–1373. doi:10.1093/mnras/sty3033
Scott, P. F., and Ryle, M. (1977). A rapid method for measuring the figure of a radio telescope reflector. Mon. Not. R. Astron. Soc. 178, 539–545. doi:10.1093/mnras/178.4.539
Somalwar, J. J., Ravi, V., Dong, D. Z., Chen, Y., Breen, S., Chandra, P., et al. (2023). A candidate relativistic tidal disruption event at 340 mpc. Astrophys. J. 945, 142. doi:10.3847/1538-4357/acbafc
Tappin, S. J. (1986). Interplanetary scintillation and plasma density. Planet. Space Sci. 34, 93–97. doi:10.1016/0032-0633(86)90106-6
van der Velden, E. (2020). CMasher: scientific colormaps for making accessible, informative and ’cmashing’ plots. J. Open Source Softw. 5, 2004. doi:10.21105/joss.02004
Keywords: calibration, astronomical optics, astronomical techniques, flux calibration, radio telescopes, radio interferometry
Citation: Polisensky E, Clarke TE, Giacintucci S and Peters W (2024) Primary beam calibration for commensal telescopes utilizing offset optics. Front. Astron. Space Sci. 11:1497375. doi: 10.3389/fspas.2024.1497375
Received: 16 September 2024; Accepted: 02 December 2024;
Published: 18 December 2024.
Edited by:
Elizabeth Jensen, Planetary Science Institute, United StatesReviewed by:
Omar López-Cruz, National Institute of Astrophysics, Optics and Electronics (INAOE), MexicoDario Carbone, Sultan Qaboos University, Oman
Copyright © 2024 Polisensky, Clarke, Giacintucci and Peters. This is an open-access article distributed under the terms of the Creative Commons Attribution License (CC BY). The use, distribution or reproduction in other forums is permitted, provided the original author(s) and the copyright owner(s) are credited and that the original publication in this journal is cited, in accordance with accepted academic practice. No use, distribution or reproduction is permitted which does not comply with these terms.
*Correspondence: Emil Polisensky, ZW1pbC5qLnBvbGlzZW5za3kuY2l2QHVzLm5hdnkubWls
 Emil Polisensky
 Tracy E. Clarke
 Simona Giacintucci
 Wendy Peters