- Center for Space Physics, Boston University, Boston, MA, United States
Strong electric fields in the auroral and equatorial electrojets can distort the background ion distribution function away from the Maxwellian. We developed a collisional plasma kinetic model using the Boltzmann equation and a simple BGK collision operator to predict a relatively simple relationship between the intensity of the background electric field and the resulting ion distribution function. To test the model, we perform 3-D plasma particle-in-cell simulations and compared the results to the model. Both the simulation and the analytical model assume a constant ion-neutral collision rate. The simulations show less ion heating in the Pedersen direction than in the analytical model but nearly identical overall heating. The model overestimates heating in the Pedersen direction because the simple BGK operator models collisions as a kinetic friction only in the Pedersen direction. On the other hand, the fully kinetic particle-in-cell code captures the physics of ion scattering in 3-D and therefore heats ions more isotropically. Although the simple BGK analytical theory does not precisely model the non-Maxwellian ion distribution function, it does capture the overall momentum and energy flows and therefore can provide the basis of further kinetic analysis of E-region wave evolution during strongly driven conditions.
1 Introduction
Strong DC electric fields in the auroral and equatorial electrojets drive plasma instabilities in the E-region ionosphere. When perpendicular to the global magnetic field, these electric fields generate strong cross-field plasma instabilities, such as the Farley–Buneman instability (Farley, 1963; Buneman, 1963), gradient drift instability (Hoh, 1963; Maeda et al., 1963; Simon, 1963), electron thermal instability (Dimant and Sudan, 1995; 1997; Robinson, 1998; St. -Maurice and Kissack, 2000), and ion thermal instability (Kagan and Kelley, 2000; Dimant and Oppenheim, 2004). These plasma instabilities serve to explain the plasma density irregularities that for many years have been observed in the E-region ionosphere by radar and sounding rockets.
Analytical kinetic models of plasma instabilities can accurately describe plasma wave growth and decay, but this often requires numerous approximations, such as eliminating nonlinear terms and simplifying collisional components. Such approximations can limit their applicability. Kinetic simulations of plasma using particle-in-cell (PIC) codes can also solve for wave evolution but can consume a lot of computer power and apply to only a limited range of parameters. For example, Oppenheim et al. (2008) expended 4 years of CPU time to simulate a 2-D patch of plasma for a quarter of a second, although the simulation required less than 24 h of wall clock time using a supercomputer (see also Oppenheim and Dimant, 2004, Oppenheim and Dimant, 2013, and Oppenheim et al., 2020)]. It is therefore practical to develop a fluid analytical kinetic model which is more computationally efficient than the PIC model while, at the same time, is able to capture the development of kinetic plasma instabilities.
Such a model will need to assume a 0th-order ion distribution function which is not Maxwellian due to the Pedersen drift and collisions with the neutrals. To develop an accurate analytical kinetic model of plasma instabilities in the E-region ionosphere, we need to understand how the electric fields in the electrojets affect the background ion distribution function.
In the ionosphere, strong DC electric fields develop in two places: in high magnetic latitudes and within a few degrees of the magnetic equator. The electric fields in the auroral electrojet come from the current mapping between the magnetosphere and the ionosphere near the poles, while the electric fields in the equatorial electrojet come from the E-region dynamo effect driven by the zonal wind (Kelley, 2009). In the latter case, the zonal wind velocity
The E-region ionosphere is weakly ionized, with neutrals outnumbering ions by more than
If the external DC electric field in the electrojet is strong enough, it can leads to a large anisotropy in the ion distribution function with clear distortions from the Maxwellian. St-Maurice and Schunk (1979) developed the theory and showed observational evidence for non-Maxwellian ion distribution functions in the high-latitude E- and F-regions. The DC electric field can be especially strong at high latitudes during geomagnetic storms. Compared to the high-latitude E- and F-regions, the equatorial E-region has less intense electric fields, so we expect the typical distortion in the ion distribution to be smaller. Still, even there, extreme geomagnetic storms can intensify the electric fields enough to deviate the ion distribution function significantly from the Maxwellian.
Our study develops a collisional plasma kinetic model which relates the intensity of the external electric field to the ion velocity distribution function. We restrict our treatment to a spatially uniform and quasi-steady ionosphere which represents the background for developing instabilities. To describe the ion-neutral collisions, our kinetic model uses the BGK collision operator (Bhatnagar et al., 1954), which is a mathematically simple way of describing plasma collisions (Nicholson, 1983). Despite its inaccuracy, this simplified operator conserves the particle number and the average momentum and energy of the colliding particles. A hybrid simulation by Kovalev et al. (2008), based on the BGK collision term for ions, gave results comparable to the more accurate hybrid and full PIC simulations (Janhunen, 1995; Oppenheim et al., 1995; Oppenheim et al., 1996; Oppenheim et al., 2008; Oppenheim and Dimant, 2004; Young et al., 2020). Else et al. (2009) found that the constant collision rate BGK model agrees with a more realistic constant mean free path model in regimes where the Pedersen velocity is less than or comparable to the neutral thermal velocity. In this study, we quantify the accuracy of a BGK plasma kinetic model by comparing the analytical results to results from a more accurate fully kinetic PIC simulation.
The paper is organized as follows. Section 2 describes the simulation methods. Section 3 presents the analytical model and compares it to the simulation results. Section 4 discusses the discrepancies between the analytical results and the simulation. Section 5 summarizes our major results and forecasts future research.
2 Simulation methods
We used an EPPIC—electrostatic parallel plasma-in-cell simulator—to simulate the E-region background ions. EPPIC, like other particle-in-cell (PIC) codes, simulates plasma as individual particles. This enables PIC simulations to reproduce the kinetic behaviors of plasma. We are interested in the kinetic behavior of plasma—that is, the distortion of the ion distribution function. For more information about PIC codes, see Birdsall and Langdon (1991). For detailed explanations of EPPIC, see Oppenheim and Dimant (2004), Oppenheim et al. (2008), and Oppenheim and Dimant (2013).
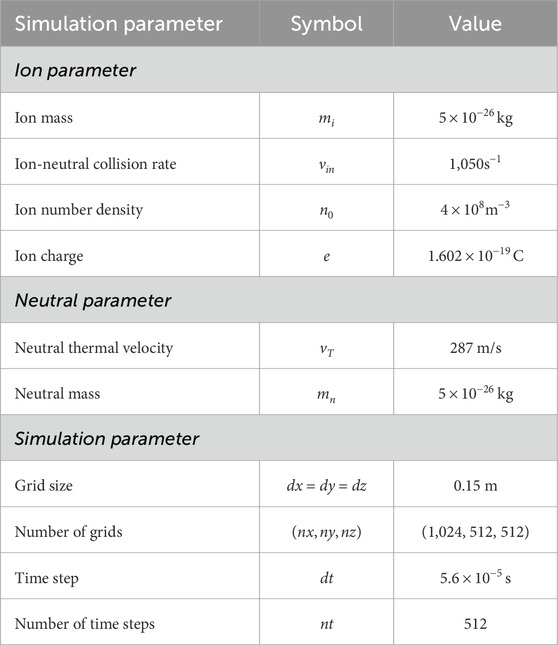
We set the magnetic field to zero in our simulation because the E-region background ions are unmagnetized. We also excluded electrons from our simulation, using instead a uniform background electron plasma that does not respond to any fields. We did this to avoid cross-drift between highly magnetized electrons and highly collisional background ions which would have led to internally generated electric fields and the Farley–Buneman instability (Farley, 1963; Buneman, 1963). This paper only explores the physics of the ion distribution function independent of the electron generated fields. EPPIC simulates background ions as PIC particles and neutrals as a uniform, constant background. Our simulation is in three dimensions (3-D), even though a two-dimensional (2-D) simulation would have sufficed for the behavior we were interested in. Table 1 gives the simulation parameters.
The E-region background ions are highly collisional with the neutrals. In our simulation, we used a constant ion-neutral collision rate which does not depend on the particle’s velocity. This is analogous to the Maxwell molecule collision model in Schunk and Nagy (2009) which results in a velocity-independent collision rate. EPPIC employs a statistical method of applying collisional effects to ions. At each time step, it designates a number of ions for collision in accordance with the ion-neutral collision rate specified in the input deck; it then chooses that number of PIC particles at random, independent of ion location and velocity. For each collision, the code creates a neutral molecule assuming a random thermal distribution with the specified neutral temperature and velocity. The algorithm then collides the PIC ion and the neutral, assuming conservation of energy and momentum, changing the ion’s momentum. The algorithm then tabulates the neutral momentum and energy change and discards detailed information about the neutral particle. In the E-region, neutrals are many orders of magnitude more numerous than ions [
Section 3.2 details the specific simulation setup as well as the analysis methods used for the simulation results.
3 Results
3.1 Analytical model of the background ion distribution function
3.1.1 Derivation of the distorted ion distribution function
The simplest kinetic equation for the ion distribution function (IDF) with the Bhatnagar–Gross–Krook (BGK) collision term (Bhatnagar et al., 1954) is given by
where
The function
Below, we only consider the background conditions with the externally imposed electric field before developing any instabilities,
where
Here,
and
where
Plugging Equation 5 into Equation 3 and solving the latter yields
where
where
The solution in the form of Equation 8 automatically conserves the number of particles and provides the correct expressions for the Pedersen velocity and effective temperature (see below), as can be deduced from the following integral relationships:
Figure 1 shows the normalized ion distribution function in Equation 8 for four values of
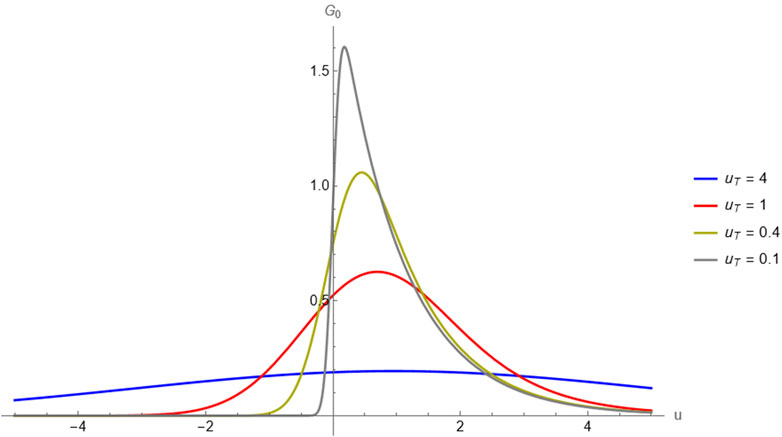
Figure 1. Normalized ion distribution function (IDF) for four values of
3.1.2 Distortion of the ion distribution function in the low and high
The antisymmetrical error function,
Using the bottom approximation from Equation 10, we can show that in the limit where
This corresponds to
The low
is only slightly higher than
In the high
3.2 Background ion distribution functions from the PIC simulation
3.2.1 Kinetic simulation of highly collisional, unmagnetized,
Our model from Section 3.1 predicts that the background ion distribution function (IDF) will distort away from Maxwellian when
1.
2.
3.
4.
As before,
Our simulation includes one ion species, one neutral species, and no electrons. The imposed electric field
Table 1 gives the parameters used across all simulation cases.
3.2.2 Normalization of the discrete ion velocity distribution from the simulation
The simulation outputs a
and similarly for
To facilitate the comparison with the theory, we normalize
where
3.2.3 Normalization of the continuous ion velocity distribution from the theory
The continuous one-dimensional ion distribution function in the direction parallel to
where we incorporate the result in the low
For the directions perpendicular to
where
To facilitate the comparison with the simulation results, we normalize
where
3.2.4 Choice of
Although EPPIC used the ion-neutral collision rate
The expression on the left-hand side of Equation 15 is the first velocity moment of
We numerically calculated both sides of Equation 15 for
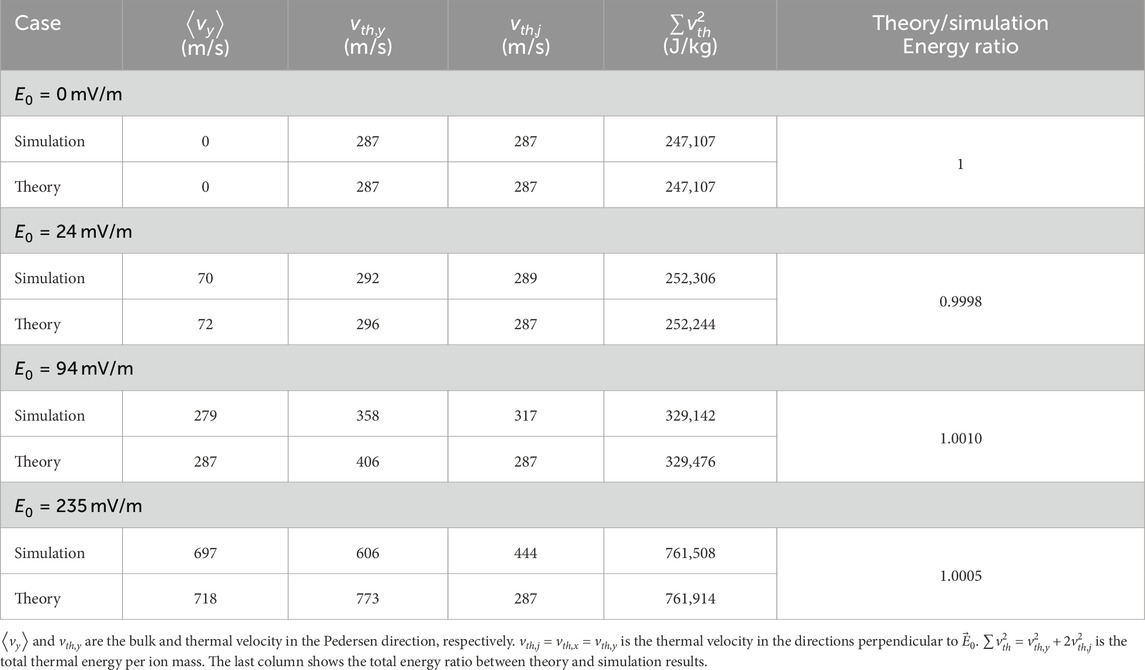
Table 2 shows the matching bulk velocities for the effective
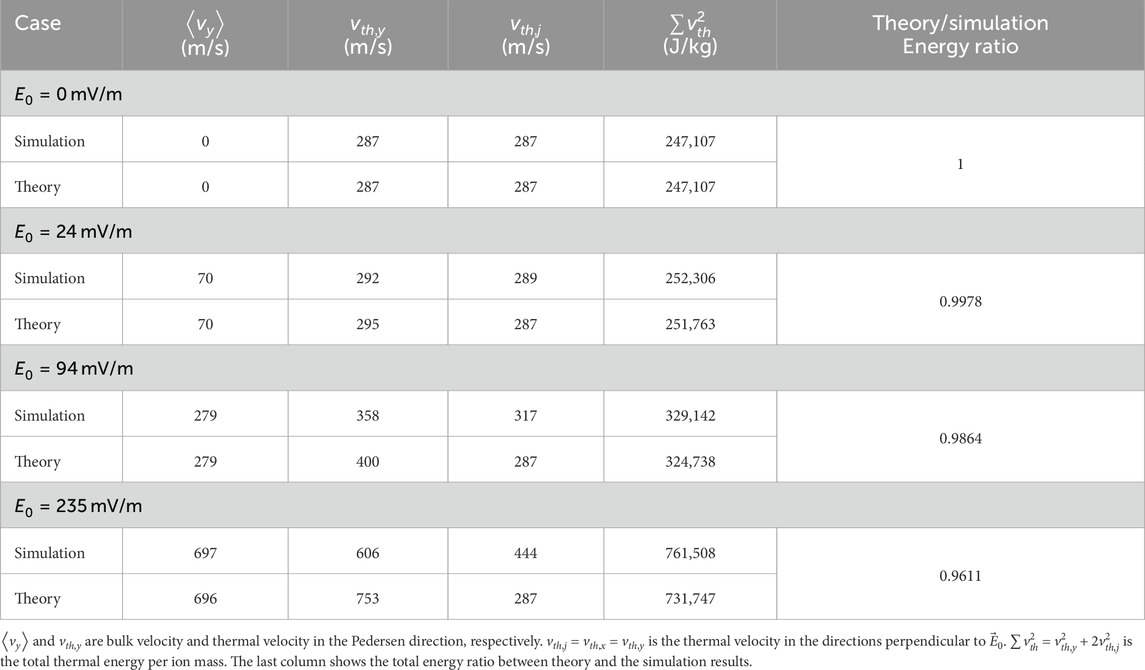
Table 2. Bulk velocities, directional thermal velocities, and total thermal energies for the effective
3.3 Comparison of the theoretical and simulated ion distribution functions
Figure 2A compares the theoretical and simulated ion distribution functions in the Pedersen direction—that is, the direction parallel to
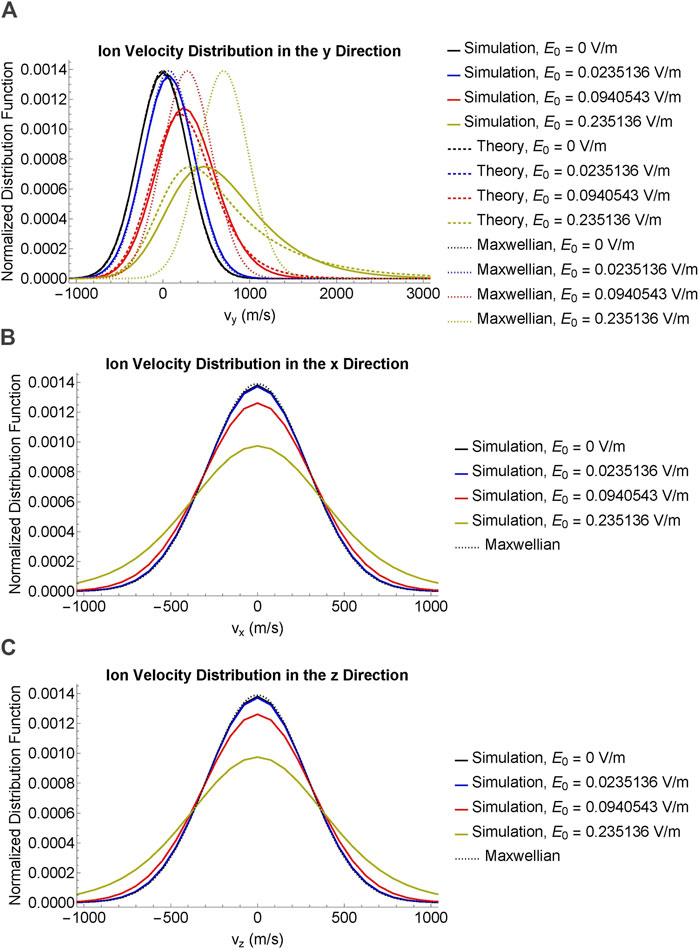
Figure 2. Comparison of simulated (solid) and theoretical (dashed) ion velocity distribution functions. Maxwellian functions (dotted) are included for comparison. The imposed electric field strengths are
In the Pedersen direction, both the theory and the simulation results show ion heating beyond the Maxwellian, although the exact shapes of the distribution differ between the theory and the simulation results. The theoretical ion distribution functions are further right-skewed compared to the simulation, although both are right-skewed compared to the Maxwellian.
Figures 2B, C show the simulated ion distribution functions in directions perpendicular to
Table 2 reports the bulk and thermal velocities from the theory and simulation. Section 4 discusses the results in more detail.
4 Discussion
In this section, we mostly discuss discrepancies between the analytical results of Section 3.1 and the PIC simulations. On the one hand, the analytical model (hereinafter referred to as “theory”) is not perfectly accurate because it is based on the oversimplified BGK collision model. As a result, the theoretical 3-D shape of the ion distribution function turns out to be less accurate than the PIC-derived equivalent (over-distorted in the electric field direction and undisturbed Maxwellian in the two perpendicular directions). On the other hand, the integrated fluid characteristics, such as the ion bulk velocity and the total ion temperature, elevated due to frictional heating by the external electric field, should be accurately represented by this theory, even in the cases of very strong electric fields that result in efficient distortions of the ion distribution function. If there still remain small discrepancies, they may be attributed to imperfectly matching collision rates and to the velocity integration of the PIC determined ion distribution function being performed within an artificially restricted velocity domain. This is especially relevant to the strongly distorted ion distribution function when its high-energy tail can include a noticeable fraction of particles.
4.1 Thermal velocity mismatch between theory and simulation results
The simulated ion distribution functions show different thermal profiles from those predicted by the theory.
4.1.1 Definition of thermal velocity
For the theory, the thermal velocity in the Pedersen direction is defined in terms of the second velocity moment of the ion distribution function:
where
For the simulation results, the thermal velocity in direction
where
Table 2 shows the mismatch in directional heating between the theory and the simulation results. Section 4.1.2 discusses ion heating in directions perpendicular to
4.1.2 Underestimation of the thermal velocity in the directions
The theory underestimates the ion heating in the directions perpendicular to
For larger values of
4.1.3 Overestimation of thermal velocity in the direction
The theory overestimates the heating in the Pedersen direction. In the
For larger values of
4.1.4 Angular scattering of ions due to elastic collisions with the neutrals
The major difference between the theory and the simulation is the angular scattering of ions in 3-D. The theory models ion heating only in the Pedersen direction; it does not account for ions scattering into directions perpendicular to
We expect the total ion thermal energy to be the same between the theory and the simulation. Section 4.2 compares the total energy between the theory and the simulation.
4.2 Discrepancy in total energy between the theory and the simulation results
The total ion thermal energy differs between the theory and the simulation results. Table 2 gives the total thermal energy per ion mass as well as the total thermal energy ratio between the theory and the simulation results. Although the ratios are close to 1, the total thermal energy from the theory is consistently lower than the total thermal energy from the simulation. Larger values of
A possible explanation for the discrepancy in total energy is our choice of
Comparing Tables 2, 3 shows how sensitive the theoretical IDF is to the value of
4.3 Distortion of the ion distribution function in the equatorial E-region
A typical DC electric field strength in the equatorial E-region is
In the Pedersen direction, the theory predicts a thermal velocity of 295 m/s, while the simulation shows a thermal velocity of 294 m/s. In the directions perpendicular to the Pedersen direction, the simulation shows a thermal velocity of 291 m/s. These numbers are not so different from the Maxwellian thermal velocity of 287 m/s.
The background ion distribution in the equatorial E-region is not likely to distort much from the Maxwellian because the electric field is not strong enough. Both the theory and the simulation show that the distortion is stronger when
5 Conclusion
We developed a collisional plasma kinetic model for E-region background ions using the simple BGK collision operator (Section 3.1). This simplified analytical model results in the ion distribution function (IDF) distorted in the direction of the external DC electric field
We compared this simplified model to the PIC simulation (Section 3.2). The simulation shows less ion heating in the Pedersen direction and more ion heating in the perpendicular directions than the analytical model. The difference in the thermal distribution is due to the ion angular scattering which, unlike the model, is present in the PIC code. There is also a small difference in the total thermal energy between the model and the simulation (Table 2). We have shown that the BGK model is sensitive to the choice of the ion-neutral collision rate, as shown by the alternate results in Table 3 which curiously give a total thermal energy that matches exactly with the simulation despite being unable to reproduce the ion bulk velocity. Still, the difference in Table 2 is not big enough to be consequential. The BGK model shows an overall similar total thermal energy to the PIC simulation.
The shapes of the ion distribution functions differ between the BGK model and the PIC simulation. The more accurate IDF determined by the PIC simulation is somewhere between the analytically determined IDF and the Pedersen-shifted Maxwellian distribution whose temperature equals the total elevated ion temperature. The latter, however, does not show any IDF skewness which is present in both analytical model and PIC simulations.
For the typical electric field strength of the equatorial E-region, the background ion distribution function is well-represented by the shifted and heated Maxwellian function. The situation may be very different at high latitudes where a strong external field may be present during periods of geomagnetic storms. Both the model and the PIC simulation show that, in these cases, the background ion velocity distribution can distort significantly from any Maxwellian. Any accurate model of plasma instabilities in a strongly driven E-region ionosphere must account for the potential non-Maxwellian distribution of the background ions. This modified distribution function can serve as the starting point when evaluating plasma wave growth characteristics using linear kinetic theory.
Data availability statement
The raw data supporting the conclusions of this article will be made available by the authors, without undue reservation.
Author contributions
RK: investigation, writing–original draft, and writing–review and editing. YD: conceptualization, methodology, writing–original draft, and writing–review and editing. MO: supervision, writing–review and editing, and software.
Funding
The authors declare that financial support was received for the research, authorship, and/or publication of this article. This work was funded by NASA Grants 80NSSC21K1322 and 80NSSC19K0080.
Acknowledgments
Computational resources were provided by the Anvil supercomputer through the NSF/ACCESS program.
Conflict of interest
The authors declare that the research was conducted in the absence of any commercial or financial relationships that could be construed as a potential conflict of interest.
The handling editor JC declared a past co-authorship with the author MO.
Publisher’s note
All claims expressed in this article are solely those of the authors and do not necessarily represent those of their affiliated organizations, or those of the publisher, the editors, and the reviewers. Any product that may be evaluated in this article, or claim that may be made by its manufacturer, is not guaranteed or endorsed by the publisher.
References
Bhatnagar, P. L., Gross, E. P., and Krook, M. (1954). A model for collision processes in gases. I. Small amplitude processes in charged and neutral one-component systems. Phys. Rev. 94, 511–525. doi:10.1103/PhysRev.94.511
Buneman, O. (1963). Excitation of field aligned sound waves by electron streams. Phys. Rev. Lett. 10, 285–287. doi:10.1103/PhysRevLett.10.285
Chen, F. F. (2016). Introduction to plasma physics and controlled fusion. doi:10.1007/978-3-319-22309-4
Dimant, Y. S., and Oppenheim, M. M. (2004). Ion thermal effects on E-region instabilities: linear theory. J. Atmos. Solar-Terrestrial Phys. 66, 1639–1654. doi:10.1016/j.jastp.2004.07.006
Dimant, Y. S., Oppenheim, M. M., and Fletcher, A. C. (2016). Generation of electric fields and currents by neutral flows in weakly ionized plasmas through collisional dynamos. Phys. Plasmas 23, 084503. doi:10.1063/1.4961085
Dimant, Y. S., and Sudan, R. N. (1995). Kinetic theory of low-frequency cross-field instability in a weakly ionized plasma. II. Phys. Plasmas 2, 1169–1181. doi:10.1063/1.871395
Dimant, Y. S., and Sudan, R. N. (1997). Physical nature of a new cross-field current-driven instability in the lower ionosphere. J. Geophys. Res. 102, 2551–2564. doi:10.1029/96JA03274
Else, D., Kompaneets, R., and Vladimirov, S. V. (2009). On the reliability of the Bhatnagar-Gross-Krook collision model in weakly ionized plasmas. Phys. Plasmas 16, 062106. doi:10.1063/1.3152329
Farley, J. D. T. (1963). A plasma instability resulting in field-aligned irregularities in the ionosphere. J. Geophys. Res. 68, 6083–6097. doi:10.1029/JZ068i022p06083
Fujii, R., Oyama, S., Buchert, S. C., Nozawa, S., and Matuura, N. (2002). Field-aligned ion motions in the E and F regions. J. Geophys. Res. Space Phys. 107, 1049. doi:10.1029/2001JA900148
Hoh, F. C. (1963). Instability of penning-type discharges. Phys. Fluids 6, 1184–1191. doi:10.1063/1.1706878
Janhunen, P. (1995). On recent developments in E-region irregularity simulations and a summary of related theory. Ann. Geophys. 13, 791–806. doi:10.1007/s00585-995-0791-7
Kagan, L. M., and Kelley, M. C. (2000). A thermal mechanism for generation of small-scale irregularities in the ionospheric E region. J. Geophys. Res. 105, 5291–5303. doi:10.1029/1999JA900415
Kovalev, D. V., Smirnov, A. P., and Dimant, Y. S. (2008). Modeling of the Farley-Buneman instability in the E-region ionosphere: a new hybrid approach. Ann. Geophys. 26, 2853–2870. doi:10.5194/angeo-26-2853-2008
Maeda, K., Tsuda, T., and Maeda, H. (1963). Theoretical interpretation of the equatorial sporadic E layers. Phys. Rev. Lett. 11, 406–407. doi:10.1103/PhysRevLett.11.406
Oppenheim, M., Dimant, Y., Longley, W., and Fletcher, A. C. (2020). Newly discovered source of turbulence and heating in the solar chromosphere. Astrophysical J. 891, L9. doi:10.3847/2041-8213/ab75bc
Oppenheim, M., Otani, N., and Ronchi, C. (1995). Hybrid simulations of the saturated Farley-Buneman instability in the ionosphere. Geophys. Res. Lett. 22, 353–356. doi:10.1029/94GL03277
Oppenheim, M., Otani, N., and Ronchi, C. (1996). Saturation of the Farley-Buneman instability via nonlinear electron E×B drifts. J. Geophys. Res. 101, 17273–17286. doi:10.1029/96JA01403
Oppenheim, M. M., Dimant, Y., and Dyrud, L. P. (2008). Large-scale simulations of 2-D fully kinetic Farley-Buneman turbulence. Ann. Geophys. 26, 543–553. doi:10.5194/angeo-26-543-2008
Oppenheim, M. M., and Dimant, Y. S. (2004). Ion thermal effects on E-region instabilities: 2D kinetic simulations. J. Atmos. Solar-Terrestrial Phys. 66, 1655–1668. doi:10.1016/j.jastp.2004.07.007
Oppenheim, M. M., and Dimant, Y. S. (2013). Kinetic simulations of 3-D Farley-Buneman turbulence and anomalous electron heating. J. Geophys. Res. Space Phys. 118, 1306–1318. doi:10.1002/jgra.50196
Robinson, T. R. (1998). The effects of small scale field aligned irregularities on E-region conductivities: implications for electron thermal processes. Adv. Space Res. 22, 1357–1360. doi:10.1016/S0273-1177(98)80034-3
Saint-Maurice, J. P., and Hanson, W. B. (1982). Ion frictional heating at high latitudes and its possible use for an in situ determination of neutral thermospheric winds and temperatures. J. Geophys. Res. 87, 7580–7602. doi:10.1029/JA087iA09p07580
Schunk, R., and Nagy, A. (2009). Ionospheres: physics, plasma physics, and chemistry. Cambridge atmospheric and space science series (Cambridge University Press), 2.
Simon, A. (1963). Instability of a partially ionized plasma in crossed electric and magnetic fields. Phys. Fluids 6, 382–388. doi:10.1063/1.1706743
St. -Maurice, J. P., and Kissack, R. S. (2000). The role played by thermal feedback in heated Farley-Buneman waves at high latitudes. Ann. Geophys. 18, 532–546. doi:10.1007/s00585-000-0532-x
St-Maurice, J. P., and Schunk, R. W. (1979). Ion velocity distributions in the high-latitude ionosphere. Rev. Geophys. Space Phys. 17, 99–134. doi:10.1029/RG017i001p00099
Watanabe, S., Whalen, B. A., Wallis, D. D., and Pfaff, R. F. (1991). Observations of ion-neutral collisional effects in the auroral E region. J. Geophys. Res. 96, 9761–9771. doi:10.1029/91JA00561
Young, M. A., Oppenheim, M. M., and Dimant, Y. S. (2020). The farley-buneman spectrum in 2-D and 3-D particle-in-cell simulations. J. Geophys. Res. Space Phys. 125, e27326. doi:10.1029/2019JA027326
Keywords: ion distribution function, BGK collision operator, Maxwell molecule collision model, Pedersen conductivity, PIC simulation, plasma instabilities, ion temperature anisotropy, E-region electrojet
Citation: Koontaweepunya R, Dimant YS and Oppenheim MM (2024) Non-Maxwellian ion distribution in the equatorial and auroral electrojets. Front. Astron. Space Sci. 11:1478536. doi: 10.3389/fspas.2024.1478536
Received: 09 August 2024; Accepted: 11 November 2024;
Published: 12 December 2024.
Edited by:
Jorge Luis Chau, Leibniz Institute of Atmospheric Physics (LG), GermanyReviewed by:
Marco Milla, Pontifical Catholic University of Peru, PeruMagnus Ivarsen, University of Oslo, Norway
Copyright © 2024 Koontaweepunya, Dimant and Oppenheim. This is an open-access article distributed under the terms of the Creative Commons Attribution License (CC BY). The use, distribution or reproduction in other forums is permitted, provided the original author(s) and the copyright owner(s) are credited and that the original publication in this journal is cited, in accordance with accepted academic practice. No use, distribution or reproduction is permitted which does not comply with these terms.
*Correspondence: Rattanakorn Koontaweepunya, cmFrb29uQGJ1LmVkdQ==
 Rattanakorn Koontaweepunya
 Yakov S. Dimant
 Meers M. Oppenheim