 B. Michotte de Welle
 N. Aunai
 B. Lavraud2
 A. Jeandet
 G. Nguyen
 A. Ghisalberti
- 1CNRS, Ecole Polytechnique, Sorbonne Université, Université Paris Sud, Observatoire de Paris, Institut Polytechnique de Paris, Université Paris-Saclay, PSL Research Univsersity, Laboratoire de Physique des Plasmas, Palaiseau, France
- 2Laboratoire d’Astrophysique de Bordeaux, Université Bordeaux, CNRS, Pessac, France
- 3Institut de Recherche en Astrophysique et Planétologie, CNRS, Université de Toulouse, CNES, Toulouse, France
- 4DPHY, ONERA, Université de Toulouse, Toulouse, France
The properties of the magnetosheath are of pivotal importance in determining the coupling between the magnetosphere and interplanetary medium. In particular, the magnetic flux pileup and plasma depletion layer (PDL) modify the boundary conditions of magnetopause reconnection. However, the spatial distribution of the magnetic field strength and plasma density in the magnetosheath and their functional dependence on the interplanetary magnetic field (IMF) orientation remain poorly understood. This study characterizes these aspects in detail through the statistical processing of decades of data from Cluster, Double Star, THEMIS, and Magnetospheric Multiscale (MMS) missions. The first part of this study focuses on the poorly known variations across the magnetosheath, from the shock to the magnetopause. The magnetic pileup and PDL are significantly correlated, with a strong dependence on the IMF cone angle. Their dependence on the IMF clock angle is found only near the magnetopause, consistent with the expected effect of magnetic reconnection. The second part of this study examines the asymmetry in the magnetic field amplitude and density between the quasi-parallel and quasi-perpendicular sides of the equatorial magnetosheath. These asymmetries are characterized for different relative distances to the magnetopause and bow shock boundaries and for different IMF orientation. The magnetic field amplitude, observed to be higher on the quasi-perpendicular side of the magnetosheath, becomes more symmetric as it approaches the magnetopause. The quasi-parallel magnetosheath exhibits a higher plasma density near the magnetopause. However, this asymmetry reverses at approximately the mid-magnetosheath with a decreasing IMF cone angle.
1 Introduction
Upon reaching the Earth’s magnetosphere obstacle, the solar wind decelerates to a subsonic speed, compresses, and experiences a significant increase in the amplitude of the interplanetary magnetic field (IMF) in a region called the magnetosheath. The fundamental properties of the magnetosheath, in particular the way the plasma and magnetic field are spatially distributed and structured in that region, greatly determine the subsequent evolution of the magnetosphere as they represent the immediate boundary condition for all processes occurring at the magnetopause. This includes magnetic reconnection, the process known to open the magnetosphere to incoming solar wind and interplanetary magnetic flux. The main parameter governing how reconnection proceeds at the magnetopause is probably the orientation of the IMF and, more concretely, the specific way the IMF drapes around the magnetopause and establishes a more or less pronounced magnetic shear across the boundary. The draping of the magnetic field and the subsequent magnetic shear at the magnetopause have thus been studied and used in many works to constrain magnetic reconnection therein (Kobel and Fluckiger, 1994; Cooling et al., 2001; Romashets and Vandas, 2019; Trattner et al., 2021; Michotte de Welle et al., 2022). However, magnetic reconnection will also be greatly impacted by the magnetic field amplitude and plasma density distribution adjacent to the magnetopause since these quantities primarily control the rate at which the IMF is reconnected to the geomagnetic field (Cassak and Shay, 2007). Much less is known, however, about the spatial variation of field amplitude and plasma density throughout the magnetosheath and up to the close proximity of the magnetopause. Investigating spatial profiles in the magnetosheath and their dependence on upstream interplanetary conditions is challenging from an observational standpoint due to the local character of in situ measurements, the entanglement of the inherent temporal and spatial variations, and the scarcity of data.
On a large scale and as a first approximation, the interplanetary magnetic flux and plasma cannot penetrate the magnetopause. The plasma and magnetic flux thus have no other way than to pile up on the obstacle and flow around it. The reality is, however, a bit more complex than this simple picture, which was originally obtained from gas dynamics models (Spreiter et al., 1966).
The first complexity arises from the interplay between the plasma and magnetic field, which do not independently pile up onto the magnetopause from one another. As the magnetic amplitude increases, the plasma is increasingly squeezed out and its density progressively drops near the magnetopause. This so-called depletion layer, theorized as a pure magnetohydrodynamics (MHD) effect (Zwan and Wolf, 1976), has been reported in various observations (Paschmann et al., 1978; Crooker et al., 1979; Hall et al., 1990; Sibeck et al., 1990; Song et al., 1990; Fuselier et al., 1991; Paschmann et al., 1993; Phan et al., 1994; Anderson et al., 1997; Pudovkin et al., 2001; Šafránková et al., 2002). This effect has also been observed and investigated in global MHD simulations (Wu, 1992; Wang et al., 2003; Wang et al., 2004a; Wang et al., 2004b; Borovsky et al., 2008), which have shown a high dependence on the solar wind Mach number. This is well understood since the Mach number essentially determines the plasma
The second complexity comes from the fact that the magnetic flux pileup and the associated plasma depletion layer are not only the coupled consequences of the large-scale impact of the magnetized solar wind with the impenetrable magnetospheric obstacle. In reality, magnetopause reconnection enables part of the magnetic and plasma fluxes to penetrate within the magnetosphere rather than flowing around it in the magnetosheath. Therefore, characterizing these features of the magnetosheath becomes even more complex when realizing that in nonlinear feedback, reconnection itself will impact how pronounced and deep the flux pileup and depletion layer, respectively, are (Anderson et al., 1997). Investigating the dependence of the magnetic flux pileup and plasma depletion layer properties on the upstream IMF orientation is important not only for better constraining magnetopause reconnection but also for understanding the extent to which reconnection influences these magnetosheath properties.
Several studies have thus specifically focused on the functional dependence of the flux pileup and plasma depletion layer (PDL) on the IMF orientation. In the absence of a solar wind monitoring spacecraft, this has often been done indirectly by correlating the PDL and pileup properties to the local magnetic shear at the magnetopause. These observations have revealed many interesting aspects of the pileup and PDL. Using straight crossings of the magnetopause from ISEE, Paschmann et al. (1978) identified PDL signatures in the data and estimated that the region had a thickness of approximately 0.1–0.3
By the early 2000s, research on the properties of the magnetic pileup and associated PDL started to lose momentum. The complexity of the system, unsteady upstream interplanetary conditions, magnetosheath turbulence, and scarcity of in situ single spacecraft measurements somehow hampered further progress. The precise characterization of the depth and thickness of the PDL and the intensity of the magnetic pileup, their precise functional dependence on the IMF orientation, and their spatial structure beyond the subsolar region were extremely difficult to investigate observationally. More global and parametric studies of the magnetic pileup and PDL properties became accessible only via well-resolved global MHD modeling (Wang et al., 2003; Wang et al., 2004a; Dorelli et al., 2004). Simulations revealed that isotropic MHD is enough to capture the essence of the PDL properties, and pressure anisotropies often observed in the PDL (Paschmann et al., 1993) are a consequence rather than a cause of the existence of the layer. They revealed that the PDL extends away from the subsolar region in magnetic local time and latitude although the magnetic and density profiles become increasingly shallower. Wang et al. (2004b) revealed a negligible dependence of the PDL structure on different IMF clock angles, varying from 0° to 45°. A parametric study for larger clock angles, which would allow a precise investigation of the role of reconnection, has never been performed. It is expected that radial IMF leads to weak or no global magnetic pileup and, thus, no PDL either. However, as for the clock angle, although accessible to modern numerical models, a parametric study on the pileup and PDL properties for varying IMF cone angles from 0° to 90° has never been performed.
Over the years, vast amounts of data have been accumulated from multiple missions spanning decades of explorations of the Earth’s magnetosphere and nearby interplanetary space. The compilation of large datasets has subsequently enabled us to revisit the problem of the spatial variations of fundamental plasma and field properties in the system. Several studies have, over the last decade, revisited the characterization of magnetosheath properties from a global and statistical perspective (Dimmock and Nykyri, 2013; Dimmock et al., 2014; 2016; 2020; Zhang et al., 2019; Ma et al., 2020; Michotte de Welle et al., 2022). Using a large dataset combining THEMIS and Cluster measurements, Zhang et al. (2019) showed that the profile of the magnetic amplitude reconstructed along the Sun–Earth line increases rather monotonously across the subsolar magnetosheath. They revealed that this profile depends on the IMF cone angle, with lower amplitudes for more radial IMFs, as expected. However, no dependence of the profile on the IMF clock angle was found. The magnetic profiles obtained in the study exhibit a sharp increase from the middle of the magnetosheath upon approaching the magnetopause. The authors suggested that these divergent profiles are the result of incorrect placement of magnetosphere measurements on the magnetosheath side of the magnetopause due to inaccuracies in the analytical boundary models that were used. The density profiles obtained throughout the subsolar magnetosheath typically exhibit a bell curve shape, from the bow shock to the magnetopause, independent of any interplanetary conditions, including the IMF orientation. The density shows a gradual decrease toward the magnetopause from the middle of the magnetosheath. However, being collocated with the aforementioned ramp of the magnetic field and independent of the IMF orientation, this gradual decrease is more likely the coarse-grained representation of the density transition across the magnetopause than the actual signature of the PDL. Resolving the PDL scale and, more generally, spatial variations across the magnetosheath thickness appears very challenging, particularly in the subsolar region, where the magnetosheath is typically thick of only few Earth radii. Improving ways to extract and reposition magnetosheath measurements appears as critical as using several measurements to lower statistical noise.
Studies using statistical spatial reconstructions have thus rather focused on the longitudinal variations and, more specifically, on characterizing and understanding the cause of the asymmetries observed between the dawn and dusk sides of the magnetosheath, particularly in the plasma density. Observations generally report a larger particle density on the dawn side than on the dusk side. Considering the average Parker spiral structure of the IMF, the dawn side typically tends to be the quasi-parallel side of the bow shock, making the IMF orientation a natural candidate for the source of the observed asymmetry. Using isotropic Rankine–Hugoniot MHD jump conditions and a modeled shock boundary, Walters (1964) theorized the existence of an asymmetry with somewhat larger densities on the quasi-parallel dayside magnetosheath just downstream of the bow shock. A clear correlation between the existence and level of the asymmetry and the IMF orientation has, however, not yet been firmly established. Paularena et al. (2001) reported 30% larger densities in the dawn nightside magnetosheath
Recently, Michotte de Welle et al. (2022) used a vast amount of data from multiple missions to reconstruct the structure of the magnetic field draping around the magnetopause. In this study, the key steps of magnetosheath data extraction and repositioning were significantly improved through the use of machine learning models. This enabled a detailed 3D and global reconstruction of the draping structure with unprecedented resolution, both spatially and in dependence on the upstream IMF orientation. The same technique was subsequently used to extract the plasma density along with the previously obtained magnetic field and reconstruct global maps of the magnetic shear, current density, and reconnection rate scaling law on the dayside magnetopause for any IMF clock and cone angle (Michotte de Welle et al., 2024). In this paper, we propose to use the same large magnetosheath dataset to revisit the problem of characterizing the magnetic flux pileup, plasma depletion layer, and density asymmetry in the dayside magnetosheath as a function of the IMF orientation. Section 2 provides a review of the key steps involved in the preparation of the dataset used in this study and performed by Michotte de Welle et al. (2022); Michotte de Welle et al. (2024) and explains the new technical aspects introduced in the current work. Section 3 presents the results obtained about the characterization of the magnetic flux pileup and PDL, while Section 4 focuses on those regarding the density asymmetry throughout the magnetosheath. Section 5 provides the discussion and conclusion of this study.
2 Methods
This study uses a multi-mission dataset of magnetosheath measurements, already used by Michotte de Welle et al. (2022); Michotte de Welle et al. (2024). Measurements have been pre-processed in these studies so that each data point is paired with upstream interplanetary conditions and repositioned in between a single pair of magnetopause and bow shock boundaries. The work described in this article starts with this ensemble of pre-processed magnetosheath data points. For the sake of clarity, this section briefly reviews the key steps of pre-processing, which are represented in Figure 1 and otherwise extensively detailed by Michotte de Welle et al. (2022); Michotte de Welle et al. (2024). Additionally, the spatial distribution of the measurements for each step of the pipeline of this study can be found in Michotte de Welle et al. (2024). Lastly, we detail the techniques specifically employed in this study to investigate spatial profiles across the subsolar magnetosheath and asymmetries between its quasi-parallel and quasi-perpendicular sides.
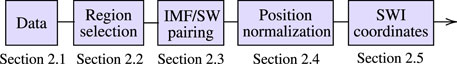
Figure 1. Overview of the pre-processing pipeline of Michotte de Welle et al. (2022) for preparing the dataset used in this study.
2.1 Data usage
The dataset compiles measurements obtained by Cluster, Double Star, THEMIS, and Magnetospheric Multiscale (MMS) missions. These missions have consistently provided data for a significant period of time on both equatorial and polar orbits with few limitations, making them ideal for automatic handling. Table 1 provides an overview of the missions, probes, periods, and instruments used in this study. The plasma and magnetic field measurements from all missions are resampled at 5 s resolutions. Additionally, the OMNI data (King and Papitashvili, 2005) are used, specifically including magnetic field, plasma bulk velocity, ion particle density, ion temperature, dynamic pressure, plasma beta, Mach number, and bow shock subsolar point position at 1-min resolution from 2000 to 2021, resampled at the same cadence as the previous data.
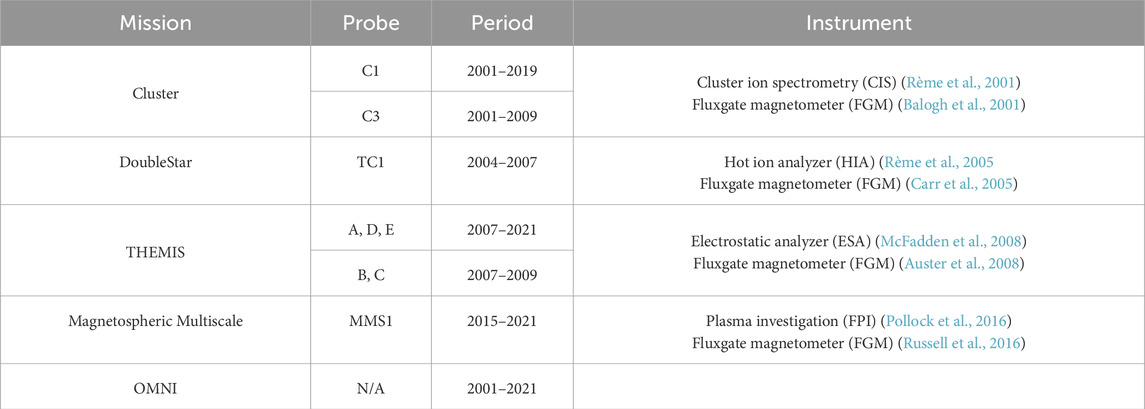
Table 1. Source of the in situ data.
2.2 Extraction of the magnetosheath measurements
The first step of data processing consisted of automatically selecting, per spacecraft, time intervals during which measurements were made in the dayside magnetosheath. To minimize erroneous selection of measurements in the magnetosphere or solar wind, a gradient-boosting classifier was used to extract in situ plasma data. The classifier, trained in previous studies (Michotte de Welle et al., 2022; Nguyen et al., 2022; Michotte de Welle et al., 2024), provides a point-wise classification of the data into the magnetosphere, solar wind, or magnetosheath regions based on plasma density, bulk velocity, temperature, and magnetic field. This first step ends with 50 million 5-s resolution magnetosheath measurements extracted across all considered spacecraft.
2.3 Pairing measurements with upstream solar wind properties
The second step consisted of pairing each measurement with an upstream solar wind and IMF condition. This is necessary in order to obtain the functional dependence of the magnetosheath properties on the IMF orientation by slicing our dataset for specific ranges of orientations. Another use of this pairing is to obtain the distance of each measurement to the magnetopause and bow shock boundaries from models parametrized by these interplanetary conditions. This relative distance estimate is needed to reposition data points in between a standard system of boundaries, as explained in the following section. Lastly, these paired interplanetary data are used to normalize the magnetosheath measurements. To account for the propagation up to the spacecraft, solar wind properties were selected at a time shifted from the measurement time using a propagation method adapted from Šafránková et al. (2002). An initial propagation time was estimated based on the spacecraft’s radial distance to the bow shock, where OMNI data are defined, and an average solar wind speed (400 km
2.4 Repositioning of measurements relative to the magnetopause and bow shock
Two points in the dataset with the same absolute position may be at vastly different distances from the magnetopause and bow shock due to potentially different solar wind and IMF conditions at the time of measurement. In order for studies such as this to avoid mixing measurements made at different relative distances from the boundaries, measurements in the dataset had to be repositioned between a single pair of boundaries to reflect their estimated relative distances accurately. The distance to the magnetopause and bow shock of each point was estimated by Michotte de Welle et al. (2022) using two gradient-boosting regression (GBR) models of the boundaries. These machine learning models predict the radial distance of the bow shock and magnetopause for a given angular direction and interplanetary conditions. They were trained on 30,000 (resp. 20,000) magnetopause (resp. bow shock) crossings. Analytical models have also been used to reposition measurements, as demonstrated by Zhang et al. (2019); Dimmock and Nykyri (2013); Dimmock et al. (2016). However, the significant error made in these models’ predictions, in comparison to the machine learning models, results in a larger spurious spatial mixing scale of measurements, thereby lowering the final spatial resolution. Due to the remaining inaccuracies in the boundary models or the prior error in determining the precise causal upstream interplanetary conditions, some measurements are found to be too far outside their predicted boundaries and are, therefore, discarded. After being repositioned, the magnetosheath dataset contains approximately 45 million measurements.
2.5 Solar wind interplanetary magnetic field coordinate system
The final step in making the dataset used in this study consisted of transforming the measurements from the GSM coordinate system to the solar wind interplanetary (SWI) magnetic field coordinate system (Zhang et al., 2019). This coordinate system ensures that each point is located in the appropriate sector of the magnetosheath, either quasi-parallel or quasi-perpendicular, based on its causal IMF. The
2.6 Reconstruction of the spatial profiles
The following paragraph explains the data processing specific to this study.
2.6.1 Reconstructed profiles through the subsolar magnetosheath
The first goal of this study is to characterize the spatial variation of the magnetic field amplitude and plasma density across the subsolar magnetosheath. This region is of particular interest due to the dominant component of the flow along the Sun–Earth line, which transports magnetic field lines directly from the bow shock to the magnetopause. Our working definition of the subsolar region is the cylinder enclosing all measurements made in a radius of 5 Re
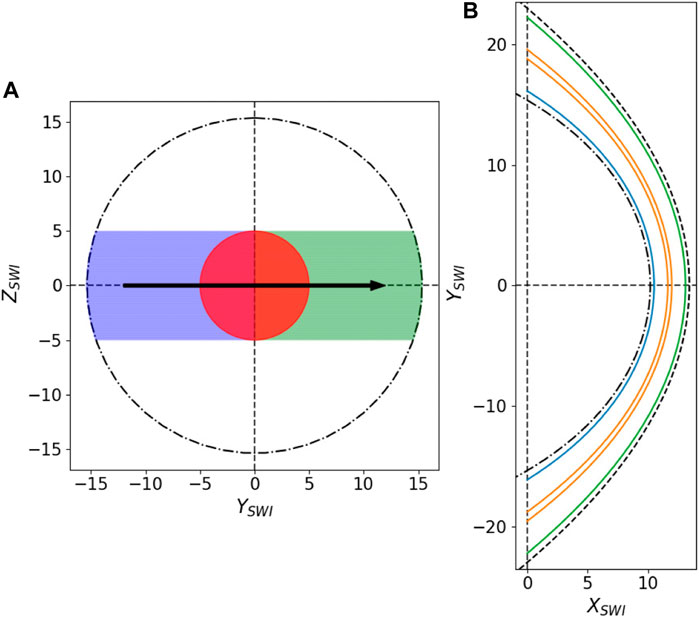
Figure 2. (A) Magnetopause terminator (dash-dotted line) viewed from the YZ plane in the SWI coordinate system. The dotted meridian at
The variations in the magnetic field amplitude and density are examined with respect to the position
2.6.2 Asymmetries between the quasi-parallel and quasi-perpendicular sides
The SWI coordinate system (see Section 2.5) is particularly useful for studying the asymmetries between the quasi-parallel and quasi-perpendicular sides of the magnetosheath.
We estimate the asymmetry, hereafter denoted as
This study will examine the asymmetry of the magnetic field and density within the magnetosheath at three distinct relative distances: near the magnetopause (
3 Magnetic amplitude and plasma density through the subsolar magnetosheath
3.1 Variability in the magnetic pileup with the IMF orientation
Figure 3 presents the profile of the magnetic field amplitude as a function of the relative position
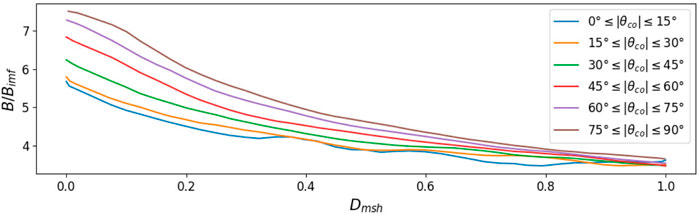
Figure 3. Magnetic field amplitude in the subsolar magnetosheath
As demonstrated by Michotte de Welle et al. (2022), the IMF cone angle has a significant influence on how the magnetic field drapes around the magnetopause. A key factor regarding how it also affects the field amplitude is that as the IMF becomes increasingly radial, it also becomes more aligned with the solar wind bulk velocity. The perpendicular component of the magnetosheath flow is geometrically smaller, thereby diminishing the rate at which magnetic flux is brought to the magnetopause boundary. Magnetic flux thus has more time to get around the obstacle without having to pile up against it, leading to overall smaller field amplitudes.
The behavior of the magnetic field is completely different when considering the impact of the IMF clock angle. Figure 4 shows the profile of the magnetic field amplitude as a function of
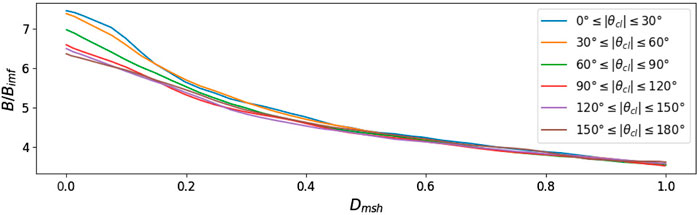
Figure 4. Magnetic field amplitude in the subsolar magnetosheath
The decrease in the flux pileup effect with increasing IMF clock angles is consistent with magnetic reconnection operating at the magnetopause with increasing efficiency. While the IMF is still northward for the
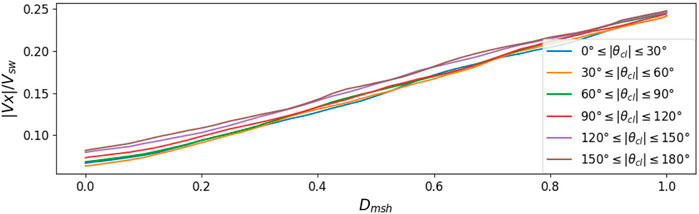
Figure 5. Profiles of the Vx component of the velocity in the subsolar magnetosheath
Let us now focus on how the magnetic field amplitude values vary as a function of both the IMF clock and cone angles, but only near the subsolar magnetopause. Figure 6 shows the values taken by the normalized magnetic field in the subsolar region near the magnetopause (
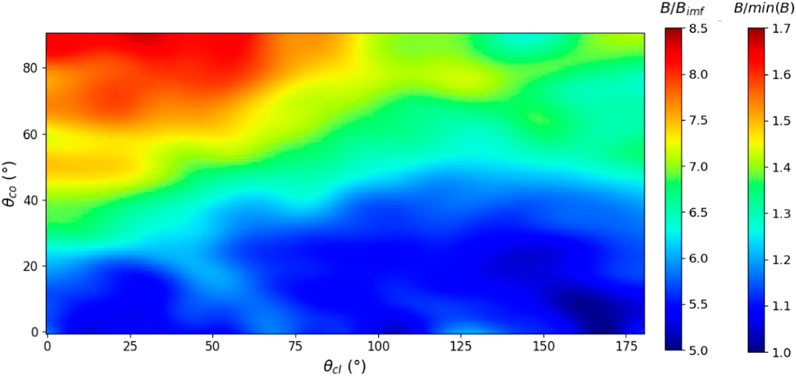
Figure 6. Magnetic pileup
3.2 Magnetosheath plasma density and depletion layer for various IMF orientations
We repeat the same procedure as in previous sections, but this time focusing on plasma density across the magnetosheath, particularly investigating the possible depletion layer near the magnetopause. We start by investigating the particle density profile as a function of the relative position across the subsolar magnetosheath for different IMF cone angles, considering all clock angles, as shown in Figure 7.
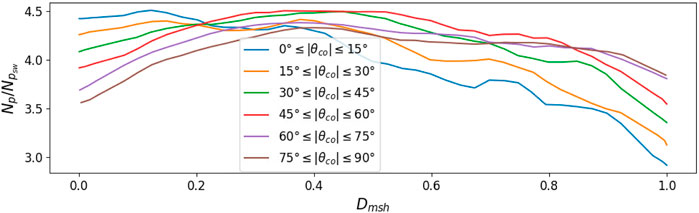
Figure 7. Ion density ratio
Near the bow shock, the density ratio increases with increasing IMF cone angle, reaching a maximum compression of approximately 4 when the IMF is almost perpendicular to the shock (
For the most radial IMF conditions (
Similarly to our investigation of the magnetic amplitude, we now investigate how the density profile changes for different IMF clock angles. Figure 8 presents the density profile as a function of the relative position
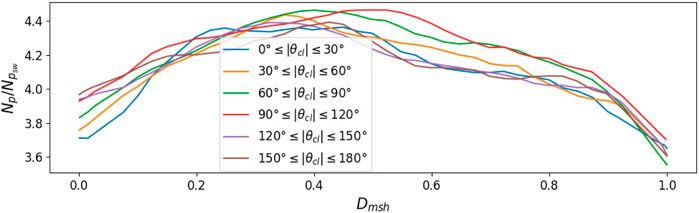
Figure 8. Ion density ratio
Let us now focus on the region near the magnetopause and observe in more detail how the density varies with both the IMF cone and clock angles. Figure 9 shows the density ratio in the subsolar region close to the magnetopause (
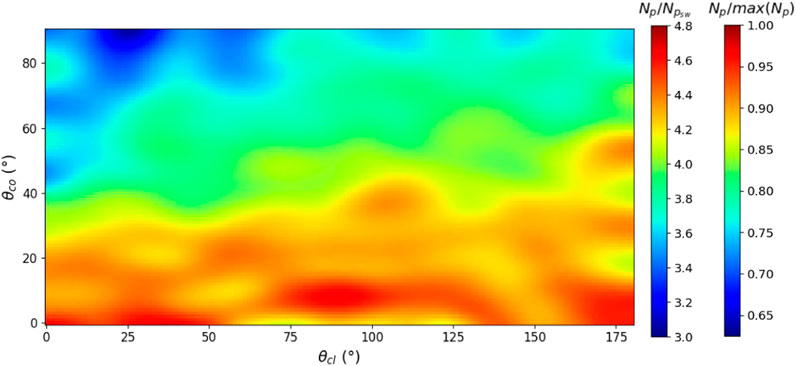
Figure 9. Density ratio
4 Asymmetry of the equatorial magnetosheath
4.1 Asymmetry of the magnetic field amplitude
The first part of this work focused on the state of the magnetosheath along the Sun–Earth line. We now focus on the longitudinal variations and, more specifically, on the asymmetries that may develop along that dimension. Previous studies investigating the amount of asymmetry in the dayside magnetosheath either looked at the asymmetries integrated through the whole magnetosheath thickness or those close to the magnetopause only. By covering the whole dayside magnetosheath volume, our dataset presents an interesting opportunity to get more local insight into the asymmetries. Thus, in this study, we will consider how the asymmetry also varies with the depth within the magnetosheath, from the bow shock to the magnetopause.
Figure 10 presents the amplitude of the magnetic field (left panels) along the
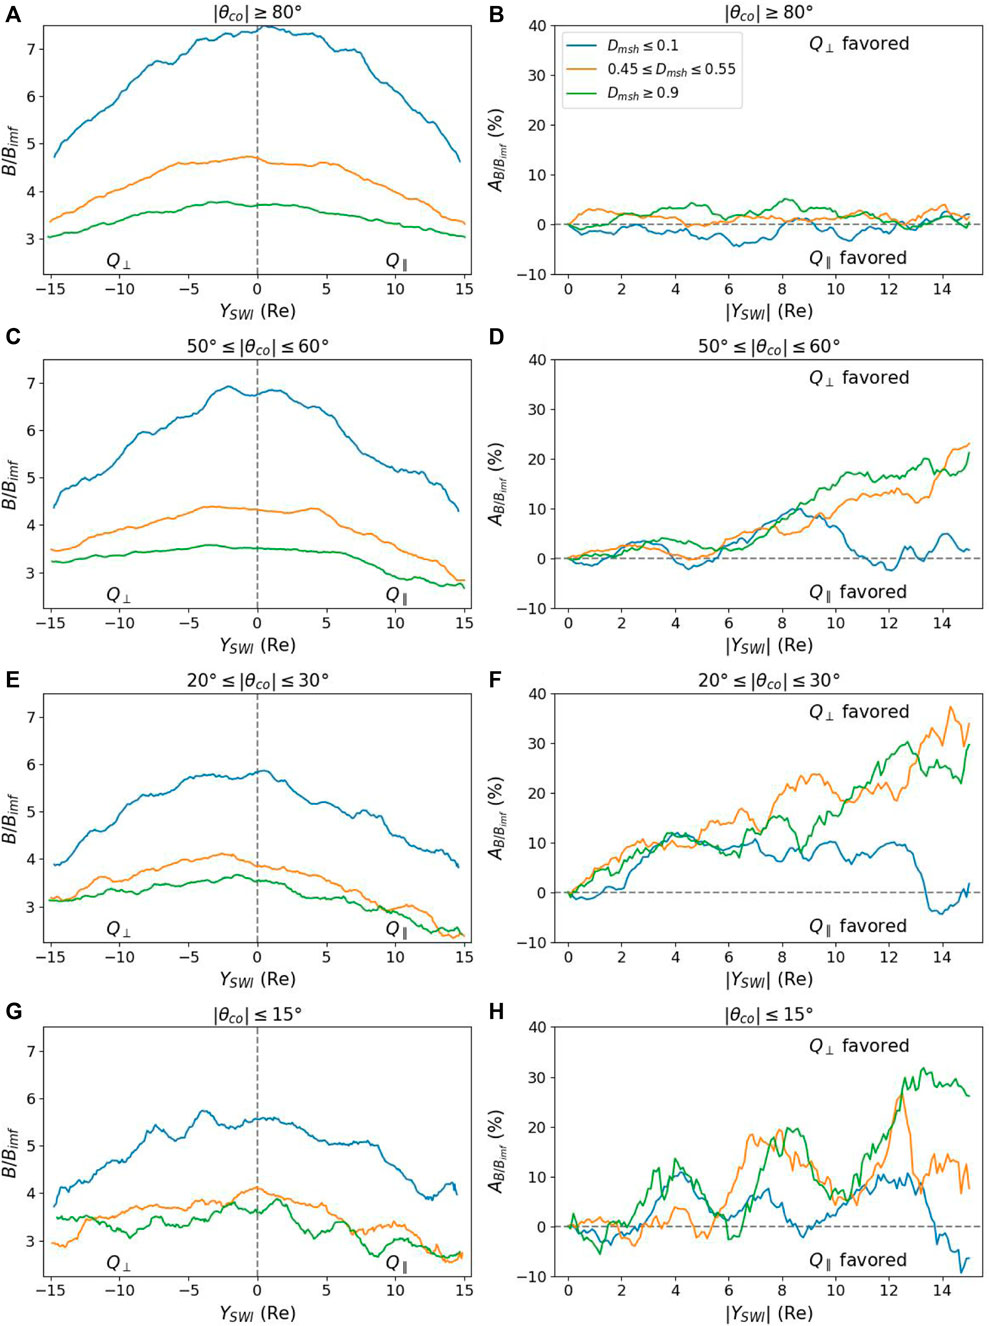
Figure 10. Left panels show the distribution of the magnetic field amplitude as a function of
For IMF cone angles greater than 80° (
An asymmetry starts to be visible for IMF cone angles of
For IMF cone angles of
Finally, for IMF cone angles of
The asymmetry is not uniform from the shock to the magnetopause. To get a clearer vision of the dependence on the depth in the magnetosheath, we can compute the asymmetry as previously for many different depth shells and plot the average asymmetry per shell. The result is shown in Figure 11, where the average asymmetry in the magnetic field amplitude between the quasi-parallel and quasi-perpendicular sides in the equatorial region as a function of the distance in the magnetosheath thickness
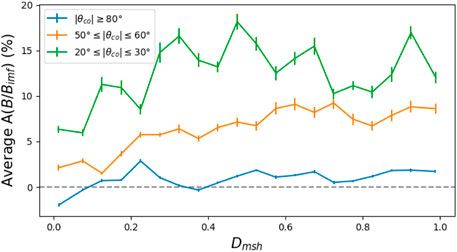
Figure 11. Average asymmetry
Overall, the asymmetry in the magnetic field amplitude between the quasi-perpendicular and quasi-parallel sides of the magnetosheath decreases as the IMF cone angle increases and presents smaller values at the magnetopause compared to the rest of the magnetosheath. It should be noted that no clear effect of the IMF clock angle on the magnetic field asymmetry was observed.
4.2 Asymmetry in the plasma density
Figure 12 presents the ratio of the plasma density and its asymmetry between the quasi-parallel
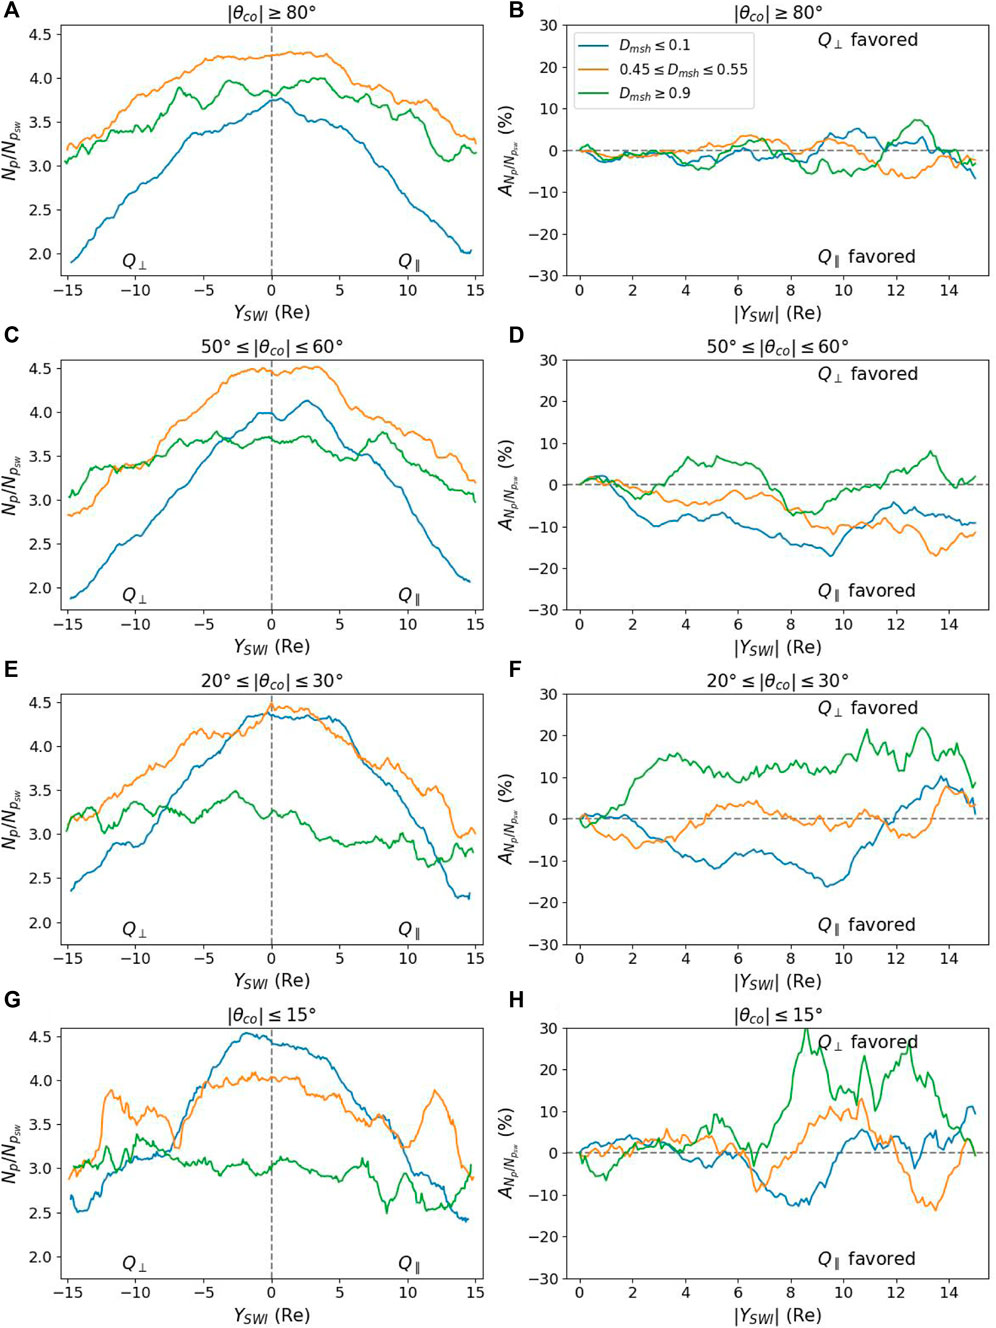
Figure 12. Left panels shows the distribution of the density ratio as a function of
For all IMF cone angles (left panels), the density in the flanks (
For IMF cone angles greater than 80° (
For IMF cone angles between 50° and 60° (50°
Panel e shows the density profile for IMF cone angles between 20° and 30° (
Finally, for IMF cone angles of
Figure 13 presents the asymmetry in the normalized density between the quasi-parallel and quasi-perpendicular sides in the equatorial region, averaged over
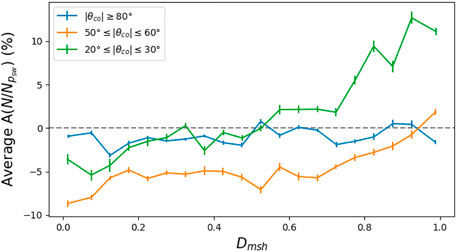
Figure 13. Average asymmetry
It should be noted that similar to the magnetic field, no clear effect of the IMF clock angle on the density asymmetry was observed.
5 Discussion and conclusion
The magnetosheath is the region where the solar wind and interplanetary magnetic field are altered before coming into contact with the magnetopause. Its characterization, therefore, constitutes a primary objective in understanding how the Earth magnetosphere couples with its surrounding environment. Despite decades of measurements, the spatial structure of macroscopic parameters such as density and magnetic field, which primarily control how reconnection occurs at the magnetopause, remains poorly understood. By using a comprehensive dataset based on decades of multi-mission measurements, we have, in this study, proposed to explore the spatial distributions of the plasma density and magnetic field amplitude and their functional dependence on the IMF orientation. The magnetic field pileup against the magnetopause and the subsequent monotonous increase in the magnetic amplitude throughout the magnetosheath are general properties of the system. The pileup is shown to be less pronounced as the IMF becomes increasingly aligned with the Sun–Earth axis, as expected from the smaller rate at which magnetic flux is carried against the obstacle. The dependence on the IMF clock angle is more subtle and only appears clearly in the first 40% of the magnetosheath from the magnetopause. The strength of the magnetic pileup decreases non-linearly as the IMF turns to the south, which is consistent with the expected effect of magnetic reconnection occurring at the magnetopause. As for the magnetic field, the plasma density profile in the subsolar magnetosheath strongly depends on how radial the IMF is. Except for the most radial IMF orientations, a plasma depletion layer is generally observed in the first 40% of the magnetosheath from the magnetopause. The depth of the PDL increases as the IMF cone angle increases, which is consistent with the observation of a pronounced magnetic flux pileup. It also increases as the IMF clock angle decreases as a result of magnetic reconnection not being able to process incoming magnetic flux as much. The effect of magnetic reconnection has also been shown to be consistently revealed through the faster flow along the Sun–Earth line as the IMF clock angle increases, as expected from an open magnetopause boundary condition to the magnetosheath flow. It should be noted that this study interprets the variations in magnetic field amplitude and plasma density as primarily produced by magnetic reconnection. However, other processes, such as Kelvin–Helmholtz, surface waves, high-speed jets, and others, may alter the density and magnetic amplitude. Nevertheless, we anticipate that their impact will be more localized in space and time and, thus, less or not visible in large-scale statistics such as those presented in this study. The coupling between the depth of the PDL and strength of the magnetic field close to the magnetopause has also been revealed in the longitudinal variations in the quantity in the equatorial magnetosheath. The magnetic field amplitude is slightly higher on the quasi-perpendicular side of the magnetosheath adjacent to the magnetopause, resulting in a deeper PDL and a quasi-parallel favored asymmetry in that region, which is consistent with previous studies. Interestingly, we showed that the density adjacent to the magnetopause can even become smaller than downstream of the bow shock despite the overall pileup of the solar wind onto the obstacle. In contrast to previous studies, our spatial reconstruction revealed significant variations in the asymmetries in the magnetic field and density across the thickness of the magnetosheath. The magnetic field amplitude asymmetry, which was rather pronounced and quasi-perpendicularly favored downstream of the bow shock, was shown to be much weaker close to the magnetopause in the pileup region. The asymmetry of the density was shown to even reverse at mid-depth and become quasi-perpendicular favored downstream of the bow shock, particularly in the most radial IMF conditions.
This study revealed the first detailed spatial reconstruction of the plasma density and magnetic field in the magnetosheath. The study, in particular, highlighted the subtle effect of magnetic reconnection at the magnetopause on the extent to which the magnetic flux piles up and the density is subsequently depleted near the magnetopause. Our results clearly show how reconnection at the magnetopause changes the global state of the magnetosheath by changing the innermost boundary condition of the flow. Inversely and interestingly, this also implies that magnetic reconnection non-linearly modifies its own boundary condition.
We believe that the main limitation of this study is the repositioning errors of the data points, which result from a combination of errors in determining SW/IMF and the intrinsic errors of the boundary models themselves. This lack of spatial resolution results in the mixing of the plasma and magnetic structures (i.e., magnetic pileup and PDL), which could exhibit a lesser degree of variation than that observed when examining a temporal crossing of the magnetopause/magnetosheath.
The results of this study open several avenues for future investigations. First, this study examines the state of the magnetosheath primarily through the prism of the IMF orientation. Although this parameter is critically important due to its effect on magnetic reconnection, it is far from the only significant factor. Future works should focus on the dependence on the upstream Mach number and plasma beta as these parameters also significantly alter the properties of the PDL and magnetic reconnection at the magnetopause. Future work should also focus on reconstructing the spatial distribution of other parameters, such as plasma flow and plasma pressure and their anisotropy, and conditioning the development of instabilities, whose signatures (such as mirror structures) could also be spatially mapped in order to assess their effects on magnetopause processes. While they only represent an averaged overview of the global magnetosheath, the spatial reconstructions obtained in our study pave the way for new investigations of the magnetosheath from in situ measurements, which were previously accessible only to global numerical models.
Data availability statement
The original contributions presented in the study are included in the article/Supplementary Material; further inquiries can be directed to the corresponding author.
Author contributions
BM: writing–original draft and writing–review and editing. NA: writing–original draft and writing–review and editing. BL: writing–review and editing. VG: writing–review and editing. AJ: writing–review and editing. GN: writing–review and editing. AG: writing–review and editing. RS: writing–review and editing.
Funding
The author(s) declare that financial support was received for the research, authorship, and/or publication of this article. This work was supported by a French government grant managed by the Agence Nationale de la Recherche under the Investissements d’Avenir program (ANR-18-EURE-0014).
Acknowledgments
The authors are grateful to the CDPP/AMDA, CDAWEB, and CSA for the data access. Computing resources used for the data analysis have been funded by the Plasapar federation.
Conflict of interest
The authors declare that the research was conducted in the absence of any commercial or financial relationships that could be construed as a potential conflict of interest.
Publisher’s note
All claims expressed in this article are solely those of the authors and do not necessarily represent those of their affiliated organizations, or those of the publisher, the editors, and the reviewers. Any product that may be evaluated in this article, or claim that may be made by its manufacturer, is not guaranteed or endorsed by the publisher.
Supplementary material
The Supplementary Material for this article can be found online at: https://www.frontiersin.org/articles/10.3389/fspas.2024.1427791/full#supplementary-material
References
Anderson, B. J., and Fuselier, S. A. (1993). Magnetic pulsations from 0.1 to 4.0 Hz and associated plasma properties in the Earth’s subsolar magnetosheath and plasma depletion layer. J. Geophys. Res. 98, 1461–1479. doi:10.1029/92JA02197
Anderson, B. J., Phan, T. D., and Fuselier, S. A. (1997). Relationships between plasma depletion and subsolar reconnection. J. Geophys. Res. 102, 9531–9542. doi:10.1029/97JA00173
Auster, H. U., Glassmeier, K. H., Magnes, W., Aydogar, O., Baumjohann, W., Constantinescu, D., et al. (2008). The THEMIS fluxgate magnetometer. Space Sci. Rev. 141, 235–264. doi:10.1007/s11214-008-9365-9
Balogh, A., Carr, C., Acuña, M., Dunlop, M., Beek, T., Brown, P., et al. (2001). The cluster magnetic field investigation: overview of in-flight performance and initial results. Ann. Geophys. 19, 1207–1217. doi:10.5194/angeo-19-1207-2001
Borovsky, J. E., Hesse, M., Birn, J., and Kuznetsova, M. M. (2008). What determines the reconnection rate at the dayside magnetosphere? J. Geophys. Res. Space Phys. 113, A07210. doi:10.1029/2007JA012645
Cairns, I. H., and Fuselier, S. A. (2017). The plasma depletion layer beyond the heliopause: evidence, implications, and predictions for voyager 2 and new horizons. Astrophysical J. 834, 197. doi:10.3847/1538-4357/834/2/197
Carr, C., Brown, P., Zhang, T. L., Gloag, J., Horbury, T., Lucek, E., et al. (2005). The Double Star magnetic field investigation: instrument design, performance and highlights of the first year’s observations. Ann. Geophys. 23, 2713–2732. doi:10.5194/angeo-23-2713-2005
Cassak, P. A., and Shay, M. A. (2007). Scaling of asymmetric magnetic reconnection: general theory and collisional simulations. Phys. Plasmas 14, 102114. doi:10.1063/1.2795630
Cooling, B. M. A., Owen, C. J., and Schwartz, S. J. (2001). Role of the magnetosheath flow in determining the motion of open flux tubes. J. Geophys. Res. 106, 18763–18775. doi:10.1029/2000ja000455
Crooker, N. U., Eastman, T. E., and Stiles, G. S. (1979). Observations of plasma depletion in the magnetosheath at the dayside magnetopause. J. Geophys. Res. 84, 869–874. doi:10.1029/JA084iA03p00869
Dimmock, A. P., Hietala, H., and Zou, Y. (2020). Compiling magnetosheath statistical data sets under specific solar wind conditions: lessons learnt from the dayside kinetic southward IMF GEM challenge. Earth Space Sci. 7, e2020EA001095. doi:10.1029/2020EA001095
Dimmock, A. P., and Nykyri, K. (2013). The statistical mapping of magnetosheath plasma properties based on THEMIS measurements in the magnetosheath interplanetary medium reference frame. J. Geophys. Res. Space Phys. 118, 4963–4976. doi:10.1002/jgra.50465
Dimmock, A. P., Nykyri, K., and Pulkkinen, T. I. (2014). A statistical study of magnetic field fluctuations in the dayside magnetosheath and their dependence on upstream solar wind conditions. J. Geophys. Res. Space Phys. 119, 6231–6248. doi:10.1002/2014JA020009
Dimmock, A. P., Pulkkinen, T. I., Osmane, A., and Nykyri, K. (2016). The dawn-dusk asymmetry of ion density in the dayside magnetosheath and its annual variability measured by THEMIS. Ann. Geophys. 34, 511–528. doi:10.5194/angeo-34-511-2016
Dorelli, J. C., Hesse, M., Kuznetsova, M. M., Rastaetter, L., and Raeder, J. (2004). A new look at driven magnetic reconnection at the terrestrial subsolar magnetopause. J. Geophys. Res. Space Phys. 109. doi:10.1029/2004ja010458
Fuselier, S. A., Klumpar, D. M., Shelley, E. G., Anderson, B. J., and Coates, A. J. (1991). He2+ and H+ dynamics in the subsolar magnetosheath and plasma depletion layer. J. Geophys. Res. 96, 21095–21104. doi:10.1029/91JA02145
Gershman, D. J., Slavin, J. A., Raines, J. M., Zurbuchen, T. H., Anderson, B. J., Korth, H., et al. (2013). Magnetic flux pileup and plasma depletion in mercury’s subsolar magnetosheath. J. Geophys. Res. Space Phys. 118, 7181–7199. doi:10.1002/2013ja019244
Hall, D. S., Hapgood, M. A., and Bryant, D. A. (1990). The transition from the magnetosheath to the magnetosphere. Geophys. Res. Lett. 17, 2039–2042. doi:10.1029/GL017i011p02039
King, J. H., and Papitashvili, N. E. (2005). Solar wind spatial scales in and comparisons of hourly Wind and ACE plasma and magnetic field data. J. Geophys. Res. Space Phys. 110, A02104. doi:10.1029/2004JA010649
Kobel, E., and Fluckiger, E. O. (1994). A model of the steady state magnetic field in the magnetosheath. J. Geophys. Res. 99, 23617–23622. doi:10.1029/94JA01778
Longmore, M., Schwartz, S. J., Geach, J., Cooling, B. M. A., Dandouras, I., Lucek, E. A., et al. (2005). Dawn-dusk asymmetries and sub-Alfvénic flow in the high and low latitude magnetosheath. Ann. Geophys. 23, 3351–3364. doi:10.5194/angeo-23-3351-2005
Ma, X., Nykyri, K., Dimmock, A., and Chu, C. (2020). Statistical study of solar wind, magnetosheath, and magnetotail plasma and field properties: 12+ years of themis observations and mhd simulations. J. Geophys. Res. Space Phys. 125, e2020JA028209. doi:10.1029/2020ja028209
Masters, A., Phan, T. D., Badman, S. V., Hasegawa, H., Fujimoto, M., Russell, C. T., et al. (2014). The plasma depletion layer in saturn’s magnetosheath. J. Geophys. Res. Space Phys. 119, 121–130. doi:10.1002/2013ja019516
McFadden, J. P., Carlson, C. W., Larson, D., Ludlam, M., Abiad, R., Elliott, B., et al. (2008). The THEMIS ESA plasma instrument and in-flight calibration. Sci. Stud. Read. 141, 277–302. doi:10.1007/s11214-008-9440-2
Michotte de Welle, B., Aunai, N., Lavraud, B., Nguyen, G., Génot, V., Ghisalberti, A., et al. (2024). Global environmental constraints on magnetic reconnection at the magnetopause from in-situ measurements. Ess. Open Arch. doi:10.22541/essoar.170808382.29449499/v1
Michotte de Welle, B., Aunai, N., Nguyen, G., Lavraud, B., Génot, V., Jeandet, A., et al. (2022). Global three-dimensional draping of magnetic field lines in earth’s magnetosheath from in-situ spacecraft measurements. J. Geophys. Res. Space Phys. 127, e2022JA030996. doi:10.1029/2022JA030996
Němeček, Z., Šafránková, J., Zastenker, G. N., Pišoft, P., and Paularena, K. I. (2002). Spatial distribution of the magnetosheath ion flux. Adv. Space Res. 30, 2751–2756. doi:10.1016/S0273-1177(02)80402-1
Nguyen, G., Aunai, N., Michotte de Welle, B., Jeandet, A., Lavraud, B., and Fontaine, D. (2022). Massive multi-mission statistical study and analytical modeling of the earth’s magnetopause: 1. A gradient boosting based automatic detection of near-earth regions. J. Geophys. Res. Space Phys. 127, e29773. doi:10.1029/2021JA029773
Øieroset, M., Mitchell, D. L., Phan, T. D., Lin, R. P., Crider, D. H., and Acuña, M. H. (2004). The magnetic field pile-up and density depletion in the martian magnetosheath: a comparison with the plasma depletion layer upstream of the earth’s magnetopause. Space Sci. Rev. 111, 185–202. doi:10.1023/b:spac.0000032715.69695.9c
Paschmann, G., Baumjohann, W., Sckopke, N., Phan, T. D., and Luehr, H. (1993). Structure of the dayside magnetopause for low magnetic shear. J. Geophys. Res. 98, 13409–13422. doi:10.1029/93JA00646
Paschmann, G., Sckopke, N., Haerendel, G., Papamastorakis, J., Bame, S. J., Asbridge, J. R., et al. (1978). ISEE plasma observations near the subsolar magnetopause article published in the special issues: advances in magnetospheric physics with GEOS- 1 and ISEE - 1 and 2. Space Sci. Rev. 22, 717–737. doi:10.1007/BF00212620
Paularena, K. I., Richardson, J. D., Kolpak, M. A., Jackson, C. R., and Siscoe, G. L. (2001). A dawn-dusk density asymmetry in Earth's magnetosheath. Earth’s magnetosheath 106, 25377–25394. doi:10.1029/2000JA000177
Phan, T. D., Paschmann, G., Baumjohann, W., Sckopke, N., and Luehr, H. (1994). The magnetosheath region adjacent to the dayside magnetopause: AMPTE/IRM observations. J. Geophys. Res. 99, 121–141. doi:10.1029/93JA02444
Pollock, C., Moore, T., Jacques, A., Burch, J., Gliese, U., Saito, Y., et al. (2016). Fast plasma investigation for magnetospheric multiscale. Sci. Stud. Read. 199, 331–406. doi:10.1007/s11214-016-0245-4
Pudovkin, M. I., Besser, B. P., Zaitseva, S. A., Lebedeva, V. V., and Meister, C. V. (2001). Magnetic barrier in case of a southward interplanetary magnetic field. J. Atmos. Solar-Terrestrial Phys. 63, 1075–1083. doi:10.1016/S1364-6826(01)00023-2
Rème, H., Aoustin, C., Bosqued, J. M., Dand ouras, I., Lavraud, B., Sauvaud, J. A., et al. (2001). First multispacecraft ion measurements in and near the Earth’s magnetosphere with the identical Cluster ion spectrometry (CIS) experiment. Ann. Geophys. 19, 1303–1354. doi:10.5194/angeo-19-1303-2001
Rème, H., Dandouras, I., Aoustin, C., Bosqued, J. M., Sauvaud, J. A., Vallat, C., et al. (2005). The HIA instrument on board the Tan Ce 1 Double Star near-equatorial spacecraft and its first results. Ann. Geophys. 23, 2757–2774. doi:10.5194/angeo-23-2757-2005
Romashets, E. P., and Vandas, M. (2019). Analytic modeling of magnetic field in the magnetosheath and outer magnetosphere. J. Geophys. Res. Space Phys. 124, 2697–2710. doi:10.1029/2018JA026006
Russell, C. T., Anderson, B. J., Baumjohann, W., Bromund, K. R., Dearborn, D., Fischer, D., et al. (2016). The magnetospheric multiscale magnetometers. Sci. Stud. Read. 199, 189–256. doi:10.1007/s11214-014-0057-3
Šafránková, J., Přech, L., Němeček, Z., and Sauvaud, J. A. (2002). Density profile in the magnetosheath adjacent to the magnetopause. Adv. Space Res. 30, 1693–1703. doi:10.1016/S0273-1177(02)00438-6
Sibeck, D. G., Lepping, R. P., and Lazarus, A. J. (1990). Magnetic field line draping in the plasma depletion layer. J. Geophys. Res. Space Phys. 95, 2433–2440. doi:10.1029/ja095ia03p02433
Song, P., Russell, C. T., Gosling, J. T., Thomsen, M., and Elphic, R. C. (1990). Observations of the density profile in the magnetosheath near the stagnation streamline. Geophys. Res. Lett. 17, 2035–2038. doi:10.1029/GL017i011p02035
Spreiter, J. R., Summers, A. L., and Alksne, A. Y. (1966). Hydromagnetic flow around the magnetosphere. Planet. Space Sci. 14, 223–253. doi:10.1016/0032-0633(66)90124-3
Trattner, K. J., Petrinec, S. M., and Fuselier, S. A. (2021). The location of magnetic reconnection at earth’s magnetopause. Earth’s Magnetopause 217, 41. doi:10.1007/s11214-021-00817-8
Walsh, B. M., Sibeck, D. G., Wang, Y., and Fairfield, D. H. (2012). Dawn-dusk asymmetries in the Earth’s magnetosheath. J. Geophys. Res. Space Phys. 117, A12211. doi:10.1029/2012JA018240
Walters, G. K. (1964). Effect of oblique interplanetary magnetic field on shape and behavior of the magnetosphere. J. Geophys. Res. 69, 1769–1783. doi:10.1029/JZ069i009p01769
Wang, Y., Raeder, J., and Russell, C. (2004a). Plasma depletion layer: its dependence on solar wind conditions and the Earth dipole tilt. Ann. Geophys. 22, 4273–4290. doi:10.5194/angeo-22-4273-2004
Wang, Y., Raeder, J., and Russell, C. (2004b). Plasma depletion layer: magnetosheath flow structure and forces. Ann. Geophys. 22, 1001–1017. doi:10.5194/angeo-22-1001-2004
Wang, Y. L., Raeder, J., Russell, C. T., Phan, T. D., and Manapat, M. (2003). Plasma depletion layer: event studies with a global model. J. Geophys. Res. Space Phys. 108, 1010. doi:10.1029/2002JA009281
Wu, C. C. (1992). Mhd flow past an obstacle: large-scale flow in the magnetosheath. Geophys. Res. Lett. 19, 87–90. doi:10.1029/91gl03007
Zhang, H., Fu, S., Pu, Z., Lu, J., Zhong, J., Zhu, C., et al. (2019). Statistics on the magnetosheath properties related to magnetopause magnetic reconnection. Astrophys. J. 880, 122. doi:10.3847/1538-4357/ab290e
Keywords: magnetosheath, magnetic pileup, plasma depletion layer, asymmetry, plasma density, magnetic field amplitude, magnetopause
Citation: Michotte de Welle B, Aunai N, Lavraud B, Génot V, Jeandet A, Nguyen G, Ghisalberti A and Smets R (2024) Spatial distribution of plasma density and magnetic field amplitude in the dayside magnetosheath as a function of the IMF orientation. Front. Astron. Space Sci. 11:1427791. doi: 10.3389/fspas.2024.1427791
Received: 04 May 2024; Accepted: 04 July 2024;
Published: 05 August 2024.
Edited by:
Yu Lin, Auburn University, United StatesReviewed by:
Binbin Tang, Chinese Academy of Sciences (CAS), ChinaXuanye Ma, Embry–Riddle Aeronautical University, United States
Copyright © 2024 Michotte de Welle, Aunai, Lavraud, Génot, Jeandet, Nguyen, Ghisalberti and Smets. This is an open-access article distributed under the terms of the Creative Commons Attribution License (CC BY). The use, distribution or reproduction in other forums is permitted, provided the original author(s) and the copyright owner(s) are credited and that the original publication in this journal is cited, in accordance with accepted academic practice. No use, distribution or reproduction is permitted which does not comply with these terms.
*Correspondence: B. Michotte de Welle, YmF5YW5lLm1pY2hvdHRlLWRlLXdlbGxlQGxwcC5wb2x5dGVjaG5pcXVlLmZy