 Rana Ghosh1,2
 Ankan Das1,3
 Prasanta Gorai4,5*
 Suman Kumar Mondal6Kenji Furuya7,8Kei E. I. Tanaka9Takashi Shimonishi10
- 1Institute of Astronomy Space and Earth Sciences, Kolkata, West Bengal, India
- 2Indian Centre for Space Physics, Kolkata, West Bengal, India
- 3Max-Planck-Institute for extraterrestrial Physics, Garching, Germany
- 4Rosseland Centre for Solar Physics, University of Oslo, Oslo, Norway
- 5Institute of Theoretical Astrophysics, University of Oslo, Oslo, Norway
- 6S. N. Bose National Centre for Basic Sciences, Kolkata, West Bengal, India
- 7National Astronomical Observatory of Japan, Tokyo, Japan
- 8Department of Astronomy, Graduate School of Science, University of Tokyo, Tokyo, Japan
- 9Department of Earth and Planetary Sciences, Tokyo Institute of Technology, Tokyo, Japan
- 10Institute of Science and Technology, Niigata University, Niigata, Japan
SO and SO2 are two potential candidates to trace the different evolutionary phases of the low-mass star-formation process. Here, we report observations of SO and SO2 along with their isotopologues, 34SO and 34SO2, respectively, in four distinct phases of the low-mass star-formation process (prestellar core, first hydrostatic core, Class 0, and Class I) with an unbiased survey carried out using the Institut de Radioastronomie Millimetrique (IRAM) 30 m telescope. Interestingly, the estimated abundances of SO and SO2 show an increasing trend from the prestellar phase to the Class 0 stage and then a decrease in the Class I phase. A similar trend is obtained for OCS and H2S. In contrast, the obtained SO/SO2 ratio decreases gradually from the prestellar core to the Class I stage. We have used the three-phase Rokko chemical code to explain our observations. The modeled abundances of SO and SO2 exhibit an increase within the inner region as the cold gas transforms into a hot gas. The modeled abundance ratio of SO to SO2 exhibits a notably high value in cold gas environments. This ratio decreases to less than 1 within the temperature range of 100–300 K and then increases to approximately 1 beyond 300 K. In the outer region, the simulated ratio consistently exceeds the value of 1. Our work is an observational testbed for modeling the chemistry of SO/SO2 during low-mass star formation. However, our findings may require more sample sources with higher resolution and a more robust model for validation.
1 Introduction
Sulfur is the 10th most abundant (
SO emission has been found in the disc component of Class 0/I sources and the outflow cavity walls (Sakai et al., 2014; Harsono et al., 2014; Tychoniec et al., 2021), and SO2 is commonly seen in compact emission toward Class 0 sources and has been suggested to trace accretion shocks at the disk–envelope interface (Oya et al., 2019; Artur et al., 2022). Buckle and Fuller (2003) studied the chemical evolution of SO, SO2, and H2S in the low-mass star-formation process. They showed that the chemical evolution of sulfur-bearing species could be a potential indicator of the chemical timescales in the low-mass star-formation process. It has long been proposed that H2S (Smith, 1991; Charnley, 1997; Navarro-Almaida et al., 2020) and/or Carbonyl Sulfide (OCS) (Hatchell et al., 1998; van der Tak et al., 2003) are major sulfur grain reservoirs, forming SO, SO2, and other S-bearing molecules in the gas phase (Esplugues et al., 2014; Podio et al., 2014; Holdship et al., 2016). H2S has not yet been found in the solid phase, although OCS and SO2 have been detected or tentatively detected in the interstellar ices (Palumbo et al., 1995; Boogert et al., 1997; Rocha et al., 2024). In the cold molecular region, H2S is the main sulfur reservoir (Smith, 1991; Navarro-Almaida et al., 2020), although it is still debatable in which form sulfur is locked in ice. However, SO/H2S and SO/SO2 are suitable molecular clocks for measuring the hot-core evolution (Smith, 1991). Gorai et al. (2017); Laas and Caselli (2019) suggested that various organo-sulfur species are found in the solid phase with lower abundances. Fuente et al. (2023) listed the 20 most abundant sulfur-bearing species, in order of decreasing abundance toward low-, intermediate-, and high-mass star-forming regions that are representative of Taurus, Perseus, and Orion A molecular clouds, respectively. In particular, theoretical work and laboratory experiments show that sulfur allotropes, such as S8, could be an important reservoir of sulfur (Wakelam et al., 2004; Jiménez-Escobar et al., 2012; Shingledecker et al., 2020; Cazaux et al., 2022). Zhang et al. (2023) compared the distributions of sulfur-bearing molecules (SO, SO2, 34SO, and CS) and dust polarization of nine sources from the Perseus molecular cloud. This comparative analysis may offer additional diagnostics of physical properties and grain alignment mechanisms in star-forming processes, especially for the shocked regions.
Various sulfur-related molecules, including SO and SO2 with their 34S isotopologues, were observed at millimeter wavelengths by Herpin et al. (2009) in two mid-infrared quiet and two brighter massive cores with the IRAM 30 m and Caltech Submillimeter Observatory (CSO) telescopes. The study of the differences in abundance ratios between sources shows that the relative abundances of SO and SO2 increase with time. They found that molecular ratios like SO/SO2 may be a useful indicator of evolution, depending on the layers probed by the observed molecular transitions. An extensive statistical analysis on detection rates, emitting regions, and molecular column densities of simple sulfur-bearing molecules SO, CS, 34SO, and SO2, toward a sample of 50 Class 0/I sources in the Perseus star-forming region, was carried out by Artur et al. (2023) in the framework of the Perseus ALMA (Atacama Large Millimeter/submillimeter Array) Chemical Survey (PEACHES; Yang et al., 2021). They demonstrated that the 32SO/34SO ratio is a useful indicator of the inner high-density envelope and could be used to infer the existence of multiple COMs. Recently, Fontani et al. (2023) analyzed an observation of S-bearing molecules with the IRAM 30 m telescope toward 15 well-known cores classified in the three main evolutionary stages (high-mass starless cores, high-mass protostellar objects, and ultracompact HII regions) of the high-mass star-formation process. The molecular abundances of SO, SO2, and H2S exhibit the largest positive correlation with the kinetic temperature, which is thought to be an indicator of evolution.
This paper mainly focuses on the observation of SO and SO2 in their ground state
This paper is organized as follows. Section 2 presents the observations and brief information about the targeted sources. Section 3 describes the method used. Results and discussion are presented in Section 4 and Section 5, respectively. Finally, we provide the conclusion in Section 6.
2 Observations and targets
We use publicly available archival data from one of the official repositories of the ASAI data at IRAM. Observations were made with the IRAM 30 m telescope at Pico Veleta (Spain) in the framework of large program ASAI (PIs: Bertrand Lefloch and Raphael Bachiller) data using the broad-band Eight MIxer Receiver (EMIR) connected to the fast Fourier transform spectrometers (FFTSs). These observations cover three frequency bands: 3 mm (
2.1 L1544
L1544 (
2.2 B1-b
Barnard 1 (B1) cloud is a moderately active star-forming region. It belongs to the Perseus molecular cloud complex at a distance of 235 pc (Hirota et al., 2008). The Barnard 1 dark cloud is subdivided into several dense cores, namely, B1-a, B1-b, B1-c, and B1-d. The B1-a and B1-c hosting Class 0 sources are associated with high-velocity outflows (Hatchell et al., 2005; 2007). The protostellar core B1-b consists of three remarkable sources, out of which B1-bN and B1-bS (Huang and Hirano, 2013) are two extremely young protostellar objects and are the first hydrostatic core (FHSC) candidates (Larson, 1969, first object to be formed in the collapse of a prestellar core). The spectral energy distribution (SED) modeling from Pezzuto et al. (2012) revealed that the two young protostellar objects are more evolved than prestellar cores but have yet to form Class 0 objects. Particularly, the non-detection of B1-bS at
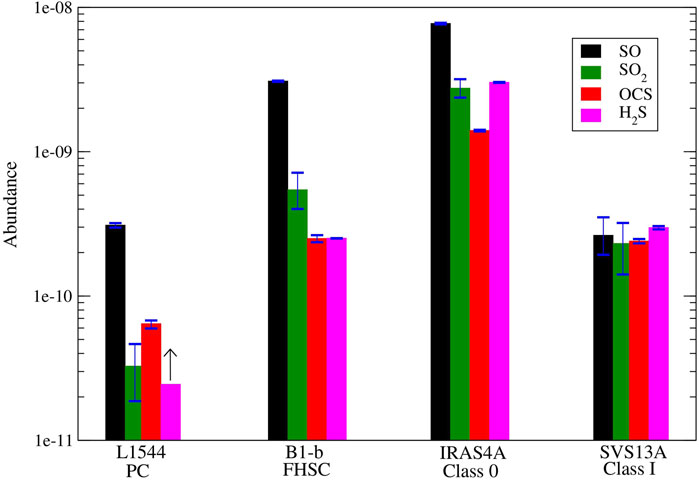
Figure 1. Abundance variation of SO, SO2, OCS, and H2S in different evolutionary stages of the low-mass star-formation process. Blue-colored cap-tipped lines represent the uncertainties in the abundance of the observed molecules. A lower limit on H2S column density is plotted (shown in black-colored up-arrow sign) in the case of L1544, and it is taken from Vastel et al. (2018).
2.3 IRAS4A
NGC1333-IRAS4A (or simply IRAS4A,
2.4 SVS13A
SVS13A is a Class I protostar belonging to the SVS13 cluster, located in the NGC1333 star-forming region in Perseus. The Global Astrometric Interferometer for Astrophysics, Gaia, has precisely determined its distance to be 299
We found that our calculated column densities for SO and 34SO fall within the margin of error of the values reported in Vastel et al. (2018) and Fuente et al. (2016). However, instead of directly using those values, we prefer to reanalyze the data as we disclosed discrepancies between the data used in those papers and the data available in the public domain. For instance, in the case of L1544, Vastel et al. (2018) reported three transitions of SO, but we found only two transitions because the 109.2522 GHz transition falls outside the publicly available data range (
3 Methodology
3.1 Line identification
The line identification of all observed molecular species presented in this paper was carried out with the help of CASSIS (Caux et al., 2011)2 software (developed by IRAP-UPS/CNRS). Assuming no beam dilution, the observed line intensities (in the unit of antenna temperature,
3.2 Rotation diagram analysis
We applied the rotational diagram method whenever we detected multiple transitions of the same species in the same source. The analysis of rotational diagrams holds significant importance in demonstrating the essential characteristics of molecular clouds and their individual components. This method proves most effective when the source completely occupies the beam and the emitted radiation is optically thin. In LTE, all transitions are thermalized according to the Boltzmann distribution. Within the context of LTE, an optically thin transition results in an antenna temperature that is directly proportional to the column density of the observed transition’s upper level.
The column density at the upper level for optically thin lines (Sutton et al., 1995; Goldsmith and Langer, 1999) can be written as
where
where Q
After using the Equation 1, from Equation 3, the column density and rotational temperature can be determined by plotting many transitions log
4 Results
The line parameters of 34SO and 34SO2 transitions are measured by fitting a single Gaussian profile to the observed profile by the method discussed in Section 3.1. In contrast, no Gaussian fitting is done on SO and SO2 molecules as their transitions could be optically thick
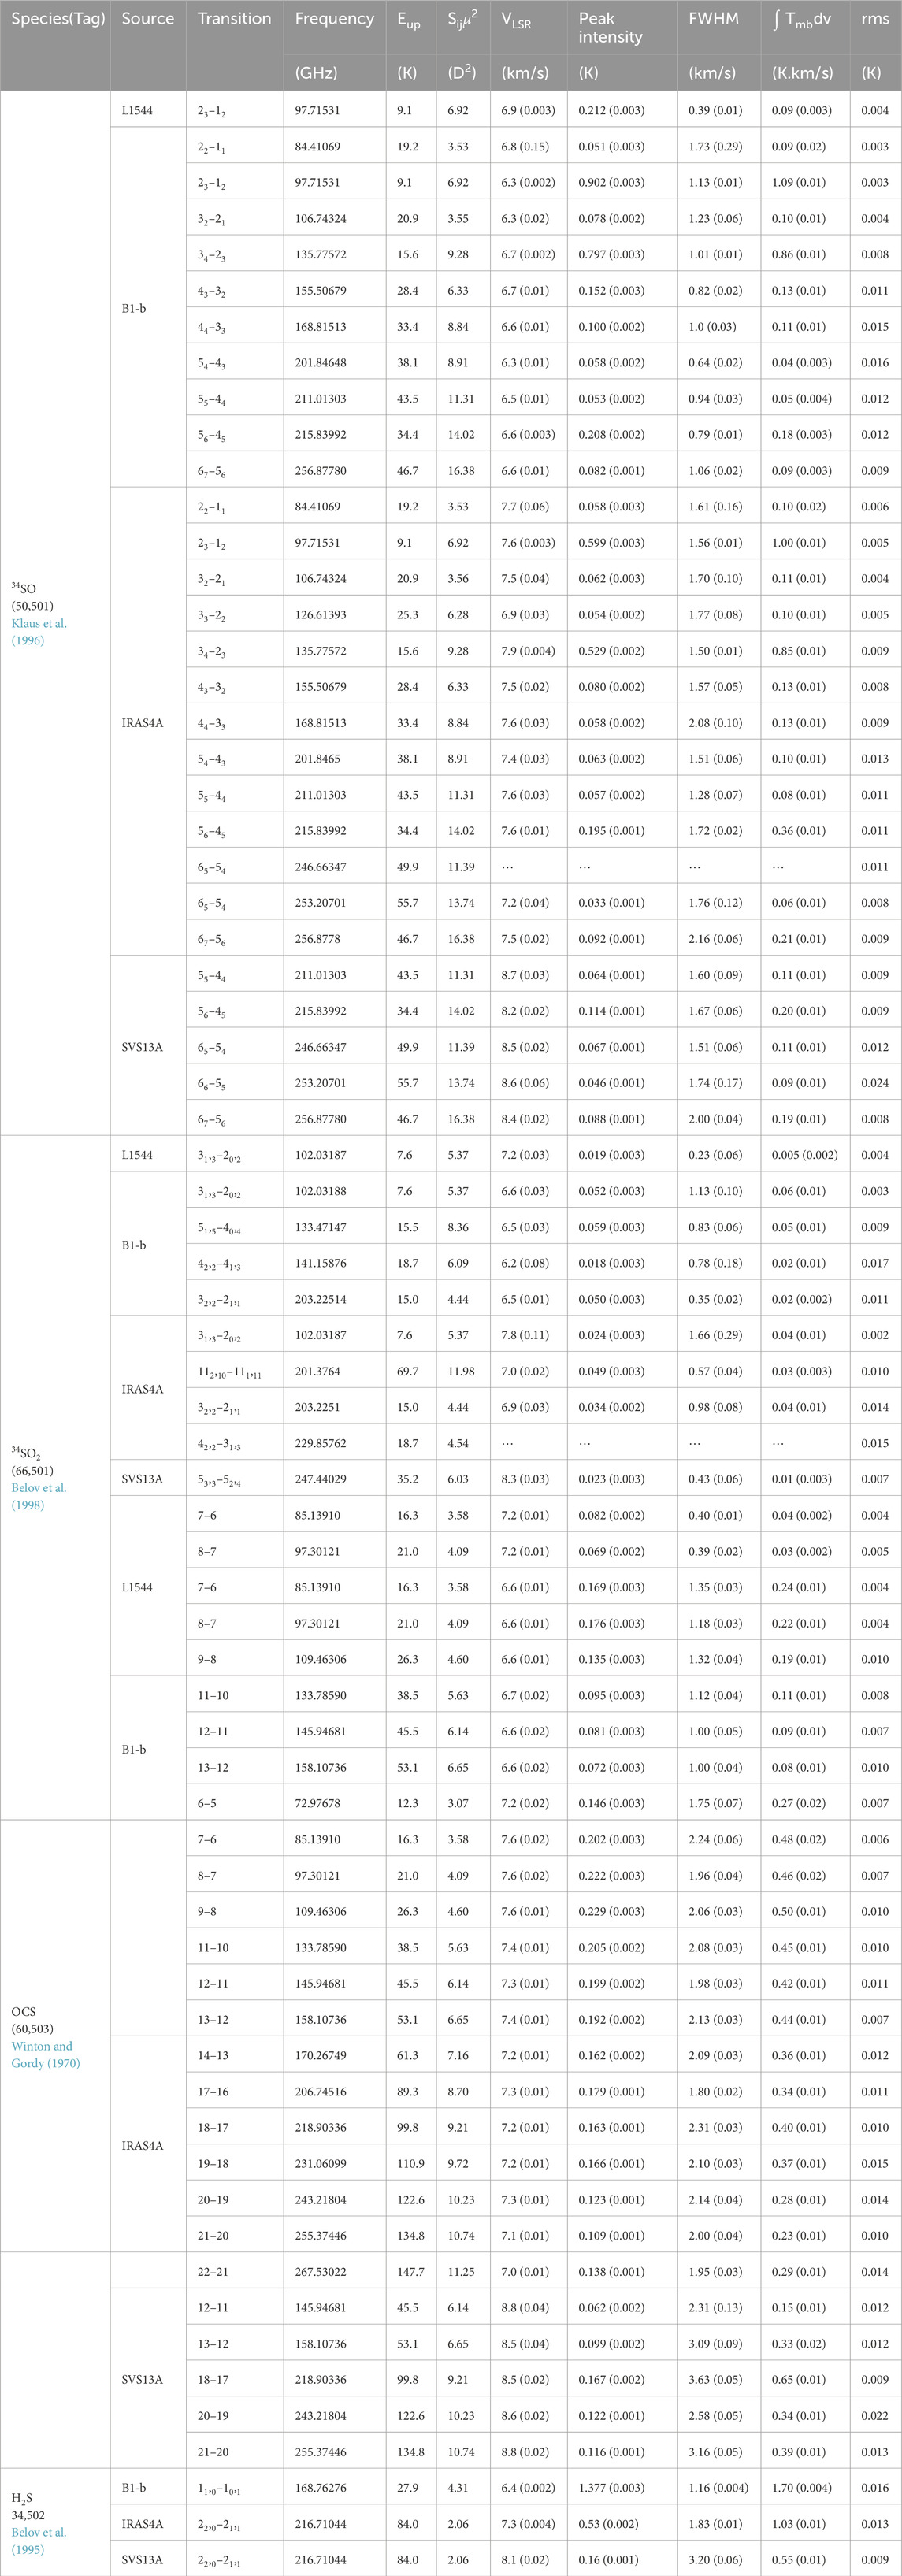
Table 1. Observed transitions of 34SO,34SO2, OCS, and H2S toward the selected sources L1544, B1-b, IRAS4A, and SVS13A for which line parameters are calculated.
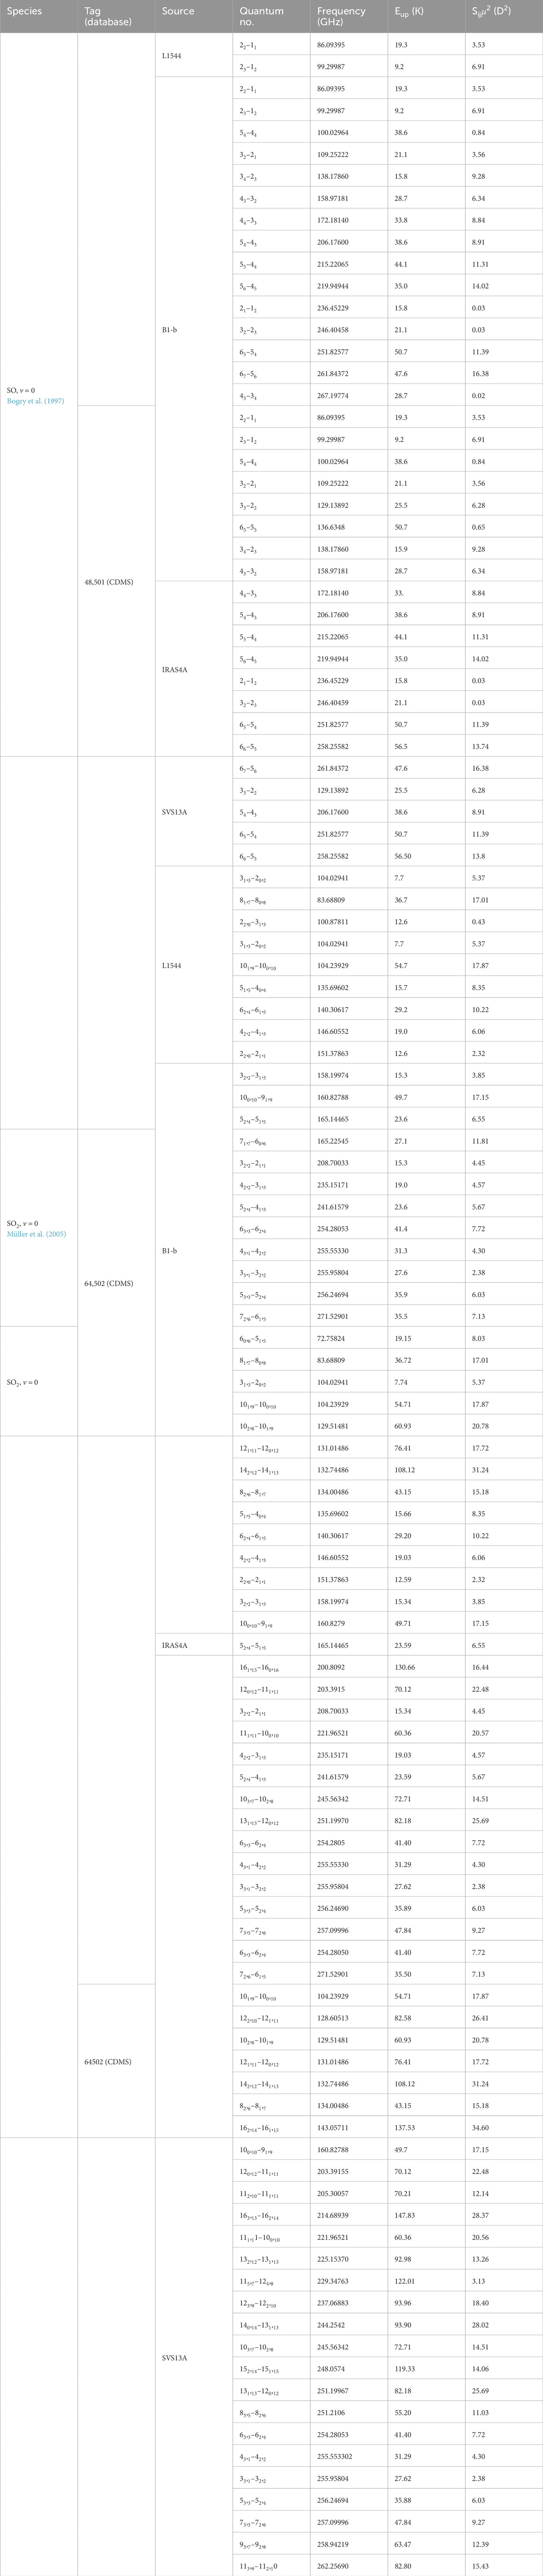
Table 2. Observed other transitions of SO and SO2 toward these selected sources L1544, B1-b, IRAS4A, and SVS13A.
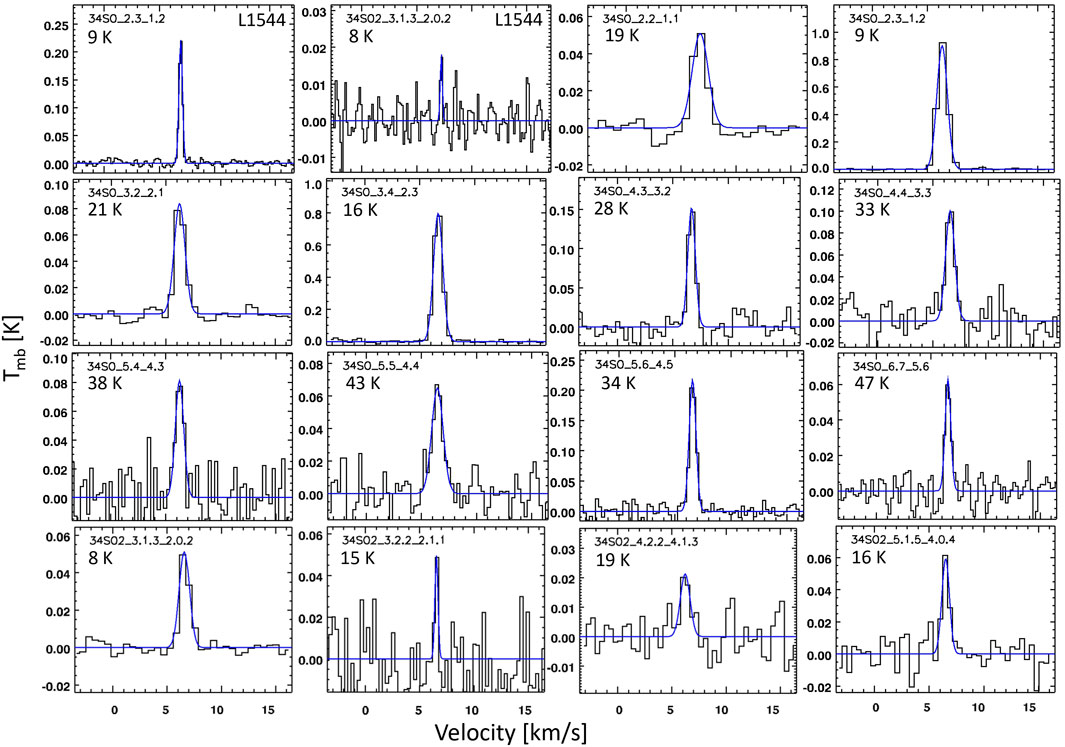
Figure 2. Observed transitions of 34SO and 34SO2 toward L1544 and B1-b. The top two figures are for L1544, and the rest are for B1-b. The black-colored histogram represents the observed spectra, while the Gaussian-fitted spectra are shown with blue-colored lines. The upper state energy
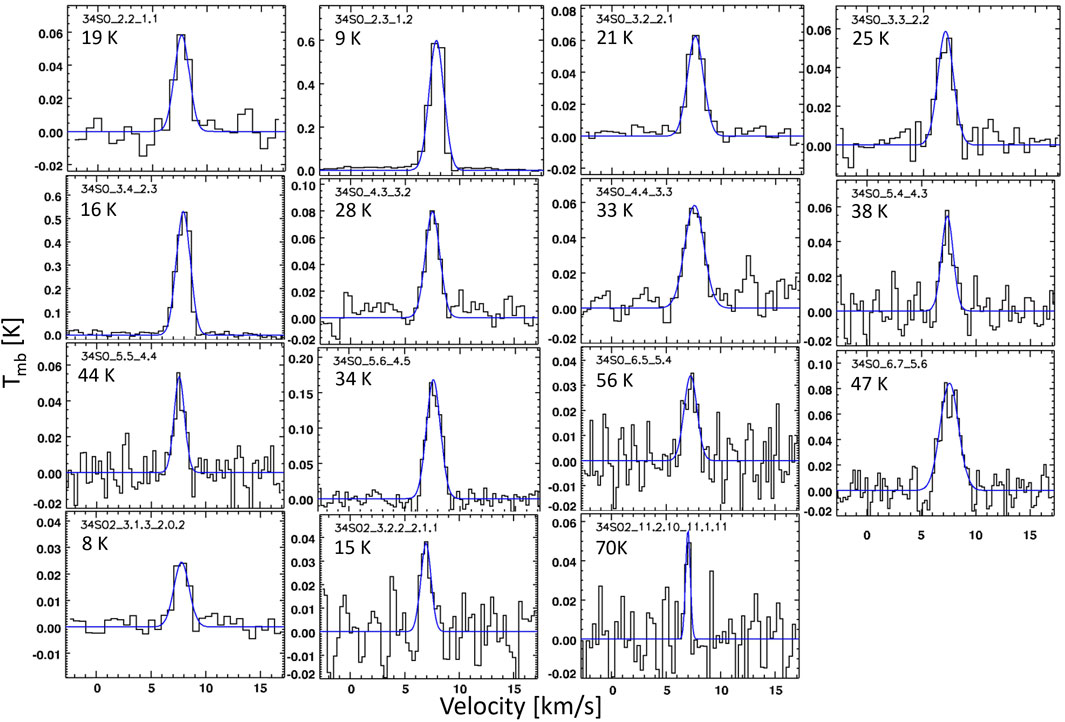
Figure 3. Observed transitions of 34SO and 34SO2 toward IRAS4A. The black-colored lines represent the observed spectra, while the Gaussian-fitted spectra are shown with blue-colored lines. The upper state energy
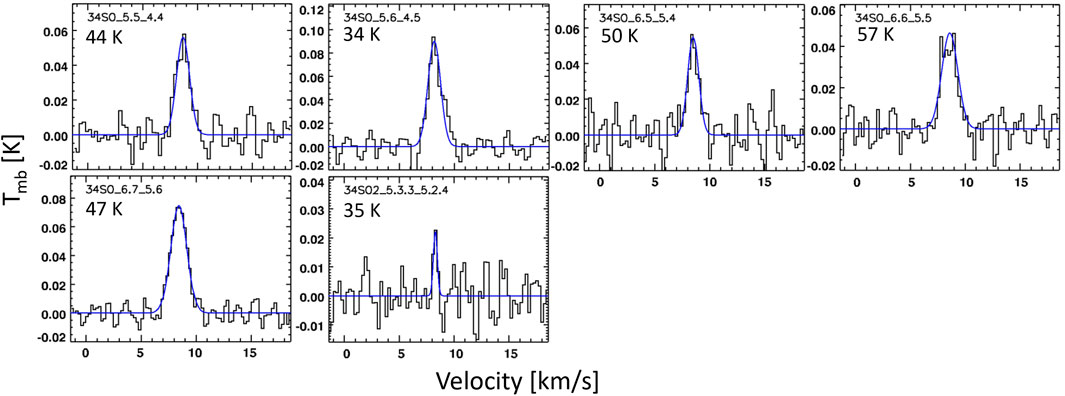
Figure 4. Observed transitions of 34SO toward SVS13A. The black-colored lines represent the observed spectra, while the Gaussian-fitted spectra are shown with blue-colored lines. The upper state energy
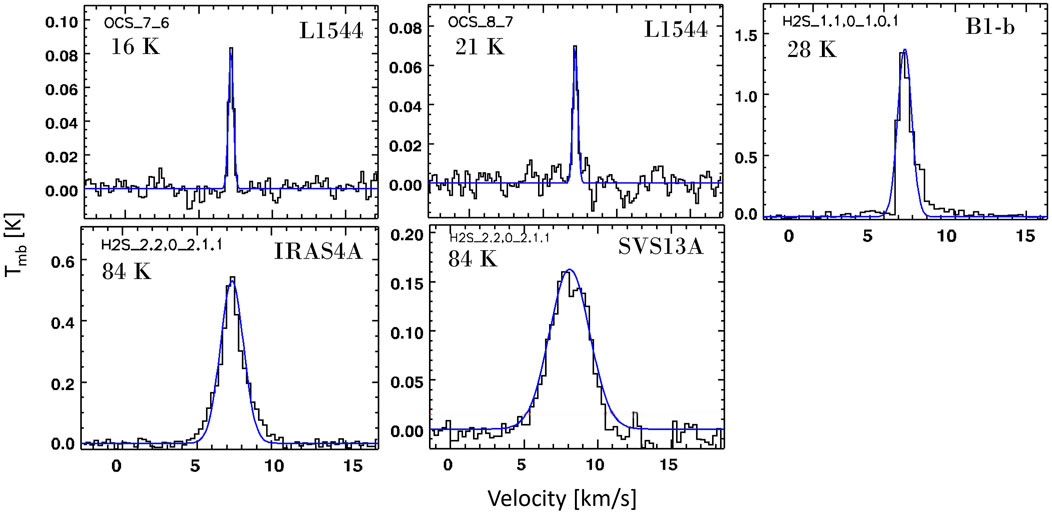
Figure 5. Observed transitions of OCS toward L1544 and H2S toward B1-b, IRAS4A, and SVS13A. The black-colored lines represent the observed spectra, while the Gaussian-fitted spectra are shown in blue-colored lines. The upper state energy
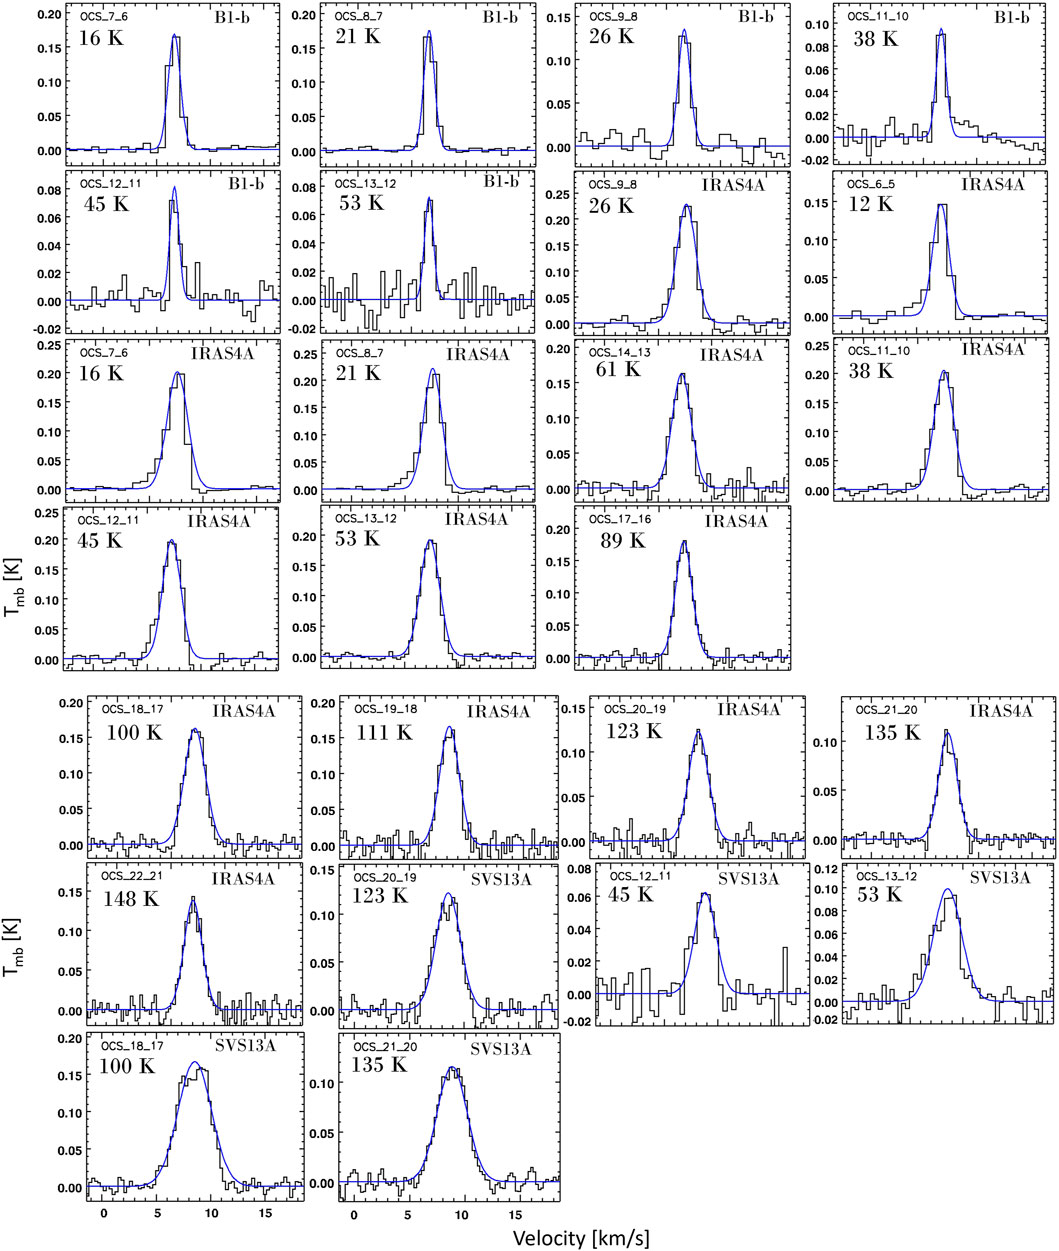
Figure 6. Observed transitions of OCS toward B1-b, IRAS4A, and SVS13A. The black-colored lines represent the observed spectra, while the Gaussian-fitted spectra are shown with blue-colored lines. The upper state energy
We anticipated that at a reasonable temperature of the studied sources, the critical number density of the transitions for 34SO and 34SO2 was comparatively lower than that of the sources. This indicates that collisions occur frequently enough to maintain the populations close to their LTE values. Thus, we assume that all the transitions of 34SO and 34SO2 are optically thin and are in LTE conditions. We use the rotation diagram method discussed in Section 3.2 to analyze cloud properties from molecular line emission by plotting the column density per statistical weight of a number of molecular energy levels as a function of their energy above the ground state.
The data are indeed very well approximated by a straight line (see Figure 7), which confirms that the assumptions of LTE and optical depth
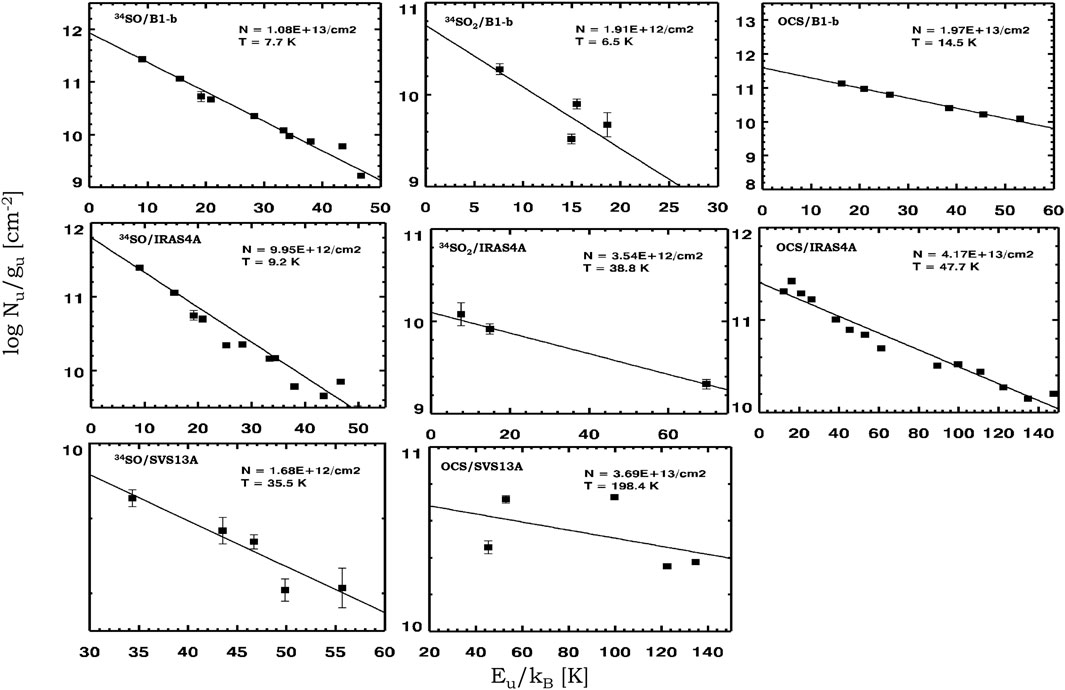
Figure 7. Rotational diagram for 34SO, 34SO2, OCS, and H2S molecules in all sources, wherever it is possible to perform.
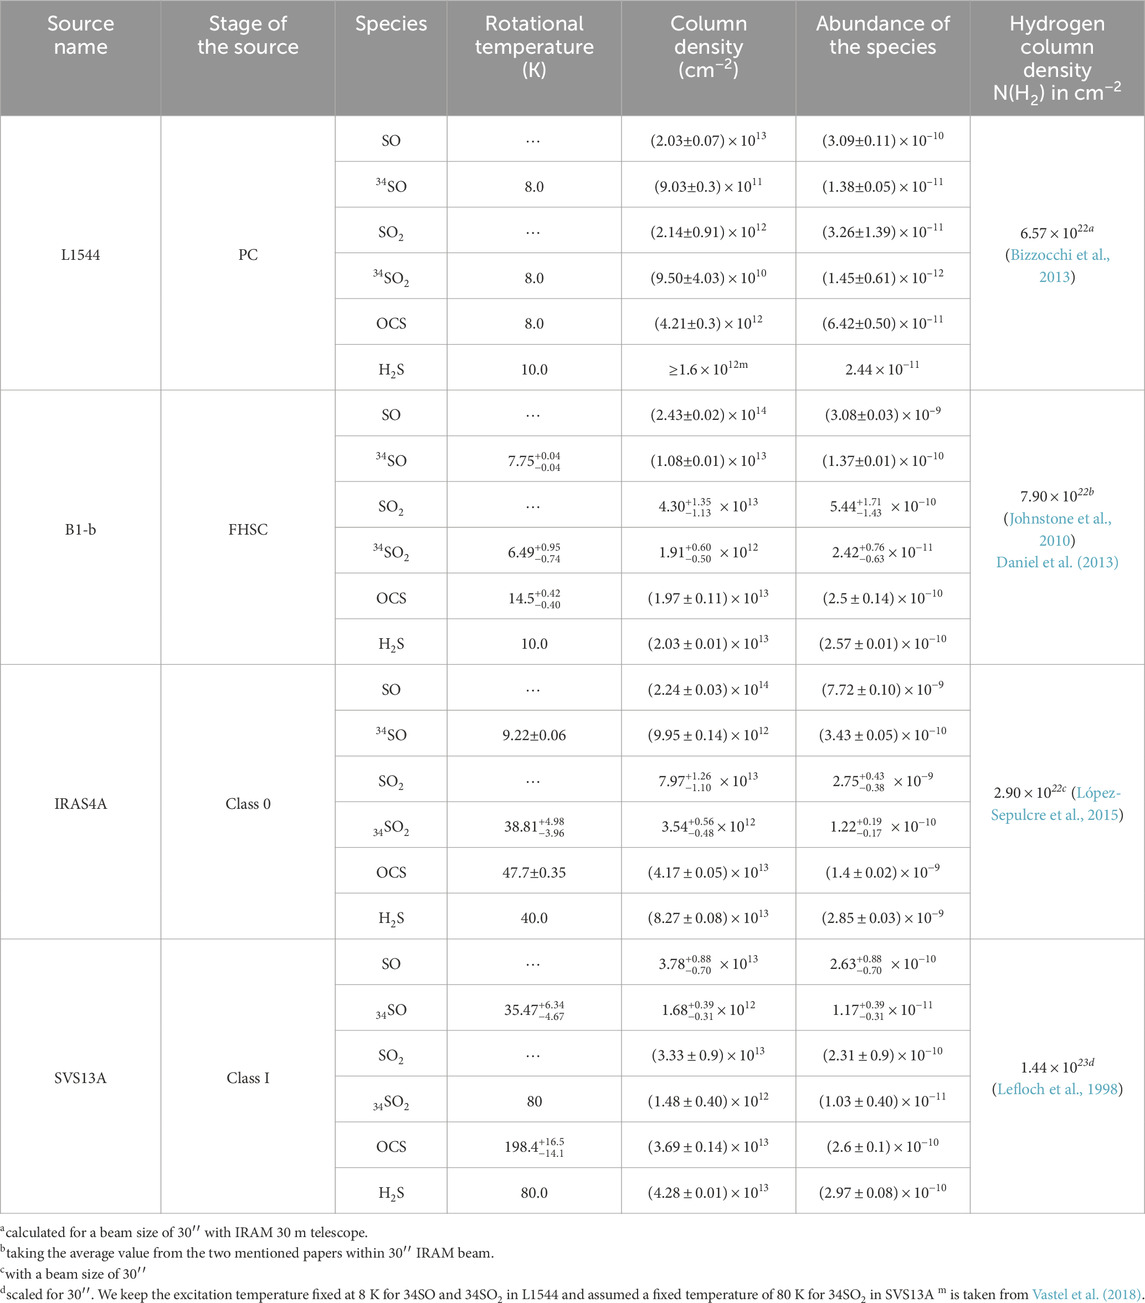
Table 3. Derived rotational temperatures, column densities, and abundances (with respect to H2) of SO,34SO, SO2, and34SO2 in different stages of the low-mass star-formation process.
4.1 L1544
We identify two transitions of SO and one transition each of 34SO, SO2, and 34SO2 in this source. In addition to these two transitions of SO at 86.0939 and 99.2998 GHz, Vastel et al. (2018) found another transition at 109.2522 GHz, but this transition is not available in the archival data (available between
We are unable to determine the rotational temperature and column density from the rotation diagram analysis since we do not observe multiple transitions of 34SO, 34SO2, and OCS in this source. The column densities of 34SO, 34SO2, and OCS are derived by solving Equation 2 under the assumption of LTE and optically thin condition. We calculate the column density of OCS by taking the average for those two transitions mentioned in Table 1 and it is similar to that derived by Vastel et al. (2018)
4.2 B1-b
In this source, we observe 15, 10, 18, and 4 transitions of SO, 34SO, SO2, and 34SO2, respectively. Loison et al. (2019) analyzed 3 mm data from existing surveys with the IRAM 30 m telescope with five dense cores (including B1-b) to verify their modeled results. In this source, they observed four optically thick transitions of SO at 86.0939, 99.2998, 100.0295, and 109.2521 GHz. Including these four transitions of SO, nine other transitions were considered by Fuente et al. (2016) as optically thin. We report two additional transitions of SO at 172.1814 and 251.8257 GHz in addition to observed transitions by Fuente et al. (2016). Loison et al. (2019) used three transitions of 34SO at 84.4106, 97.7154, and 106.7433 GHz to perform the rotational diagram analysis. They obtained a rotational temperature of
In the case of SO2, we observe the same transitions as reported by Fuente et al. (2016), except the transition at 116.9804 GHz, which is not available in the archival data (available between
4.3 IRAS4A
A total of 17 transitions of SO (out of which 15 are unblended and two are blended at 129.1389 GHz with HOCH2CN and 258.2558 GHz with c-C3H2) with upper state energies between
Taquet et al. (2020) performed interferometric data analysis of IRAS4A within the framework of the SOLIS program (Ceccarelli et al., 2017). They compared interferometry results with single-dish results (ASAI) at EMIR and smoothed over the wide-band receiver (WIDEX) resolution for different sulfur-bearing species. They discussed the various line features (narrow, broad, and moderately broad), including possible physical reasons for their origin (also see Ospina-Zamudio et al., 2018).
4.4 SVS13A
We observed four transitions of SO (among them, the transition at 129.1389 GHz is blended with HOCH2CN and the 258.2558 GHz transition is blended with c-C3H2), five unblended transitions of its isotopologue 34SO, 27 transitions of SO2 (out which six transitions are blended with different molecules), and only one clean transition of 34SO2 is observed in this source. Table 1 lists the detected transitions and the line parameters. We observe all 34SO transitions in the 1-mm band having upper state energy
Codella et al. (2021) used 3-mm and 1-mm data of NGC1333 SVS13A obtained with the IRAM-NOEMA interferometer in the framework of the SOLIS Large Program. They presented the spatial distribution on the
5 Discussion
5.1 Observed abundance of SO and SO2 and their ratio
Figure 1 illustrates the abundance variation of SO and SO2, derived from the 34S isotopologues by assuming the 32S/34S elemental ratio of 22.5 (Lodders, 2003) in four distinct phases of the low-mass star-formation process. We observe the abundance of all species initially low in the prestellar phase (L1544), then increases at the first hydrostatic core stage (B1-b), and reaches a maximum value at the Class 0 hot corino stage (IRAS4A). It decreased slightly in the further evolved Class I stage (i.e., SVS13A). We assume the excitation temperature of 8 K (for 34SO and 34SO2) for L1544 and 80 K (for 34SO2) for SVS13A to calculate the abundance of these species. The abundances of SO and SO2 show a similar trend when the excitation temperature is changed from 6 to 10 K for L1544 and from 60 to 100 K for SVS13A. Figure 1 depicts a similar trend for the other two major sulfur-bearing species: OCS and H2S.
Figure 8 shows the obtained SO/SO2 ratio for the four sources. The ratio decreases gradually from the prestellar core phase to the Class 0 phase. In the case of SVS13A, we obtain a large uncertainty in this ratio, so it is challenging to distinguish between the Class 0 and Class I source based on the SO/SO2 ratio obtained from this observation. However, it is worth pointing out that we obtain an SO/SO2 ratio
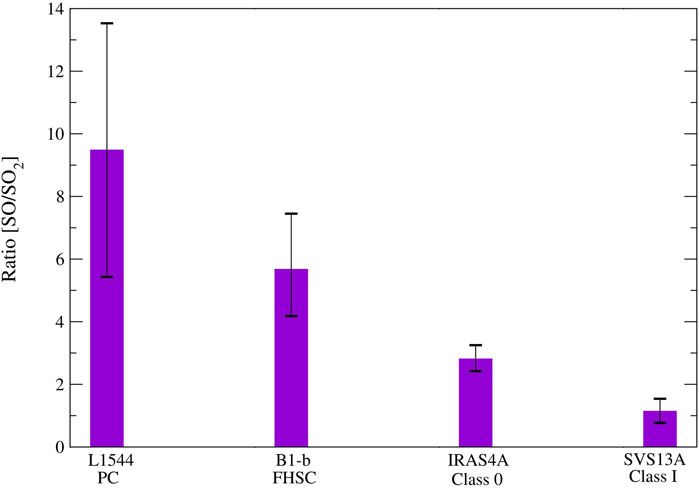
Figure 8. SO/SO2 ratio in different evolutionary stages of the low-mass star-formation process.
5.2 Comparison with the other study
Very recently, Bhat et al. (2023) used similar sources to understand the evolutionary sequence of the low-mass star-formation process with complex organic molecules. They also found a similar trend with the COMs as it is obtained for SO and SO2 here. A similar type of work is reported by Buckle and Fuller (2003), where they surveyed sulfur-bearing species (H2S, SO, and SO2) for 10 Class 0 and nine Class I sources with the 12 m telescope on Kitt Peak at National Radio Astronomy Observatory (NRAO). They reported a slight decrease in the abundance in the Class I source compared to the Class 0 source. They obtained the mean fractional abundances toward the core approximately
Recently, Fontani et al. (2023) analyzed data from the IRAM 30 m telescope, focusing on 15 cores categorized into three primary evolutionary stages of the high-mass star-formation process: high-mass starless cores (HMSC), high-mass protostellar objects (HMPO), and ultracompact H II (UCHII) regions. Their findings indicated an increase in the abundance of SO and SO2 with the evolutionary stages. Additionally, they observed a positive correlation of SO and SO2 with the gas kinetic temperature (Tk), dust temperature (Tdust), luminosity (L), and luminosity-to-mass ratio (L/M). Similar trends were obtained for the evolutionary stages of the low-mass star-forming regions with our analysis. However, they did not find a tangible trend for the SO/SO2 ratio with the evolutionary stages. Initially, they observed an increasing trend for SO/SO2 during the transition from cold HMSC to warm HMSC. For HMPO and UCHII, a comparative decrease was noted compared to the HMSC stages. However, they did find that the SO/SO2 ratio consistently exceeded 1. Furthermore, Herpin et al. (2009) observed two mid-infrared quiet and two brighter massive cores. They determined that for cold outer regions (approximately 60 K), the SO/SO2 ratio increases with the evolutionary stages. However, a definitive trend for the inner region could not be established based on their observations, whereas Wakelam et al. (2011) proposed that this ratio decreases with time in massive cores. Based on the low-energy transitions obtained in our study, we observed a declining trend for the SO/SO2 ratio with the evolutionary stages of the low-mass star-forming region, which is just the opposite of that obtained by Herpin et al. (2009) and partially hinted from Fontani et al. (2023) for the high-mass star-forming region. The observed opposite trend between high-mass and low-mass cases arises due to several factors, such as density, temperature, envelope mass, and luminosity spatial resolutions. We need a large sample for both high-mass and low-mass cases with similar angular resolutions and sensitivity observations for statistical analysis. The column density ratio between SO2 and SO is reported by Artur et al. (2023) as a function of bolometric temperature
5.3 Chemical modeling
We use the three-phase (phase I
In an ideal scenario, it would be savvy to analyze how a molecular cloud evolves as it moves from the prestellar core stage to the Class I stage. However, for simplicity, we will limit our model to the Class 0 stage. Here, we track the time evolution of both the inner portion and envelope of a cloud. Three stages are considered (see Figure 9): collapsing stage (
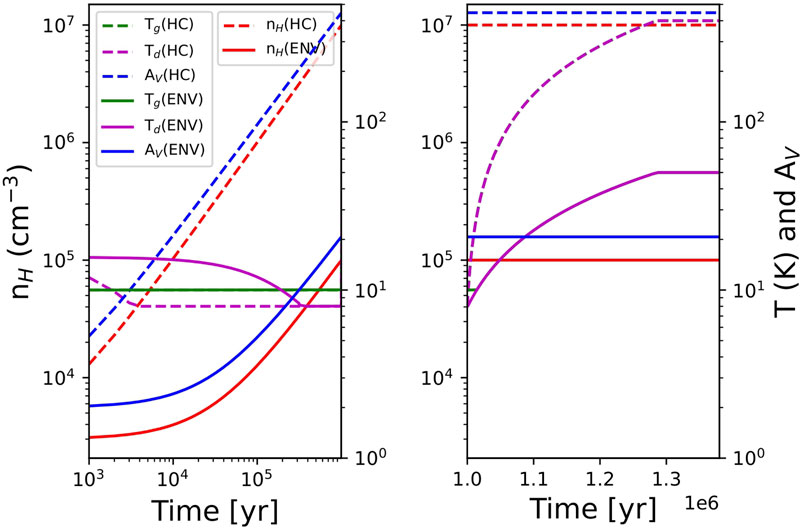
Figure 9. Time evolution of the physical parameters (density, temperature, and
Figures 10, 11 refer to the time evolution of SO and SO2 and their ratio, respectively. The observed abundances shown in Figure 1 depict a sequential increasing trend from the prestellar core phase/first hydrostatic collapse phase (cold gas) to the Class 0 phase (warm gas). Our modeled abundances shown in Figure 10 show a similar trend. The horizontal lines mark the observed abundances. For the cold region (collapsing phase), the observed abundances of SO and SO2 are taken from the abundances reported in Table 3 for L1544 and B1-b. For the warmer region (warm-up and post-warm-up stages), the abundances noted for the IRAS4A and SVS13A are highlighted. In the cold phase, the abundances of SO and SO2 in the inner region (HC) match well with the observation at a time of
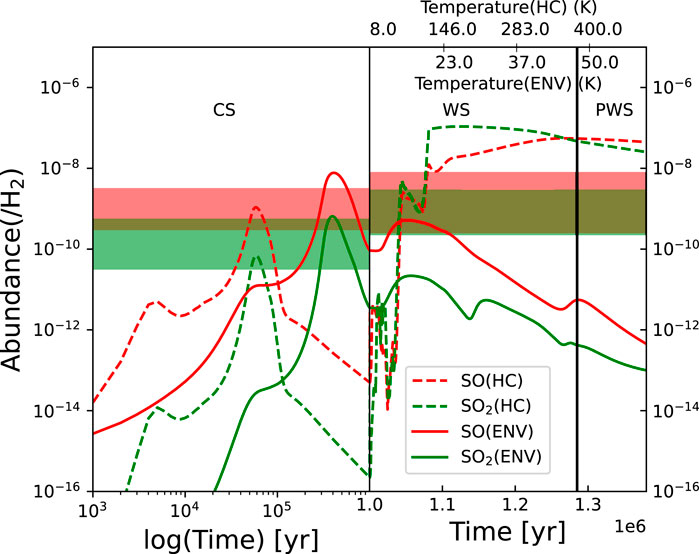
Figure 10. Time evolution of SO and SO2 in the inner (HC) and outer (ENV) regions is represented by the dashed and solid curves, respectively. Various evolutionary stages (CS
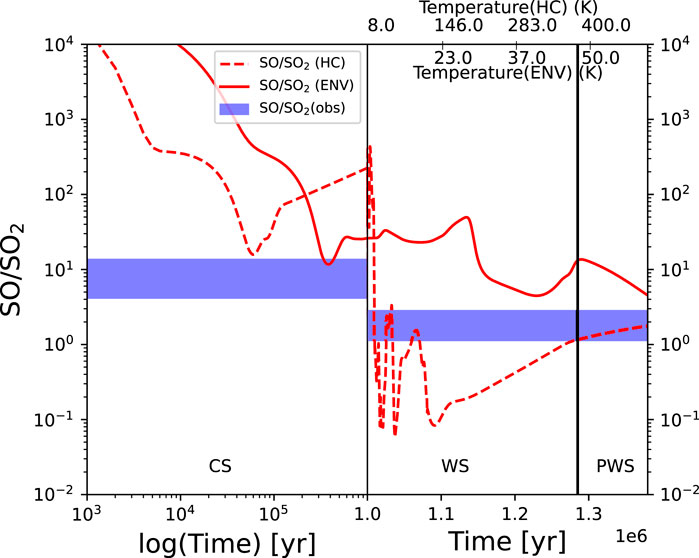
Figure 11. Time evolution of the SO/SO2 ratio in the inner (HC) and outer (ENV) regions. Various evolutionary stages are annotated as given in Figure 1. The horizontal shaded region represents the observed abundances from Table 3 for the cold region (L1544 and B1b) and warm region (IRAS4A and SVS13A).
In Figure 11demonstrates a decreasing trend from, the time evolution of SO/SO2 is depicted. The observed abundance ratio between SO and SO2 (see Figure 8) demonstrates a decreasing trend from cold gas to hot gas. This decreasing trend is similarly reflected in the modeled ratio depicted in Figure 11. Over time, density increases in the collapse stage, resulting in a steady declining trend of this ratio up to approximately
Drozdovskaya et al. (2018) carried out the large unbiased Protostellar Interferometric Line Survey (PILS) of IRAS 16293-2422 with ALMA in the
6 Conclusion
We systematically investigated two primary sulfur-bearing species and their corresponding isotopologues by employing systematic data from the IRAM 30 m and astrochemical simulations. The major conclusions of this work are summarized as follows.
We note that additional observations of sample sources at various phases are required to obtain a trustworthy picture of the chemical evolution throughout the solar-type star-formation process. This entails not just a significantly higher quantity of sources but also higher spatial and angular resolution to enable meaningful comparison across various evolutionary stages.
Data availability statement
Publicly available datasets were analyzed in this study. This data can be found here: We analyzed the ASAI data available in https://www.iram.fr/ILPA/LP007/. The CASSIS 503 software (https://cassis.irap.omp.eu/) was used for line analysis and for line identification.
Author contributions
RG: writing–original draft and writing–review and editing. AD: writing–original draft and writing–review and editing. PG: writing–original draft and writing–review and editing. SM: writing–original draft and writing–review and editing. KF: writing–original draft and writing–review and editing. KT: writing–original draft and writing–review and editing. TS: writing–original draft and writing–review and editing.
Funding
The author(s) declare that no financial support was received for the research, authorship, and/or publication of this article.
Acknowledgments
RG acknowledges the support from the Swami Vivekananda Merit-cum-Means Scholarship provided by the Government of West Bengal. AD is grateful for the assistance from the Centre for Astrochemical Studies (CAS) division at Max Planck Institute for Extraterrestrial Physics, Germany.
Conflict of interest
The authors declare that the research was conducted without any commercial or financial relationships that could potentially create a conflict of interest.
The author(s) declared that they were an editorial board member of Frontiers, at the time of submission. This had no impact on the peer review process and the final decision.
Publisher’s note
All claims expressed in this article are solely those of the authors and do not necessarily represent those of their affiliated organizations, or those of the publisher, the editors, and the reviewers. Any product that may be evaluated in this article, or claim that may be made by its manufacturer, is not guaranteed or endorsed by the publisher.
Footnotes
1https://publicwiki.iram.es/Iram30mEfficiencies
3http://cdms.astro.uni-koeln.de/classic/
References
Anglada, G., Rodríguez, L. F., and Torrelles, J. M. (2000). Discovery of a subarcsecond radio binary associated with the SVS 13 star in the HH 7-11 region. Astrophysical J. Lett. 542, L123–L126. doi:10.1086/312933
Artur, E., Guzmán, V. V., Jørgensen, J. K., Kristensen, L. E., Bergin, E. A., Harsono, D., et al. (2022). Physical properties of accretion shocks toward the Class I protostellar system Oph-IRS 44. Astronomy Astrophysics 667, A20. doi:10.1051/0004-6361/202244312
Artur, E., Guzmán, V. V., Yang, Y. L., Zhang, Y., and Sakai, N. (2023). The Perseus ALMA Chemical Survey (PEACHES). III. Sulfur-bearing species tracing accretion and ejection processes in young protostars. Astronomy Astrophysics 678, A124. doi:10.1051/0004-6361/202346728
Belloche, A., Maury, A. J., Maret, S., Anderl, S., Bacmann, A., André, P., et al. (2020). Questioning the spatial origin of complex organic molecules in young protostars with the CALYPSO survey. Astronomy Astrophysics 635, A198. doi:10.1051/0004-6361/201937352
Belov, S. P., Tretyakov, M. Y., Kozin, I. N., Klisch, E., Winnewisser, G., Lafferty, W. J., et al. (1998). High frequency transitions in the rotational spectrum of SO 2. J. Mol. Spectrosc. 191, 17–27. doi:10.1006/.jmsp.1998.7576
Belov, S. P., Yamada, K. M. T., Winnewisser, G., Poteau, L., Bocquet, R., Demaison, J., et al. (1995). Terahertz rotational spectrum of H 2S. J. Mol. Spectrosc. 173, 380–390. doi:10.1006/jmsp.1995.1242
Bhat, B., Kar, R., Mondal, S. K., Ghosh, R., Gorai, P., Shimonishi, T., et al. (2023). Chemical evolution of some selected complex organic molecules in low-mass star-forming regions. Astrophysical J. 958, 111. doi:10.3847/1538-4357/acfc4d
Bianchi, E., Codella, C., Ceccarelli, C., Vazart, F., Bachiller, R., Balucani, N., et al. (2019). The census of interstellar complex organic molecules in the Class I hot corino of SVS13-A. Mon. Notices R. Astronomical Soc. 483, 1850–1861. doi:10.1093/mnras/sty2915
Biver, N., Bockelee-Morvan, D., Colom, P., Crovisier, J., Davies, J. K., Dent, W. R. F., et al. (1997). Evolution of the outgassing of Comet Hale-Bopp (C/1995 O1) from radio observations. Science 275, 1915–1918. doi:10.1126/science.275.5308.1915
Bizzocchi, L., Caselli, P., Leonardo, E., and Dore, L. (2013). Detection of 15NNH+ in L1544: non-LTE modelling of dyazenilium hyperfine line emission and accurate 14N/15N values. Astronomy Astrophysics 555, A109. doi:10.1051/.0004-6361/201321276
Blake, G. A., Sandell, G., van Dishoeck, E. F., Groesbeck, T. D., Mundy, L. G., and Aspin, C. (1995). A molecular line study of NGC 1333/IRAS 4. Astrophysical J. 441, 689. doi:10.1086/175392
Bogey, M., Civiš, S., Delcroix, B., Demuynck, C., Krupnov, A. F., Quiguer, J., et al. (1997). Microwave spectrum up to 900 GHz of SO created in highly excited states by electric discharge and UV-laser photolysis. J. Mol. Spectrosc. 182, 85–97. doi:10.1006/.jmsp.1996.7218
Boogert, A. C. A., Schutte, W. A., Helmich, F. P., Tielens, A. G. G. M., and Wooden, D. H. (1997). Infrared observations and laboratory simulations of interstellar CH_4_and SO_2_. Astronomy Astrophysics 317, 929–941.
Bottinelli, S., Ceccarelli, C., Lefloch, B., Williams, J. P., Castets, A., Caux, E., et al. (2004). Complex molecules in the hot core of the low-mass protostar NGC 1333 IRAS 4A. Astrophysical J. 615, 354–358. doi:10.1086/.423952
Bottinelli, S., Ceccarelli, C., Williams, J. P., and Lefloch, B. (2007). Hot corinos in NGC 1333-IRAS4B and IRAS2A. Astronomy Astrophysics 463, 601–610. doi:10.1051/.0004-6361:20065139
Buckle, J., and Fuller, G. (2003). Sulphur-bearing species as chemical clocks for low mass protostars? A& 399, 567–581. doi:10.1051/0004-6361:20021816
Caselli, P., Pineda, J. E., Sipilä, O., Zhao, B., Redaelli, E., Spezzano, S., et al. (2022). The Central 1000 au of a Prestellar Core Revealed with ALMA. II. Almost Complete Freeze-out. Astrophysical J. 929, 13. doi:10.3847/.1538-4357/ac5913
Caselli, P., Pineda, J. E., Zhao, B., Walmsley, M. C., Keto, E., Tafalla, M., et al. (2019). The Central 1000 au of a Pre-stellar Core Revealed with ALMA. I. 1.3 mm Continuum Observations. Astrophysical J. 874, 89. doi:10.3847/1538-4357/ab0700
Caux, E., Bottinelli, S., Vastel, C., and Glorian, J. M. (2011). “CASSIS, a software package to analyse high spectral resolution observations,” in The molecular universe. Editors J. Cernicharo, and R. Bachiller, 280, 120.
Cazaux, S., Carrascosa, H., Muñoz Caro, G. M., Caselli, P., Fuente, A., Navarro-Almaida, D., et al. (2022). Photoprocessing of H2S on dust grains. Building S chains in translucent clouds and comets. Astronomy Astrophysics 657, A100. doi:10.1051/0004-6361/202141861
Ceccarelli, C., Caselli, P., Fontani, F., Neri, R., López-Sepulcre, A., Codella, C., et al. (2017). Seeds Of Life In Space (SOLIS): The Organic Composition Diversity at 300-1000 au Scale in Solar-type Star-forming Regions. Astrophysical J. 850, 176. doi:10.3847/1538-4357/.aa961d
Cernicharo, J., and Guélin, M. (1987). The physical and chemical state of hcl2. Astronomy Astrophysics 176, 299–316.
Charnley, S. B. (1997). Chemical models of interstellar gas-grain processes - III. Molecular depletion in NGC 2024. Mon. Notices R. Astronomical Soc. 291, 455–460. doi:10.1093/mnras/291.3.455
Chen, X., Launhardt, R., and Henning, T. (2009). IRAM-PdBI observations of binary protostars. I. The hierarchical system SVS 13 in NGC 1333. Astrophysical J. 691, 1729–1737. doi:10.1088/0004-637X/691/2/.1729
Choi, M. (2005). Variability of the NGC 1333 IRAS 4A outflow: silicon monoxide observations. Astrophysical J. 630, 976–986. doi:10.1086/432113
Codella, C., Bachiller, R., and Reipurth, B. (1999). Low and high velocity SiO emission around young stellar objects. Astronomy Astrophysics 343, 585–598.
Codella, C., Bianchi, E., Podio, L., Mercimek, S., Ceccarelli, C., López-Sepulcre, A., et al. (2021). The svs13-a class i chemical complexity as revealed by s-bearing species. arXiv preprint arXiv:2109.01142.
Cox, E. G., Harris, R. J., Looney, L. W., Li, Z.-Y., Yang, H., Tobin, J. J., et al. (2018). ALMA’s polarized view of 10 protostars in the Perseus molecular cloud. Astrophysical J. 855, 92. doi:10.3847/1538-4357/aaacd2
Crapsi, A., Caselli, P., Walmsley, M. C., and Tafalla, M. (2007). Observing the gas temperature drop in the high-density nucleus of L 1544. Astronomy Astrophysics 470, 221–230. doi:10.1051/0004-6361:20077613
Daniel, F., Gérin, M., Roueff, E., Cernicharo, J., Marcelino, N., Lique, F., et al. (2013). Nitrogen isotopic ratios in barnard 1: a consistent study of the n2h+, nh3, cn, hcn, and hnc isotopologues. A& 560, A3. doi:10.1051/0004-6361/201321939
De Simone, M., Codella, C., Ceccarelli, C., López-Sepulcre, A., Witzel, A., Neri, R., et al. (2020). Seeds of Life in Space (SOLIS). X. Interstellar complex organic molecules in the NGC 1333 IRAS 4A outflows. astronomy astrophysics 640, A75. doi:10.1051/0004-6361/201937004
De Simone, M., Codella, C., Testi, L., Belloche, A., Maury, A. J., Anderl, S., et al. (2017). Glycolaldehyde in Perseus young solar analogs. Astronomy Astrophysics 599, A121. doi:10.1051/0004-6361/201630049
Diaz-Rodriguez, A. K., Anglada, G., Blázquez-Calero, G., Osorio, M., Gómez, J. F., Fuller, G. A., et al. (2022). The physical properties of the svs 13 protobinary system: two circumstellar disks and a spiraling circumbinary disk in the making. ApJ 930, 91. doi:10.3847/1538-4357/ac3b50
Dionatos, O., Kristensen, L. E., Tafalla, M., Güdel, M., and Persson, M. (2020). Feedback of molecular outflows from protostars in NGC 1333 revealed by Herschel and Spitzer spectro-imaging observations. Astronomy Astrophysics 641, A36. doi:10.1051/0004-6361/202037684
Drozdovskaya, M. N., van Dishoeck, E. F., Jørgensen, J. K., Calmonte, U., van der Wiel, M. H. D., Coutens, A., et al. (2018). The ALMA-PILS survey: the sulphur connection between protostars and comets: IRAS 16293-2422 B and 67P/Churyumov-Gerasimenko. Mon. Notices R. Astronomical Soc. 476, 4949–4964. doi:10.1093/mnras/.sty462
Esplugues, G. B., Viti, S., Goicoechea, J. R., and Cernicharo, J. (2014). Modelling the sulphur chemistry evolution in Orion KL. Astronomy Astrophysics 567, A95. doi:10.1051/0004-6361/201323010
Fegley, B. (1999). Chemical and physical processing of presolar materials in the solar nebula and the implications for preservation of presolar materials in comets. Space Sci. Rev. 90, 239–252. doi:10.1007/978-94-011-4211-3_22
Fontani, F., Roueff, E., Colzi, L., and Caselli, P. (2023). The evolution of sulphur-bearing molecules in high-mass star-forming cores. Astronomy Astrophysics 680, A58. doi:10.1051/0004-6361/202347565
Fuente, A., Cernicharo, J., Roueff, E., Gerin, M., Pety, J., Marcelino, N., et al. (2016). Ionization fraction and the enhanced sulfur chemistry in Barnard 1. Astronomy Astrophysics 593, A94. doi:10.1051/0004-6361/201628285
Fuente, A., Rivière-Marichalar, P., Beitia-Antero, L., Caselli, P., Wakelam, V., Esplugues, G., et al. (2023). Gas phase Elemental abundances in Molecular cloudS (GEMS). VII. Sulfur elemental abundance. Astronomy Astrophysics 670, A114. doi:10.1051/0004-6361/202244843
Furuya, K., Aikawa, Y., Hincelin, U., Hassel, G. E., Bergin, E. A., Vasyunin, A. I., et al. (2015). Water deuteration and ortho-to-para nuclear spin ratio of H2 in molecular clouds formed via the accumulation of H I gas. Astronomy Astrophysics 584, A124. doi:10.1051/0004-6361/201527050
Furuya, K., Drozdovskaya, M. N., Visser, R., van Dishoeck, E. F., Walsh, C., Harsono, D., et al. (2017). Water delivery from cores to disks: deuteration as a probe of the prestellar inheritance of H2O. Astronomy Astrophysics 599, A40. doi:10.1051/0004-6361/201629269
Furuya, K., Oba, Y., and Shimonishi, T. (2022). Quantifying the chemical desorption of H2S and PH3 from amorphous water-ice surfaces. Astrophysical J. 926, 171. doi:10.3847/1538-4357/ac4260
García-Rojas, J., Esteban, C., Peimbert, M., Costado, M., Rodríguez, M., Peimbert, A., et al. (2006). Faint emission lines in the galactic h ii regions m16, m20 and ngc 3603. MNRAS 368, 253–279. doi:10.1111/j.1365-2966.2006.10105.x
Garrod, R. T. (2013). A three-phase chemical model of hot cores: the formation of Glycine. Astrophysical J. 765, 60. doi:10.1088/0004-637X/765/1/60
Garrod, R. T., and Pauly, T. (2011). On the formation of co2 and other interstellar ices. ApJ 735, 15. doi:10.1088/.0004-637X/735/1/15
Gerin, M., Pety, J., Commercon, B., Fuente, A., Cernicharo, J., Marcelino, N., et al. (2017). Evidence for disks at an early stage in class 0 protostars? A& 606, A35. doi:10.1051/0004-6361/201630187
Goldsmith, P. F., and Langer, W. D. (1999). Population diagram analysis of molecular line emission. Astrophysical J. 517, 209–225. doi:10.1086/307195
Gorai, P., Das, A., Das, A., Sivaraman, B., Etim, E. E., and Chakrabarti, S. K. (2017). A search for interstellar monohydric thiols. Astrophysical J. 836, 70. doi:10.3847/1538-4357/836/1/70
Graedel, T. E., Langer, W. D., and Frerking, M. A. (1982). The kinetic chemistry of dense interstellar clouds. apjs 48, 321–368. doi:10.1086/190780
Harsono, D., Jørgensen, J. K., van Dishoeck, E. F., Hogerheijde, M. R., Bruderer, S., Persson, M. V., et al. (2014). Rotationally-supported disks around Class I sources in Taurus: disk formation constraints. Astronomy Astrophysics 562, A77. doi:10.1051/0004-6361/201322646
Hatchell, J., Fuller, G. A., and Richer, J. S. (2007). Star formation in Perseus. III. Outflows. Astronomy Astrophysics 472, 187–198. doi:10.1051/0004-6361:20066467
Hatchell, J., Richer, J. S., Fuller, G. A., Qualtrough, C. J., Ladd, E. F., and Chandler, C. J. (2005). Star formation in Perseus. Clusters, filaments and the conditions for star formation. Astronomy Astrophysics 440, 151–161. doi:10.1051/0004-6361:20041836
Hatchell, J., Thompson, M. A., Millar, T. J., and MacDonald, G. H. (1998). Sulphur chemistry and evolution in hot cores. Astronomy Astrophysics 338, 713–722.
Herpin, F., Marseille, M., Wakelam, V., Bontemps, S., and Lis, D. C. (2009). S-bearing molecules in massive dense cores. Astronomy Astrophysics 504, 853–867. doi:10.1051/0004-6361/200811257
Hirota, T., Bushimata, T., Choi, Y. K., Honma, M., Imai, H., Iwadate, K., et al. (2008). Astrometry of H2O masers in nearby star-forming regions with VERA. II. SVS13 NGC1333. Publ. ASJ 60, 37–44. doi:10.1093/pasj/.60.1.37
Holdship, J., Viti, S., Jimenez-Serra, I., Lefloch, B., Codella, C., Podio, L., et al. (2016). H2S in the L1157-B1 bow shock. Mon. Notices R. Astronomical Soc. 463, 802–810. doi:10.1093/mnras/stw1977
Hsieh, T. H., Pineda, J. E., Segura-Cox, D. M., Caselli, P., Valdivia-Mena, M. T., Gieser, C., et al. (2024). PRODIGE – envelope to Disk with NOEMA III. The origin of complex organic molecule emission in SVS13A. arXiv e-prints arXiv:2403.16892 686, A289. doi:10.1051/0004-6361/202449417
Huang, Y.-H., and Hirano, N. (2013). Probing the earliest stage of protostellar evolution—barnard 1-bN and barnard 1-bS. Astrophysical J. 766, 131. doi:10.1088/.0004-637X/766/2/131
Jenkins, E. B. (2009). A unified representation of gas-phase element depletions in the interstellar medium. Astrophysical J. 700, 1299–1348. doi:10.1088/.0004-637X/700/2/1299
Jiménez-Escobar, A., Muñoz Caro, G. M., Ciaravella, A., Cecchi-Pestellini, C., Candia, R., and Micela, G. (2012). Soft X-ray irradiation of H2S ice and the presence of S2 in comets. Astrophysical J. Lett. 751, L40. doi:10.1088/2041-8205/751/2/L40
Johnstone, D., Rosolowsky, E., Tafalla, M., and Kirk, H. (2010). Dense gas tracers in Perseus: relating the N2H+, NH3, and dust continuum properties of pre- and protostellar cores. Astrophysical J. 711, 655–670. doi:10.1088/0004-637X/711/2/655
Jørgensen, J. K., Schöier, F. L., and van Dishoeck, E. F. (2004). Molecular inventories and chemical evolution of low-mass protostellar envelopes. Astronomy Astrophysics 416, 603–622. doi:10.1051/0004-6361:20034440
Karska, A., Herczeg, G. J., van Dishoeck, E. F., Wampfler, S. F., Kristensen, L. E., Goicoechea, J. R., et al. (2013). Water in star-forming regions withHerschel(WISH): III. Far-infrared cooling lines in low-mass young stellar objects⋆. Astronomy Astrophysics 552, A141. doi:10.1051/.0004-6361/201220028
Keto, E., and Caselli, P. (2010). Dynamics and depletion in thermally supercritical starless cores. MNRAS 402, 1625–1634. doi:10.1111/j.1365-2966.2009.16033.x
Klaus, T., Saleck, A. H., Belov, S. P., Winnewisser, G., Hirahara, Y., Hayashi, M., et al. (1996). Pure rotational spectra of SO: rare isotopomers in the 80-GHz to 1.1-THz region. J. Mol. Spectrosc. 180, 197–206. doi:10.1006/jmsp.1996.0243
Kolesniková, L., Tercero, B., Cernicharo, J., Alonso, J. L., Daly, A. M., Gordon, B. P., et al. (2014). Spectroscopic characterization and detection of ethyl mercaptan in orion. Astrophysical J. Lett. 784, L7. doi:10.1088/.2041-8205/784/1/L7
Kristensen, L. E., van Dishoeck, E. F., Bergin, E. A., Visser, R., Yıldız, U. A., San Jose-Garcia, I., et al. (2012). Water in star-forming regions with Herschel (WISH). II. Evolution of 557 GHz 110-101 emission in low-mass protostars. Astronomy Astrophysics 542, A8. doi:10.1051/0004-6361/201118146
Laas, J. C., and Caselli, P. (2019). Modeling sulfur depletion in interstellar clouds. Astronomy Astrophysics 624, A108. doi:10.1051/0004-6361/201834446
Larson, R. B. (1969). Numerical calculations of the dynamics of a collapsing proto-star*. Mon. Notices R. Astronomical Soc. 145, 271–295. doi:10.1093/mnras/145.3.271
Lefèvre, C., Cabrit, S., Maury, A. J., Gueth, F., Tabone, B., Podio, L., et al. (2017). CALYPSO view of SVS 13A with PdBI: multiple jet sources. Astronomy Astrophysics 604, L1. doi:10.1051/0004-6361/201730766
Lefloch, B., Bachiller, R., Ceccarelli, C., Cernicharo, J., Codella, C., Fuente, A., et al. (2018). Astrochemical evolution along star formation: overview of the IRAM Large Program ASAI. Mon. Notices R. Astronomical Soc. 477, 4792–4809. doi:10.1093/mnras/sty937
Lefloch, B., Castets, A., Cernicharo, J., Langer, W. D., and Zylka, R. (1998). Cores and cavities in NGC 1333. Astronomy Astrophysics 334, 269–279.
Lodders, K. (2003). Solar system abundances and condensation temperatures of the elements. apj 591, 1220–1247. doi:10.1086/375492
Loison, J.-C., Wakelam, V., Gratier, P., Hickson, K. M., Bacmann, A., Agúndez, M., et al. (2019). Oxygen fractionation in dense molecular clouds. Mon. Notices R. Astronomical Soc. 485, 5777–5789. doi:10.1093/.mnras/stz560
Looney, L. W., Mundy, L. G., and Welch, W. J. (2000). Unveiling the circumstellar envelope and disk: a subarcsecond survey of circumstellar structures. Astrophysical J. 529, 477–498. doi:10.1086/308239
López-Sepulcre, A., Jaber, A. A., Mendoza, E., Lefloch, B., Ceccarelli, C., Vastel, C., et al. (2015). Shedding light on the formation of the pre-biotic molecule formamide with ASAI. Mon. Notices R. Astronomical Soc. 449, 2438–2458. doi:10.1093/mnras/stv377
López-Sepulcre, A., Sakai, N., Neri, R., Imai, M., Oya, Y., Ceccarelli, C., et al. (2017). Complex organics in IRAS 4A revisited with ALMA and PdBI: striking contrast between two neighbouring protostellar cores. Astronomy Astrophysics 606, A121. doi:10.1051/0004-6361/201630334
Mandeville, C. W. (2010). Sulfur: a ubiquitous and useful tracer in earth and planetary sciences. Elements 6, 75–80. doi:10.2113/gselements.6.2.75
Marcelino, N., Agúndez, M., Cernicharo, J., Roueff, E., and Tafalla, M. (2018). Discovery of the elusive radical NCO and confirmation of H2NCO+ in space. Astronomy Astrophysics 612, L10. doi:10.1051/0004-6361/201833074
Martín-Hernández, N. L., Peeters, E., Morisset, C., Tielens, A. G. G. M., Cox, P., Roelfsema, P. R., et al. (2002). ISO spectroscopy of compact H II regions in the Galaxy. II. Ionization and elemental abundances. Astronomy Astrophysics 381, 606–627. doi:10.1051/0004-6361:20011504
McGuire, B. A. (2022). 2021 census of interstellar, circumstellar, extragalactic, protoplanetary disk, and exoplanetary molecules. Astrophysical J. Suppl. 259, 30. doi:10.3847/.1538-4365/ac2a48
Müller, H. S. P., Schlöder, F., Stutzki, J., and Winnewisser, G. (2005). The Cologne Database for Molecular Spectroscopy, CDMS: a useful tool for astronomers and spectroscopists. J. Mol. Struct. 742, 215–227. doi:10.1016/j.molstruc.2005.01.027
Navarro-Almaida, D., Le Gal, R., Fuente, A., Rivière-Marichalar, P., Wakelam, V., Cazaux, S., et al. (2020). Gas phase Elemental abundances in Molecular cloudS (GEMS). II. On the quest for the sulphur reservoir in molecular clouds: the H2S case. Astronomy Astrophysics 637, A39. doi:10.1051/0004-6361/201937180
Oba, Y., Tomaru, T., Kouchi, A., and Watanabe, N. (2019). Physico-chemical behavior of hydrogen sulfide induced by reactions with H and D atoms on different types of ice surfaces at low temperature. Astrophysical J. 874, 124. doi:10.3847/1538-4357/ab0961
Ospina-Zamudio, J., Lefloch, B., Ceccarelli, C., Kahane, C., Favre, C., López-Sepulcre, A., et al. (2018). First hot corino detected around an isolated intermediate-mass protostar: cep E-mm. Astronomy Astrophysics 618, A145. doi:10.1051/0004-6361/201832857
Oya, Y., López-Sepulcre, A., Sakai, N., Watanabe, Y., Higuchi, A. E., Hirota, T., et al. (2019). Sulfur-bearing species tracing the disk/envelope system in the class I protostellar source elias 29. Astrophysical J. 881, 112. doi:10.3847/1538-4357/ab2b97
Palumbo, M. E., Tielens, A. G. G. M., and Tokunaga, A. T. (1995). Solid carbonyl sulphide (OCS) in W33A. Astrophysical J. 449, 674. doi:10.1086/176088
Pasek, M. A., Milsom, J. A., Ciesla, F. J., Lauretta, D. S., Sharp, C. M., and Lunine, J. I. (2005). Sulfur chemistry with time-varying oxygen abundance during Solar System formation. Icarus 175, 1–14. doi:10.1016/j.icarus.2004.10.012
Pezzuto, S., Elia, D., Schisano, E., Strafella, F., Di Francesco, J., Sadavoy, S., et al. (2012). Herschel observations of B1-bS and B1-bN: two first hydrostatic core candidates in the Perseus star-forming cloud. Astronomy Astrophysics 547, A54. doi:10.1051/0004-6361/201219501
Podio, L., Lefloch, B., Ceccarelli, C., Codella, C., and Bachiller, R. (2014). Molecular ions in the protostellar shock L1157-B1. Astronomy Astrophysics 565, A64. doi:10.1051/0004-6361/201322928
Rivière-Marichalar, P., Fuente, A., Goicoechea, J. R., Pety, J., Le Gal, R., Gratier, P., et al. (2019). Abundances of sulphur molecules in the Horsehead nebula. First NS+ detection in a photodissociation region. Astronomy Astrophysics 628, A16. doi:10.1051/0004-6361/201935354
Rocha, W. R. M., van Dishoeck, E. F., Ressler, M. E., van Gelder, M. L., Slavicinska, K., Brunken, N. G. C., et al. (2024). JWST Observations of Young protoStars (JOYS+): detecting icy complex organic molecules and ions. I. CH4, SO2, HCOO-, OCN-, H2CO, HCOOH, CH3CH2OH, CH3CHO, CH3OCHO, and CH3COOH. Astronomy Astrophysics 683, A124. doi:10.1051/0004-6361/202348427
Sakai, N., Sakai, T., Hirota, T., Watanabe, Y., Ceccarelli, C., Kahane, C., et al. (2014). Change in the chemical composition of infalling gas forming a disk around a protostar. nature 507, 78–80. doi:10.1038/nature13000
Santangelo, G., Codella, C., Cabrit, S., Maury, A. J., Gueth, F., Maret, S., et al. (2015). Jet multiplicity in the proto-binary system NGC 1333-IRAS4A: the detailed CALYPSO IRAM-PdBI view⋆⋆⋆. Astronomy Astrophysics 584, A126. doi:10.1051/0004-6361/201526323
Santangelo, G., Nisini, B., Codella, C., Lorenzani, A., Yıldız, U. A., Antoniucci, S., et al. (2014). Water distribution in shocked regions of the NGC 1333-IRAS 4A protostellar outflow. Astronomy Astrophysics 568, A125. doi:10.1051/0004-6361/201424034
Shimonishi, T., Onaka, T., Kawamura, A., and Aikawa, Y. (2016). The detection of a hot molecular core in the large magellanic cloud with ALMA. Astrophysical J. 827, 72. doi:10.3847/0004-637X/827/1/72
Shimonishi, T., Tanaka, K. E. I., Zhang, Y., and Furuya, K. (2023). The detection of hot molecular cores in the small magellanic cloud. Astrophysical J. Lett. 946, L41. doi:10.3847/2041-8213/acc031
Shimonishi, T., Watanabe, Y., Nishimura, Y., Aikawa, Y., Yamamoto, S., Onaka, T., et al. (2018). A multiline study of a high-mass young stellar object in the small magellanic cloud with ALMA: the detection of methanol gas at 0.2 solar metallicity. Astrophysical J. 862, 102. doi:10.3847/1538-4357/aacd0c
Shingledecker, C. N., Lamberts, T., Laas, J. C., Vasyunin, A., Herbst, E., Kästner, J., et al. (2020). Efficient production of S8 in interstellar ices: the effects of cosmic-ray-driven radiation chemistry and nondiffusive bulk reactions. Astrophysical J. 888, 52. doi:10.3847/1538-4357/ab5360
Smith, R. G. (1991). A search for solid H2S in dense clouds. Mon. Notices R. Astronomical Soc. 249, 172–176. doi:10.1093/mnras/249.1.172
Spezzano, S., Caselli, P., Bizzocchi, L., Giuliano, B. M., and Lattanzi, V. (2017). The observed chemical structure of L1544. Astronomy Astrophysics 606, A82. doi:10.1051/.0004-6361/201731262
Sutton, E. C., Peng, R., Danchi, W. C., Jaminet, P. A., Sandell, G., and Russell, A. P. G. (1995). The distribution of molecules in the core of OMC-1. Astrophysical J. 97, 455. doi:10.1086/192147
Tafalla, M., Mardones, D., Myers, P. C., Caselli, P., Bachiller, R., and Benson, P. J. (1998). L1544: a starless dense core with extended inward motions. Astrophysical J. 504, 900–914. doi:10.1086/306115
Taquet, V., Codella, C., De Simone, M., López-Sepulcre, A., Pineda, J. E., Segura-Cox, D., et al. (2020). Seeds of Life in Space (SOLIS). VI. Chemical evolution of sulfuretted species along the outflows driven by the low-mass protostellar binary NGC 1333-IRAS4A. Astronomy Astrophysics 637, A63. doi:10.1051/0004-6361/201937072
Taquet, V., López-Sepulcre, A., Ceccarelli, C., Neri, R., Kahane, C., and Charnley, S. B. (2015). Constraining the abundances of complex organics in the inner regions of solar-type protostars. Astrophysical J. 804, 81. doi:10.1088/0004-637X/804/2/81
Tieftrunk, A., Pineau des Forets, G., Schilke, P., and Walmsley, C. M. (1994). SO and H_2_S in low density molecular clouds. Astronomy Astrophysics 289, 579–596.
Tobin, J. J., Looney, L. W., Li, Z.-Y., Chandler, C. J., Dunham, M. M., Segura-Cox, D., et al. (2016). The VLA nascent disk and multiplicity survey of Perseus protostars (VANDAM). II. Multiplicity of protostars in the Perseus molecular cloud. Astrophysical J. 818, 73. doi:10.3847/0004-637X/818/1/73
Tobin, J. J., Looney, L. W., Li, Z.-Y., Sadavoy, S. I., Dunham, M. M., Segura-Cox, D., et al. (2018). The VLA/ALMA nascent disk and multiplicity (VANDAM) survey of Perseus protostars. VI. Characterizing the formation mechanism for close multiple systems. Astrophysical J. 867, 43. doi:10.3847/1538-4357/.aae1f7
Tychoniec, Ł., van Dishoeck, E. F., van’t Hoff, M. L. R., van Gelder, M. L., Tabone, B., Chen, Y., et al. (2021). Which molecule traces what: chemical diagnostics of protostellar sources. Astronomy Astrophysics 655, A65. doi:10.1051/.0004-6361/202140692
van der Tak, F. F. S., Boonman, A. M. S., Braakman, R., and van Dishoeck, E. F. (2003). “Sulphur chemistry in the envelopes of massive young stars,” in SFChem 2002: chemistry as a diagnostic of star formation. Editors C. L. Curry, and M. Fich, 437. doi:10.48550/arXiv.astro-ph/.0212325
Vastel, C., Ceccarelli, C., Lefloch, B., and Bachiller, R. (2014). The origin of complex organic molecules in prestellar cores. Astrophysical J. 795, L2. doi:10.1088/2041-8205/795/1/L2
Vastel, C., Quénard, D., Le Gal, R., Wakelam, V., Andrianasolo, A., Caselli, P., et al. (2018). Sulphur chemistry in the L1544 pre-stellar core. Mon. Notices R. Astronomical Soc. 478, 5514–5532. doi:10.1093/.mnras/sty1336
Wakelam, V., Caselli, P., Ceccarelli, C., Herbst, E., and Castets, A. (2004). Resetting chemical clocks of hot cores based on S-bearing molecules. Astronomy Astrophysics 422, 159–169. doi:10.1051/0004-6361:20047186
Wakelam, V., Hersant, F., and Herpin, F. (2011). Sulfur chemistry: 1D modeling in massive dense cores. Astronomy Astrophysics 529, A112. doi:10.1051/.0004-6361/201016164
Winton, R. S., and Gordy, W. (1970). High-precision millimeter-wave spectroscopy with the lamb dip. Phys. Lett. A 32, 219–220. doi:10.1016/0375-9601(70)90287-2
Woodney, L. M., A’Hearn, M. F., McMullin, J., and Samarasinha, N. (1997). Sulfur chemistry at millimeter wavelengths in C/Hale-Bopp. Earth Moon Planets 78, 69–70. doi:10.1023/A:1006275412491
Yamamoto, S. (2017). Introduction to astrochemistry: chemical evolution from interstellar clouds to star and planet formation. Springer.
Yan, Y. T., Henkel, C., Kobayashi, C., Menten, K. M., Gong, Y., Zhang, J. S., et al. (2023). Direct measurements of carbon and sulfur isotope ratios in the Milky Way. Astronomy Astrophysics 670, A98. doi:10.1051/.0004-6361/202244584
Yang, Y.-L., Sakai, N., Zhang, Y., Murillo, N. M., Zhang, Z. E., Higuchi, A. E., et al. (2021). The Perseus ALMA chemistry survey (PEACHES). I. The complex organic molecules in Perseus embedded protostars. Astrophysical J. 910, 20. doi:10.3847/1538-4357/.abdfd6
Yıldız, U. A., Kristensen, L. E., van Dishoeck, E. F., Belloche, A., van Kempen, T. A., Hogerheijde, M. R., et al. (2012). APEX-CHAMP+ high-J CO observations of low-mass young stellar objects. III. NGC 1333 IRAS 4A/4B envelope, outflow, and ultraviolet heating. Astronomy Astrophysics 542, A86. doi:10.1051/0004-6361/201118368
Zhang, Z. E., Yang, Y.-l., Zhang, Y., Cox, E. G., Zeng, S., Murillo, N. M., et al. (2023). The Perseus ALMA chemistry survey (PEACHES). II. Sulfur-Bearing species and dust polarization revealing shocked regions in protostars in the Perseus molecular cloud. Astrophysical J. 946, 113. doi:10.3847/1538-4357/acbdf7
Keywords: astrochemistry, interstellar medium, molecules, abundances, low-mass star formation, chemical evolution, astrochemical model
Citation: Ghosh R, Das A, Gorai P, Mondal SK, Furuya K, Tanaka KEI and Shimonishi T (2024) Understanding the various evolutionary stages of the low-mass star-formation process by SO and SO2. Front. Astron. Space Sci. 11:1427048. doi: 10.3389/fspas.2024.1427048
Received: 02 May 2024; Accepted: 30 August 2024;
Published: 25 September 2024.
Edited by:
Laura Colzi, Spanish National Research Council (CSIC), SpainReviewed by:
Francesco Fontani, Osservatorio Astrofisico di Arcetri (INAF), ItalyPooneh Nazari, European Southern Observatory, Germany
Copyright © 2024 Ghosh, Das, Gorai, Mondal, Furuya, Tanaka and Shimonishi. This is an open-access article distributed under the terms of the Creative Commons Attribution License (CC BY). The use, distribution or reproduction in other forums is permitted, provided the original author(s) and the copyright owner(s) are credited and that the original publication in this journal is cited, in accordance with accepted academic practice. No use, distribution or reproduction is permitted which does not comply with these terms.
*Correspondence: Prasanta Gorai, cHJhc2FudGEuYXN0cm9AZ21haWwuY29t