 Alexey Kuznetsov
 Zhao Wu
 Sergey Anfinogentov
 Yang Su
 Yao Chen
94% of researchers rate our articles as excellent or good
Learn more about the work of our research integrity team to safeguard the quality of each article we publish.
Find out more
ORIGINAL RESEARCH article
Front. Astron. Space Sci. , 17 June 2024
Sec. Stellar and Solar Physics
Volume 11 - 2024 | https://doi.org/10.3389/fspas.2024.1407955
This article is part of the Research Topic New Insights into High-Energy Processes on the Sun and Their Geospace Consequences View all 10 articles
We investigated in detail the M5.8 class solar flare that occurred on 2023-03-06. This flare was one of the first strong flares observed by the Siberian Radioheliograph in the microwave range and the Advanced Space-based Solar Observatory in the X-ray range. The flare consisted of two separate flaring events (a “thermal” and a “cooler” ones), and was associated with (and probably triggered by) a filament eruption. During the first part of the flare, the microwave emission was produced in an arcade of relatively short and low flaring loops. During the second part of the flare, the microwave emission was produced by energetic electrons trapped near the top of a large-scale flaring loop; the evolution of the trapped electrons was mostly affected by the Coulomb collisions. Using the available observations and the GX Simulator tool, we created a 3D model of the flare, and estimated the parameters of the energetic electrons in it.
Solar flares are complicated phenomena that cover a broad range of heights in the solar atmosphere and produce electromagnetic emission in a broad range of wavelengths. The flares occur basically due to the sudden magnetic reconnection processes in the solar corona, which result in plasma heating, acceleration of charged particles, etc. (e.g., Benz and Güdel, 2010; Emslie et al., 2012).
To obtain a comprehensive picture of a flare, we need observations in different spectral ranges: e.g., the hard X-rays and white-light and ultraviolet (UV) continuum emissions are produced by non-thermal electrons mainly in the chromosphere at the footpoints of the coronal flaring loops; in the corona, the same electrons produce the microwave continuum emission due to the gyrosynchrotron mechanism; the soft X-rays and extreme ultraviolet (EUV) emission reflect the dynamics of the hot thermal plasma in the corona. Both the evolution of the spatially resolved images and the delays between the emissions at different wavelengths can reflect the dynamics of acceleration and transport of the non-thermal particles (e.g., Aschwanden, 2002). The recent commissioning of such solar-oriented astronomical instruments as the Siberian Radioheliograph (SRH, Altyntsev et al., 2020) and the Hard X-Ray Imager on board the Advanced Space-based Solar Observatory (ASO-S/HXI, Su et al., 2019; Gan et al., 2023), which provide imaging spectroscopy observations in the microwave and hard X-ray ranges, respectively, offers new opportunities to study the solar flares.
In addition to the multiwavelength observations, understanding the nature of solar flares requires data-constrained modeling, which enables us to estimate the physical parameters in the flaring regions and to link the observed phenomena with the underlying processes of energy release and particle acceleration and transport. The recent advances in this field include, e.g., the case studies by Kuznetsov and Kontar (2015), Kuroda et al. (2018), Fleishman et al. (2018), Fleishman et al. (2021b), Fleishman et al. (2023), where the 3D structures of flares were reconstructed, and the spatial and energy distributions of energetic electrons and their dynamics were determined.
Here we investigate the GOES M5.8 class solar flare that occurred on 2023-03-06, at ∼02:15–03:30 UT; it was one of the first strong flares observed by the SRH and ASO-S/HXI, as well as by other instruments. We present the results of observations and 3D modeling, and analyze the factors affecting the transport of non-thermal electrons.
The microwave images of the flare were obtained using the Siberian Radioheliograph (SRH, Altyntsev et al., 2020). This instrument consists of three independent antenna arrays, two of which (for the frequency bands of 2.8–5.8 and 5.8–11.8 GHz) were operable at the considered date, thus providing imaging observations with the spatial resolutions of 15″− 30″and 12″− 24″, respectively. The observations were performed at 16 equidistant frequencies in each frequency band, i.e., at 32 frequencies in total, with the time resolution of
The initial stage of the considered flare (until ∼ 02:32 UT) was observed also by the Hard X-Ray Imager on board the Advanced Space-based Solar Observatory (ASO-S/HXI, Su et al., 2019; Gan et al., 2023). This instrument provides imaging spectroscopy observations of the solar X-ray emission in the energy range of
In addition to the above observations, we used the data from the instruments on board the Solar Dynamic Observatory: UV and EUV images from the Atmospheric Imaging Assembly (SDO/AIA, Lemen et al., 2012) and magnetograms from the Helioseismic and Magnetic Imager (SDO/HMI, Scherrer et al., 2012). All instruments used in this study are summarized in Table 1.
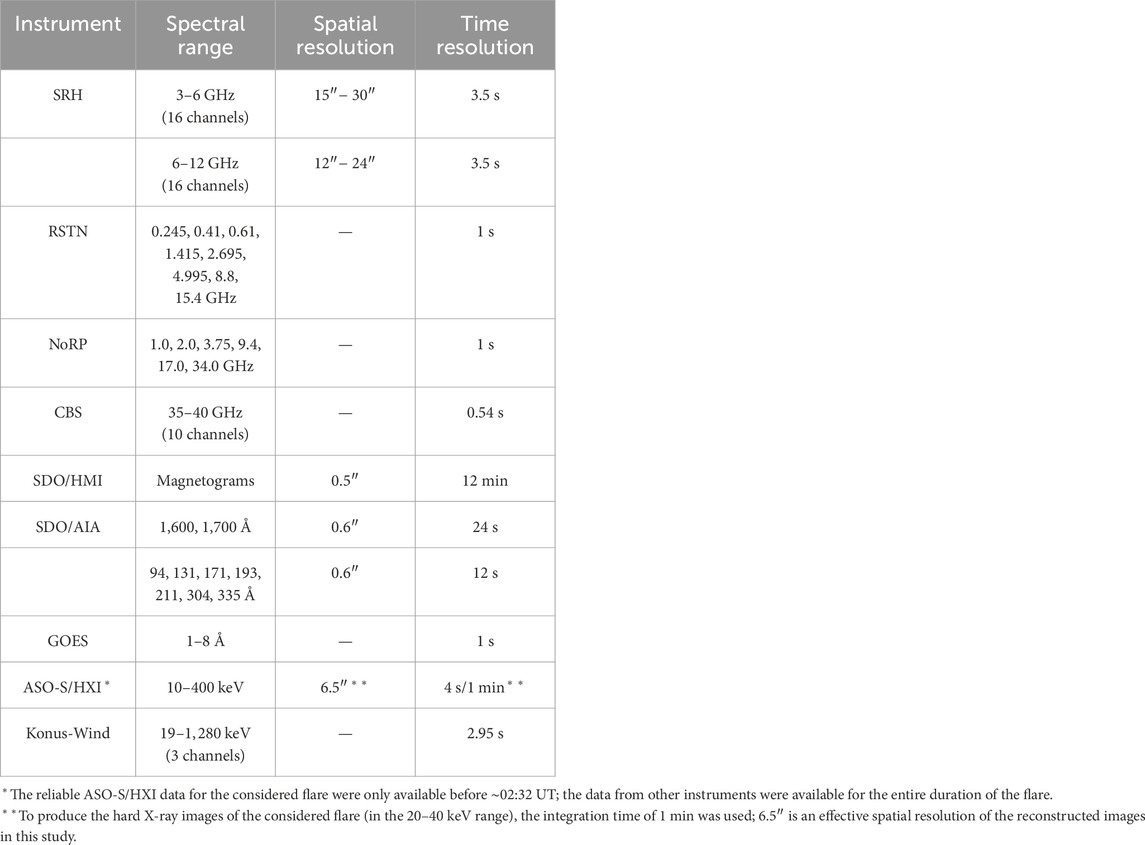
Table 1. Instruments used in this study.
The considered GOES M5.8 class solar flare occurred on 2023-03-06 in the active region AR 13243 near the western solar limb, at N18W64. Figure 1 demonstrates the light curves of the flare at several selected microwave frequencies and X-ray energy ranges. The SRH light curves represent the microwave fluxes integrated over the 200″× 200″ area centered at the flare. As has been said above, the reliable ASO-S/HXI data are available only before ∼ 02:32 UT; no flare-related X-ray signal above 50 keV has been detected during that time interval. No flare-related X-ray signal in the KW 323–1,280 keV channel has been detected as well.

Figure 1. Light curves of the 2023-03-06 solar flare in the microwave (A, B) and X-ray (C) spectral ranges. The SRH light curves in the (A) represent the microwave fluxes from the flaring region; the NoRP and CBS light curves in the (B) are background-subtracted. In the (C), the HXI and KW fluxes are in counts s−1, while the GOES flux is in W m−2 s−1.
From the light curves, one can notice that the flare actually consisted of two separate (but closely related) flaring events, separated by the vertical thick dashed grey line in Figure 1. The first part of the flare (before ∼02:33 UT) was mostly “thermal” (cf. Fleishman et al., 2015, and references therein): the X-ray spectrum was relatively soft, with no significant flux above
In the second, “cooler” part of the event (after ∼ 02:33 UT), the X-ray spectrum became considerably harder, with the KW 78–323 keV flux considerably higher, but the KW 19–78 keV and GOES 1–8 Å fluxes lower than during the first part of the flare. The non-thermal microwave emission, too, reached much higher intensities than during the first part of the flare. One can distinguish the impulsive phase of the flare (∼02:34–02:43), which was characterized by a prominent hard X-ray emission with multiple local peaks, corresponding likely to separate acts of magnetic reconnection. The microwave emission demonstrated firstly a similar dynamics with multiple peaks (especially at the frequencies of
A notable feature of the considered event was a filament eruption that occurred immediately before the flare. Figure 2 demonstrates a sequence of the SDO/AIA 335 Å EUV images of the flaring region. The eruption started at ∼ 02:11 UT, i.e., well before the brightenings in the microwave and X-ray ranges. At 02:19:01 UT, when the first microwave and hard X-ray peak was observed, the filament had already risen up to a height of about 20,000 km. We have found no correlation between the filament parameters and the microwave and X-ray emissions. Therefore, although the filament eruption could trigger the magnetic reconnection and thus initiate the flare, at later stages (after the trigger) the evolutions of the flare and the filament likely diversified and became independent of each other.
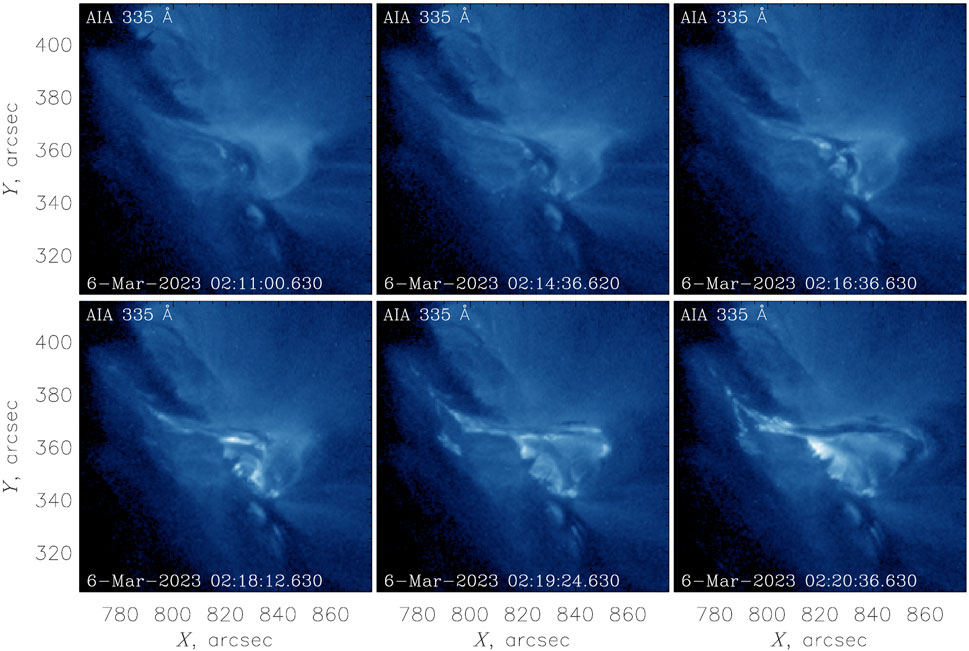
Figure 2. SDO/AIA 335 Å images of the flaring region at six representative times at the beginning of the flare, demonstrating the filament eruption.
Figure 3 demonstrates the images of the 2023-03-06 flare (during its first part) at several selected wavelengths, at three different times corresponding to the hard X-ray peaks, which are also representative of the flare structure and evolution. The ASO-S/HXI images in the 20–40 keV range were reconstructed by HXI_Clean with the preliminarily calibrated sub-collimator groups G3–G10, which generated a spatial resolution of
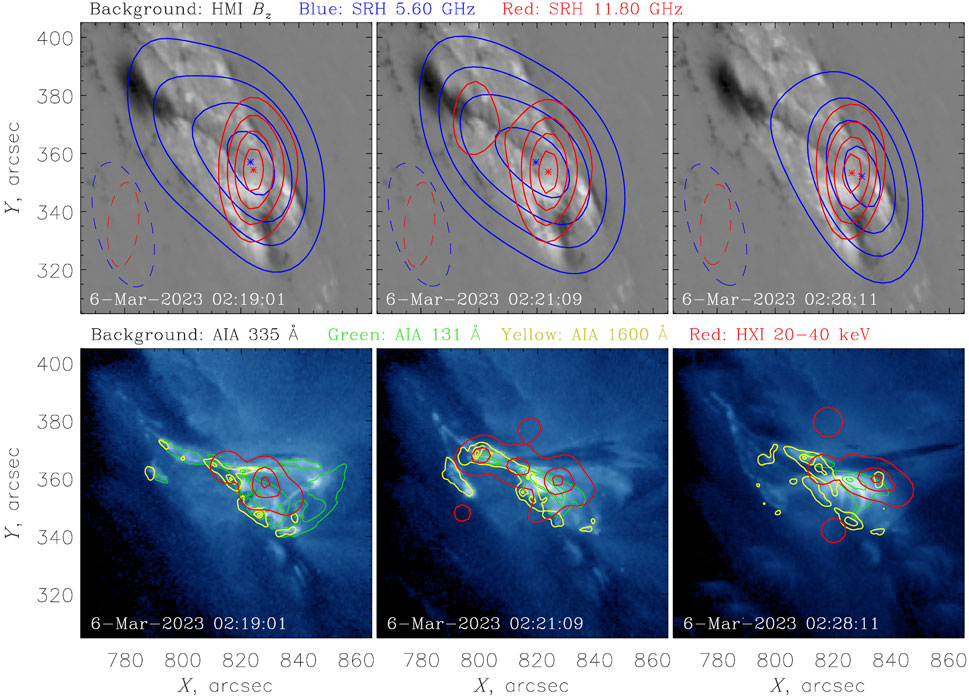
Figure 3. Images of the flaring region at three representative times during the first part of the flare. The top row demonstrates the SRH microwave intensity contours at 5.60 and 11.80 GHz (as solid lines, at 30, 50, 70, and 90% of the respective maximum intensities) overlaid on the SDO/HMI line-of-sight magnetograms; the dashed lines are the corresponding SRH beam contours at 1/2 level. The bottom row demonstrates the SDO/AIA EUV and UV contours at 131 and 1,600 Å, and the ASO-S/HXI X-ray contours in the 20–40 keV range (as solid lines, at 10, 50, and 90% of the respective maximum intensities) overlaid on the SDO/AIA 335 Å images.
In the microwave range, at high frequencies (
To explore the evolution of the microwave sources in more detail, we plotted the locations of the source peaks vs. time (see Figure 4); the peak locations were determined by fitting the microwave maps by an elliptical Gaussian. One can see from the figure that the source motions were rather complicated and frequency-dependent. At low frequencies (2.80–4.20 GHz), the source was firstly located close to the north-eastern edge of the flare ribbons, then shifted to south-west along the ribbons, and finally returned back to nearly the initial position. At higher frequencies (4.40–11.80 GHz), the picture was opposite: the source was firstly located near the south-western edge of the flare ribbons, then shifted to north-east along the ribbons, and finally returned back to nearly the initial position. At high frequencies (
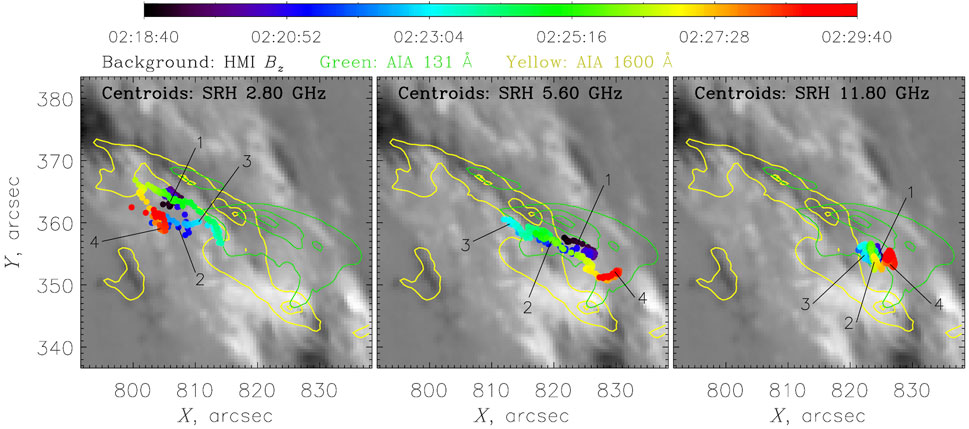
Figure 4. Motion of the microwave emission sources (at the frequencies of 2.80, 5.60, and 11.80 GHz) during the first part of the flare. The colored dots represent the locations of the smoothed maxima (centroids) of the microwave sources at different times; the numbers 1–4 mark the times indicated by vertical dashed lines in Figure 1. The centroid locations are overlaid on the SDO/HMI line-of-sight magnetogram; the solid lines show the SDO/AIA EUV and UV contours at 131 and 1,600 Å (at 10, 50, and 90% of the respective maximum intensities) at the representative time of 02:24:00 UT.
Summarizing the presented observations, we conclude that during the first part of the 2023-03-06 flare, the microwave and hard X-ray emissions were likely produced in a sheared arcade of relatively short and low flaring loops connecting the flare ribbons; this arcade (at least, a part of it) can be seen, e.g., in the 335 Å EUV image at 02:28:11 UT in Figure 3. The hard X-ray emission was of non-thermal thin-target origin. The arcade was located below the erupted filament, and the magnetic reconnection in it was likely triggered by the eruption. The energy release and particle acceleration occurred along the entire arcade, but were not evenly distributed in space and time: the south-western part of the arcade usually dominated, but during a certain time interval (∼02:21–02:23 UT) an intensive particle acceleration occurred near the middle of the arcade as well; the dynamics of the microwave and hard X-ray sources reflected the described dynamics of the energy release process.
Figure 5 demonstrates the images of the 2023-03-06 flare (during its second part, the impulsive phase) at several selected wavelengths, at three different times corresponding to the microwave emission peaks. Unfortunately, as has been said above, we have no imaging X-ray data for this time interval. The flare retained its two-ribbon structure (as seen in the 1,600 Å UV images), although the ribbons changed their configuration and expanded somewhat in the north-eastern direction in comparison with the first part of the flare. In the 131 Å EUV images, one can identify a loop-like structure that connected the flare ribbons, with the footpoints corresponding to the regions of the strongest magnetic fields of opposite polarities; this structure broadened gradually with time.

Figure 5. Images of the flaring region at three representative times during the second part of the flare. The top row demonstrates the SRH microwave intensity contours at 5.60 and 11.80 GHz (as solid lines, at 30, 50, 70, and 90% of the respective maximum intensities) overlaid on the SDO/HMI line-of-sight magnetograms; the dashed lines are the corresponding SRH beam contours at 1/2 level. The bottom row demonstrates the SDO/AIA EUV and UV contours at 131 and 1,600 Å (as solid lines, at 10, 50, and 90% of the respective maximum intensities) overlaid on the SDO/AIA 335 Å images.
A similar loop-like structure is visible in the microwave images at high frequencies (
Figure 6 shows the motions of the microwave source peaks within the considered time interval. At all frequencies, the emission sources moved gradually along the loop visible in the 131 Å EUV images, from its north-eastern footpoint towards the loop top. This gradual motion demonstrated no visible correlation with the variations of the emission intensity (i.e., with the local peaks in the light curves, see Figure 1). A small departure of the 11.80 GHz source peaks in the southern direction during the time interval marked as 7–8 (02:39:56–02:42:55 UT) likely had an instrumental origin related to an insufficient spatial resolution, when in the presence of two nearby actual emission sources (near the loop top and at the south-western footpoint) the resulting observed source centroid was shifted towards the footpoint. At the flare decay phase (after 02:43 UT), the microwave source peaks at all frequencies were located at the loop top.

Figure 6. Motion of the microwave emission sources (at the frequencies of 2.80, 5.60, and 11.80 GHz) during the second part of the flare. The colored dots represent the locations of the smoothed maxima (centroids) of the microwave sources at different times; the numbers 5–8 mark the times indicated by vertical dashed lines in Figure 1. The centroid locations are overlaid on the SDO/HMI line-of-sight magnetogram; the solid lines show the SDO/AIA EUV and UV contours at 131 and 1,600 Å (at 10, 50, and 90% of the respective maximum intensities) at the representative time of 02:34:58 UT.
Summarizing the presented observations, we conclude that during the second part of the 2023-03-06 flare, the microwave emission likely originated from a single large-scale flaring loop (or a tightly packed bundle of such loops). This flaring loop was located above the loop arcade formed at the previous stage of the considered flare. The magnetic reconnection in this large-scale loop, again, could be triggered by the rising filament, although we cannot determine reliably the location of the reconnection site. Initially, the microwave emission was produced mainly in a strong magnetic field near the north-eastern footpoint; the subsequent evolution of the microwave emission sources reflected the process of gradual accumulation of energetic electrons within the loop (mainly near its top), which resulted in the respective shift of the dominant emission source towards the loop top (see also Section 4).
We now analyze the parameters and evolution of the energetic electrons in the considered event. During the first (“thermal”) part of the flare, we have found no significant delays between the microwave and hard X-ray emissions (between the peaks in the light curves, see Figure 1), which indicates that the particle trapping and accumulation in the flaring loops were negligible. Also, the lack of reliable high-energy and high-frequency data (the fluxes in the KW 78–123 keV channel, NoRP 35 GHz channel, and CBS 35–40 GHz channels were too low) does not allow us to infer the parameters of the energetic electron spectrum during this time interval; we can only conclude that the spectrum was sufficiently soft.
Figure 7 demonstrates a zoomed-in fragment of the flare light curves at several selected microwave and hard X-ray channels for the second (“non-thermal”) part of the 2023-03-06 flare (we consider here the impulsive phase only). The figure also shows the optically thin microwave spectral index δMW, defined as
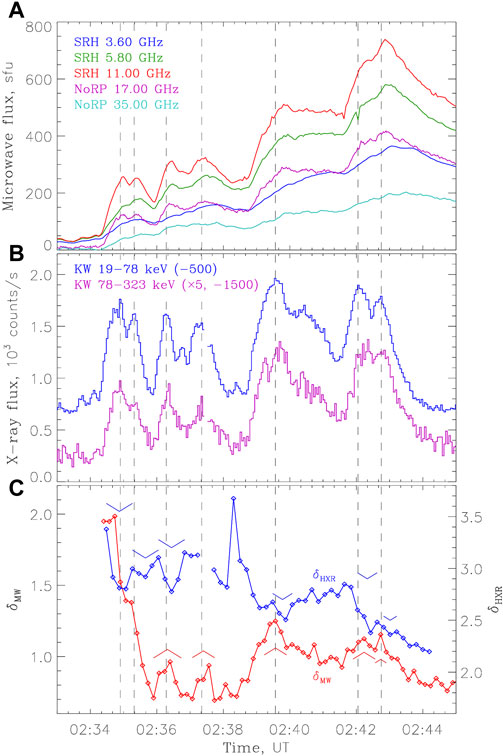
Figure 7. Zoomed-in light curves of the 2023–03–06 solar flare in the microwave (A) and hard X-ray (B) spectral ranges. The power-law spectral indices of the optically thin microwave emission (δMW, derived from the NoRP fluxes at 17 and 34 GHz) and the hard X-ray emission (δHXR, derived from the KW fluxes in the two presented energy ranges) are shown in the (C), with the upward and downward angle brackets marking the time intervals with the hard-soft-hard and soft-hard-soft spectral evolution patterns, respectively. The vertical dashed lines correspond to the X-ray emission peaks at 19–78 keV.
One can see from the figure that the microwave emission was delayed with respect to the hard X-ray one, which represents a signature of the particle transport processes (including trapping). The delays were frequency-dependent and reached
From the hard X-ray light curves, one can notice that most of the emission peaks at higher energies (78–323 keV) were slightly delayed with respects to the peaks at lower energies (19–78 keV); we have estimated the delays as ≲ 5–7 s. As a result, the hard X-ray spectral index δHXR decreased (hardened) slightly during each emission peak, and then increased (softened) again; i.e., the hard X-ray emission and hence the electrons producing the emission demonstrated the “soft-hard-soft” pattern. In addition to those rapid variations, the hard X-ray emission demonstrated an overall hardening trend throughout the impulsive phase of the flare. We also note that the spectral index of the energetic electrons δ derived from the microwave observations
To model the microwave emission of the considered flare, we used the GX Simulator code (Nita et al., 2015; 2023). This code allows one to create a 3D magnetic field model of the flaring region using the nonlinear force-free field extrapolation, to select a flaring loop (or loops), to fill the flaring loop(s) with thermal and non-thermal electrons, and to compute the corresponding gyrosynchrotron and free-free microwave emission using the “fast gyrosynchrotron codes” by Fleishman and Kuznetsov (2010); Kuznetsov and Fleishman (2021). For comparison with the observations, the computed microwave emission maps were then convolved with the SRH beam.
As has been said above, during the first part of the flare, the emission was likely produced in an arcade consisting of multiple flaring loops. A model of such a structure would have too many free parameters. In addition, the lack of microwave data in the optically thin frequency range does not allow us to constrain reliably the spectrum of the emitting electrons; therefore, we do not consider that time interval here. In contrast, during the second part of the flare, the observed structure of the emission sources could be described reasonably well by a single-loop model. Based on the available images in the microwave, UV, and EUV ranges, we selected the flaring loop shown in Figure 8 that provided the best agreement with the observations. The loop had the length of 53,000 km and rose up to the height of 17,000 km; the magnetic field strength (at the loop axis) varied from 170 G at the loop top up to 1,600 and 1,380 G in the north-eastern and south-western footpoints, respectively. By analogy with a number of previous simulations (e.g., Kuznetsov and Kontar, 2015; Kuroda et al., 2018; Fleishman et al., 2021b; 2023; Wu et al., 2024), in order to reduce the number of free parameters, the magnetic structure of the loop (determined by the selected axial magnetic field line) was assumed to be the same at all times throughout the impulsive phase of the flare, and only the parameters of the energetic electrons varied.
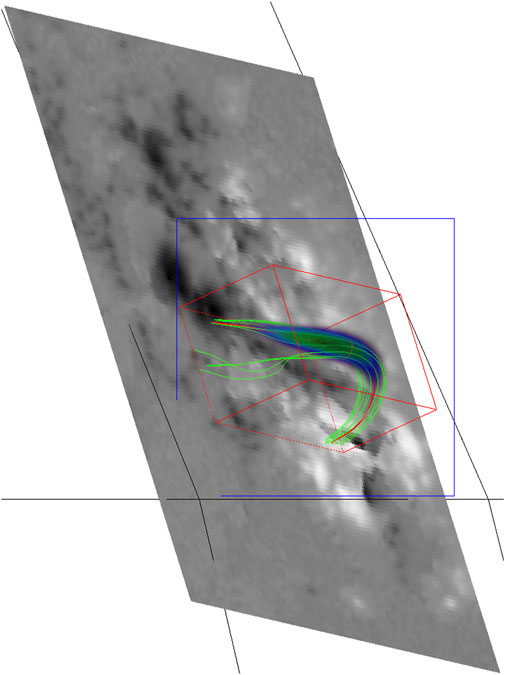
Figure 8. The model of the flaring region (screenshot from GX Simulator), corresponding to 02:34:56 UT: the selected coronal flux tube overlaid on the SDO/HMI magnetogram. The light green lines show the representative magnetic field lines bounding the flux tube, while the green-blue cloud shows the distribution of the energetic electrons.
For the energetic electrons, we adopted a single power-law energy distribution function in the form of f(E) ∝ E−δ, with the electron energy E in the range from 0.01 to 10 MeV, and the electron number density equal to nb; the pitch-angle distribution was assumed to be isotropic. The spatial distribution of the energetic electrons within the flaring region was described by the model function in the form of
where s and r are the coordinates along and across the selected flaring loop, respectively, with the coordinate s measured relative to the loop top and positive in the direction towards the north-eastern footpoint, and the coordinate r measured relative to the loop axis; σs and σr are the characteristic scales of the distribution in the respective directions, and nb0 is the peak electron number density. Following the magnetic flux conservation, the transverse scale σr0 varied along the loop as
We note that the above model is oversimplified and accounts for only the basic characteristics of the energetic electrons in the flaring region. Therefore, our aim was to reproduce: a) the total (spatially integrated) microwave emission spectra of the flare, primarily in the optically thin frequency range (above

Table 2. Parameters of the energetic electron distributions in the GX Simulator models used to simulate the microwave emission of the 2023-03-06 solar flare at different times: characteristic spatial scales in the directions across (σr0) and along (σs) the magnetic field, shifts relative to the loop top (s0), maximum densities (nb0), spectral indices (δ), and total numbers of the energetic electrons within the flaring loop in the 1–10 MeV energy range (N1–10 MeV).

Figure 9. Comparison of the observed and simulated microwave emission parameters at four different times. (A) Observed and simulated microwave intensity contours at 11.80 GHz (at 30, 50, 70, and 90% of the respective maximum intensities) overlaid on the SDO/HMI line-of-sight magnetograms. (B) Observed (by NoRP and RSTN) and simulated total emission spectra; the error bars of the observations are smaller than or comparable to the symbol size.
From Table 2 and Figure 9, one can notice that the energetic electrons in the considered event (during the second part of the flare) were likely concentrated near the top of the flaring loop. Even at 02:34:56 UT, the estimated displacement of the electron distribution from the loop top s0 was relatively small, while the observed emission was concentrated near a footpoint due to a stronger magnetic field there. With time, the electron distribution peak approached gradually the loop top (s0 decreased). The energetic electron distribution along the flaring loop broadened gradually with time, and the effective thickness of the loop increased as well (both σs and σr increased). The spectral index of the energetic electrons δ varied with time, in agreement with the estimations based on the observed microwave spectral index δMW (see Figure 7) and the empirical formula by Dulk and Marsh (1982). The parameter nb0 is not representative, because it depends strongly on the low-energy cutoff of the electron distribution, which was not reliably known and was chosen arbitrarily. A more reliable characteristic is the total number of energetic electrons at high energies, say, above 1 MeV. According to Table 2, this number (N1–10 MeV) increased gradually with time during the impulsive phase of the flare, which reflected the process of accumulation of the energetic electrons in the flaring loop.
The presented observations offer some clues into the non-thermal particle transport processes in the considered flare. During the first part of the flare, we have found no significant delays between the microwave and hard X-ray emissions, which indicates that the energetic electrons injected into the flaring loops then precipitated into the chromosphere nearly immediately, without experiencing a noticeable trapping. Such a behaviour is quite consistent with the above-described scenario suggesting that during the first part of the flare, the energy release processes occurred in an arcade of relatively short flaring loops with low mirror ratios.
On the other hand, during the second part of the flare, the microwave emission peaks were delayed with respect to the X-ray ones by up to
The observed delays between the hard X-ray emission peaks at higher and lower energies (see Figure 7) are consistent with the above scenario, because the hard X-ray emission is produced by the precipitating electrons that escaped from the magnetic trap. As has been said above, in the considered event, the lower-energy trapped electrons were scattered into the loss cone more efficiently (due to the Coulomb collisions), and therefore escaped from the trap and reached the loop footpoints first, then followed by the higher-energy electrons. This explanation implies that the energetic electrons were injected somewhere in the coronal part of the flaring loop, with an isotropic pitch-angle distribution or preferably in the direction across the local magnetic field, so that a significant fraction of the particles became trapped immediately after the injection. The suitable particle acceleration mechanisms include, e.g., stochastic acceleration or acceleration in a collapsing magnetic trap (e.g., Zharkova et al., 2011).
The delay between the hard X-ray emission pulses at the energies of E2 and E1 can be estimated as Δt ≃ τ(E2) − τ(E1), where τ is the characteristic electron scattering time due to the Coulomb collisions, given, e.g., by Eq. 12.5.11 in the monograph of Aschwanden (2005). For the energies of E1 = 20 keV and E2 = 80 keV, the observed delays of Δt ≃ 5–7 s would occur due to scattering in a thermal plasma with the density of about 3 × 1010 cm−3 and the temperature of a few MK. The obtained plasma density value seems to be typical of the coronal flaring loops.
We presented the results of observations and simulations of a M5.8 class solar flare that occurred on 2023-03-06 near the north-eastern solar limb. The flare was observed by a number of instruments, including the Siberian Radioheliograph, Nobeyama Radiopolarimeters, and Radio Solar Telescope Network in the microwave range, Hard X-ray Imager on board the Advanced Space-based Solar Observatory and Konus-Wind on board the Wind spacecraft in the hard X-ray range, and the Solar Dynamic Observatory in the optical, ultraviolet, and extreme ultraviolet ranges. The main results can be summarized as follows:
• The flare consisted of two separate flaring events. The first part of the flare was mostly “thermal,” with a relatively soft spectrum of energetic particles and weak microwave emission. During the second part of the flare, the spectrum of energetic particles was much harder and the microwave emission was much stronger than during the first part.
• A filament eruption occurred at the location of the future flare
• During the first part of the flare, the microwave and X-ray emissions were produced in an arcade of relatively short and low flaring loops. Trapping and accumulation of the energetic particles in the flaring loops were negligible. The evolution of the microwave and hard X-ray sources reflected the dynamics of the energy release processes in the arcade.
• During the second part of the flare, the microwave emission was produced in a single large-scale flaring loop. The energetic particles were concentrated near the loop top. The evolution of the microwave source reflected the process of gradual accumulation of energetic electrons in the flaring loop. Around the individual emission pulses, the dynamics of the trapped and precipitating energetic electrons demonstrated the hard-soft-hard and soft-hard-soft patterns, respectively. The evolution of the trapped energetic electrons was mostly determined by the Coulomb collisions.
Publicly available datasets were analyzed in this study. This data can be found here: https://ftp.rao.istp.ac.ru/SRH/ (SRH), https://www.ngdc.noaa.gov/stp/space-weather/solar-data/solar-features/solar-radio/ (RSTN), https://solar.nro.nao.ac.jp/norp/html/daily/ (NoRP), http://47.104.87.104/SRData/ (CBS), http://jsoc.stanford.edu/ajax/lookdata.html (SDO), https://www.ngdc.noaa.gov/stp/satellite/goes-r.html (GOES), http://aso-s.pmo.ac.cn/sodc/dataArchive.jsp (ASO-S), https://www.ioffe.ru/LEA/kwsun/index.html (Konus-Wind).
AK: Investigation, Writing–original draft. ZW: Investigation, Writing–review and editing. SA: Data curation, Software, Writing–review and editing. YS: Data curation, Software, Writing–review and editing. YC: Conceptualization, Writing–review and editing.
The authors declare that financial support was received for the research, authorship, and/or publication of this article. This work was supported by the Ministry of Science and Technology of the People’s Republic of China (grant No. 110000206220220025). AK and SA acknowledge financial support from the Ministry of Science and Higher Education of the Russian Federation. ASO-S mission is supported by the Strategic Priority Research Program on Space Science, the Chinese Academy of Sciences, Grant No. XDA15320000.
We thank the teams of the Siberian Radioheliograph and Advanced Space-based Solar Observatory for maintaining these instruments and for the help with analyzing the observations.
The authors declare that the research was conducted in the absence of any commercial or financial relationships that could be construed as a potential conflict of interest.
All claims expressed in this article are solely those of the authors and do not necessarily represent those of their affiliated organizations, or those of the publisher, the editors and the reviewers. Any product that may be evaluated in this article, or claim that may be made by its manufacturer, is not guaranteed or endorsed by the publisher.
1https://www.ngdc.noaa.gov/stp/space-weather/solar-data/solar-features/solar-radio/rstn-1-second/
2https://www.ngdc.noaa.gov/stp/satellite/goes-r.html
Altyntsev, A., Lesovoi, S., Globa, M., Gubin, A., Kochanov, A., Grechnev, V., et al. (2020). Multiwave siberian Radioheliograph. Solar-Terrestrial Phys. 6, 30–40. doi:10.12737/stp-62202003
Aschwanden, M. J. (2002). Particle acceleration and kinematics in solar flares - a synthesis of recent observations and theoretical concepts (invited review). Space Sci. Rev. 101, 1–227. doi:10.1023/A:1019712124366
Aschwanden, M. J. (2005). “Physics of the solar corona,” in An introduction with problems and solutions. 2nd edition (Chichester, UK: Praxis Publishing Ltd).
Benz, A. O., and Güdel, M. (2010). Physical processes in magnetically driven flares on the sun, stars, and young stellar objects. Annu. Rev. Astron. Astrophys. 48, 241–287. doi:10.1146/annurev-astro-082708-101757
Brown, J. C. (1971). The deduction of energy spectra of non-thermal electrons in flares from the observed dynamic spectra of hard X-ray bursts. Sol. Phys. 18, 489–502. doi:10.1007/BF00149070
Dulk, G. A., and Marsh, K. A. (1982). Simplified expressions for the gyrosynchrotron radiation from mildly relativistic, nonthermal and thermal electrons. Astrophys. J. 259, 350–358. doi:10.1086/160171
Emslie, A. G., Dennis, B. R., Shih, A. Y., Chamberlin, P. C., Mewaldt, R. A., Moore, C. S., et al. (2012). Global energetics of thirty-eight large solar eruptive events. Astrophys. J. 759, 71. doi:10.1088/0004-637X/759/1/71
Fleishman, G. D., Anfinogentov, S. A., Stupishin, A. G., Kuznetsov, A. A., and Nita, G. M. (2021a). Coronal heating law constrained by microwave gyroresonant emission. Astrophys. J. 909, 89. doi:10.3847/1538-4357/abdab1
Fleishman, G. D., Kleint, L., Motorina, G. G., Nita, G. M., and Kontar, E. P. (2021b). Energy budget of plasma motions, heating, and electron acceleration in a three-loop solar flare. Astrophys. J. 913, 97. doi:10.3847/1538-4357/abf495
Fleishman, G. D., and Kuznetsov, A. A. (2010). Fast gyrosynchrotron codes. Astrophys. J. 721, 1127–1141. doi:10.1088/0004-637X/721/2/1127
Fleishman, G. D., Nita, G. M., and Gary, D. E. (2015). Energy partitions and evolution in a purely thermal solar flare. Astrophys. J. 802, 122. doi:10.1088/0004-637X/802/2/122
Fleishman, G. D., Nita, G. M., Kuroda, N., Jia, S., Tong, K., Wen, R. R., et al. (2018). Revealing the evolution of non-thermal electrons in solar flares using 3D modeling. Astrophys. J. 859, 17. doi:10.3847/1538-4357/aabae9
Fleishman, G. D., Nita, G. M., and Motorina, G. G. (2023). Data-constrained 3D modeling of a solar flare evolution: acceleration, transport, heating, and energy budget. Astrophys. J. 953, 174. doi:10.3847/1538-4357/ace1f4
Gan, W., Zhu, C., Deng, Y., Zhang, Z., Chen, B., Huang, Y., et al. (2023). The advanced space-based solar observatory (ASO-S). Sol. Phys. 298, 68. doi:10.1007/s11207-023-02166-x
Huang, G., and Nakajima, H. (2009). Statistics of flaring loops observed by Nobeyama Radioheliograph. II. Spectral evolution. Astrophys. J. 702, 19–26. doi:10.1088/0004-637X/702/1/19
Kuroda, N., Gary, D. E., Wang, H., Fleishman, G. D., Nita, G. M., and Jing, J. (2018). Three-dimensional forward-fit modeling of the hard X-ray and microwave emissions of the 2015 june 22 M6.5 flare. Astrophys. J. 852, 32. doi:10.3847/1538-4357/aa9d98
Kuznetsov, A. A., and Fleishman, G. D. (2021). Ultimate fast gyrosynchrotron codes. Astrophys. J. 922, 103. doi:10.3847/1538-4357/ac29c0
Kuznetsov, A. A., and Kontar, E. P. (2015). Spatially resolved energetic electron properties for the 21 may 2004 flare from Radio observations and 3D simulations. Sol. Phys. 290, 79–93. doi:10.1007/s11207-014-0530-x
Lemen, J. R., Title, A. M., Akin, D. J., Boerner, P. F., Chou, C., Drake, J. F., et al. (2012). The atmospheric imaging assembly (AIA) on the solar dynamics observatory (SDO). Sol. Phys. 275, 17–40. doi:10.1007/s11207-011-9776-8
Lysenko, A. L., Ulanov, M. V., Kuznetsov, A. A., Fleishman, G. D., Frederiks, D. D., Kashapova, L. K., et al. (2022). KW-sun: the konus-wind solar flare database in hard X-ray and soft gamma-ray ranges. Astrophys. J. Suppl. Ser. 262, 32. doi:10.3847/1538-4365/ac8b87
Ning, Z. (2008). Microwave and hard X-ray spectral evolution for the 13 december 2006 solar flare. Sol. Phys. 247, 53–62. doi:10.1007/s11207-007-9101-8
Nita, G. M., Fleishman, G. D., Kuznetsov, A. A., Anfinogentov, S. A., Stupishin, A. G., Kontar, E. P., et al. (2023). Data-constrained solar modeling with GX simulator. Astrophys. J. Suppl. Ser. 267, 6. doi:10.3847/1538-4365/acd343
Nita, G. M., Fleishman, G. D., Kuznetsov, A. A., Kontar, E. P., and Gary, D. E. (2015). Three-dimensional Radio and X-ray modeling and data analysis software: revealing flare complexity. Astrophys. J. 799, 236. doi:10.1088/0004-637X/799/2/236
Nita, G. M., Viall, N. M., Klimchuk, J. A., Loukitcheva, M. A., Gary, D. E., Kuznetsov, A. A., et al. (2018). Dressing the coronal magnetic extrapolations of active regions with a parameterized thermal structure. Astrophys. J. 853, 66. doi:10.3847/1538-4357/aaa4bf
Scherrer, P. H., Schou, J., Bush, R. I., Kosovichev, A. G., Bogart, R. S., Hoeksema, J. T., et al. (2012). The helioseismic and magnetic imager (HMI) investigation for the solar dynamics observatory (SDO). Sol. Phys. 275, 207–227. doi:10.1007/s11207-011-9834-2
Shang, Z., Wu, Z., Liu, Y., Bai, Y., Lu, G., Zhang, Y., et al. (2023). The calibration of the 35-40 GHz solar Radio spectrometer with the new moon and a noise source. Astrophys. J. Suppl. Ser. 268, 45. doi:10.3847/1538-4365/acee00
Shang, Z., Xu, K., Liu, Y., Wu, Z., Lu, G., Zhang, Y., et al. (2022). A Broadband solar Radio dynamic spectrometer working in the millimeter-wave band. Astrophys. J. Suppl. Ser. 258, 25. doi:10.3847/1538-4365/ac4257
Shimojo, M., and Iwai, K. (2023). Over seven decades of solar microwave data obtained with Toyokawa and Nobeyama Radio Polarimeters. Geosci. Data J. 10, 114–129. doi:10.1002/gdj3.165
Su, Y., Liu, W., Li, Y.-P., Zhang, Z., Hurford, G. J., Chen, W., et al. (2019). Simulations and software development for the Hard X-ray Imager onboard ASO-S. Res. Astron. Astrophys. 19, 163. doi:10.1088/1674-4527/19/11/163
White, S. M., Benz, A. O., Christe, S., Fárník, F., Kundu, M. R., Mann, G., et al. (2011). The relationship between solar Radio and hard X-ray emission. Space Sci. Rev. 159, 225–261. doi:10.1007/s11214-010-9708-1
Wu, Z., Kuznetsov, A., Anfinogentov, S., Melnikov, V., Sych, R., Wang, B., et al. (2024). A multipeak solar flare with a high turnover frequency of the gyrosynchrotron spectra from the loop-top source. Astrophys. J. 968, 5. doi:10.3847/1538-4357/ad46ff
Yan, F., Wu, Z., Shang, Z., Wang, B., Zhang, L., and Chen, Y. (2023). The first flare observation with a new solar microwave spectrometer working in 35-40 GHz. Astrophys. J. Lett. 942, L11. doi:10.3847/2041-8213/acad02
Zharkova, V. V., Arzner, K., Benz, A. O., Browning, P., Dauphin, C., Emslie, A. G., et al. (2011). Recent advances in understanding particle acceleration processes in solar flares. Space Sci. Rev. 159, 357–420. doi:10.1007/s11214-011-9803-y
Keywords: solar flares, solar microwave emission, solar X-ray emission, particle acceleration, remote astrophysical diagnostics
Citation: Kuznetsov A, Wu Z, Anfinogentov S, Su Y and Chen Y (2024) Electron acceleration and transport in the 2023-03-06 solar flare. Front. Astron. Space Sci. 11:1407955. doi: 10.3389/fspas.2024.1407955
Received: 27 March 2024; Accepted: 28 May 2024;
Published: 17 June 2024.
Edited by:
Gang Li, University of Alabama in Huntsville, United StatesReviewed by:
Xiaocheng Guo, National Space Science Center, Chinese Academy of Sciences (CAS), ChinaCopyright © 2024 Kuznetsov, Wu, Anfinogentov, Su and Chen. This is an open-access article distributed under the terms of the Creative Commons Attribution License (CC BY). The use, distribution or reproduction in other forums is permitted, provided the original author(s) and the copyright owner(s) are credited and that the original publication in this journal is cited, in accordance with accepted academic practice. No use, distribution or reproduction is permitted which does not comply with these terms.
*Correspondence: Alexey Kuznetsov, YV9rdXpuQGlzemYuaXJrLnJ1
Disclaimer: All claims expressed in this article are solely those of the authors and do not necessarily represent those of their affiliated organizations, or those of the publisher, the editors and the reviewers. Any product that may be evaluated in this article or claim that may be made by its manufacturer is not guaranteed or endorsed by the publisher.
Research integrity at Frontiers
Learn more about the work of our research integrity team to safeguard the quality of each article we publish.