 Justin D. Finke
- U.S. Naval Research Laboratory, Washington, DC, United States
In this study, a model for light travel time effects for emission from a plasma blob in a blazar jet is presented. This calculation could be incorporated into more complex models with particle acceleration and radiation mechanisms, but as presented here, it is agnostic to these mechanisms. This model includes light travel time effects for an expanding or contracting blob. As examples, this model is applied to a flare observed by VERITAS and MAGIC from Mrk 421 in 2013 and a flare observed by the Fermi Large Area Telescope from 3C 454.3 in 2010.
1 Introduction
Blazars are active galactic nuclei (AGN) with relativistic jets moving close to our line of sight. They are routinely detected at all wavelengths, from radio to γ-rays, and often extremely variable at all wavelengths as well. Consequently, a complete understanding of blazars requires a deep understanding of the time domain. The Fermi Large Area Telescope (LAT) is extremely useful for this since it monitors the entire sky in
Blazar variability is often analyzed in terms of flares, explained by particle acceleration and radiative cooling in a homogeneous one-zone nonthermal plasma “blob.” Extensive time-dependent modeling analysis has been performed on flares (e.g., Boettcher et al., 1997; Kirk et al., 1998; Chiaberge and Ghisellini, 1999; Dermer and Schlickeiser, 2002; Joshi and Böttcher, 2011; Dotson et al., 2015; Zacharias, 2023). Particle acceleration could be from a diffusive shock or magnetic reconnection. Leptonic radiation processes include synchrotron, typically at low energies, and Compton scattering of a number of radiation fields at high energies. Hadronic processes may also be included (e.g., Petropoulou and Mastichiadis, 2012; Diltz et al., 2015). Light travel time effects are sometimes, though not always, ignored, implicitly assuming that the acceleration and/or radiative timescales are much larger than the light-crossing timescale.
Observationally, flares are often characterized in terms of an exponential rise and decay (e.g., Nalewajko, 2013; Meyer et al., 2019; Roy et al., 2019; Bhatta et al., 2023). Flares are often analyzed in terms of symmetry, among other properties, with symmetric flares having the same rising and decaying timescales. Symmetric flares are often taken as an indication that flare variability is dominated by light travel time rather than particle acceleration or cooling. Most blazar flares, but not all, are consistent with being symmetric within the uncertainties.
Here, a simple model that takes into account light travel time effects for emission from a plasma blob in a blazar jet is explored. The simple model is agnostic as to the particle acceleration and radiation mechanisms, assuming only that the acceleration and radiative timescales are much less than the light-crossing timescale. In Section 2, a simple model from a non-expanding blob is explored, which will result in a symmetric light curve. This should be a good approximation for the majority of blazar flares that show no evidence of asymmetry. Next, in Section 3, a model for a blob that can have a size that changes with time is explored. This could reproduce asymmetric flares, while still being agnostic as to the exact acceleration and radiation mechanisms. Finally, the discussion is provided in Section 4.
2 Flare from a constant size blob
2.1 Formalism
Consider a homogeneous blob. If the emission of the entire blob is changing simultaneously, the observer will see the portion of the blob closer to the observer before the portion of the blob that is farther away. This effect was explored by Chiaberge and Ghisellini (1999) and Joshi and Böttcher (2011) and described by Zacharias and Schlickeiser (2013) for a spherical blob with constant size (see also Finke and Becker, 2014; Finke and Becker, 2015). A blob in a blazar jet will be moving at a high relativistic speed, but all quantities of the blob in the observer’s frame are used, so no relativistic transformations are necessary.
The emitting blob is considered to be centered on x = R with a two-dimensional cross-sectional surface described by (R − x)g + yg = Rg, where (x, y) are the standard Cartesian coordinates. The observer is in the −x direction. See Figure 1 for an illustration of the geometry. The three-dimensional surface is created by rotating this surface around the x-axis. The blob will then have a volume given by
Here, g = 2 corresponds to the case of a sphere. For a constant-size blob with this geometry and an intrinsic time-series light curve F(t) starting at t = 0, the observed flux as a function of the observer’s time tobs is
For the spherical case g = 2, Eq. 2 gives the result from Zacharias and Schlickeiser (2013) and Finke and Becker (2015)
For the shortest possible flare,
where F0 is the fluence of the flare and δ(x) is the usual Dirac delta function. From Eq. 2, we obtain
Here, the step function Eq. 6 is used.
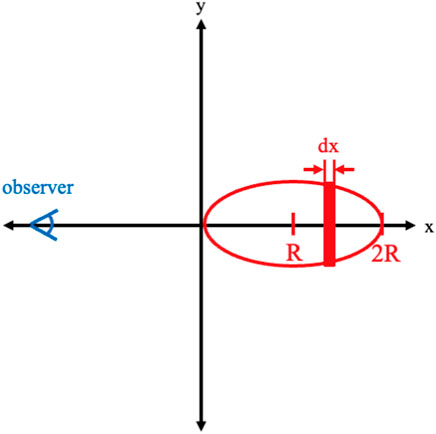
Figure 1. An illustration of the geometry of the emitting blob (red) in the jet with the observer labeled.
The solution using Eq. 5 has four free parameters: F0, R, g, and t0. This model creates a symmetric flare, with the rising and falling timescales being equal. If light travel time is indeed the only source of variability in a flare, the shape of the light curve should be the same at all energies (wavelengths and frequencies), although the normalization would be different. So if one has a light curve flux at energy E1, F (E1, t), the flux at E2 would be F (E2, t) = r1F (E1, t), where r1 is another free parameter that is constant with time; F (E3, t) = r2F (E1, t), where r2 is another free parameter; and so on. Each additional light curve adds another free parameter.
Figure 2 shows this model’s light curve plotted for different values of the parameter g. This parameter can control the general shape of the flare. For lower values of g, it becomes more peaked.
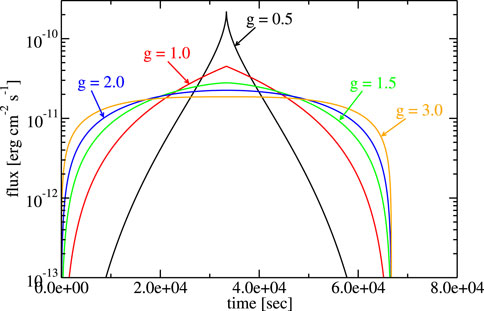
Figure 2. Example of the non-changing blob size model. The parameters are F0 = 10–6 erg cm−2, R = 1015 cm, t0 = 0, and various values of g, as shown in the figure.
This model can be a more physically motivated way of computing the size scale from a flare, although it should be clear that the size scale found here (R) is in the observer frame, not the frame co-moving with the jet, as is often desired.
As described in Section 1, a large number of blazar flares do indeed appear to be symmetric, so this simple model should be able to provide a good fit to a large number of blazar flare light curves. This model is next applied to two bright, well-observed γ-ray flares taken from the literature.
2.2 April 2013 flare from Mrk 421
A highly detailed multiwavelength campaign on the high synchrotron-peaked BL Lac object Mrk 421 took place in April 2013, as reported by Acciari et al. (2020). During this time, the source was very bright, and several extremely bright flares were observed. Here, the simple light travel time model for a non-expanding blob is applied to the flare on 15 April 2013 (MJD 56397), as observed in the γ-rays by MAGIC and VERITAS. This bright flare was also captured in a similar detail in the X-rays by NuSTAR, but that is not explored here.
A Markov chain Monte Carlo analysis was performed (Foreman-Mackey et al., 2013) with the model described above in Section 2.1 on the 0.2–0.4 TeV, 0.4–0.8 TeV, and
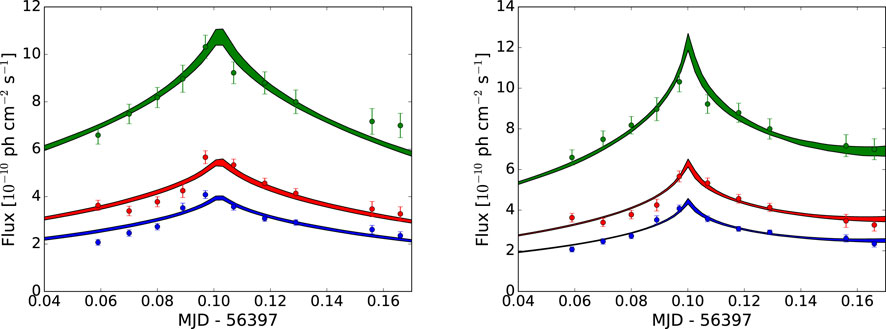
Figure 3. MAGIC and VERITAS light curves for Mrk 421 in April 2013. The green symbols indicate the 0.2–0.4 TeV band; the red symbols indicate the 0.4–0.8 TeV band; and the blue symbols indicate the
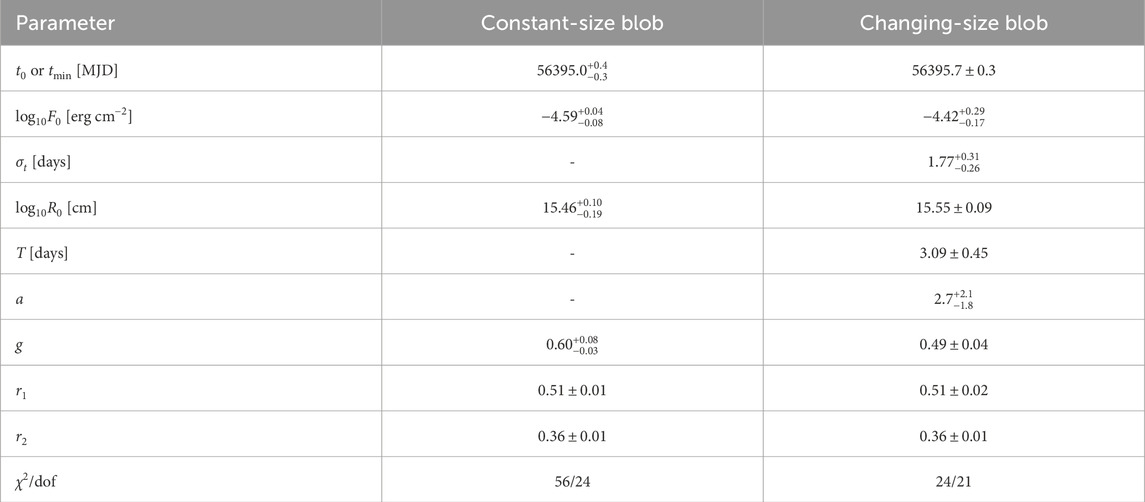
Table 1. Model parameters for fits to the April 2013 flare from Mrk 421.
The fit deviates substantially from a spherical blob, with the fit resulting in g ≈ 0.60, versus g = 2 for a spherical blob. There is no real reason to think that the shape of the blob is spherical; this is often used just for simplicity. The resulting radius of the blob, R ≈ 3 × 1015 cm, is consistent with that observed in previous blazar modeling.
2.3 November 2010 flare from 3C 454.3
In November 2010, 3C 454.3 exhibited a bright γ-ray outburst detected by the Fermi-LAT, which was the brightest γ-ray flare from a blazar up to that point (Abdo et al., 2011). The non-expanding blob model is also applied to the 0.1–1.0 and
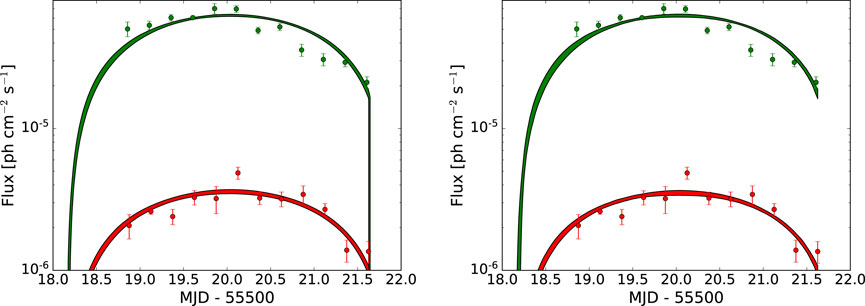
Figure 4. Fermi-LAT light curves for 3C 454.3 in November 2010 and model results. The green symbols indicate the 0.1–1.0 GeV band; the red symbols indicate the
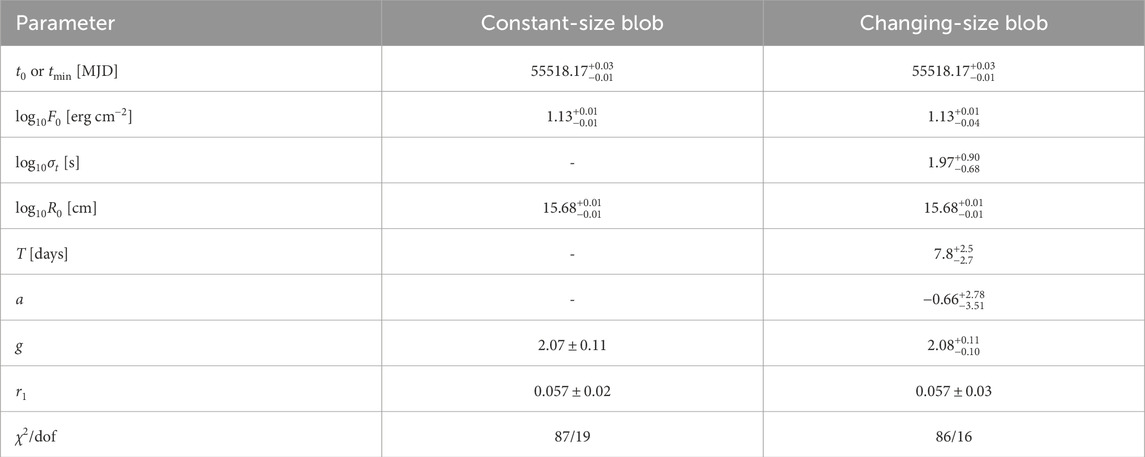
Table 2. Model parameters for fits to the November 2010 flare from 3C 454.3.
3 Flare from a blob that is changing size
3.1 Formalism
Here, I generalize the light travel time effect for an expanding or contracting axisymmetric blob, which, to the best of my knowledge, has not been explored before. In this case, R → R(t). The solution for a constant-size blob δ function, Eq. 5 above, can be used as a Green’s function for the case of the expanding blob (letting F0 → 1):
The solution for the expanding/contracting blob will then be
where again F (t0) is the intrinsic light curve of the blob. Substituting the Green’s function, Eq. 7, in Eq. 8, one gets
where tmin is defined by tobs < tmin + 2R (tmin)/c, based on the step function in Eq. 7, which can be determined once R(t) is specified. Eq. 9 can be rewritten with the substitution t = tobs − t0, leading to
Here tmax is defined by tmax < R (tmax)/c and must be determined once R(t) is specified. For a blob that is neither expanding nor contracting, i.e., R(t) is constant, Eq. 10 is reduced to Eq. 2.
The blob length scale is considered to expand as
where R0, T, and a are free parameters. For this parameterization for R (t0), in Eq. 9, tmin = tobs − 2R0/c. In Eq. 10, tmax does not have a closed-form solution and so must be solved for numerically.
For a δ-function intrinsic flux, as used in the constant size case, the expanding blob would simplify to the constant size case. This is because only the flux at one infinitesimally small instant will be seen by the observer, so any change in the blob’s size will not make a difference. So, the intrinsic light curve is considered to be a Gaussian,
This model then has free parameters F0, R0, g, tmin, σt, a, and T, along with any ratios for light curves at other wavelengths (r2 and r3). For σt → 0, it is well-known that a Gaussian reduces to a Dirac δ function, so Eq. 12 reduces to Eq. 4. This means that the constant-size model is nested with the changing-size model, with the changing-size model having three additional free parameters.
Examples of light curves with this model are shown in Figure 5 for different values of the parameter a. Changes in a can account for flare asymmetry, allowing this model to explain a wide variety of flares with an emitting blob that changes in size.
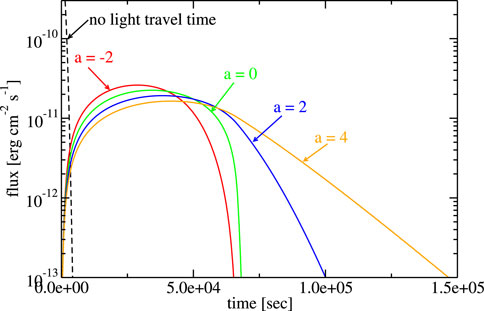
Figure 5. Example of the changing blob size model. The parameters are F0 = 10–6 erg cm−2, σt =103 s, R0 =1015 cm, T =104 s, g =2, tmin = 0, and various values of a, as shown in the figure.
One prediction of this model is that the light curves for a source at different wavelengths, produced by the same emitting region, should have the same overall shape. This means that if one observes simultaneous light curves at different wavelengths and their overall spaces are not consistent with one another, this model alone is not sufficient. The light curves may differ due to different radiative properties or mechanisms at different wavelengths or contamination by other emitting regions.
3.2 April 2013 flare from Mrk 421
The changing-size model described above is applied to the April 2013 flare from Mrk 421. The result can be seen on the right side of Figure 3 and Table 1. The model does appear to provide a better fit. Since a > 0, this indicates the blob is expanding rather than contracting. A likelihood ratio test indicates that the constant-size blob model is rejected in favor of the changing blob model at 4.8σ significance. Since the light curves at different energies are so similar, this is a reasonably strong indication that the variability is dominated by the light travel time for this flare.
3.3 November 2010 flare from 3C 454.3
The changing-size model is also applied to the November 2010 flare from 3C 454.3. The model can be seen over-plotted with the data in Figure 4, and the resulting parameters can be seen in Table 2. The model does not appear to provide a significantly better fit and indeed looks very similar to case of the non-expanding blob. This is confirmed with the likelihood ratio test, which indicates that the changing blob model is preferred at 10−7σ over the non-expanding model, which any reasonable researcher would interpret as the more complicated model is not significantly preferred over the simpler one. The reason for this is that, unlike the flare in Mrk 421 explored above, the light curve shapes for the different Fermi-LAT energy bins are quite different (indeed, as noted by Abdo et al., 2011). This is an indication that flare shape is not dominated by light travel time effects and that a more complicated model is needed to explain it.
4 Discussion
A simple model has been described for light travel time effects in blazar flares, where the emitting region could be changing in size (either expanding or contracting). The change in size of the region can lead to an asymmetry in the light curve, i.e., different rising and decay timescales. The constant-size model uses an instantaneous turning on and off of emission, i.e., a Dirac δ function for intrinsic emission. The expanding blob model assumes a narrow Gaussian for the intrinsic emission. Although unrealistic, these models should be good approximations for flares where the particle acceleration and energy loss timescales are much less than the light travel timescale for the “blob.” For many flares, including asymmetric flares, light travel time effects alone should be able to account for the flare. Observing at multiple wavelengths is a good way to confirm or rule out this model. If the flares have the same shape at different wavelengths, which can be explained by this model, this is a good indication that the variability is dominated by light travel time. However, if the light curve shapes during the flare are different at different wavelengths, this could be an indication that other processes are important. For instance, it could be an indication that the particle acceleration and energy loss timescales are not much smaller than the light travel timescale and hence cannot be neglected, although here one must be careful. For instance, in comparing optical emission and γ-ray emission in FSRQs, one must be careful to take into account the emission from the “blue bump,” i.e., from the accretion disk.
This story is complicated by recent observations by the Imaging X-ray Polarimetry Explorer (IXPE). Simultaneous observations of Mrk 421 (Di Gesu et al., 2023) and PG 1553+113 (Middei et al., 2023) reveal optical polarizations that are significantly different than X-ray polarizations measured by the IXPE. Mrk 421 and PG 1553+113 are both high synchrotron-peaked blazars, so both their optical and X-ray emissions are thought to be from synchrotron emission. One possible explanation is that the electrons producing the optical synchrotron can travel a larger distance from the acceleration site than the electrons producing the X-ray synchrotron since the lower-energy optical-emitting electrons will have a longer energy loss timescale than the higher-energy X-ray emitting electrons (Zhang et al., 2024). In this case, one would indeed expect the optical emission region to be larger than the X-ray emission region, and thus the optical would have a larger variability timescale, and likely a time delay, relative to the X-ray emission. In any case, light travel time effects, such as those described here, would need to be taken into account in accurate time-dependent modeling calculations.
As two examples, this model was applied to the April 2013 flare from the BL Lac Mrk 421, as observed by MAGIC and VERITAS, and to the November 2010 flare from the FSRQ 3C 454.3, as observed by the Fermi-LAT. In the case of the Mrk 421, the expanding blob model provides a good fit to the data and is preferred over the constant-size model with a significance of 4.8σ. This flare was extremely bright, and the data were quite good. A more complicated model would probably not provide a better description of the data. For the flare from 3C 454.3, neither model provides a particularly good reproduction of the data and the changing size model is not significantly preferred over the constant-size model.
The models here could be usefully applied to studies of light curves that make up multiple flares (Meyer et al., 2019; Roy et al., 2019; Bhatta et al., 2023). Since most flares are symmetric, the constant-size blob model should be sufficient to explain most flares. The parameter g can have a substantial impact on the shape of the flare, and varying it could probably describe most flares (Figure 2). The fits can be used to at least put an upper limit on the size scale of the flare (the parameter R). Care should be taken since this size scale is in the observer’s frame. In the frame co-moving with the blob, the size scale could be larger by a factor of the Doppler factor. Furthermore, the data from most flares are not as good as the data for the flares explored here. So a lack of improvement in the fit for most flares could be due to the large uncertainty in the data and may not be due to the flare being dominated by light travel time effects.
Although these models do not contain any information about particle acceleration or radiation mechanisms, light travel time, as discussed here, can be incorporated into such models. To some extent, light travel time effects have been incorporated into more complicated models already (Chiaberge and Ghisellini (1999); Joshi and Böttcher, 2011; Zacharias and Schlickeiser (2013). The formalism described here will be incorporated into more complicated models in future work.
Particle-in-cell simulations indicate that magnetic reconnection in blazar jets could create “plasmoids,” i.e., magnetized, nonthermal plasma of various sizes with accelerated, radiating particles (e.g., Petropoulou et al., 2018). Christie et al. (2019) performed time-dependent modeling of emission from plasmoids created by magnetic reconnection in a blazar jet. They included light travel time effects between different plasmoids but did not include the light travel-time effects within the plasmoid. The light travel-time effect described here could be integrated into their model to take into account intra-plasmoid light travel time, including for a plasmoid that is changing in size. If the plasmoids are not changing in size rapidly during a flare, the flares could be more symmetric than previously assumed, affecting γ-ray observations and the inferred flare timescales (Meyer et al., 2021).
Data availability statement
The raw data supporting the conclusion of this article will be made available by the authors, without undue reservation.
Author contributions
JF: writing–original draft and writing–review and editing.
Funding
The author(s) declare that financial support was received for the research, authorship, and/or publication of this article. This study was supported by NASA through the Fermi GI program and contract S-15633Y and the Office of Naval Research. This work made use of a grant of computing time from the DoD’s High Performance Computing Modernization Program.
Acknowledgments
The author would like to thank the referees for helpful comments and R. Sambruna and F. M. Civano for the invitation to contribute to this collection.
Conflict of interest
The author declares that the research was conducted in the absence of any commercial or financial relationships that could be construed as a potential conflict of interest.
Publisher’s note
All claims expressed in this article are solely those of the authors and do not necessarily represent those of their affiliated organizations, or those of the publisher, the editors, and the reviewers. Any product that may be evaluated in this article, or claim that may be made by its manufacturer, is not guaranteed or endorsed by the publisher.
References
Abdo, A. A., Ackermann, M., Ajello, M., Allafort, A., Baldini, L., Ballet, J., et al. (2011). Fermi gamma-ray space telescope observations of the gamma-ray outburst from 3C454.3 in november 2010. ApJL 733, L26. doi:10.1088/2041-8205/733/2/L26
Acciari, V. A., Ansoldi, S., Antonelli, L. A., Arbet Engels, A., Baack, D., Babić, A., et al. (2020). Unraveling the complex behavior of Mrk 421 with simultaneous X-ray and VHE observations during an extreme flaring activity in 2013 April. ApJS 248, 29. doi:10.3847/1538-4365/ab89b5
Bhatta, G., Zola, S., Drozdz, M., Reichart, D., Haislip, J., Kouprianov, V., et al. (2023). Catching profound optical flares in blazars. MNRAS 520, 2633–2643. doi:10.1093/mnras/stad280
Boettcher, M., Mause, H., and Schlickeiser, R. (1997). γ-ray emission and spectral evolution of pair plasmas in AGN jets. I. General theory and a prediction for the GeV - TeV emission from ultrarelativistic jets. A&A 324, 395–409. doi:10.48550/arXiv.astro-ph/9604003
Chiaberge, M., and Ghisellini, G. (1999). Rapid variability in the synchrotron self-compton model for blazars. MNRAS 306, 551–560. doi:10.1046/j.1365-8711.1999.02538.x
Christie, I. M., Petropoulou, M., Sironi, L., and Giannios, D. (2019). Radiative signatures of plasmoid-dominated reconnection in blazar jets. MNRAS 482, 65–82. doi:10.1093/mnras/sty2636
Dermer, C. D., and Schlickeiser, R. (2002). Transformation properties of external radiation fields, energy-loss rates and scattered spectra, and a model for blazar variability. ApJ 575, 667–686. doi:10.1086/341431
Di Gesu, L., Marshall, H. L., Ehlert, S. R., Kim, D. E., Donnarumma, I., Tavecchio, F., et al. (2023). Discovery of X-ray polarization angle rotation in the jet from blazar Mrk 421. Nat. Astron. 7, 1245–1258. doi:10.1038/s41550-023-02032-7
Diltz, C., Böttcher, M., and Fossati, G. (2015). Time dependent hadronic modeling of flat spectrum radio quasars. ApJ 802, 133. doi:10.1088/0004-637X/802/2/133
Dotson, A., Georganopoulos, M., Meyer, E. T., and McCann, K. (2015). On the location of the 2009 GeV flares of blazar PKS 1510-089. ApJ 809, 164. doi:10.1088/0004-637X/809/2/164
Finke, J. D., and Becker, P. A. (2014). Fourier analysis of blazar variability. ApJ 791, 21. doi:10.1088/0004-637X/791/1/21
Finke, J. D., and Becker, P. A. (2015). Fourier analysis of blazar variability: Klein-Nishina effects and the jet scattering environment. ApJ 809, 85. doi:10.1088/0004-637X/809/1/85
Foreman-Mackey, D., Hogg, D. W., Lang, D., and Goodman, J. (2013). emcee: the MCMC Hammer. PASP 125, 306–312. doi:10.1086/670067
Joshi, M., and Böttcher, M. (2011). Time-dependent radiation transfer in the internal shock model scenario for blazar jets. ApJ 727, 21. doi:10.1088/0004-637X/727/1/21
Kirk, J. G., Rieger, F. M., and Mastichiadis, A. (1998). Particle acceleration and synchrotron emission in blazar jets. A&A 333, 452–458. doi:10.48550/arXiv.astro-ph/9801265
Meyer, M., Petropoulou, M., and Christie, I. M. (2021). The observability of plasmoid-powered γ-ray flares with the Fermi large Area telescope. ApJ 912, 40. doi:10.3847/1538-4357/abedab
Meyer, M., Scargle, J. D., and Blandford, R. D. (2019). Characterizing the gamma-ray variability of the brightest flat spectrum radio quasars observed with the Fermi LAT. ApJ 877, 39. doi:10.3847/1538-4357/ab1651
Middei, R., Perri, M., Puccetti, S., Liodakis, I., Di Gesu, L., Marscher, A. P., et al. (2023). IXPE and multiwavelength observations of blazar PG 1553+113 reveal an orphan optical polarization swing. ApJL 953, L28. doi:10.3847/2041-8213/acec3e
Nalewajko, K. (2013). The brightest gamma–ray flares of blazars. MNRAS 430, 1324–1333. doi:10.1093/mnras/sts711
Petropoulou, M., Christie, I. M., Sironi, L., and Giannios, D. (2018). Plasmoid statistics in relativistic magnetic reconnection. MNRAS 475, 3797–3812. doi:10.1093/mnras/sty033
Petropoulou, M., and Mastichiadis, A. (2012). Temporal signatures of leptohadronic feedback mechanisms in compact sources. MNRAS 421, 2325–2341. doi:10.1111/j.1365-2966.2012.20460.x
Roy, N., Chatterjee, R., Joshi, M., and Ghosh, A. (2019). Probing the jets of blazars using the temporal symmetry of their multiwavelength outbursts. MNRAS 482, 743–757. doi:10.1093/mnras/sty2748
Zacharias, M., and Schlickeiser, R. (2013). Synchrotron lightcurves of blazars in a time-dependent synchrotron-self compton cooling scenario. ApJ 777, 109. doi:10.1088/0004-637X/777/2/109
Zacharias, M. (2023). Exploring the evolution of the particle distribution and the cascade in a moving, expanding emission region in blazar jets. A&A 669, A151. doi:10.1051/0004-6361/202244683
Keywords: BL Lacertae object: general, BL Lacertae objects: individual (Mrk 421), quasars: general, quasars: individual (3C 454.3), gamma-rays: general, gamma-rays: galaxies, time-domain astronomy
Citation: Finke JD (2024) Light travel time effects in blazar flares. Front. Astron. Space Sci. 11:1384234. doi: 10.3389/fspas.2024.1384234
Received: 08 February 2024; Accepted: 13 May 2024;
Published: 20 June 2024.
Edited by:
Rita Sambruna, National Aeronautics and Space Administration, United StatesReviewed by:
Fabrizio Tavecchio, National Institute of Astrophysics (INAF), ItalyMarco Landoni, National Institute of Astrophysics (INAF), Italy
Copyright © 2024 Finke. This is an open-access article distributed under the terms of the Creative Commons Attribution License (CC BY). The use, distribution or reproduction in other forums is permitted, provided the original author(s) and the copyright owner(s) are credited and that the original publication in this journal is cited, in accordance with accepted academic practice. No use, distribution or reproduction is permitted which does not comply with these terms.
*Correspondence: Justin D. Finke, anVzdGluLmQuZmlua2UuY2l2QHVzLm5hdnkubWls