 John C. Foster
 Philip J. Erickson
 Yoshiharu Omura
94% of researchers rate our articles as excellent or good
Learn more about the work of our research integrity team to safeguard the quality of each article we publish.
Find out more
ORIGINAL RESEARCH article
Front. Astron. Space Sci., 21 February 2024
Sec. Space Physics
Volume 11 - 2024 | https://doi.org/10.3389/fspas.2024.1374331
This article is part of the Research TopicThe Loss and Acceleration Mechanisms of Energetic Electrons in the Earth’s Outer Radiation BeltView all 10 articles
An understanding of the development of strong very low frequency chorus elements is important in the study of the rapid MeV electron acceleration observed during radiation belt recovery events. During such events, chorus elements with long-duration (20–40 ms), strong (|Bw| 0.5–2.0 nT) subpackets with smoothly varying frequency and phase capable of producing nonlinear energy gain of 1%–2% for multi-MeV seed electrons. For such strong chorus elements, we examine the consequences of an upstream motion of the chorus wave generation region using Van Allen Probes observations and nonlinear theory. For a given upstream velocity, vs, resonant electron energy (50–350 keV) and pitch angle (105–115 deg) are uniquely determined for each wave frequency. We examine the effect of an upstream vs on the inhomogeneity factor that controls wave growth. For steadily increasing upstream motion as the chorus element evolves, vs/c ranging over [-0.001, −0.065], nonlinear wave growth takes place at ≥ 50% of the theoretical maximal value during the development of the observed strong subpackets. For the cases examined, resonant electron energies and pitch angles closely match those of the observed injected electron flux enhancements responsible for chorus development and the nonlinear acceleration of MeV radiation belt electrons.
During solar storms, drastic changes in the geomagnetic field configuration can result in an almost total depletion of the MeV outer belt electrons. Subsequently, a rapid recovery of the ∼1–3 MeV outer zone electrons can take place in a matter of a few hours (e.g., Baker et al., 2014). Such rapid radiation belt recovery involves local acceleration of 100 s keV seed electros to multi-MeV energies in the low-density region outside the plasmapause (Reeves et al., 2013) through wave-particle interactions with whistler mode very low frequency (VLF) chorus waves (Thorne et al., 2013; Foster et al., 2014). The mathematical simulations of Li et al. (2016) accentuated the critical role chorus waves play in accelerating electrons up to several MeV during radiation belt recovery. Using detailed examination of Van Allen Probes observations of VLF chorus and electron fluxes, Foster et al. (2017) and Omura et al. (2019) demonstrated the efficiency of nonlinear processes in the acceleration of electrons to MeV energies. Combining cycle by cycle analysis of the observed chorus waveform with the nonlinear theory of Hsieh and Omura (2018), those studies found that seed electrons with initial energies of 100 s keV to 3 MeV can be accelerated by 50 keV–200 keV in resonant interactions with a single strong chorus rising tone wave element on a time scale of 10–100 ms Foster et al. (2021).
In addition to processes related to MeV electron acceleration, VLF chorus plays a significant role in outer radiation belt electron precipitation. Wave-particle interactions during chorus wave generation involve lower energy (10s–100 s keV) electrons injected earthward from the outer magnetosphere (e.g., Foster, Rosenberg & Lanzerotti (1976); Gao et al. (2022)). Brice (1964) showed that resonant electrons would experience a pitch angle decrease in wave amplifying interactions, thus predicting that particle precipitation should be associated with VLF emission generation. Foster and Rosenberg (1976) reported precipitation of electrons with energies of 100 s keV simultaneous with discrete bursts of VLF chorus rising-tone emissions. Microburst electron precipitation accompanies the generation of chorus rising tone emissions (Rosenberg et al., 1977; Tsurutani et al., 2013; Breneman, et al., 2017). Additionally, Gao et al. (2023) concluded that chorus waves are the dominant driver for diffuse auroral precipitation.
It is apparent that a more-detailed understanding of the processes associated with VLF chorus generation is important in the study of radiation belt electron acceleration and loss. Recently, Omura (2021) provided an extensive review of the nonlinear theory of chorus generation and the simulation studies of Nogi and Omura (2022) found that for rising-tone emissions the wave generation region propagates upstream away from the equator. In this study we combine Van Allen Probes observations with nonlinear theory to examine the consequences of such an upstream motion of the chorus wave generation region.
A typical chorus emission consists of a coherent wave with rising frequency. Each chorus element is composed of a sequence of discrete subpackets, each spanning a few to several 10s of wave cycles. In general, each subpacket is characterized by smoothly increasing and decreasing wave amplitude, good phase coherence, and smoothly varying wave frequency (e.g., Santolik et al., 2014). Foster et al. (2021) described chorus elements with long-duration (20–40 ms), strong (|Bw| 0.5–2.0 nT) subpackets with smoothly varying frequency and phase capable of producing nonlinear energy gain of 1%–2% for multi-MeV seed electrons. They reported that an extended interval of weakly growing wave amplitude can be identified in strongly disturbed conditions for
For chorus generation, cyclotron resonance between the wave and electron leads to a required condition on the electron resonance velocity, VR.
Here γ is the relativity factor for the resonant electron energy, Ωce and ω are the cyclotron and chorus wave angular frequencies, and Vp is the wave phase velocity.
Simulation studies have addressed the generation of rising-tone chorus emissions. Tao et al. (2021) presented a model in which phase space structures of correlated electrons are formed by nonlinear wave particle interactions downstream of the equator. As these electrons are released from the wave packet, they proceed upstream where they lead to the amplification of new emissions at their higher resonant frequency, resulting in frequency chirping. (In these contexts, downstream and upstream is defined as motion parallel or antiparallel to the field-aligned direction of the chorus element wavevector, k.) Nogi and Omura (2022) demonstrated that triggered rising tone whistler-mode waves are generated by means of a backward-moving source. They find that for rising-tone emissions, the wave generation region propagates upstream with source velocity vs given by the (negative) electron resonant velocity, VR, modified by the (positive) wave group velocity, Vg.
The initial chorus emission is initialized near the equator and a backward resonant current then propagates upstream. Because of the upstream motion of the source region, a long rising-tone subpacket is generated self-sustainingly through formation of an electron hole in velocity phase space.
Harid et al. (2022) applied the results of these studies to naturally produced rising-tone chorus elements. Their simulations found that the trajectory of the backward (upstream) current follows that of a freely falling electron that has been de-trapped at the equator, moving with resonant velocity, VR, superimposed with forward (downstream) motion at the wave group velocity. The backward current iteratively radiates a rising tone element where the highest frequency components are generated furthest upstream. The process continues in succession upstream and produces the entire chorus element. This element then propagates downstream and is sustained and distorted by nonlinear amplification, leading to a subpacket structure.
Nogi and Omura (2022) found that the source velocity, vs, represents the motion of the resonant current, while the velocity of the wave generation affects processes of subpacket formation. When vs is approximately the same as the velocity of wave packet generation VW, resonant current is formed continuously, leading to a long-duration rising-tone emission. They find that vs should be a small negative value and that a gradual upstream shift of the source region is necessary for the wave to grow locally. Nogi and Omura (2023) discuss the velocity of the wave generation region VW as identified in their particle in cell (PIC) simulations for the case of multiple subpackets. The results of Nogi and Omura (2023) apply directly to the long-duration rising-tone subpackets discussed by Foster et al. (2021), for which we expect VW
Relativistic formulae described by Foster et al. (2017) and Hsieh and Omura, 2018 provide values of VR, resonant electron energy and pitch angle (PA), and Vg for chorus wave elements and ambient conditions directly observed by the Van Allen Probes during rapid radiation belt recovery events. We analyze local in situ wave electric and magnetic field observations made with the electric and magnetic field instrument and integrated science (EMFISIS) instrument (Kletzing et al., 2012) on the Van Allen Probes spacecraft (Mauk et al., 2012). From the zero crossings of the perpendicular component of the wave magnetic field, we calculate instantaneous frequencies for each 1/2 wave cycle following the waveform analysis described by Foster et al. (2017).
Following Nogi and Omura (2022), we assume that chorus wave generation begins at the equator. There, the equatorial electron cyclotron frequency, Ωce0, can be determined from the observed off-equatorial EMFISIS wave spectrum assuming wave damping at 1/2 Ωce (Foster et al., 2021; Foster and Erickson, 2022). Away from the equator, the gyrofrequency is taken to be parabolic and is given by the expression, Ωce(h) = Ωce0 (1+ah2), where h is the distance along the field line and a = 4.5/(LRE)2. Electron density and plasma frequency, Ωpe, are taken to be those observed at the off-equatorial spacecraft location.
Eqs 1, 2 are coupled functions of VR with multiple solutions varying with resonant electron energy and pitch angle. Whereas Foster and Erickson (2022) showed the range of electron energies and pitch angles associated with cyclotron resonance at each frequency across a chorus element, Eq. 2 puts an additional condition on VR such that the resonant electron kinetic energy, Kres, and pitch angle are uniquely determined for each wave frequency. Assuming parallel propagation for the waves and initially that vs is constant, we calculate Kres and pitch angle for electrons whose resonant velocity, VR, satisfies both Eqs 1, 2 at each frequency across a single long subpacket. Calculations are made for each 1/2 wave cycle of the observed chorus element. Additionally, in a later section, we investigate the case in which |vs| increases continuously as the wave generation region moves away from the equator.
Foster et al. (2021) describe the characteristics of the long initial and strong second subpackets observed for chorus elements during the 17 March 2013 event studied here. During that event, Van Allen Probe A (RBSP-A) observed a strong rising-tone chorus element at 16:56:30 UT at L = 4.93, MLT = 2.3, L* = 4.6, maglat = −3.79 deg, and with fce0 = 5,480 Hz. In the equatorial wave generation region Ωpe/Ωce0 was 3.61. Figure 1 presents observed waveform parameters and calculated resonant electron energy and pitch angle within the near-equatorial wave generation region for upstream propagation with constant vs/c = −0.065. Wave amplitude (a) increased to ∼25 mV/m during the first subpacket (1) and reached 90 mV/m at the peak of the second subpacket (2). Kres (b) decreased uniformly from 230 keV to 150 keV across the initial 20 msec subpacket, with resonant electron pitch angle (c) ∼110 deg. During the second subpacket, df/dt (d) steepened and Kres decreased to 50 keV with resonant pitch angle increasing to >130 deg.
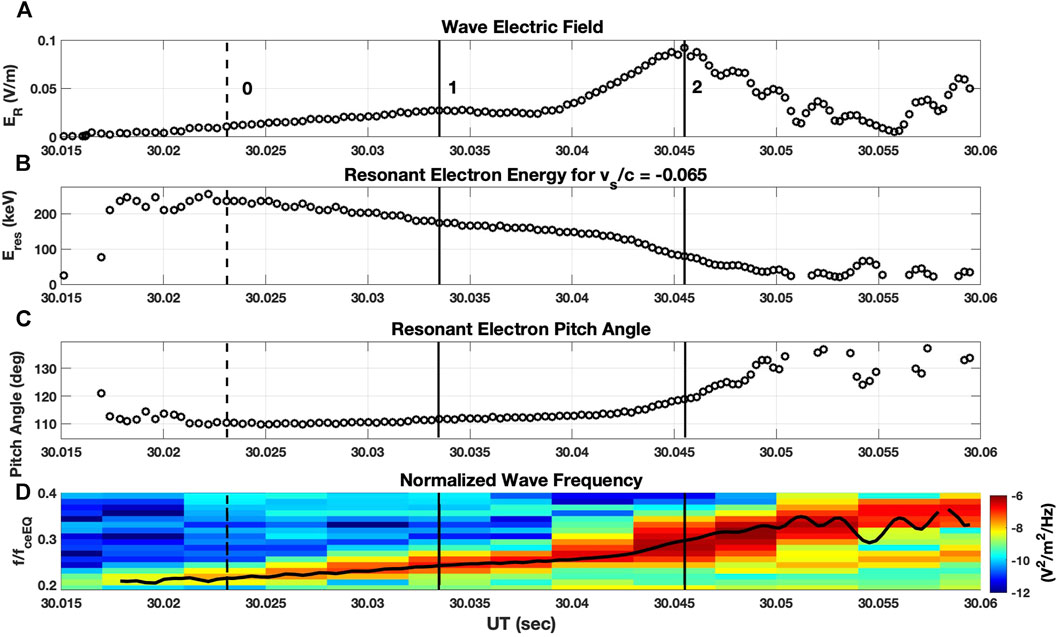
FIGURE 1. (A) Observed right circularly polarized wave electric field, ER, and (D) dynamic spectra and wave frequency for a strong rising tone chorus element observed at 16:56:30 UT on 17 March 2013. Calculated resonant electron energy (B) and pitch angle (C) in the near-equatorial wave generation region for constant vs/c = - 0.065. Vertical lines mark the times of nonlinear growth onset (0) and the peak amplitude of ER for the first (1) and second (2) subpackets in this and following figures.
In Figure 2 we present a graphical representation of the solution of coupled Eqs 1, 2 for vs/c = - 0.065 at the peak of the second subpacket indicated by vertical line (2) in Figure 1. At this point (2) the elapsed time from the onset of the rising tone is 30.5 msec and the distance from the equator along the field line h = −665 km for constant vs/c = - 0.065. In Eq. 1, Ωce = Ωce(h), ω and Vp are derived from the wave observations, and VR varies with Kres through γ. In Figure 2A Eq. 2 for vs/c is plotted against Kres (black) and vs/c = - 0.065 is shown in red. Their point of intersection determines the unique value Kres = 81 keV. In Figure 2B, the variation of resonant electron pitch angle with electron energy satisfying Eq. 1 is shown in black. For the particular conditions at the peak of the second subpacket, electrons with Kres = 81 keV and 118 deg pitch angle satisfy the coupled conditions of Eqs 1, 2 for vs/c = - 0.065. Values of Kres and PA for the entire chorus element are shown in Figures 1B, C respectively.
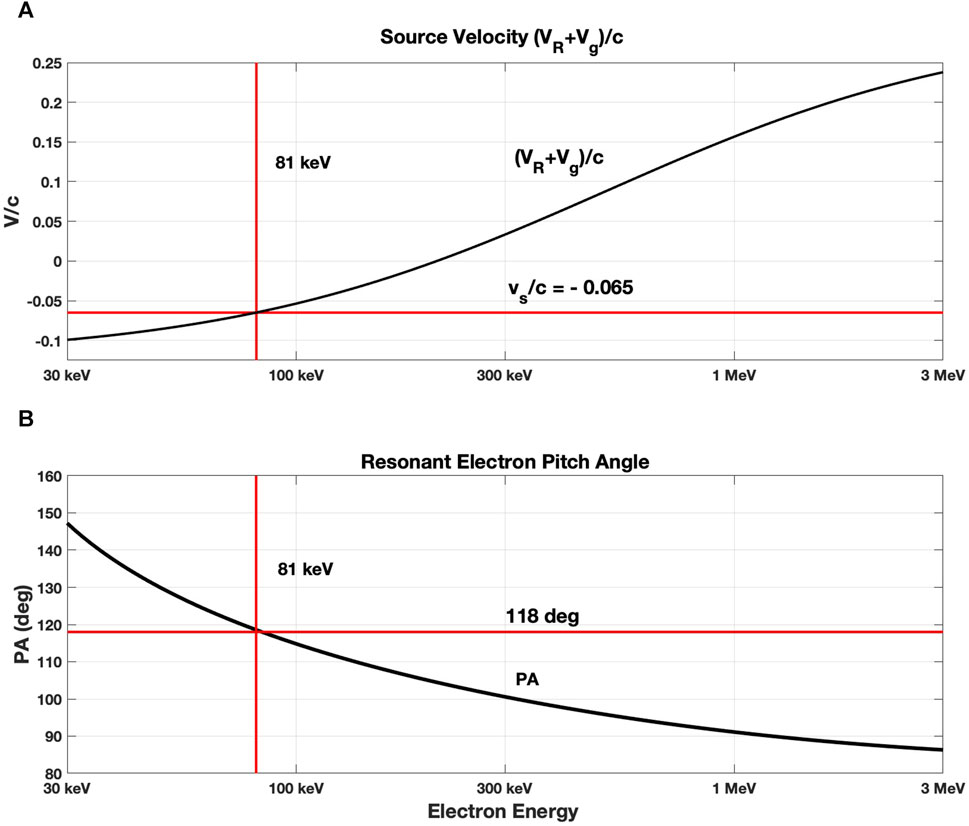
FIGURE 2. Graphical representation of the solution of coupled Eqs 1, 2 for conditions at the peak of the second subpacket (cf. Figure 1) for vs/c = −0.065. (A) For the wave element of Figure 1, the variation of vs/c with Kres from Eq. 2 is presented in black. For vs/c = −0.065 (intersecting red line), the unique resonant energy Kres = 81 keV is determined by the point of intersection of the two equations. (B) Resonant electron pitch angle is presented in black. For 81 keV electrons, the point of intersection yields PA = 118 deg.
For chorus element discussed above, our calculations indicate that the resonant electron energy and pitch angle associated with nonlinear wave growth are in the range Kres = 50–250 keV and pitch angle 110–120 deg. Foster, Rosenberg and Lanzerotti (1976) reported the association of VLF chorus events with the injection of >100 keV electrons. Here we investigate the in situ electron flux with Van Allen Probes Magnetic Electron Ion Spectrometer (MagEIS, (Blake et al., 2012)) observations. Figure 3 presents RBSP-A 110 deg PA low energy electron fluxes (a) and EMFISIS |EuEu| wave spectra (b) for the 17 March 2013 event. Following an initial dipolarization and electron injection at ∼15:52 UT, chorus intensity variation (b) followed the flux variation (a) of the 220 keV electron fluxes (highlighted in red.)
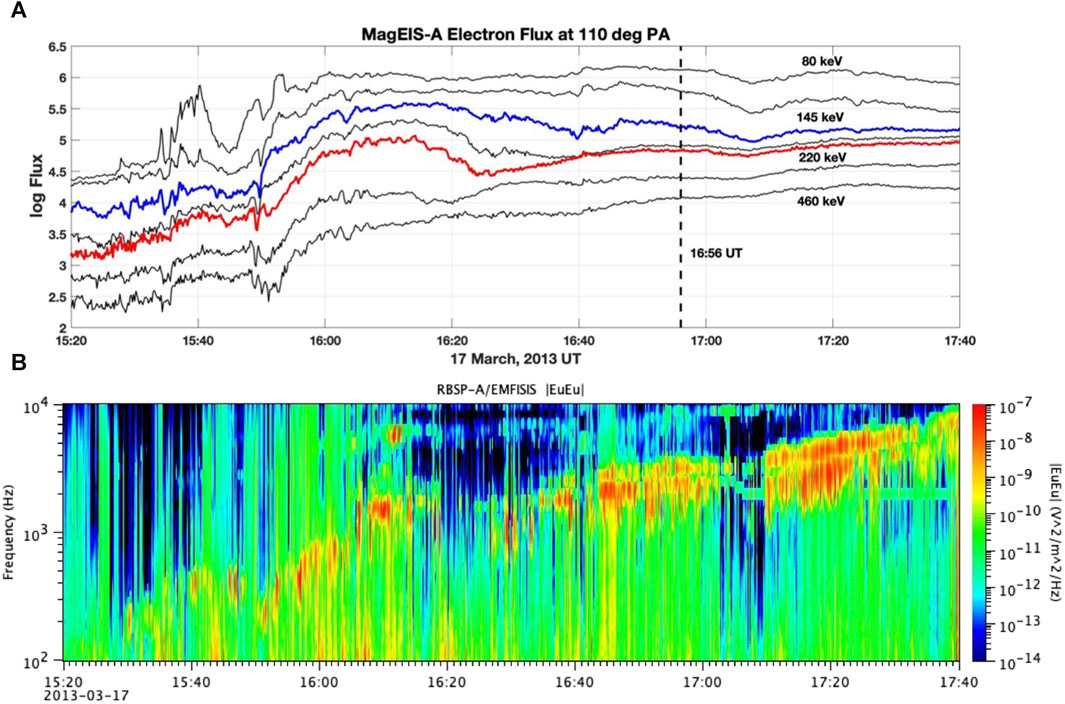
FIGURE 3. (A) MagEIS lower energy electron fluxes at 110 deg pitch angle are shown for the 17 March 2013 event. The observation time of the chorus element shown in Figure 1 is indicated and the 220 keV energy channel associated with Kres at the peak of the wave growth is highlighted in red. (B) EMFISIS EuEu wave spectra show chorus intensification and decrease in association with variation in the 220 keV electron fluxes.
During this event the RBSP-B spacecraft preceded RBSP-A by

FIGURE 4. The ratio of the post to pre injection 110 deg PA electron fluxes (A/B) at the L* = 4.6 location of the chorus element shown in Figure 1 is shown as a function of electron energy (heavy line). Also shown is the electron flux spectrum measured by RBSP-A at 16:56 UT (light dotted line). Red vertical lines mark the resonant electron energies at the peaks of the first (1) and second (2) subpackets.
With reference to Figure 1B, it is seen that for a constant vs/c = −0.065 the resonant electron energies involved in forming the first long subpacket were in the range 200–300 keV, while the rapid growth of the second subpacket involved resonant electrons with energies ranging from 150 to 50 keV as the wave intensity and wave frequency increased. This range of energies is indicated in Figure 4.
The inhomogeneity factor S is essential for nonlinear wave development. The size of the nonlinear trapping potential changes as a function of S (−1 ≤ S ≤ 1). For |S|>1 nonlinear trapping does not occur. Eq. 3 for S has two terms dependent on the time rate of change of the wave frequency (generally positive for rising tone chorus elements) and the spatial gradient of the cyclotron frequency (negative for the upstream (-h) motion of the wave generation region).
Where S, s0, s1, and s2 for cyclotron resonance are taken from equations (37) and (38), (39), (40) in Omura (2021). ΩW is the wave amplitude defined as eBwave/m0, and m0 is the electron rest mass.
Both |h| and Ωce increase with time, calculated incrementally at each 1/2 wave cycle.
For an upstream motion of the wave generation region, h < 0 and both dh and
The inhomogeneity factor S represents the magnitude of the energy loss/gain rate of trapped resonant electrons satisfying the second-order resonance condition. F(S), Eq. 9 (Omura et al., 2019), represents the number of trapped electrons. Therefore,
As seen in Figure 5, the size of the gain factor for wave growth, G =
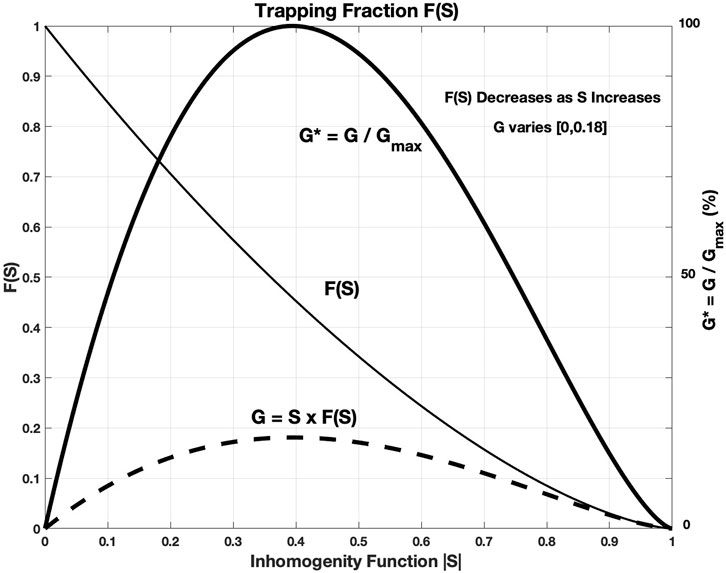
FIGURE 5. The fraction of trapped resonant electrons, F(S), is a decreasing function of |S|. The gain factor, G =
|G| maximizes for |S|
The inhomogeneity factor varies with resonant electron energy, wave frequency, and the changing ambient magnetic field and plasma conditions. We have examined the variation of G* and Kres for a range of constant values of vs/c ε [-0.0001, −0.01] and summarize our findings in Figure 6 where we show detailed plots of G* calculated for two constant values of vs/c over a range of resonant electron energies for the chorus element shown in Figure 1. All values of G are negative and G* is shown as a percentage of Gmax. Colored matrices show G* for resonant electron energies in the range [30 keV, 1.2 MeV] satisfying Eq. 1 for fixed values of vs/c. Note that cyclotron resonance does not occur for |G*| > 1 and S is nonexistent in those regions.
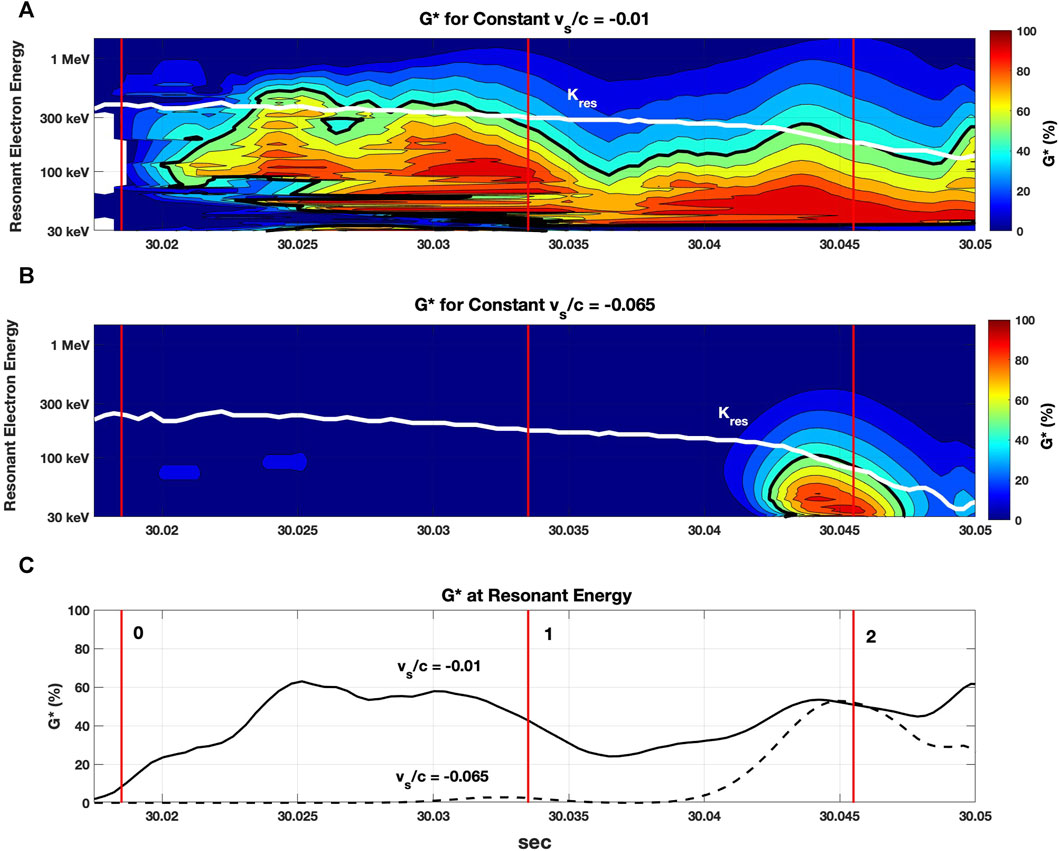
FIGURE 6. G* for resonant electron energies in the range [30 keV, 1.2 MeV] for the wave element of Figure 1 are shown for constant values of vs/c = - 0.01 (A) and vs/c = - 0.065 (B). Heavy black contours mark G* = 50% and white curves denote resonant electron energies Kres satisfying both Eqs 1, 2. (C) G* for Kres satisfying both Eqs 1, 2 are shown for vs/c = - 0.01 and - 0.06.
For vs/c = - 0.01, resonant electron energy, Kres, satisfying both Eqs 1, 2 (white curves) ranges from 385 keV to 180 keV across subpackets 1 and 2. G*
Contours of Kres and G* for several additional values of vs/c can be found in Supplementary Figure S1 in the Supplement to this paper.
In summary, we find that for constant values of vs/c, small upstream constant velocities |vs/c| < 0.005 have very little effect on Kres or the gain factor G*. Values of |vs/c | < 0.02 are needed to sustain initial wave growth (G* >20%) in the first subpacket. As |vs/c| increases >0.03, G* at higher frequencies increases toward 100% and resonant electron energy (Kres) decreases toward zero to non-physical values.
As demonstrated in Figure 6, |vs/c | < 0.02 is needed to sustain initial wave growth at lower frequencies (earlier times) while values |vs/c| increase G* at higher frequencies while lowering Kres to a region of higher resonant electron flux. Nogi and Omura (2023) found that the velocity of the wave generation region VW is dependent on the duration of the subpacket. When the source velocity vs, is approximately the same as VW, a long-sustaining rising-tone emission is generated. However, when a spatial and temporal gap between subpackets exists, resonant electrons in the gap between subpackets are carried at the resonance velocity into the upstream region, and the magnitude of VW increases such that |VW| > |vs/c | (Nogi and Omura, 2023). That result suggests that the magnitude of vs/c could increase across the timespan of the initial and second subpackets in order to maintain the conditions for optimal wave generation. An increase in |vs/c | such that vs ∼ VW could help to explain the smoothly varying frequency and phase between the first and second subpackets observed during the 17 March 2013 radiation belt acceleration event.
In Figure 7 we present results for the simple case of a linear increase of vs/c over the range −0.001 to −0.07 across the 30 msec extent of the first two subpackets of the chorus element. In this case the wave generation is 350 km upstream of the equator at the time of the peak of the second subpacket. We find resonant electron energy of 220 and 80 keV associated with the peak wave amplitudes of subpackets 1 and 2. Those resonant energies are consistent with the observed electron flux enhancement. For this variable vs/c case, G* exceeds 50% during the growth of the initial chorus wave element subpacket and approaches 80% across the strong second subpacket.
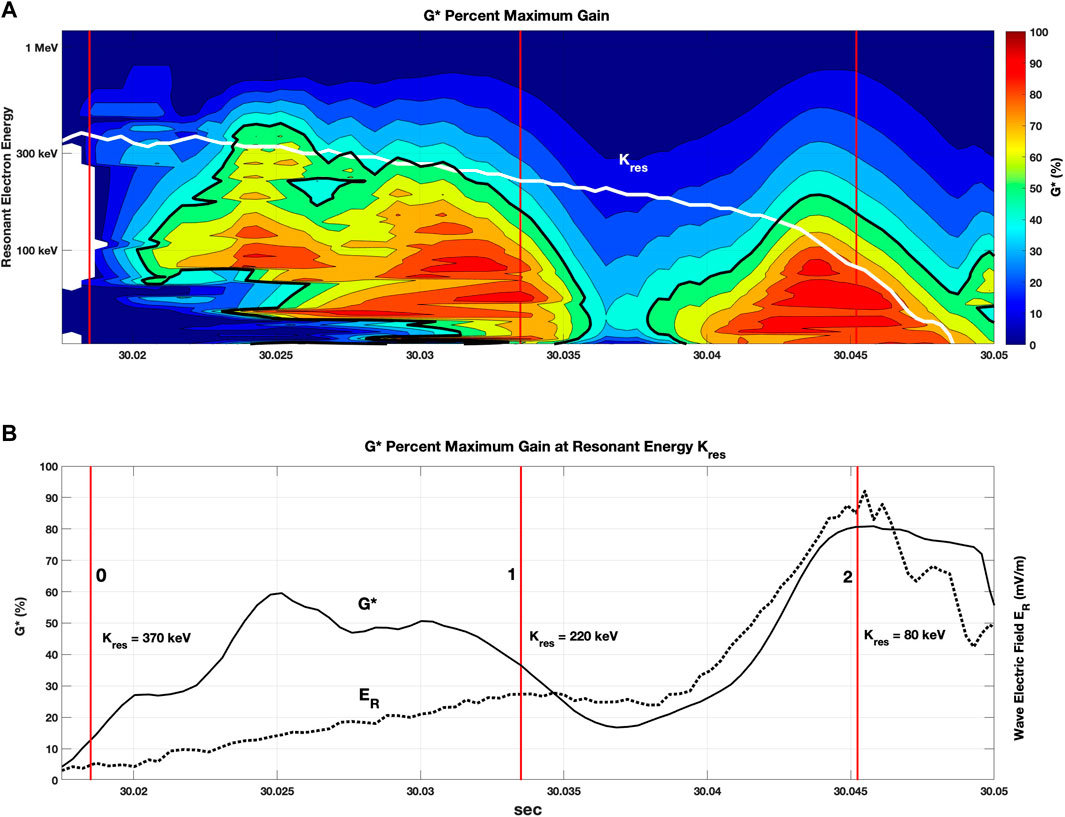
FIGURE 7. (A) The fractional value of G* is shown in the format of Figure 6A for linearly increasing values of -vs/c over the range −0.001 to −0.07. Heavy black contours mark G* = 50%. The white curve denotes resonant electron energies satisfying both Eqs 1, 2. Vertical lines mark the times of peak wave intensity for the first (1) and second (2) subpackets of the chorus element shown in Figure 1. (B) G* for Kres satisfying both Eqs 1, 2 is shown as the solid curve. The dashed curve shows the wave electric field, ER. Vertical red lines mark the peaks of subpackets 1 and 2.
In Figure 1B we see that Kres changes with varying wave frequency for constant vs/c, while comparisons between panels a and b in Figure 6 show the variation of Kres with vs/c at constant frequency. In their study of the upstream shift of the generation region of rising-tone chorus emissions, Nogi and Omura (2023) in their Figure 2 display the coupled dependence of Kres on wave frequency and vs/c. In Figure 8 we reproduce that calculation for the equatorial plasma conditions (Ωpe/Ωce0 = 3.61) appropriate for our observations. The variation of vs/c is shown for constant values of Kres (350, 200, 100, and 50 keV). The parameter range of our observations (Ωpe/Ωce0 ε [0.2, 0.32]) and our modeling (vs/c ε [-0.01, −0.065]) are bounded by the black rectangle. For various times across the observed waveform, chorus wave and variable-vs modeling parameters, as described in Section 3.1 and Section 6 respectively, are presented in Table 1. With these, we indicate on Figure 8 the positions of wave growth onset (0), and peak amplitude of subpackets (1) and (2) derived from our calculations. The calculated values of Kres at those positions (370, 220, and 80 keV) are in excellent agreement with the theoretical curves. We note that any further increase in frequency during subpacket 2 (or further increase in upstream velocity) would push the resonant energy toward zero, shutting down the interaction. With reference to Figure 8 it is seen that further subpacket development at higher frequencies could be supported closer to the equator and with a lower initial value of |vs/c|.
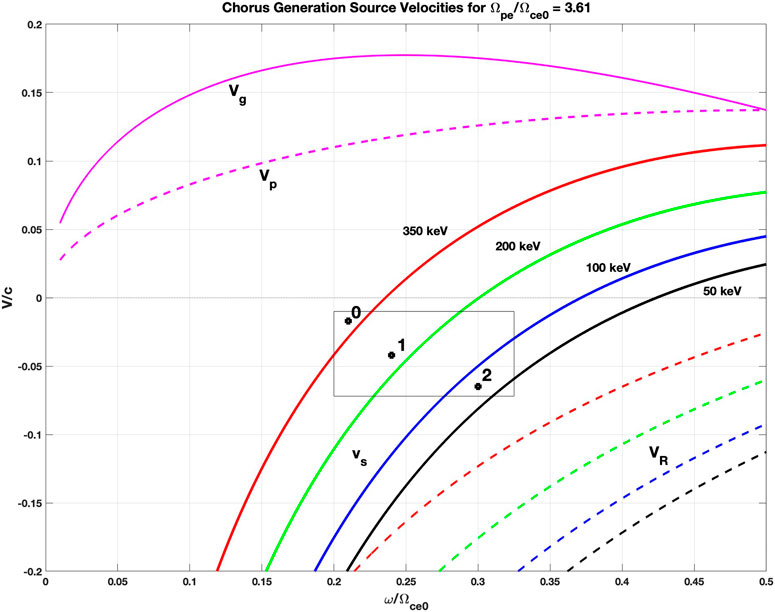
FIGURE 8. Following the work of Nogi and Omura (2023) contours of vs (solid curves) and VR (dashed curves) are shown for fixed values of Kres. The black rectangle outlines the parameter space associated with this study, and solid points identify the calculated resonant electron energies at wave growth onset (0), and peak amplitude of subpackets (1) and (2).
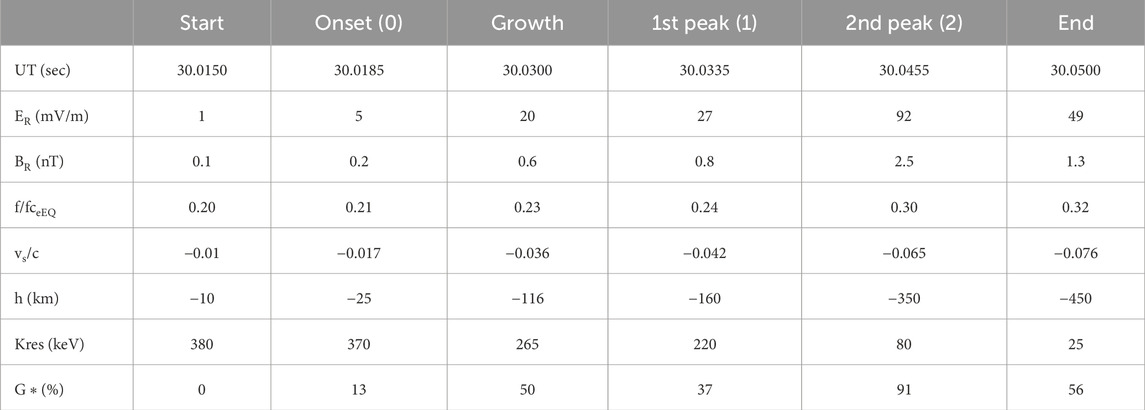
TABLE 1. Chorus parameters for variable upstream source motion.
Large amplitude chorus waves are associated with the rapid acceleration of radiation belt electrons to MeV energies. Strong wave growth (G* approaching 100%) is conducive to generation of the large amplitude chorus wave subpackets observed. Along with the inhomogeneity factor, the available flux of resonant electrons is a controlling factor for the development of strong chorus wave elements. The energy transfer J ⋅ E which controls nonlinear wave growth is proportional to both G* and the flux of resonant electrons. In Figure 4 we presented the post to pre injection ratio of electron fluxes observed by the sequential passes of RBSP B and A at the L = 4.6 location of our chorus wave observations. Eqs 1 and 2 determine resonant electron energy and pitch angle at each frequency in the wave generation region. We combine this information in Figure 9, multiplying the temporal variation of % G* as shown in Figure 7B by the observed injected electron flux ratio for the corresponding values of Kres. The resultant wave growth profile (Figure 9A, solid curve) is in very good relative agreement with the development of the chorus wave electric field (Figure 9B).
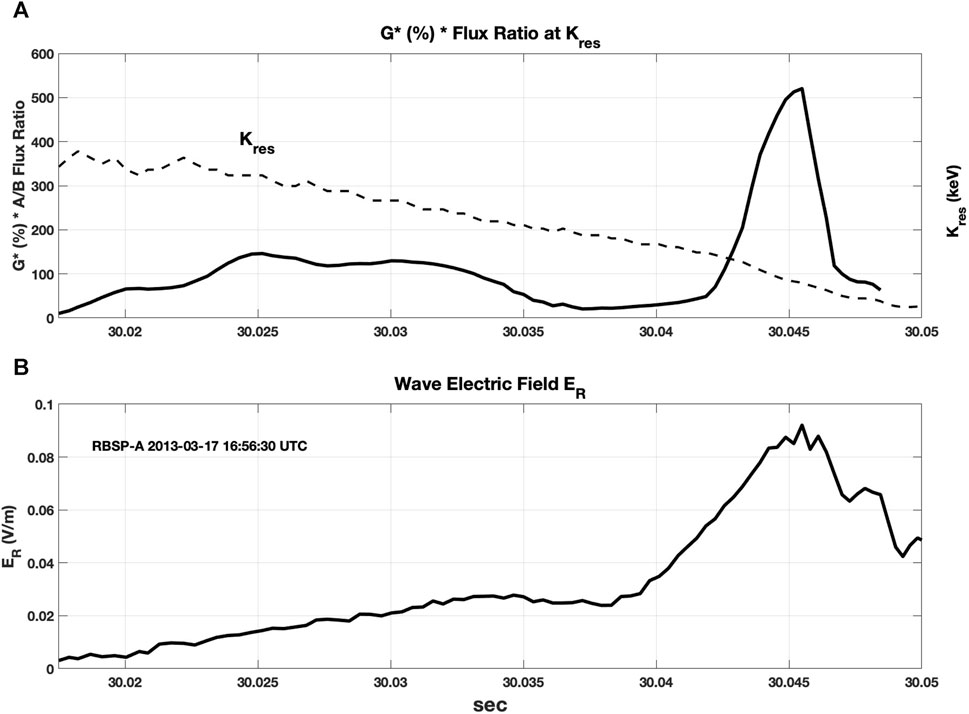
FIGURE 9. (A) G* from Figure 7B is combined with the injected electron flux ratio shown in Figure 4 as an estimate of the overall wave growth rate. The corresponding values of Kres are shown as the dashed curve. (B) The variation of the observed wave electric field across the first and second subpackets favorably matches this estimated of the wave growth rate.
We have examined the consequences of an upstream motion of the wave generation region using direct measurements of chorus waveforms and plasma parameters based on Van Allen Probes in situ observations. We have examined both constant values and a linear temporal increase of vs/c in order to determine the most favorable conditions for wave growth both during the initial development of the chorus element at lower frequencies and across the strong subpackets that follow at higher frequencies. We compare the computed resonant electron energies and pitch angles with observations of the injected electron population. For the strong chorus elements, we calculate resonant electron energies 50–400 keV and pitch angles 100–115 deg associated with nonlinear wave growth at frequencies around 0.25–0.4 fceEQ. Sub-relativistic electron injections in the same range of energies and pitch angles were observed for the cases studied. In all cases examined, the resonant electron energies associated with the onset of nonlinear wave growth were >250 keV.
We find that a linear temporal increase of upstream |vs/c| (varying from −0.01 to −0.065 across a 30–50 msec span of the initial subpackets) results in wave growth at 50%–80% of its theoretical maximal value consistent with the range of injected electron energies (80 keV–300 keV) observed at the time of the chorus element. Supplementary Figures 2, 3 in the Supplement to this paper illustrate similar findings for an additional strong chorus element observed during this event. Our analysis of the upstream propagation of the wave generation region, including increasing vs/c, can account for both the initial wave growth and the formation of the strong second subpackets observed.
We suggest that the increase in the magnitude of vs/c across the timespan of the first and second subpackets could take place in order to maintain the conditions for optimal wave generation. An increase in |vs/c | such that vs ∼ VW would help to explain the smoothly varying frequency and phase between the first and second subpackets observed during the 17 March 2013 radiation belt acceleration event.
We reach the following summary conclusions.
For a given upstream velocity, vs, resonant electron energy Kres and pitch angle are uniquely determined for each wave frequency along the chorus element.
For the conditions examined on 17 March 2017, Kres at the onset of nonlinear wave growth was in the range 250–400 keV and decreased with time as the wave frequency increased during the first and second subpackets of the rising tone chorus elements.
Smaller values (|vs/c | < 0.02) are needed to sustain initial wave growth (G* >20%) in the first subpacket.
As |vs/c| increases >0.03, G* at higher frequencies increases toward 100% and resonant electron energy (Kres) decreases to non-physical values.
Upstream propagation of the wave generation region, including increasing vs/c, can account for both the observed initial wave growth and the formation of a strong second subpacket.
Publicly available datasets were analyzed in this study. This data can be found here: Data from the MagEIS instrument onboard Van Allen Probes can be obtained from the archive at https://rbsp-ect.newmexicoconsortium.org/science/DataDirectories.php. EMFISIS data are available at https://emfisis.physics.uiowa.edu/data/index.
JF: Conceptualization, Formal Analysis, Methodology, Project administration, Software, Supervision, Visualization, Writing–original draft, Writing–review and editing. PE: Data curation, Funding acquisition, Resources, Software, Validation, Writing–review and editing. YO: Conceptualization, Methodology, Validation, Visualization, Writing–review and editing.
The author(s) declare financial support was received for the research, authorship, and/or publication of this article. Preliminary research at the MIT Haystack Observatory was supported by the NASA Van Allen Probes (RBSP) funding provided under NASA prime contract NAS5-01072, including the EFW investigation (PI: J.R. Wygant, University of Minnesota), and the ECT investigation (PI: H. Spence, University of New Hampshire). JF received no external funding for work on this study. PE was supported by internal funding provided by the Massachusetts Institute of Technology. YO was supported by JSPS KAKENHI Grant No. JP20H01960 and JP23H05429.
We acknowledge the seminal work of the late Craig Kletzing, whose leadership within the Van Allen Probes mission produced the excellent quality EMFISIS wave measurements that lie at the heart of this study.
The authors declare that the research was conducted in the absence of any commercial or financial relationships that could be construed as a potential conflict of interest.
The author(s) declared that they were an editorial board member of Frontiers, at the time of submission. This had no impact on the peer review process and the final decision.
All claims expressed in this article are solely those of the authors and do not necessarily represent those of their affiliated organizations, or those of the publisher, the editors and the reviewers. Any product that may be evaluated in this article, or claim that may be made by its manufacturer, is not guaranteed or endorsed by the publisher.
The Supplementary Material for this article can be found online at: https://www.frontiersin.org/articles/10.3389/fspas.2024.1374331/full#supplementary-material
Baker, D. N., Foster, J. C., Erickson, P. J., Henderson, M. G., Kanekal, S. G., Reeves, G. D., et al. (2014). Gradual diffusion and punctuated phase space density enhancements of highly relativistic electrons: van allen Probes observations. Geophys. Res. Lett. 41, 1351–1358. doi:10.1002/2013GL058942
Blake, J. B., Carranza, P. A., Claudepierre, S. G., Clemmons, J. H., Crain, W. R., Dotan, Y., et al. (2012). The magnetic electron Ion spectrometer (MagEIS) instruments aboard the radiation belt storm Probes (RBSP) spacecraft. Space Sci. Rev. 179, 383–421. doi:10.1007/s11214-013-9991-8
Breneman, A. W., Crew, A., Sample, J., Klumpar, D., Johnson, A., Agapitov, O., et al. (2017). Observations directly linking relativistic electron microbursts to whistler mode chorus: Van Allen Probes and FIREBIRD II. Geophys. Res. Lett. 44 (11), 265–272. doi:10.1002/2017GL075001
Brice, N. (1964). Fundamentals of very low frequency emission generation mechanisms. J. Geophys. Res. 69, 4515–4522. doi:10.1029/JZ069i021p04515
Foster, J. C., Erickson, P. J., and Omura, Y. (2021). Subpacket structure in strong VLF chorus rising tones: characteristics and consequences for relativistic electron acceleration. Earth Planets Space 73, 140. doi:10.1186/s40623-021-01467-4
Foster, J. C., and Erickson, P. J. (2022). Off-equatorial effects of the nonlinear interaction of VLF chorus waves with radiation belt electrons. Front. Astron. Space Sci. Sec. Space Phys. 9. doi:10.3389/fspas.2022.986814
Foster, J. C., Erickson, P. J., Baker, D. N., Claudepierre, S. G., Kletzing, C. A., Kurth, W., et al. (2014). Prompt energization of relativistic and highly relativistic electrons during a substorm interval: Van Allen Probes observations. Geophys. Res. Lett. 41, 20–25. doi:10.1002/2013GL058438
Foster, J. C., Erickson, P. J., Omura, Y., Baker, D. N., Kletzing, C. A., and Claudepierre, S. G. (2017). Van Allen Probes observations of prompt MeV radiation belt electron acceleration in nonlinear interactions with VLF chorus. J. Geophys. Res. Space Phys. 122, 324–339. doi:10.1002/2016JA023429
Foster, J. C., and Rosenberg, T. J. (1976). Electron precipitation and VLF emissions associated with cyclotron resonance interactions near the plasmapause. J. Geophys. Res. 81 (13), 2183–2192. doi:10.1029/JA081i013p02183
Foster, J. C., Rosenberg, T. J., and Lanzerotti, L. J. (1976). Magnetospheric conditions at the time of enhanced wave-particle interactions near the plasmapause. J. Geophys. Res. 81 (13), 2175–2182. doi:10.1029/JA081i013p02175
Gao, X. L., Chen, R., Lu, Q., Chen, L. J., Chen, H. Y., and Wang, X. Y. (2022). Observational evidence for the origin of repetitive chorus emissions. Geophys. Res. Lett. 49, 99000. doi:10.1029/2022GL099000
Gao, X. L., Ma, J. Q., Shao, T., Chen, R., Ke, Y. G., and Lu, Q. M. (2023). Why chorus waves are the dominant driver for diffuse auroral precipitation. Sci. Bull. 9273. doi:10.1016/j.scib.2023.12.009
Harid, V., Gołkowski, M., Hosseini, P., and Kim, H. (2022). Backward-propagating source as a component of rising tone whistler-mode chorus generation. Front. Astron. Space Sci. 9, 981949. doi:10.3389/fspas.2022.981949
Hsieh, Y. K., and Omura, Y. (2018). Nonlinear damping of oblique whistler mode waves via Landau resonance. J. Geophys Res. Space Phys. 123, 7462–7472. doi:10.1029/2018JA025848
Hua, M., Bortnik, J., Spence, H. E., and Reeves, G. D. (2023). Testing the key processes that accelerate outer radiation belt relativistic electrons during geomagnetic storms. Front. Astron. Space Sci. Sec. Space Phys. 10. doi:10.3389/fspas.2023.1168636
Kletzing, C. A., Kurth, W. S., Acuna, M., MacDowall, R. J., Torbert, R. B., Averkamp, T., et al. (2012). The electric and magnetic field instrument suite and integrated science (EMFISIS) on RBSP. Space Sci. Rev. 179, 127–181. doi:10.1007/s11214-013-9993-6
Li, L., Omura, Y., Zhou, X., Zong, Q., Rankin, R., Yue, C., et al. (2023). Chorus wave generation modulated by field line resonance and mirror-mode ULF waves. J. Geophys. Res. Space Phys. 128, 031127. doi:10.1029/2022JA031127
Li, W., Ma, Q., Thorne, R. M., Bortnik, J., Zhang, X., Li, J., et al. (2016). Radiation belt electron acceleration during the 17 March 2015 geomagnetic storm: observations and simulations. J. Geophys. Res. Space Phys. 121, 5520–5536. doi:10.1002/2016JA022400
Mauk, B. H., Fox, N. J., Kanekal, S. G., Kessel, R. L., Sibeck, D. G., and Ukhorskiy, A. (2012). Science objectives and rationale for the radiation belt storm Probes mission. Space Sci. Rev. 179, 3–27. doi:10.1007/s11214-012-9908-y
Nogi, T., and Omura, Y. (2022). Nonlinear signatures of VLF-triggered emissions: a simulation study. J. Geophys. Res. Space Phys. 127 (1), 029826. doi:10.1029/2021JA029826
Nogi, T., and Omura, Y. (2023). Upstream shift of generation region of whistler-mode rising-tone emissions in the magnetosphere. J. Geophys. Res. Space Phys. 128, 031024. doi:10.1029/2022JA031024
Omura, Y. (2021). Nonlinear wave growth theory of whistler-mode chorus and hiss emissions in the magnetosphere. Earth Planets Space 73, 95. doi:10.1186/s40623-021-01380-w
Omura, Y., Hsieh, Y. K., Foster, J. C., Erickson, P. J., Kletzing, C. A., and Baker, D. N. (2019). Cyclotron acceleration of relativistic electrons through landau resonance with obliquely propagating whistler mode chorus emissions. J. Geophys Res. Space Phys. 124, 2795–2810. doi:10.1029/2018JA026374
Reeves, G. D., Spence, H. E., Henderson, M. G., Morley, S. K., Friedel, R. H. W., Funsten, H. O., et al. (2013). Electron acceleration in the heart of the Van Allen radiation belts. Science 341, 991–994. doi:10.1126/science.1237743
Rosenberg, T. J., Foster, J. C., Mathews, D. L., Sheldon, W. R., and Benbrook, J. R. (1977). Microburst electron precipitation atL≈ 4. J. Geophys. Res. 82, 177–180. doi:10.1029/ja082i001p00177
Santolík, O., Kletzing, C. A., Kurth, W. S., Hospodarsky, G. B., and Bounds, S. R. (2014). Fine structure of large-amplitude chorus wave packets. Geophys. Res. Lett. 41, 293–299. doi:10.1002/2013GL058889
Tao, X., Zonca, F., and Chen, L. (2021). A “Trap-Release-Amplify” model of chorus waves. J. Geophys. Res. Space Phys. 126, 029585. doi:10.1029/2021JA029585
Thorne, R. M., Li, W., Ni, B., Ma, Q., Bortnik, J., Chen, L., et al. (2013). Rapid local acceleration of relativistic radiation-belt electrons by magnetospheric chorus. Nature 504, 411–414. doi:10.1038/nature12889
Tsurutani, B. T., Lakhina, G. S., and Verkhoglyadova, O. P. (2013). Energetic electron (>10 keV) microburst precipitation, ∼5–15 s X-ray pulsations, chorus, and wave-particle interactions: a review. J. Geophys. Res. Space Phys. 118, 2296–2312. doi:10.1002/jgra.50264
Keywords: VLF chorus, radiation belts, nonlinear processes, wave particle interactions, subpacket formation, wave generation region, upstream motion
Citation: Foster JC, Erickson PJ and Omura Y (2024) Upstream motion of chorus wave generation: comparisons with observations. Front. Astron. Space Sci. 11:1374331. doi: 10.3389/fspas.2024.1374331
Received: 21 January 2024; Accepted: 08 February 2024;
Published: 21 February 2024.
Edited by:
Chaoling Tang, Shandong University, ChinaReviewed by:
Xinliang Gao, University of Science and Technology of China, ChinaCopyright © 2024 Foster, Erickson and Omura. This is an open-access article distributed under the terms of the Creative Commons Attribution License (CC BY). The use, distribution or reproduction in other forums is permitted, provided the original author(s) and the copyright owner(s) are credited and that the original publication in this journal is cited, in accordance with accepted academic practice. No use, distribution or reproduction is permitted which does not comply with these terms.
*Correspondence: John C. Foster, amNmb3N0ZXJAbWl0LmVkdQ==
Disclaimer: All claims expressed in this article are solely those of the authors and do not necessarily represent those of their affiliated organizations, or those of the publisher, the editors and the reviewers. Any product that may be evaluated in this article or claim that may be made by its manufacturer is not guaranteed or endorsed by the publisher.
Research integrity at Frontiers
Learn more about the work of our research integrity team to safeguard the quality of each article we publish.