 Eduard Fernando Piratova-Moreno
 Luz Ángela García
- 1Fundación Universitaria Los Libertadores, Bogotá, Colombia
- 2Universidad ECCI, Bogotá, Colombia
This theoretical work investigates different models to predict the redshift of fast radio bursts (FRBs) from their observed dispersion measure (DM) and other reported properties. We performed an extended revision of the FRBs with confirmed galaxy hosts in the literature and built the most updated catalog to date. With this sample of FRBs, we propose four models that relate the DM and z: a linear trend (inspired by the Macquart relation), a log-parabolic function, a power law, and an interpolation for DM that includes z and the position of the host galaxy of the transient. The latter model has the highest success rate according to the metrics implemented: likelihood, median of the z difference, and the Akaike and Bayesian information criteria. Although the performance of model D is closely followed by the power law and linear models, the former has the advantage of accounting for anisotropies in the dispersion measure due to the angular coordinates. Conversely, the log-parabolic formula performs poorly in this task but provides a good prediction for FRBs with low DM at a low redshift. Additionally, we use the reported galaxy properties of the hosts to establish a connection between the observed DM with the star formation rate (SFR) and stellar mass (Ms) of the galaxies where the FRBs reside. In both cases, we find a weak correlation. Although the studied correlations are well-motivated, the sample of FRBs is not statistically significant enough to draw solid conclusions in this second part of our work. With the advent of new facilities devoted to studying the localization and nature of these transients, we will get access to new data that will enrich the proposed models and give us hints on the astrophysical origin and evolution of FRBs.
1 Introduction
Fast radio bursts (FRBs) are bright radio transients with a typical fluence rate of ≳ 1 Jy per millisecond. Since the first discovery of the first FRB in 2007 by Lorimer et al. (2007), there have been thousands of reports of these transients (Petroff et al., 2016; Collaboration et al., 2021), yet their astrophysical origin is still elusive to astronomers (Keane et al., 2012; Thornton et al., 2013). A likely cause of an FRB explosion is a magnetar (Bochenek et al., 2020; Wang et al., 2022), a highly magnetized neutron star produced by a core-collapse supernova explosion. However, this hypothesis is still under debate mainly because of the detection of repeater FRBs, which are signals that show a recurrence in time. The first repeating transient, FRB20121102A, opened the question of whether there is a bimodal population of FRBs with repeating and non-repeating signals and, if so, what astrophysical processes drive such diversity in these objects (Palaniswamy et al., 2018). However, recent statistical probes made with data from the Canadian Hydrogen Intensity Mapping Experiment (CHIME)/FRB events do not show a clear bimodality between the repetition rates of repeaters and nonrepeating sources (Collaboration et al., 2023).
The dispersion measure (DM) is one of the main observables studied for these radio signals. It is defined as the integrated column density of the free electrons along the sight line (Niino, 2020). The DM is calculated as the delay between the highest and lowest frequencies of the burst, caused by the scattering of the signal due to the matter content of the different environments that light has to go through in its path to our detectors. The observed DM is the sum of various contributions with different astrophysical origins: DMhost (dispersion due to the FRB host galaxy), an additional contribution due to the intergalactic medium (IGM; in the literature, it is found interchangeably as DMIGM or DMcosmic), and the dispersion of light emitted by the transient due to our own Milky Way, DMMW.
To date, about 50 of these FRBs have been localized, and their parent galaxies have been observed at different wavelengths, providing astronomers with more tools to characterize these transients and reveal their nature and origin. Nonetheless, identifying the FRB host galaxy is still quite challenging and demands efforts on multiple fronts due to their randomness and ultra-short duration; thus, the study of FRB redshift models from the observed dispersion measure is a pressing matter. Macquart et al. (2020) proposed a DM–z relation (the so-called Macquart relation), and since then, other works have updated the relation with new localized FRBs (Cui et al., 2022; Baptista et al., 2023). A different program was devoted to quantifying the components of the dispersion measure from the intergalactic medium (IGM; (Pol et al., 2019; Batten et al., 2021; Medlock and Cen, 2021; Zhang et al., 2021; Zhu and Feng, 2021; Mo et al., 2023)) or the host galaxy (Jaroszyński, 2020; Zhang et al., 2020; Wang and Yu, 2023) using hydrodynamical simulations. Similarly, Bhattacharya et al. (2021) used a Monte Carlo approach to model the possible dependences of the FRB populations on the star formation rate as a function of redshift z or spatial density. On the other hand, Xu et al. (2021) pointed out the presence of large fluctuations in the observed dispersion measure at similar redshifts in the first release of the CHIME catalog (Collaboration et al., 2021), which may indicate that the DM–z relationship needs to take into account angular dependences and not only the radial distance from the FRB to the observer. The latter effect is likely due to the distinctive paths the FRB light crosses through the intergalactic medium and its specific electron density.
This work builds on these efforts and presents several models that relate DM (and other FRB physical properties) with their confirmed redshift. We aim to provide a robust method to predict transients’ redshift and help astronomers program their observational campaigns.
The remainder of this paper is arranged as follows: § 2 presents the FRB catalog used throughout the paper. Section 3 offers different models to relate DM–z: a linear trend (an extension of the Macquart relation), a log-parabolic function, a power-law functional form, and a novel approach that explores DM = DM (z, RA, and DEC). In addition, we show the predictions for the known z value and evaluate the goodness of the models with the median of the differences in z, the likelihood, and Akaike and Bayesian information criteria. Finally, we introduce two possible correlations of the galaxy properties with the observed DM beyond z. In Section 4, we summarize our findings and discuss the caveats of the models.
2 FRB catalog
We set up an FRB catalog from the Transient Name Server (TNS) (Yaron et al., 2020) updated to February 21, 2024. The set of FRBs contains 941 entries and 34 variables. Nonetheless, we only focus on the following properties: the name of the FRB, the position in the sky of the object (RA and DEC), whether the FRB is a repeater or not, the dispersion measure and its error (DM ±ΔDM), the telescope that made the detection of the transient, the associated reference for each object, and last but not least, if the FRB has a known galaxy host, in addition to other physical properties of the FRB.
With the FRB host information, we create a subsample of FRBs with a confirmed galaxy host (thus, its redshift is known). There are 48 FRBs in this category, but only 24 FRBs are unique since 8 of these instances are repeaters. We treat the repeating FRBs as the same object and take the mean DM for each transient. The resulting FRB subsample is presented in Table 1.
It is worth noting that FRBs with the † symbol in Table 1 correspond to transients whose optical counterparts are galaxy clusters, not single galaxies.
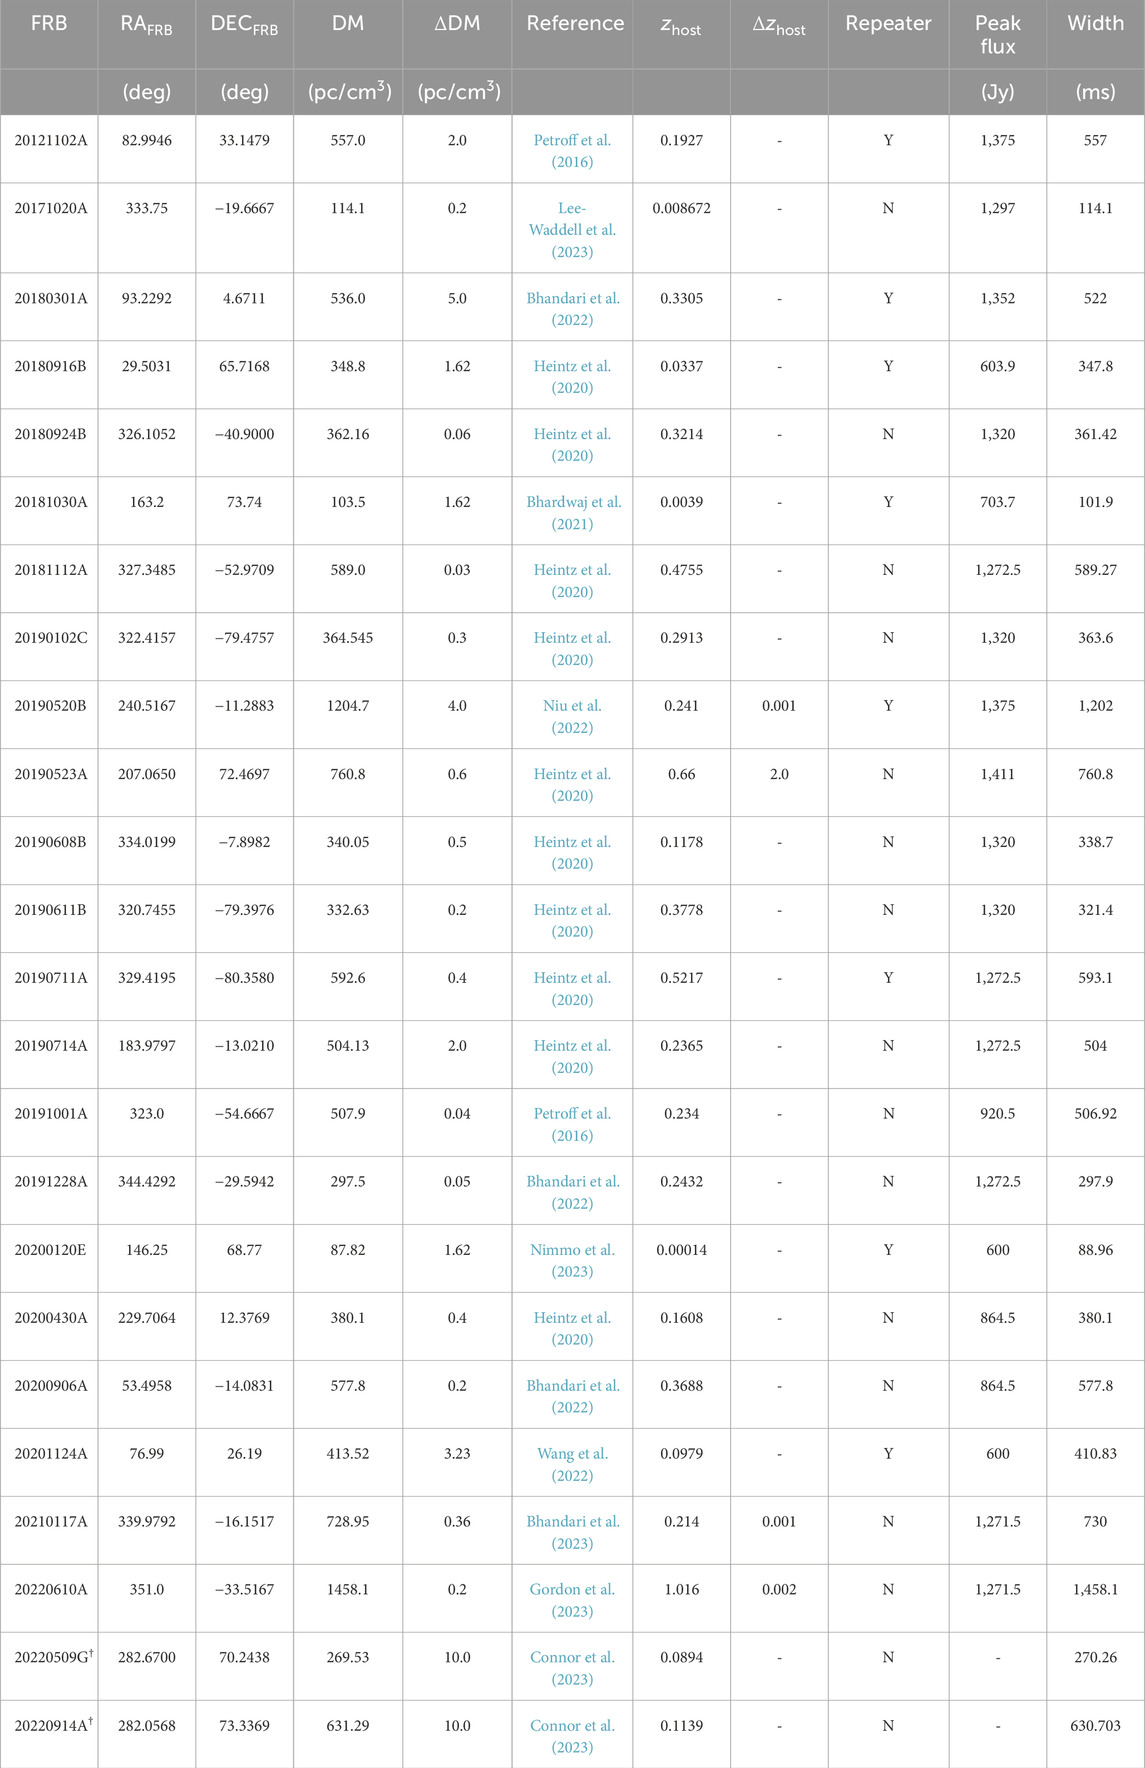
Table 1. List of FRBs with known galaxy hosts to date. Columns 1 to 6 correspond to the name of the FRB, right ascension, declination, DM, the error of the DM, and the reference associated with the reported FRB. The redshift and redshift errors of the optical counterpart of each FRB are presented in columns 7 and 8. Columns 9 to 11 show whether the FRB is a repeater, the peak flux, and the time width of each transient. The information in the last two columns was taken from https://www.herta-experiment.org/frbstats/catalogue since most publications report either the inferred fluence or one of the two properties of the FRB.
3 FRB redshift estimates from the dispersion measure
3.1 DM–z relationship
Based on the observed dispersion measure (and ΔDM) of the 22 known FRBs with galaxy hosts, we exclude the last two FRBs presented in Table 1, whose hosts are galaxy clusters. We explore different models to infer the FRB redshift and the corresponding error.
Model A:
The simplest model to find an estimated redshift from DM is through a linear relationship, a reasonable assumption since the dispersion measure is an indicator of the distance, and the distance grows linearly with z at a low redshift. This functional form was first presented by Macquart et al. (2020), and subsequent work in this direction was done by Cui et al. (2022). The linear model is summarized using the following relationship:
The best-fit parameters for the linear model are a = 1021.36 pc/cm3 and b = 221.99 pc/cm3. We show the DM–redshift relationship with model A in Figure 1.
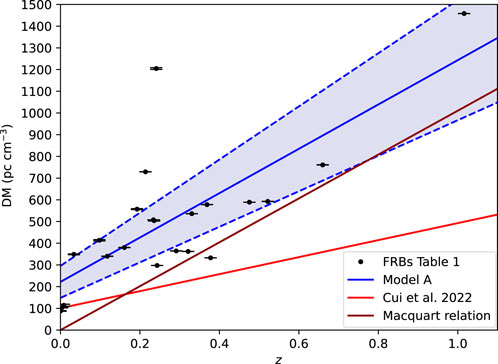
Figure 1. DM–redshift relationship for localized FRBs predicted by the linear model (refer to Eq. 2). Hereafter, the 22 FRBs reported in Table 1 are presented as black dots with their corresponding errors. The forecast from the linear model is shown as a continuous blue line, and the upper and lower limits are displayed using dashed lines. The Macquart relation is presented as a reference using a red line, and the relationship derived by Cui et al. (2022) is shown in dark red.
Interestingly, Figure 1 demonstrates that our constraint for the slope in model A is quite close to the value from the Macquart relation, despite the latter being proposed with a third of the data used in this document.
The following two models assume that the IGM term is subdominant in Eq. 1 in low dispersion measure detections, with a contribution of around 30% of the total DM (Zhu and Feng, 2021).
Model B:
Inspired by works from Pol et al. (2019) and Zhu and Feng (2021) that derive a log-parabolic function that relates DMIGM and z from numerical codes (MICE onion universe simulation and RAMSES, respectively), we explore the following assumption: 0.3 DM ∼ DMIGM at low redshifts, with the latter term described by the following function:
The parameters that best adjust to the observed data for this function are a = 0.06, b = 0.52, and c = 2.46. The resulting function and comparison with the data are presented in Figure 2.
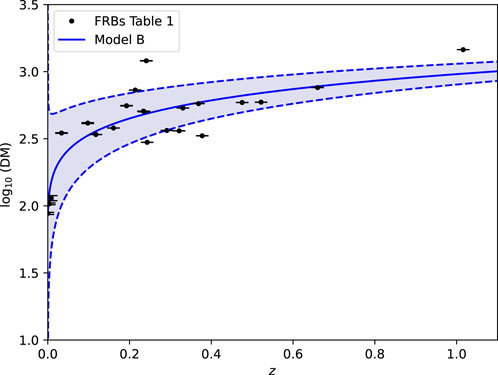
Figure 2. DM–redshift relationship for FRBs with known galaxy hosts in the log parabolic model (see Eq. 3). As shown before, the FRBs are presented as black dots, model B predictions are shown as a solid blue line, and the upper and lower limits are displayed using dashed lines.
Model C:
Work from Zhang et al. (2020) and a recent adaptation to it with more FRBs by Wang and Yu (2023) proposed a power-law function for DMhost. As mentioned above, DMhost is not the only component of the observed DM, but it is the dominant term for nearby FRBs. We explore the first approximation that DM ∼ DMhost to build the DM–z relationship. We stress that more realistic modeling must consider an estimate for DMIGM.
It is worth mentioning that Wang and Yu (2023) modeled and reported the contribution of DMMW for 22 FRBs depending on the orientation and distance of the galaxy with respect to ours. Assuming the mean of the values reported in Wang and Yu (2023), we have set the value of DMMW = 40.68 pc/cm3 in Eq. 4. The best-fit parameters for the power-law model are a = 155.80 pc/cm3 and α = 4.58. The result for this model with the best parameters is displayed in Figure 3.
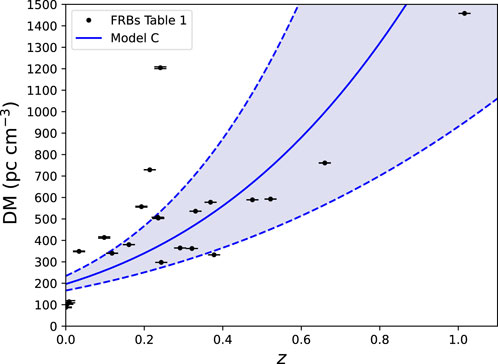
Figure 3. DM–redshift relationship for FRBs with known galaxy hosts in the power-law model or model C, as described in Eq. 4. As shown before, the confirmed FRBs are presented as black dots, the prediction from model C is shown as a continuous blue line, and the upper and lower limits are displayed using dashed lines.
Model D:
In order to capture the fluctuations in the observed DM reported by Xu et al. (2021), we formulate the last model. We aim to build a function in spherical coordinates for the dispersion measure, DM = DM(z, θ, ϕ), using the pipeline below.
(i) Transforming the coordinates reported in Table 1 (z, RA, and DEC) to spherical coordinates (z, θ, and ϕ), such that ϕ = 90° − DEC.
(ii) Under the assumption that RA, DEC, and z are variables of the scalar field DM, we create a function that interpolates DM = DM (z, θ, and ϕ). The interpolation uses the method radial basis function (RBF), which best suits the distribution of our dataset with 22 points. After testing different bases offered by SciPy, we implemented the basis cubic in the RBF.
(iii) With the interpolation mentioned above, we calculated DM from z and the angular coordinates. Nevertheless, our primary objective is to determine z for a given DM, which we will call hereafter zinter.
(iv) We define an error function Err
(v) We repeat steps (i) to (iv) to calculate the upper and lower values of the redshift errors Δzinter = Δzinter (DM ± fΔDM, θ, and ϕ). We introduce the factor f to have a non-negligible error in z, taking into account that the interpolation produces an extremely small numerical error. The factor f is the second free parameter of this model.
The free parameters that warrant the minimum Err in the interpolator are f = 3 and zo = 0.15. The interpolated values of zD with their errors are reported in Table 2, along with predictions from models A–C.
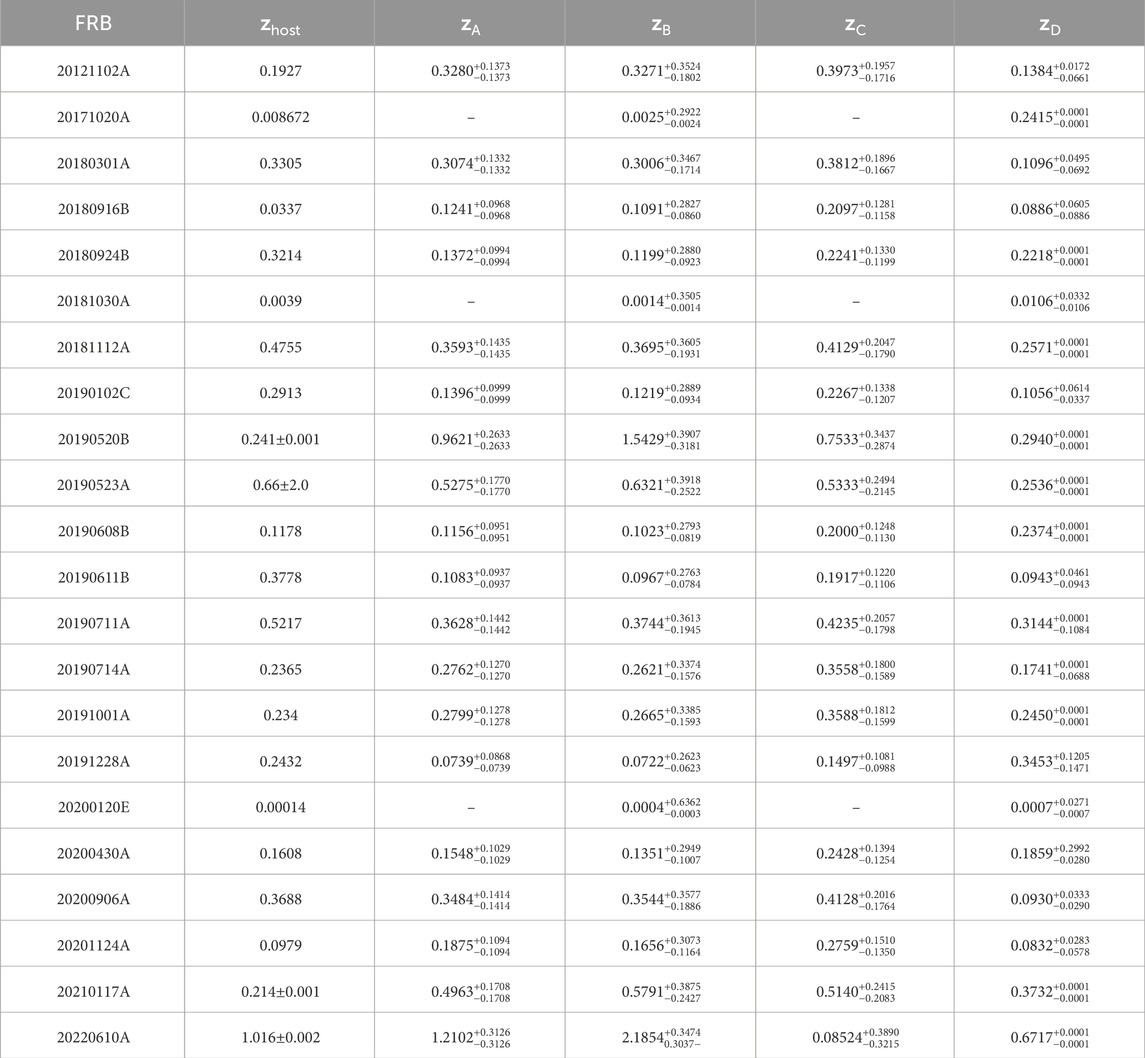
Table 2. Predictions of the FRB redshift given in the models. The first column shows the name of the FRB, the second column shows the redshift of the host galaxy, and the third to sixth columns show the predicted redshifts with models A, B, C, and D with their corresponding errors.
To measure the success rate of the models, we compute the median of the redshift difference for each model as follows:
where zpred; i is the predicted redshift for each model. Additionally, we calculate the likelihood
The AIC is defined by the expression:
where K is the number of parameters of each model and
The BIC is defined as
The parameter n represents the number of observations (in our case, n = 22).
In order to rank the proposed models, we demand three conditions that need to be fulfilled simultaneously: i) the lowest median of the redshift difference
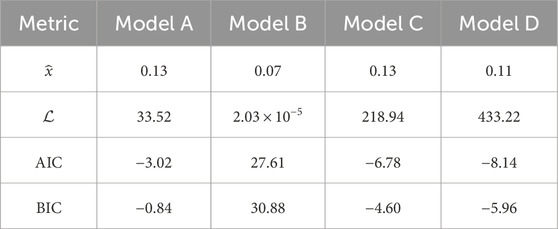
Table 3. Statistical metrics implemented to quantify the success rate of each model’s predictions.
Revisiting the three criteria demanded to rank the performance of the models, we found that model D (i.e., the interpolation) has the best success rate at fitting the observed data since it shows the largest likelihood while minimizing the AIC and BIC, in addition to offering the smallest median difference between the “true” and the predicted redshifts reported in Table 1. Models C (the power law) and A (the Macquart relation) closely follow the performance of model D, with similar results for the metrics applied. Conversely, model B has minimal likelihood and poor results for the Akaike and Bayesian information criteria. The latter is a consequence of a small likelihood and the largest set of free parameters.
We find some insightful pointers on the performance of the models based on the outcome from metrics (Thornton et al., 2013)-(8) and Tables 2, 3. First, all the methods proposed have some dispersion concerning the observed data. However, the interpolation and the power-law model are the ones that better fit zFRB compared with the log-parabolic models. It is worth noting that the predicted redshift differs significantly with respect to the true z for all models due to the small sample of known FRBs that we included to build the models. The predictions from all models will improve with more confirmed counterparts to the observed FRBs.
On the other hand, the linear and power-law models are susceptible to small values of DM, and they cannot predict physical redshifts in a few instances (represented by – in Table 2). These cases are either a NAN or a negative redshift.
Moreover, the model with the worst performance in predicting the redshift for these FRBs is the log-parabolic function. There are very large residuals for some zFRB and zB, primarily due to the assumption that led us to propose model B: that the observed DM could be described as a fraction of DMIGM. The latter hypothesis breaks down for farther FRBs, in which DMIGM plays a more dominant role in the total dispersion measure when the cosmic distance significantly grows.
Furthermore, we highlight that all models fail to predict data points with large DM and small z, particularly for FRB20190520B (DM = 1204.7 pc/cm3). The log-parabolic model also fails catastrophically to predict the latest data point included in this study, which was reported recently by Gordon et al. (2023) and Ryder et al. (2023). Nonetheless, models A, C, and D did an excellent job anticipating this detection with a very high z value.
Additionally, we remark on one strength of model D compared with models A, B, and C: this is the only one that can predict significant differences in the dispersion measure from similar redshifts. Focus on the following pairs of FRBs: 20180301A–20180924B (zhost;i ∼ 0.32–0.33), 20190608B–20220914A (zhost;i ∼ 0.11), and in particular in 20191228A–20190520B (zhost;i ∼ 0.24); these pairs have quite different reported DMs, but their host redshifts are quite close, despite small changes in the decimal figures of the redshift. Unlike the first three models presented in this document, model D captures large fluctuations in the dispersion measure, a clear indication that we need to include angular anisotropies (among other FRB properties) to reconstruct the DM. Notably, the last pair mentioned above have a factor 4 difference in their dispersion measures. Is this massive ratio due to angular fluctuations in the FRB position? or are there other properties responsible for it? For instance, 20190520B is a repeater but 20191228A is not. Is this latter feature relevant to modeling the dispersion measure and, therefore, predicting the true redshift?
We also report the predicted redshifts of the FRBs 20220509G and 20220914A in Table 4. These two FRBs are hosted by galaxy clusters instead of isolated galaxies. We remind the reader that we take out these two data points from the sample of FRBs to train the models since their physical properties might differ from those of FRBs hosted in galaxies. Except for model D which has very narrow error bars, models A–C predict the true redshifts of these systems within the range defined by the errors.
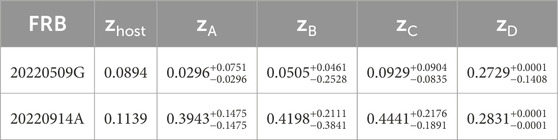
Table 4. Redshifts predicted by the four models for FRBs hosted by galaxy clusters.
Finally, we highlight that improving the theoretical models by adding physical complexity to them is critical to recovering the variety of the transients. We will update our predictions and best-fit parameters with incoming data from newly confirmed FRB galaxy hosts.
3.2 Other properties of the galaxy hosts
Gordon et al. (2023) claimed that there is a strong connection between FRBs and recent episodes of star formation in galaxies. Thus, this could be a good indicator for galaxies hosting FRBs. We explore this correlation for our current subsample of known FRBs in Figure 4.
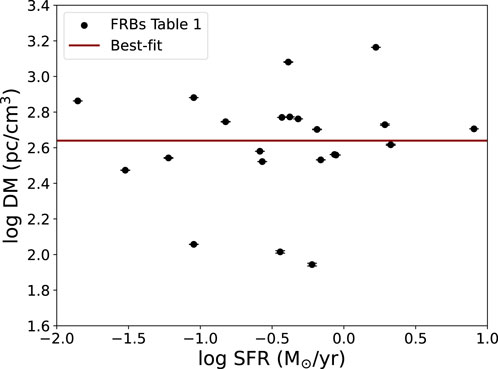
Figure 4. DM vs. SFR from the FRB and their galaxy hosts. The black data points are the 22 FRBs with confirmed hosts, and the dark red line is the functional form, as described in Eq. 9.
The best-fit parameters for the DM–SFR relationship are a = 10(2.639±0.080) and β = 0.015 ± 0.106. There is a weak correlation in the data, reflected in the best-fit line in Figure 4, mostly caused by the very few observational data points reported to date. Nonetheless, it is worth pursuing this proxy to characterize the environments where FRBs occur.
On the other hand, we examine a possible association between the stellar mass of the putative galaxies and the observed DM in Figure 5.
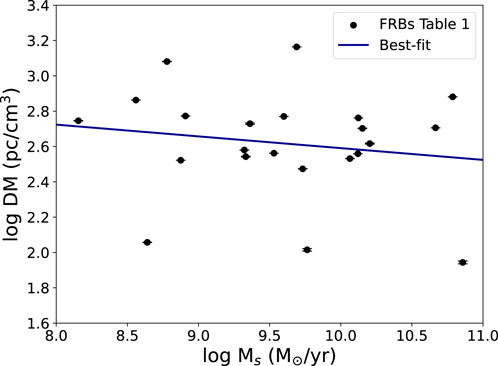
Figure 5. DM vs. stellar mass (Ms) from the FRB and their galaxy hosts. The black data points are the 22 FRBs with a confirmed host, and the blue line is the functional fit, as proposed in Eq. 10.
The best values of the function (Niino, 2020) are c = 10(3.256±0.868) and γ = −0.067 ± 0.090. Although there is no clear reason why these two variables should be linked at this point, further investigation is needed to understand a weak negative correlation between the dispersion measure exhibited by the transient and stellar mass of the host galaxy.
4 Conclusion
We have presented the most updated catalog of FRBs with confirmed galaxy hosts and their properties, along with four models that relate the DM and redshift z. An accurate prediction of the redshift of the transient is crucial since it allows us to improve the search of the host galaxy and study the environment where these signals are emitted.
All the models are physically motivated: the linear model (A) is inspired by the Macquart relation. It assumes that DM should be linear with z since the dispersion measure is a proxy for the distance between the FRB and observer, and at least at low redshift, z and the cosmological distances follow a proportional relationship. Model B is formulated under the assumption that at low redshift, the dispersion measure due to the IGM, DMIGM, is about a third of the observed DM (established from theoretical models); thus, we can use the functional form derived from hydrodynamical simulations to describe the IGM and its effect on the incoming FRB signal. Conversely, the third model adopts an observed DM approximate to the DMhost. On the other hand, model D explores an interpolation for the DM that considers dependence on zhost and the angular position where the FRB has been detected. We examine this possibility guided by findings from Xu et al. (2021) that reported large DM fluctuations in the sky at very similar redshifts.
We implement the likelihood, the median difference of the redshifts, and the Akaike and Bayesian information criteria to measure the success rate of each model at predicting zhost and find that the most accurate method is model D, followed by the power-law and linear models. Instead, the log-parabolic model performs very poorly at predicting the true redshift, primarily due to the underlying assumption that led us to formulate it. We conclude that a realistic description of the dispersion measure should consider the cosmic term (due to the IGM), the host galaxy DM, and the contribution from the Milky Way. Nonetheless, model B has good predicting power for redshifts of nearby FRBs (i.e., at the low redshift and low-DM regimes). We stress that all models will increase their success rate with more z from FRBs with confirmed putative host galaxies.
Finally, we investigate possible correlations between the observed DM and other known properties of the host galaxies: the SFR and their reported mass (Ms). We found a very weak correlation between the variables in the cases analyzed in this work. However, observational evidence indicates that detecting FRBs would be preferred in active environments such as galaxies with high star formation. Therefore, there is room for improvement in this aspect, with an increasing number of FRBs detected with current and future telescopes devoted to understanding these transients.
Data availability statement
The original contributions presented in the study are included in the article/supplementary material; further inquiries can be directed to the corresponding author.
Author contributions
EP-M: writing–original draft and writing–review and editing. LG: writing–original draft and writing–review and editing.
Funding
The author(s) declare that financial support was received for the research, authorship, and/or publication of this article. This work was supported by Fundación Universitaria Los Libertadores programme “Eleventh Annual Internal Call for Research and Artistic and Cultural Creation Projects 2023,” project “Análogos cosmológicos de la ecuación de difusión” (grant number: ING-09-23).
Acknowledgments
The authors would like to thank Universidad ECCI and Fundación Universitaria Los Libertadores for granting them the resources to develop this project. They are also grateful to the reviewers for their valuable comments, which helped improve the quality of our manuscript. This research made use of Matplotlib (Hunter, 2007), SciPy (Virtanen et al., 2020), NumPy (Harris et al., 2020), and pandas (McKinney, 2010).
Conflict of interest
The authors declare that the research was conducted in the absence of any commercial or financial relationships that could be construed as a potential conflict of interest.
Publisher’s note
All claims expressed in this article are solely those of the authors and do not necessarily represent those of their affiliated organizations, or those of the publisher, the editors, and the reviewers. Any product that may be evaluated in this article, or claim that may be made by its manufacturer, is not guaranteed or endorsed by the publisher.
References
Baptista, J., Prochaska, J. X., Mannings, A. G., James, C. W., Shannon, R. M., Ryder, S. D., et al. (2023). Measuring the variance of the Macquart relation in z-DM modeling. arXiv e-prints, 07022. arXiv:2305. doi:10.48550/arXiv.2305.07022
Batten, A. J., Duffy, A. R., Wijers, N. A., Gupta, V., Flynn, C., Schaye, J., et al. (2021). The cosmic dispersion measure in the EAGLE simulations. Mon. Not. R. Astron. Soc. 505, 5356–5369. doi:10.1093/mnras/stab1528
Bhandari, S., Gordon, A. C., Scott, D. R., Marnoch, L., Sridhar, N., Kumar, P., et al. (2023). A nonrepeating fast radio burst in a dwarf host galaxy. Astrophys. J. 948, 67. doi:10.3847/1538-4357/acc178
Bhandari, S., Heintz, K. E., Aggarwal, K., Marnoch, L., Day, C. K., Sydnor, J., et al. (2022). Characterizing the fast radio burst host galaxy population and its connection to transients in the local and extragalactic Universe. Astron. J. 163, 69. doi:10.3847/1538-3881/ac3aec
Bhardwaj, M., Kirichenko, A. Y., Michilli, D., Mayya, Y. D., Kaspi, V. M., Gaensler, B. M., et al. (2021). A local Universe host for the repeating fast radio burst FRB 20181030A. Astrophys. J. Lett. 919, L24. doi:10.3847/2041-8213/ac223b
Bhattacharya, M., Kumar, P., and Linder, E. V. (2021). Fast radio burst dispersion measure distribution as a probe of helium reionization. Phys. Rev. D. 103, 103526. doi:10.1103/PhysRevD.103.103526
Bochenek, C. D., Ravi, V., Belov, K. V., Hallinan, G., Kocz, J., Kulkarni, S. R., et al. (2020) A fast radio burst associated with a Galactic magnetar. , 587 59–62. doi:10.1038/s41586-020-2872-x
Collaboration, CHIME/F. R. B., Amiri, M., Andersen, B. C., Bandura, K., Berger, S., Bhardwaj, M., et al. (2021). The first CHIME/FRB fast radio burst catalog. Astrophys. J. Suppl. Ser. 257, 59. doi:10.3847/1538-4365/ac33ab
Collaboration, T. C., Andersen, B. C., Bandura, K., Bhardwaj, M., Boyle, P. J., Brar, C., et al. (2023). Chime/frb discovery of 25 repeating fast radio burst sources. Astrophys. J. 947, 83. doi:10.3847/1538-4357/acc6c1
Connor, L., Ravi, V., Catha, M., Chen, G., Faber, J. T., Lamb, J. W., et al. (2023). Deep synoptic array science: two fast radio burst sources in massive galaxy clusters. Astrophys. J. Lett. 949, L26. doi:10.3847/2041-8213/acd3ea
Cui, X. H., Zhang, C. M., Li, D., Zhang, J. W., Peng, B., Zhu, W. W., et al. (2022). Luminosity distribution of fast radio bursts from CHIME/FRB Catalog 1 by means of the updated Macquart relation. Astrophys. Space Sci. 367, 66. doi:10.1007/s10509-022-04093-y
Gordon, A. C., Fong, W. F., Simha, S., Dong, Y., Kilpatrick, C. D., Deller, A. T., et al. (2023). A fast radio burst in a compact galaxy group at z1. arXiv e-prints, 10815. arXiv:2311. doi:10.48550/arXiv.2311.10815
Harris, C. R., Millman, K. J., van der Walt, S. J., Gommers, R., Virtanen, P., Cournapeau, D., et al. (2020). Array programming with NumPy. Nature 585, 357–362. doi:10.1038/s41586-020-2649-2
Heintz, K. E., Prochaska, J. X., Simha, S., Platts, E., Fong, W. F., Tejos, N., et al. (2020). Host galaxy properties and offset distributions of fast radio bursts: implications for their progenitors. Astrophys. J. 903, 152. doi:10.3847/1538-4357/abb6fb
Hunter, J. D. (2007). Matplotlib: a 2d graphics environment. Comput. Sci. Eng. 9, 90–95. doi:10.1109/MCSE.2007.55
Jaroszyński, M. (2020). FRBs: the dispersion measure of host. Galaxies 70, 87–100. doi:10.32023/0001-5237/70.2.1
Keane, E. F., Stappers, B. W., Kramer, M., and Lyne, A. G. On the origin of a highly dispersed coherent radio burst. , 425 (2012) L71–L75. doi:10.1111/j.1745-3933.2012.01306.x
Lee-Waddell, K., James, C. W., Ryder, S. D., Mahony, E. K., Bahramian, A., Koribalski, B. S., et al. (2023). The host galaxy of FRB 20171020A revisited. Publ. Astron. Soc. Aust. 40, e029. doi:10.1017/pasa.2023.27
Lorimer, D. R., Bailes, M., McLaughlin, M. A., Narkevic, D. J., and Crawford, F. (2007). A bright millisecond radio burst of extragalactic origin. Science 318, 777–780. doi:10.1126/science.1147532
Macquart, J. P., Prochaska, J. X., McQuinn, M., Bannister, K. W., Bhandari, S., Day, C. K., et al. (2020)A census of baryons in the Universe from localized fast radio bursts. , 581 391–395. doi:10.1038/s41586-020-2300-2
McKinney, W. (2010). Data structures for statistical computing in python. Proc. 9th Python Sci. Conf. (Austin, TX) 445, 51–56. doi:10.25080/majora-92bf1922-00a
Medlock, I., and Cen, R. (2021). Dispersion measure distributions of fast radio bursts due to the intergalactic medium. Mon. Not. R. Astron. Soc. 502, 3664–3669. doi:10.1093/mnras/stab288
Mo, J. F., Zhu, W., Wang, Y., Tang, L., and Feng, L. L. (2023). The dispersion measure of Fast Radio Bursts host galaxies: estimation from cosmological simulations. Mon. Not. R. Astron. Soc. 518, 539–561. doi:10.1093/mnras/stac3104
Niino, Y. (2020). Dispersion measure components within host galaxies of Fast Radio Bursts: observational constraints from statistical properties of FRBs. arXiv e-prints, 12891. arXiv:2005. doi:10.48550/arXiv.2005.12891
Nimmo, K., Hessels, J. W. T., Snelders, M. P., Karuppusamy, R., Hewitt, D. M., Kirsten, F., et al. (2023). A burst storm from the repeating FRB 20200120E in an M81 globular cluster. Mon. Not. R. Astron. Soc. 520, 2281–2305. doi:10.1093/mnras/stad269
Niu, C. H., Aggarwal, K., Li, D., Zhang, X., Chatterjee, S., Tsai, C. W., et al. (2022)A repeating fast radio burst associated with a persistent radio source. , 606 873–877. doi:10.1038/s41586-022-04755-5
Palaniswamy, D., Li, Y., and Zhang, B. (2018). Are there multiple populations of fast radio bursts? Astrophys. J. Lett. 854, L12. doi:10.3847/2041-8213/aaaa63
Petroff, E., Barr, E. D., Jameson, A., Keane, E. F., Bailes, M., Kramer, M., et al. (2016). FRBCAT: the fast radio burst catalogue. Publ. Astron. Soc. Aust. 33, e045. doi:10.1017/pasa.2016.35
Pol, N., Lam, M. T., McLaughlin, M. A., Lazio, T. J. W., and Cordes, J. M. (2019). Estimates of fast radio burst dispersion measures from cosmological simulations. Astrophys. J. 886, 135. doi:10.3847/1538-4357/ab4c2f
Ryder, S. D., Bannister, K. W., Bhandari, S., Deller, A. T., Ekers, R. D., Glowacki, M., et al. (2023). A luminous fast radio burst that probes the Universe at redshift 1. Science 382, 294–299. doi:10.1126/science.adf2678
Thornton, D., Stappers, B., Bailes, M., Barsdell, B., Bates, S., Bhat, N. D. R., et al. (2013). A population of fast radio bursts at cosmological distances. Science 341, 53–56. doi:10.1126/science.1236789
Virtanen, P., Gommers, R., Oliphant, T. E., Haberland, M., Reddy, T., Cournapeau, D., et al. (2020). SciPy 1.0: fundamental algorithms for scientific computing in Python. Nat. Methods 17, 261–272. doi:10.1038/s41592-019-0686-2
Wang, F. Y., Zhang, G. Q., Dai, Z. G., and Cheng, K. S. (2022). Repeating fast radio burst 20201124A originates from a magnetar/Be star binary. Nat. Commun. 13, 4382. doi:10.1038/s41467-022-31923-y
Wang, X., and Yu, Y. Z. (2023). Host galaxy dispersion measure of fast radio burst. arXiv e-prints, 07751. arXiv:2309. doi:10.48550/arXiv.2309.07751
Xu, S., Weinberg, D. H., and Zhang, B. (2021). Statistical measurements of dispersion measure fluctuations in fast radio bursts. Astrophys. J. Lett. 922, L31. doi:10.3847/2041-8213/ac399c
Yaron, O., Ofek, E., Gal-Yam, A., and Sass, A. (2020). Fast Radio Bursts (FRBs) now reported to and distributed via the TNS. Transient Name Serv. AstroNote 70, 1.
Zhang, G. Q., Yu, H., He, J. H., and Wang, F. Y. (2020). Dispersion measures of fast radio burst host galaxies derived from IllustrisTNG simulation. Astrophys. J. 900, 170. doi:10.3847/1538-4357/abaa4a
Zhang, Z. J., Yan, K., Li, C. M., Zhang, G. Q., and Wang, F. Y. (2021). Intergalactic medium dispersion measures of fast radio bursts estimated from IllustrisTNG simulation and their cosmological applications. Applications 906, 49. doi:10.3847/1538-4357/abceb9
Keywords: fast radio burst, galaxy properties, cosmology, transients, statistical methods
Citation: Piratova-Moreno EF and García LÁ (2024) Modeling the dispersion measure—redshift relation for fast radio bursts. Front. Astron. Space Sci. 11:1371787. doi: 10.3389/fspas.2024.1371787
Received: 17 January 2024; Accepted: 12 April 2024;
Published: 09 May 2024.
Edited by:
Milan S. Dimitrijevic, Astronomical Observatory, SerbiaReviewed by:
Reinaldo Roberto Rosa, National Institute of Space Research (INPE), BrazilCarlos Frajuca, Federal University of Rio Grande, Brazil
Copyright © 2024 Piratova-Moreno and García. This is an open-access article distributed under the terms of the Creative Commons Attribution License (CC BY). The use, distribution or reproduction in other forums is permitted, provided the original author(s) and the copyright owner(s) are credited and that the original publication in this journal is cited, in accordance with accepted academic practice. No use, distribution or reproduction is permitted which does not comply with these terms.
*Correspondence: Eduard Fernando Piratova-Moreno, ZWZwaXJhdG92YW1AbGliZXJ0YWRvcmVzLmVkdS5jbw==