- 1Department of Engineering Physics, Air Force Institute of Technology, WPAFB, OH, United States
- 2Big Bear Solar Observatory, New Jersey Institute of Technology, Big Bear, CA, United States
- 3Heliophysics and Planetary Science Branch, Marshall Space Flight Center, Huntsville, AL, United States
- 4Department of Mathematics and Statistics, Air Force Institute of Technology, WPAFB, OH, United States
Using non-linear force free field (NLFFF) extrapolation, 3D magnetic fields were modeled from the 12-min cadence Solar Dynamics Observatory Helioseismic and Magnetic Imager (HMI) photospheric vector magnetograms, spanning a time period of 1 hour before through 1 hour after the start of 18 X-class and 12 M-class solar flares. Several magnetic field parameters were calculated from the modeled fields directly, as well as from the power spectrum of surface maps generated by summing the fields along the vertical axis, for two different regions: areas with photospheric |Bz|≥ 300 G (active region—AR) and areas above the photosphere with the magnitude of the non-potential field (BNP) greater than three standard deviations above
1 Introduction
Solar flares are intense bursts of radiation that occur within the solar atmosphere, typically seen as hot coronal loops and bright chromospheric ribbons. Throughout the duration of these explosive events (ranging from minutes to hours), 1022 to 1025 J of energy is released from the highly complex magnetic fields over active regions (ARs) on the Sun’s surface. Stronger flares (M- and X-class), along with the often accompanied/associated coronal mass ejections (CMEs) and solar energetic particle (SEP) events, can have major technological impacts on both the near-Earth space environment and on Earth, as well as biological impacts on astronauts and high-altitude flying aircrews (Davies, 1990; Eastwood et al., 2017). Considerable effort has been and continues to be undertaken toward solar flare research and flare forecasting to help mitigate the impacts of these events. However, flares remain a challenge to accurately predict due to both a limited understanding of the underlying physical processes, in particular, the triggering mechanism of magnetic reconnection, and limited data.
Historically, most of the effort in solar flare research and flare forecasting has been focused on analyzing the photospheric magnetic field measurements, considering that full vector-field component data are only available for the photosphere. Many research workers have studied the correlations between different photospheric magnetic field parameters and flare characteristics, as well as the evolution of those parameters during solar eruptions (e.g., Leka and Barnes, 2003; 2007; Mason and Hoeksema, 2010; Wang et al., 2012; Kazachenko et al., 2017; 2022; Whitney Aegerter et al., 2020). Strong relationships have been found, for example, between the Geostationary Operational Environmental Satellites (GOES) measured peak X-ray flux and the flare ribbon reconnection flux (Kazachenko et al., 2017); however, the relationships typically involve post-eruption data and therefore are not directly applicable for flare forecasting. Furthermore, signatures of solar flare occurrence that have been found within photospheric magnetic field data, often in relation to field helicity, have yet to be shown to consistently predict when an AR will flare. Flare forecasting methods that utilize photospheric magnetic field data in combination with machine learning (e.g., Falconer et al., 2011; Bobra and Couvidat, 2015; Liu et al., 2017; Leka et al., 2018) have shown little improvement in forecasting capability over climatological forecasts. Leka et al. (2019) found that none of the 19 operational flare forecasting methods tested during a forecasting workshop performed “exceptionally well” across all performance metrics.
A major limitation is that vital aspects of the solar magnetic field that contribute to the flaring process are underestimated when parameters are calculated from the 2D imprint of the 3D field (Gupta et al., 2021). The standard model of solar eruptions (flares and CMEs) involves the accumulation of free energy within the solar magnetic field (from the photosphere through the lower corona), which is then impulsively released through a rapid reconfiguration of the field triggered by magnetic reconnection that destabilizes the field to a critical point of instability (Priest and Forbes, 2002; Shibata and Magara, 2011). Given that the buildup and release of energy occur through the lower corona, it is possible that parameters calculated from the solar magnetic field through the lower corona would provide more information on flare productivity and the nature of the events than those calculated from the photospheric field alone. Whereas regular measurements of the photospheric magnetic field have been available since the 1960s/1970s (Howard, 1967; Livingston et al., 1976; Svalgaard et al., 1978) and those of the chromospheric field since the 1980s (Jones, 1985), measurements of the coronal field remain a challenge to be obtained through traditional spectro-polarimetric methods. Measurements of the coronal field strength have been attempted using techniques such as coronal seismology (e.g., Roberts et al., 1984; Nakariakov and Ofman, 2001), radio emissions (e.g., Chen et al., 2020; Fleishman et al., 2020), and Stokes V circular polarization measurements from spectral lines (e.g., Lin et al., 2000; Kuridze et al., 2019). However, these methods provide only intermittent/discontinuous data.
Due to the lack of routine direct measurements for the coronal magnetic field, the full 3D solar magnetic field is often studied through numerical modeling. The four main types of models are the magnetohydrodynamics (MHD) model, the magnetohydrostatic (MHS) model, the force-free model, and the potential-field source-surface (PFSS) model (Wiegelmann et al., 2017). During the past several decades, several different Non-Linear Force-Free Field (NLFFF) models that use the observed photospheric vector magnetograms as an input have been developed, as discussed in the review by Wiegelmann and Sakurai (2021). Although NLFFF models have major limitations from the assumptions of static equilibrium and Lorentz force balance, they have been used in a number of studies to extrapolate and investigate the structure and evolution of the solar magnetic field through the corona, particularly over ARs during solar eruptions (e.g., Inoue et al., 2011; Sun et al., 2012; Thalmann et al., 2013; Jing et al., 2018; Thalmann et al., 2020; Yurchyshyn et al., 2022; Garland et al., 2023). While NLFFF models are generally simpler, neglecting additional physical effects, than the more computationally demanding MHS and MHD models that have been developed, Yeates et al. (2018) found that out of seven different non-potential magnetic models tested during a 2015 eclipse, the static, NLFFF extrapolation codes performed better for modeling ARs, whereas the time-dependent codes modeled quiet solar features (such as filaments) better. A possible reason for the difference includes the input data of the models; the static models used synoptic vector magnetograms, whereas the time-dependent models used the line-of-sight photospheric field and additional observations (e.g., filaments). The conclusion from the workshop was that a hybrid model, one that applied static extrapolation with additional energization informed by evolution models, would be the best approach for modeling ARs. In recent years, time-dependent models that use continuously observed magnetograms as the input have been developed to reproduce the dynamics of the corona; a review of such data-driven models can be found in the study by Jiang et al. (2022).
Studies that have utilized NLFFF extrapolation and other modeling techniques to investigate the structure and evolution of the solar magnetic field through the corona over ARs during solar eruptions (e.g., Inoue et al., 2011; Sun et al., 2012; Thalmann et al., 2013; Jing et al., 2018; Thalmann et al., 2020; Yurchyshyn et al., 2022; Garland et al., 2023) have shown the potential that parameters calculated from the modeled 3D fields possess in regards to predicting the likelihood, location, and timing of solar flares. It must be recognized that modeling introduces additional possible errors due to the inaccuracy of the extrapolation processes compared to using observed photospheric data alone. Still, promising results from modeled data have been demonstrated. For example, Kusano et al. (2020) developed a physics-based method based on the theory of double-arc instability (DAI) and utilizing NLFFF extrapolation, called the κ-scheme, which predicted most large, imminent flares within a dataset of ∼ 200 ARs. The κ-scheme measures the critical size (rc) of the region of trigger-reconnection within a flaring AR through calculations of the magnetic twist flux density (τ) near the PIL and the flux crossing over the strongest sheared field line rooted in the reconnection region within areas with photospheric BNP > 1000 G (Kusano et al., 2020). An analysis of the X-class flares from 2008 to 2019 showed that the small-scale structure of τ near the PIL can determine when and where solar flares may occur and how large they can be. As another example, Korsós et al. (2020) applied the weighted horizontal gradient of magnetic field (WGM) flare prediction method (Korsós et al., 2015) to 3D potential field and NLFFF-extrapolated magnetic fields of 13 flaring ARs. Potential lead-time improvement of 2–8 h for flare onset prediction was found by applying the (WGM) method between 1,000 and 1,800 km above the solar surface, that is, within the chromosphere.
The purpose of this study is to continue the effort in modeling and investigating the 3D solar magnetic field over ARs during solar flare eruptions and perform a statistical analysis that utilizes magnetic field parameters calculated from modeled 3D magnetic field data. The analysis of a particular case study (Garland et al., 2023) was adjusted and extended to a larger dataset of strong/extreme (M- and X-class) solar flare events. Following the modeling and parameter calculation for each event, a statistical analysis similar to that of Mason and Hoeksema (2010) and Kazachenko et al. (2022) was performed. Specifically, a superposed epoch analysis was applied to the temporal evolution of the magnetic field parameters during a time interval of 1 hour before through 1 hour after the flare occurrence. Additionally, the correlations between the magnetic field parameters and different flare characteristics were examined. Through the analysis, the evolution of the 3D solar magnetic field over flaring ARs leading up to and following an eruptive event was explored, with the intent of discerning any consistent pre-eruptive signatures of solar flare occurrence or strong relationships between the state of the 3D magnetic field leading up to a flare and the different flare properties.
The ultimate vision for this study is to benefit current flare forecasting efforts, such as the Flare Likelihood and Region Eruption Forecasting (FLARECAST) project (Georgoulis et al., 2021). The FLARECAST project is an “advanced solar flare prediction system based on automatically extracted physical properties of solar active regions coupled with state-of-the-art machine learning solar flare prediction methods” (Georgoulis et al., 2021). A vast majority of the 209 predictors included as part of the FLARECAST algorithm are calculated from the observed photospheric magnetograms; the remaining include information from the National Oceanic and Atmospheric Administration (NOAA) Space Weather Prediction Center (SWPC) catalogs and photospheric intensity images. As mentioned previously, it has been shown that parameters calculated from the modeled 3D solar magnetic fields (through the corona) possess potential predictive capability. Inclusion of such modeling techniques and parameters found to have strong relationships with flaring activity in the FLARECAST system and others like it—in conjunction with the observed photospheric data/parameters already calculated—could possibly improve solar flare prediction.
The remainder of this paper is outlined as follows: Section 2 presents the dataset used for the analysis. Section 3 details the methodology for extrapolating the 3D solar magnetic field and calculating the field parameters. Section 4 discusses the results of the statistical analysis, and Section 5 summarizes the analysis and discusses future work.
2 Dataset
The dataset used in this study consists of 30 solar flare events (18 X-class and 12 M-class) from Solar Cycle 24 reported by SWPC and the 720-s (12-min) cadence HMI Active Region Patch (HARP) data from the Joint Science Operations Center (JSOC) during a 2-h window around each flare event. The solar flare event data include the flare start time, max time, end time, class/magnitude, integrated flux, and NOAA AR number. The HARP data include the date/time of observation, the HARP center longitude/latitude, HARP number, and associated NOAA AR number. HARPs are enduring, coherent magnetic structures whose size are on the scale of an AR that are identified and tracked using continuum intensity images and photospheric full-disk line-of-sight (LoS) magnetogram images produced on a 12-min cadence (Hoeksema et al., 2014; Joint Science Operations Center, 2023). Further details regarding the HMI instrument, observables, and vector field pipeline can be found in the study by Schou et al. (2012), Couvidat et al. (2016), and Hoeksema et al. (2014), respectively. The connection of the solar flare event and HARP data was established by associating the start time of the flare to the nearest HARP data time.
Figure 1 provides the distribution of the flare magnitudes for the 30 flares in the dataset, which clearly shows the mode magnitude of X1.0–X1.9. The center coordinates of the flaring AR (in Stonyhurst Lat/Lon) at the start time of each flare event are plotted in Figure 2. It is worth noting the commonly used ±45° longitude threshold, which was chosen to minimize solar limb/projection effects.
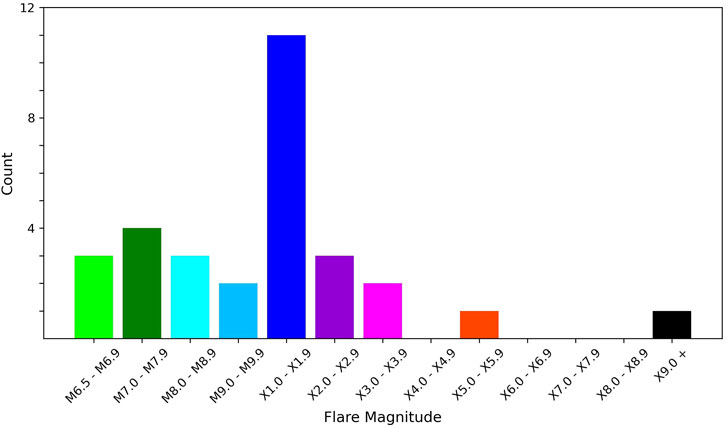
Figure 1. Histogram of flare magnitudes for the 30 SWPC-reported solar flare events included in the dataset.
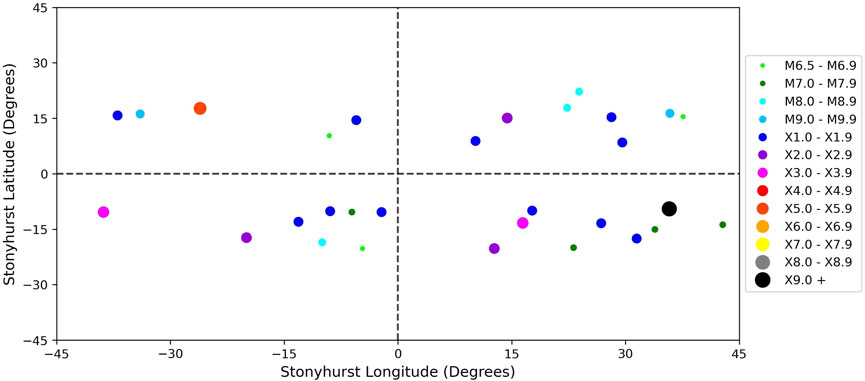
Figure 2. Center coordinates at the time of flaring of each AR associated with the 30 solar flare events in the dataset. The color and size of the location markers are based on the flare magnitude, as shown in the legend.
For each event in the dataset, the sunspot and magnetic classifications of the associated ARs at the time closest to flaring were retrieved from the SWPC Solar Region Summary (SRS) archive (available at ftp://ftp.swpc.noaa.gov/pub/warehouse/). Sunspot classification is based on the modified Zürich/McIntosh system (McIntosh, 1990), which continues to act as a foundation for solar flare forecasting today. The general form of the modified Zürich/McIntosh classification is Zpc, where Z is the modified Zürich class, p is the type of largest spot (describing the penumbra), and c is the degree of compactness in the interior group (McIntosh, 1990). The Mount Wilson classification system, put forward by Hale et al. (1919), provides a simple way to describe the magnetic properties and morphology of ARs. The distribution of the sunspot and magnetic classifications for the 30 solar flare events in the dataset is provided in Table 1. As seen in the table, 22 of the 30 flaring ARs have a Mount Wilson classification of βγδ. The top three modified Zürich/McIntosh sunspot classifications are (in order) Fkc, Ekc, and Dkc. The findings in Table 1 are consistent with those in other studies that have analyzed the statistics for the sunspot/magnetic classifications of flaring ARs (e.g., Smith and Howard, 1968; McIntosh, 1990; Jaeggli and Norton, 2016; Norsham et al., 2022).

Table 1. Distribution of modified Zürich/McIntosh sunspot and Mount Wilson magnetic classifications for the 30 flaring ARs in the dataset.
3 Methodology
3.1 3D solar magnetic field extrapolation
Following the same procedure as Garland et al. (2023) and Yurchyshyn et al. (2022), HMI magnetic field measurements were re-binned to 1 Mm pixel scale and transformed to a local Cartesian coordinate system using the same cylindrical equal area (CEA) projection used to produce the hmi.sharp_cea_720s series data (Bobra et al., 2014). The Cartesian boxes (or data cubes) in which the 3D magnetic fields would be extrapolated from the HMI magnetograms, which were the base maps of the boxes, were centered over the HARP center coordinates. In other words, the center of the base map was set to the HARP center coordinates. The box structures were quite large, spanning 400 by 200 by 200 pixels (re-binned) along the x-, y-, and z-axes (with z in the vertical) in order to accommodate as much of the field-line connectivity within the ARs and their surroundings as possible, which is a requirement for successful NLFFF application to real solar data (DeRosa et al., 2009). The specific size [400,200,200] accommodated the largest AR in the dataset. As described in the next section, specific portions of the field over the ARs within the data cubes were identified and used to calculate different parameters. Therefore, different data cube sizes for each flaring AR in the dataset did not need to be specified on a case-by-case basis, and a single size could be used to more easily automate parts of the modeling process so long as the field-line connectivity within the ARs was captured.
The HMI data retrieval, coordinate transformation, and NLFFF extrapolation were accomplished using the GX Simulator package (Nita et al., 2015; 2018; Nita et al., 2023). Following user specification of AR coordinates, observation time, and size/spatial resolution for the 3D data cube, the GX Simulator downloads the HMI magnetogram and remaps it to the bottom boundary of an empty data cube, and fills the empty cube with a potential field solution obtained from the normal component of the magnetic field at the lower boundary using a fast Fourier transform (FFT) method. In order to avoid unrealistic periodic, flux-balanced boundary conditions implied by the FFT solution at the lateral boundaries, more appropriate “open” boundaries are simulated by expanding the computational domain by 50% in each direction (Nita et al., 2023). The normal component of the field at the lower boundary is padded with a constant, non-zero value that is computed such that the unbalanced magnetic flux at the original lower boundary is compensated perfectly by the total signed flux from the added areas. The final potential field solution for the original domain is cut out from the expanded domain and used as the initial condition for the NLFFF extrapolation, which utilizes the weighted optimization code from Fleishman et al. (2017). During the extrapolation, the magnetic field at the top and side boundaries is frozen to be the potential field. Further details regarding the GX Simulator Automatic Model Production Pipeline (AMPP) can be found in the study by Nita et al. (2023).
For each of the 30 solar flare events in the dataset, the GX Simulator was used to generate [400,200,200] box structures containing the extrapolated magnetic field from the HMI magnetograms for a time period of 1 hour before through 1 hour after the flare start time. Given the 12-min cadence of the magnetograms, this meant that 11 3D solar magnetic field extrapolations were generated for each flare event. As mentioned previously, the box structures were centered over the HARP center coordinates, specifically, the coordinates from the HARP data time closest to the flare start time. The ±1 h window around each solar flare event was selected in order to specifically investigate the relative changes of the solar magnetic field shortly before and after eruption, when significant reconfiguration and energy release occur. Additionally, for the purposes of correlating the state of the field prior to the eruption and the different flare properties, this window of time limits the inclusion of data with an ongoing flare event happening ahead of the main flare being investigated. The ±1 h window also significantly limits the forecasting applicability compared to other studies that implement much longer preceding windows.
3.2 Data volumes
Similar to Garland et al. (2023), two regions were identified and used as masks to generate separate data volumes (i.e., specific portions of the total magnetic field within the box structures) from which the different magnetic field parameters would be calculated. The two regions were as follows:
1. Active region, AR
2. Non-potential region, NPR
The definition of the AR in regards to the data volumes was the exact same as that used by Garland et al. (2023). The AR was defined as the areas where the magnitude of the observed photospheric vertical magnetic field (|Bz|) ≥ 300 Gauss (G) was within a specified bounding box of the magnetogram (see Figure 3). The bounding box was constructed by the following steps:
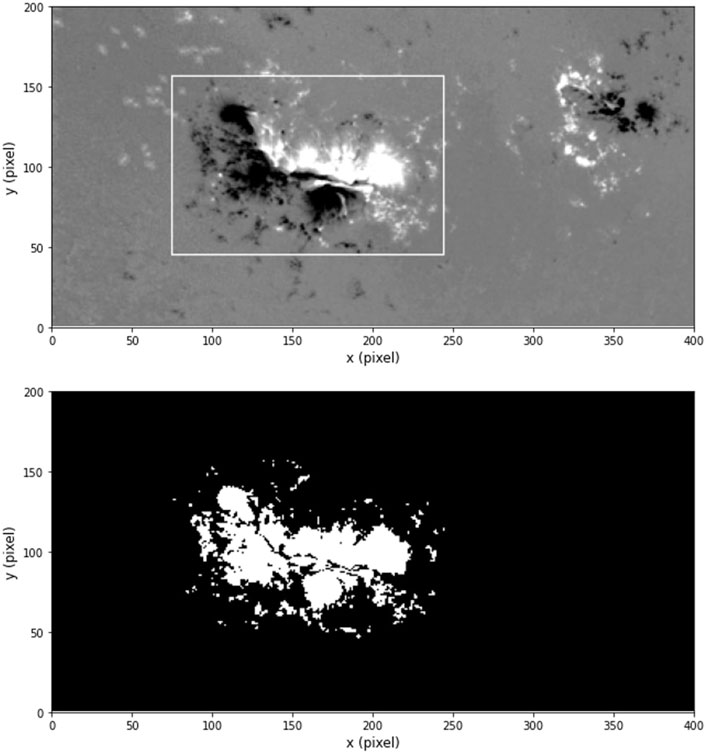
Figure 3. (Top) HMI measured magnetogram from 2012-03-07 00:00 UT with the bounding box around NOAA AR 11429, which produced an X5.4 flare at 00:02UT. (Bottom) 00:00 UT AR defined as the region with |Bz|≥ 300 G within the bounding box. From the study by Garland et al. (2023).
Step 1) Isolating pixels from the magnetogram with |Bz| ≥ 100 G.
Step 2) Running a smoothing mask over the filtered image.
Step 3) Identifying the bounded area that contains all pixels with
a pixel value ≥2 standard deviations above the mean.
For cases where multiple NOAA ARs are present within the FOV (such as in Figure 3), the bounding box is manually limited to the flaring AR. The threshold for |Bz| is slightly higher than the typical threshold range of 100–200 G seen in other studies to avoid noisy, weak field data (Bobra et al., 2014; Kazachenko et al., 2017; 2022). It should be mentioned that the threshold imposes the limitation that areas of highly twisted photospheric topology but weak flux, which provide information on the field line configuration emerging from the surface into the solar atmosphere (MacTaggart et al., 2021), are ignored. The implication of this is the assumption that all of the twisted topology critical to the flaring process are fully emerged at the time of flaring.
Using the above definition, the AR data volumes (or AR fields) were determined following the same method as Garland et al. (2023). Specifically, for each flare event, the AR at the HARP time closest to the flare start identified the photospheric footprints (or seed locations) from which the field lines within the [400,200,200] box were traced pointwise with a fourth order Runge–Kutta–Fehlberg algorithm, linearly interpolating between computational grid points, as part of the GX Simulator package (Nita et al., 2015; 2018; Nita et al., 2023). The coordinates of these field lines within the box specified the volume elements that would be used in the calculations of the magnetic field parameters; the collection of volume elements made up the data volume. The AR data volumes/fields were established (using the specified seed locations) for each of the 11 extrapolated magnetic fields throughout the 2-h window around each solar flare event.
The NPR replaced the overlap region (OR) from the study by Garland et al. (2023) and is defined as the region above the photosphere where the magnitude of the non-potential component of the magnetic field (|BNP|) ≥ three standard deviations above the mean |BNP| of the AR field, and either the unsigned twist number (|Tw|) ≥ one turn or the shear angle Ψ) ≥ 80°. The non-potential component of the NLFFF-extrapolated magnetic field was calculated as follows:
where B is the NLFFF solution and BPot is the potential field solution. Tw is the twist number of the individual field lines calculated using the code developed by Liu et al. (2016), and the threshold of one turn is considered appropriate to define a moderate twist (Patsourakos et al., 2020). The shear angle was calculated as follows:
The 80° threshold for Ψ is the higher of two commonly used thresholds for shear (e.g., Lu et al., 1993; Leka and Barnes, 2007).
The purpose of the NPR was the same as that of the OR (Garland et al., 2023), which was to isolate the portions of the magnetic field expected to be involved with the flaring process and predict the location of the eruption. The hypothesis is that the portion of the solar magnetic field that has the greatest degree of non-potentiality above the photosphere would be associated with the location where energy is built up/released, that is, the location of the eruption of a solar flare. The thresholds for Tw and Ψ further stipulate that the non-potentiality of the field is due in large part to either or both of those properties being high, which is generally expected for flaring. The consideration of Ψ for the NPR, which was not considered for the OR, was motivated by the fact that both sheared magnetic arcades (SMAs) and magnetic flux ropes (MFRs), or a hybrid of the two, are the pre-eruptive magnetic field configurations considered viable (Patsourakos et al., 2020).
The NPR is established from similar parameters that are involved in the κ-scheme proposed by Kusano et al. (2020). The κ-scheme assumes a DA magnetic loop structure and provides a more specific estimate of flaring location (rc < 1 Mm) along a PIL, whereas the NPR is a more generalized estimate (generally ∼ 102 Mm2 in size) not constrained to a PIL and assumes the presence of a MFR, SMA, or hybrid configuration within the magnetic field structure.
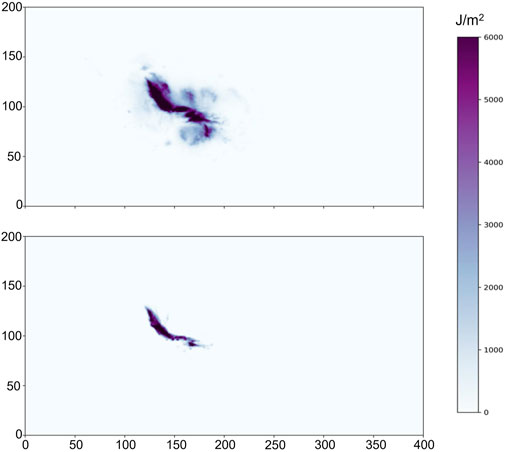
Figure 4 shows a comparison of the OR and NPR for the X5.4 solar flare event that was analyzed as a case study by Garland et al. (2023). Both the OR and NPR aligned well with the area of initial flare brightening for this event. However, the NPR is less noisy and more concentrated over the point of eruption, whereas the OR contains many scattered, less coherent portions on the peripherals of the large sunspots. Figure 5 provides an example of an event where the NPR aligned far better with the area of flare brightening than the OR did, which was the common result for several test events from the full dataset. For the majority of the 30 flare events in the dataset, the NPR aligned well with the area of initial flare brightening (Figure 6). The alignment was worse for events where the AR did not have a well-defined PIL compared to those that did, as well as for events where the flare occurred on the edge of the AR away from an inversion line versus directly over one. In these cases, the magnetic field configurations were generally more conducive to emerging-flux-type flares (Thalmann, 2010) as opposed to that of “two-ribbon” flares. Details regarding how the areas of initial flare brightening were identified for the flare events using the SDO atmospheric imaging assembly (Lemen et al., 2012) 171 Å, 211 Å, and 1600 Å imagery can be found in the study by Garland et al. (2023).

Figure 4. NPR (left) and OR (right) (purple shading) plotted over the 2012-03-07 00:08 UT grayscale AIA imagery, which highlights the flare brightening at the approximate start of the eruptive/flash phase of the X5.4 solar flare.

Figure 5. NPR (left) and OR (right) (purple shading) plotted over the 2013-11-08 04:26 UT grayscale AIA imagery, which highlights the flare brightening at the approximate start of the eruptive/flash phase of the X1.1 solar flare.
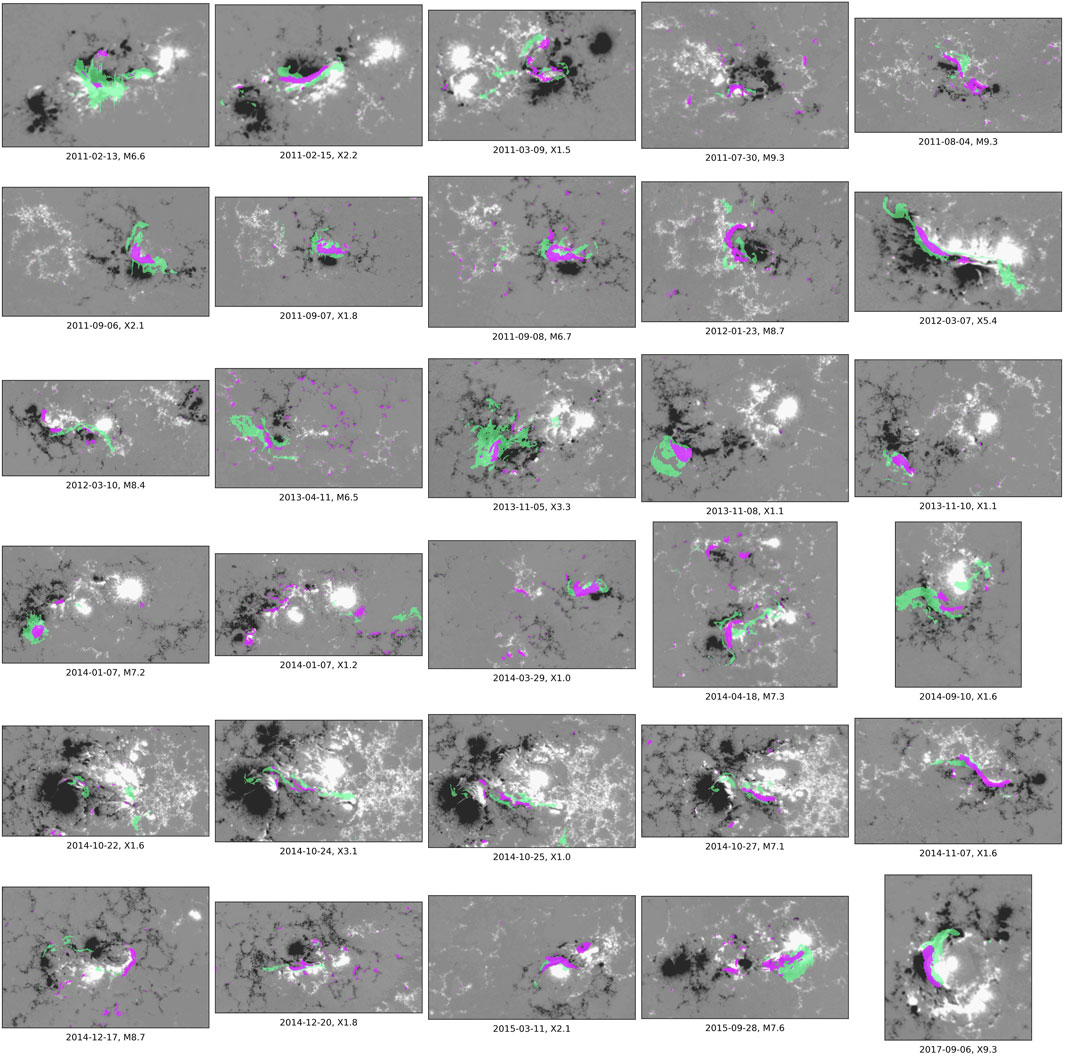
Figure 6. 2D projection of the cumulative NPR leading up to the flare start (purple shading) and the areas of flare brightening through the approximate start of the eruptive/flash phase (green shading) plotted over the bounding box portion of the magnetogram closest to the flare start time for each of the 30 solar flare events in the dataset.
Unlike the AR, which was defined at the surface and thus directly identified the seed locations that would be used to trace field lines from at each timestep, the NPR was defined above the photosphere within the corona. Therefore, the first step to determine the seed locations was to identify which field lines from the AR data volume/field came into contact with the NPR region at the start time of the flare. The footprints of those field lines determined the seed locations for the NPR data volume/field at each timestep throughout the 2-h window around the event (see Figure 7).
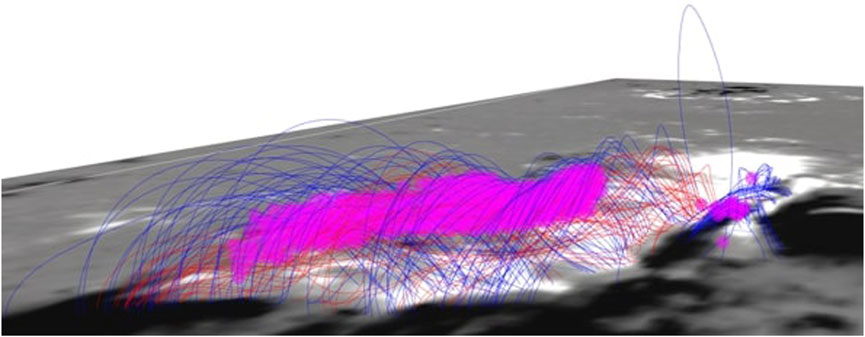
Figure 7. 2012-03-07 00:00 UT NPR (purple) with the field lines from the 00:00 UT AR field that came into contact with the NPR. The footprints of these field lines determined the seed locations for the NPR data volumes at each timestep for this X5.4 flare event. Blue field lines indicate closed field lines with 1
3.3 Magnetic field parameters
The magnetic field parameters calculated from the data volumes are shown in Table 2 with their description, units, and formulas. The summations for the parameters occur over the individual volume elements within the different data volumes, with the exception of ϕ, which is the surface flux. The parameters investigated were selected due to the potential predictive capability of these parameters found in other studies (e.g., Bobra and Couvidat, 2015; Kusano et al., 2020; Georgoulis et al., 2021). It is worth noting that all the investigated parameters are summed values, which was prompted by the findings of multiple studies showing that solar flares tend to be guided more by the total quantities than mean quantities (e.g., Leka and Barnes, 2007; Kazachenko et al., 2022). It is also worth highlighting that the parameters were calculated from data contained within the observed photospheric, modeled chromospheric, and modeled coronal fields. Whereas the finding of Korsós et al. (2020) shows that the optimal height for the WGM method is 1,000–1,800 km, suggesting that the chromospheric magnetic field may be the key driver flare physics, signatures of flare occurrence have still been found within observed photospheric data and modeled coronal data. Therefore, data from all layers of the solar atmosphere were incorporated in the hopes of capturing the dynamics involved with the flaring process at each layer.
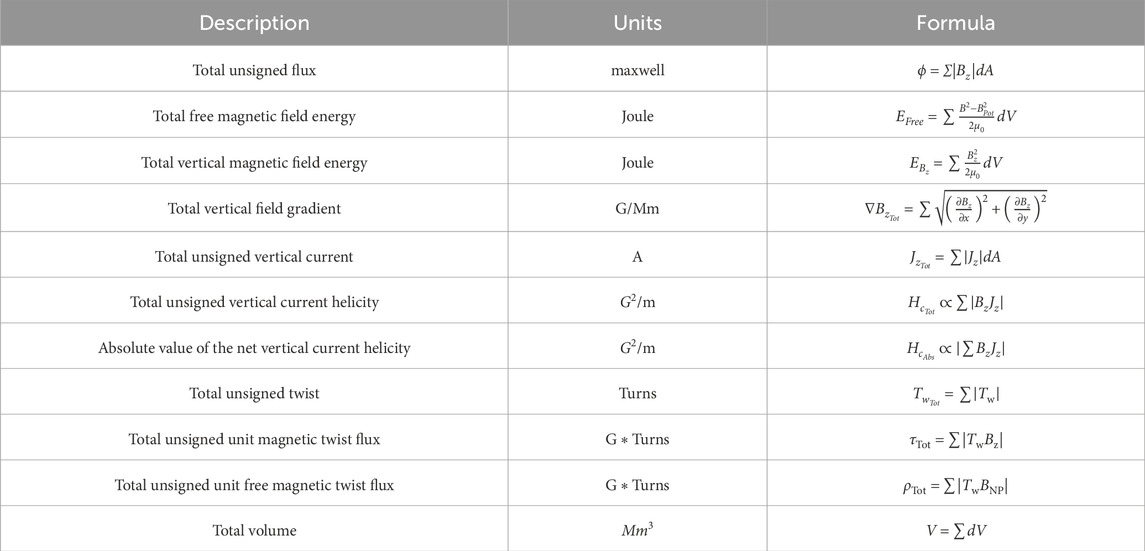
Table 2. Investigated magnetic field parameters with associated descriptions, units, and calculations.
3.4 Power spectra
In addition to the parameters calculated directly from the different data volumes/fields themselves, the power spectra of the surface maps created for each of the parameters listed in Table 2 (with the exception of V) was calculated. This was motivated by the finding of Abramenko (2005) that the power spectrum of magnetograms is related to an AR’s future flare productivity/eruptive behavior. For each data volume/field (AR and NPR) at each timestep within the 2-h window around the flare events, surface maps were created for the magnetic field parameters by summing the volume elements along the vertical z axis. EFree surface maps for both the AR and NPR fields for the X5.4 flare that occurred on 7 March 2012 are provided as an example in Figure 8. Following a similar approach as Abramenko (2005), the 2D power spectrum was calculated from each surface map. The total power was then calculated as the area under the power spectra curves within the wavenumber range of 0.3 rad/Mm ≤ k ≤ 3 rad/Mm, corresponding to the spatial scale 2Mm ≤ r ≤ 20 Mm, which is the ideal inertial subrange for magnetographic measurements (Abramenko, 2005). The NPR field EFree power spectra for the X5.4 flare event are provided as an example in Figure 9.
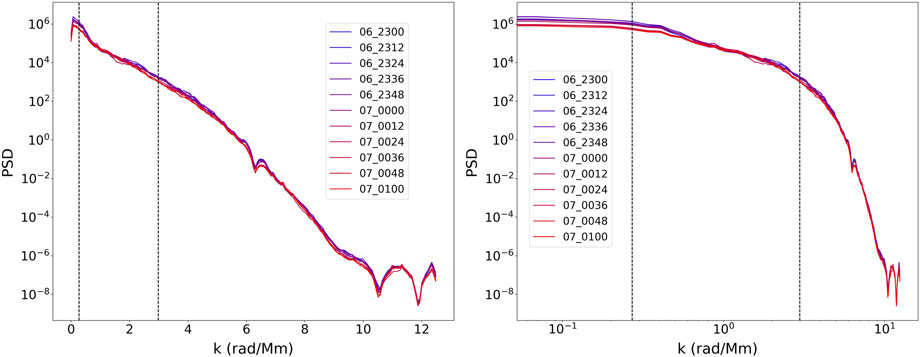
Figure 9. Semi-log (left) and log–log (right) power spectrum curves calculated from the EFree surface maps for each timestep throughout the 2-h window around the 2012-03-07 X5.4 solar flare. The dashed vertical lines indicate the wavenumber range, in which the total power was calculated as the area under the curves.
4 Statistical analysis
Once the parameter data for all 30 flare events had been calculated following the methodology outlined in Section 3, superposed epoch (SPE) plots, similar to that proposed by Mason and Hoeksema (2010), were created to examine any consistent trends within the time series of the different magnetic field parameters. Additionally, correlation coefficients between the parameters and flare properties were calculated using only data prior to the start of the flares in order to find relationships between the state of the 3D solar magnetic field leading up to an eruption and the flare characteristics. With the addition of the power spectrum calculations, there were two sets of magnetic field parameters calculated for each data volume/field at each timestep for every flare event:
1. The 11 parameters listed in Table 2 calculated as total quantities directly from the data volumes/fields themselves—field parameters
2. The total power of the same parameters (except for V) calculated from the power spectra of the surface maps of each parameter—power spectrum parameters.
Only the field parameters were used to produce the SPE plots, whereas both the field parameters and power spectrum parameters were used to calculate the correlation between the parameters and different flare properties. The power spectrum parameters are denoted with Pow() around the parameter symbol; for example, Pow
4.1 Superposed epoch plots
An SPE plot is a sensitive tool used to discover the average (possibly weak) response of a complex system to a particular event (Mason and Hoeksema, 2010). The SPE plots are combinations of the individual time series for the 30 flare events in the dataset, aligned by the flare start times. Unlike the time series plotted for the case study analysis (Garland et al., 2023), which were generated from the parameters normalized to the value at the flare start time, the individual time series used in the SPE plots were generated from the field parameters normalized to the value at the start of the 2-h window around the flare event. Such normalization still allowed for effective comparison of the relative changes, but it also revealed the consistency in any trends from a forecasting perspective. The data shown in the plots are the mean and standard deviation of the individual time series.
SPE plots were produced for each data volume/field for the solar flare dataset as a whole, as well as for flare events of similar magnetic and sunspot classifications. However, as Table 1 indicates, the categorization by each specific magnetic and sunspot classifications would result in too small data subsets. In order to maintain a degree of statistical significance, data subsets were established for only the most common Mount Wilson magnetic classification and modified Zürich/McIntosh sunspot classification. Thus, SPE plots were produced for the following:
1. Full solar flare dataset—30 flare events (18 X-class and 12 M-class)
2. Subset of flare events with a Mount Wilson magnetic classification of βγδ—22 flare events (15 X-class and 7 M-class)
3. Subset of flare events with any Mount Wilson magnetic classification other than βγδ—8 flare events (3 X-class and 5 M-class)
4. Subset of flare events with modified Zürich/McIntosh largest spot (penumbra) and distribution classification ‘kc’—18 flare events (13 X-class and 5 M-class)
5. Subset of flare events with any modified Zürich/McIntosh largest spot (penumbra) and distribution classification other than ‘kc’—12 flare events (5 X-class and 7 M-class).
The SPE plots for the full flare dataset are shown in Figures 10 and 11. Overall, the parameters that showed the most consistent trends among the flare events, particularly for the hour leading up to the eruption, were ϕ, EFree, τTot, and ρTot. Consistency was based on the relative standard deviation, which was calculated as the standard deviation divided by the range of the averaged data. The parameters ϕ, EFree, τTot, and ρTot had the four lowest relative standard deviations, respectively, and therefore will be the focus of discussion for this section. The trends seen for these parameters were the same across all the data subsets. However, it is worth noting that a greater relative change and smaller standard deviations were found for the subsets of flare events with any magnetic classification other than βγδ and any penumbra/distribution classification other than ‘kc’. Although this could just be a result of the smaller sample sizes, it could also be due to the nature of the larger and more complex ARs, which showed greater overall variability in the evolution of the parameters, particularly after eruption. In several of the flare events with the largest and most complex ARs, the post-flare values of the parameters quickly increased back to the pre-flare values, indicating that the magnetic fields did not fully relax to less stressed states. These ARs were typically more active, in line with the well-known rule of thumb of flare persistence (Mason and Hoeksema, 2010).
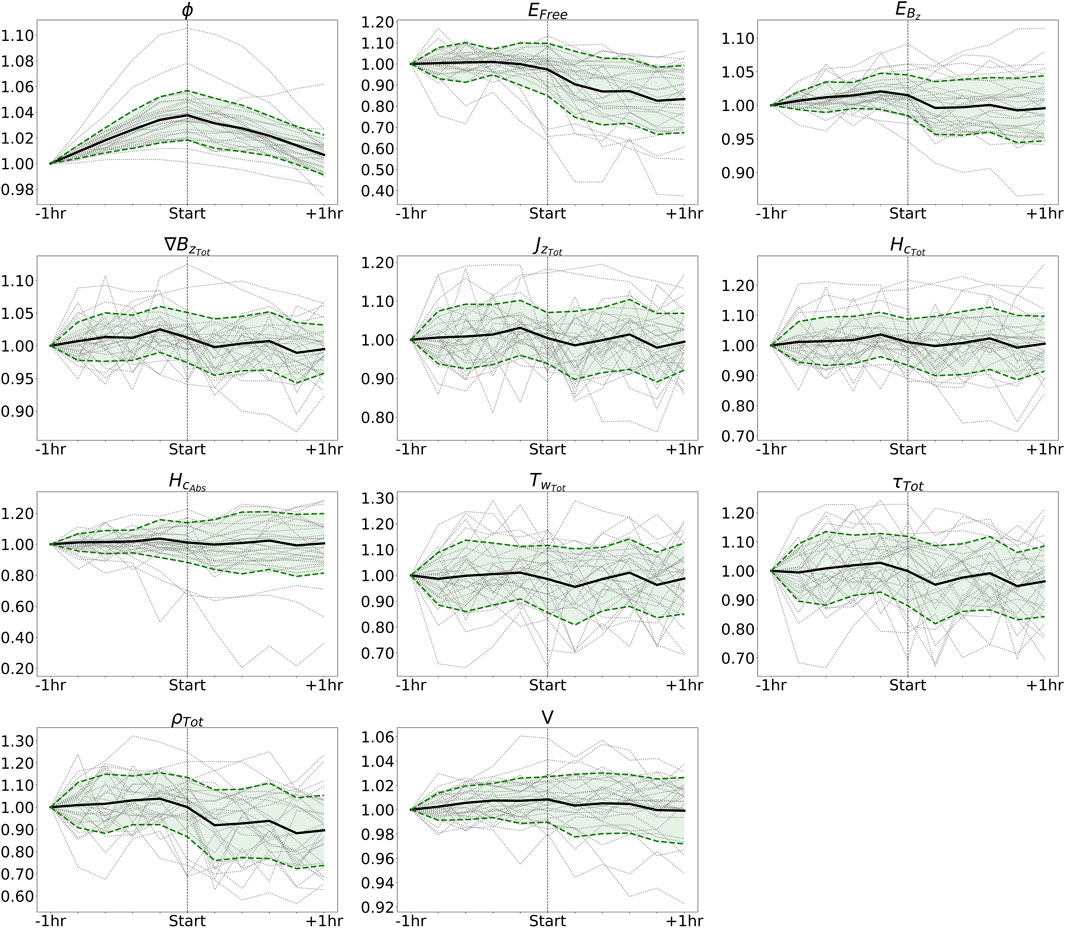
Figure 10. AR field SPE plot for full-flare dataset (18 X-class and 12 M-class) showing the mean (black solid line) and standard deviation (green fill) of the individual time series (gray dotted lines).
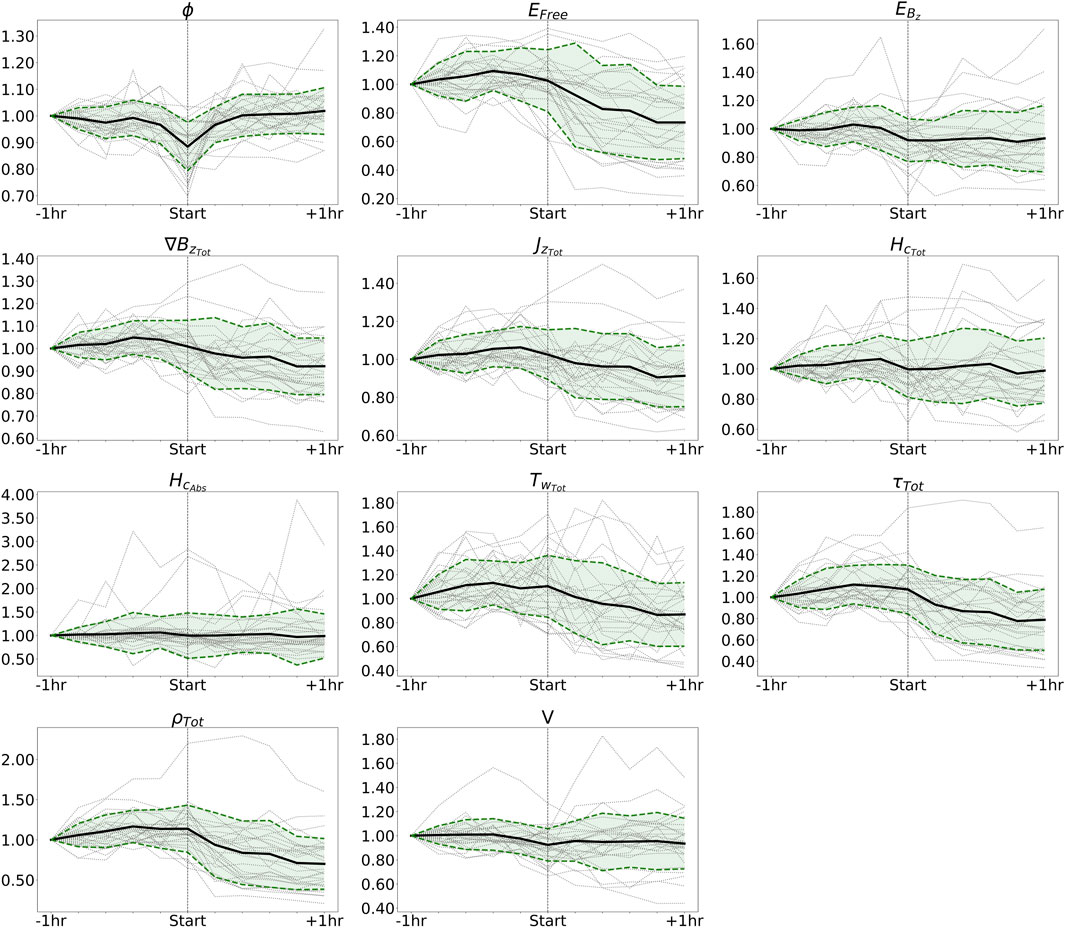
Figure 11. NPR field SPE plot for full-flare dataset (18 X-class and 12 M-class) showing the mean (black solid line) and standard deviation (green fill) of the individual time series (gray dotted lines).
The most consistent trend across all the flare events was the steady increase in ϕ for the AR field over the hour leading up to the flare start, peaking at the time of the flare, and then decreasing throughout the remainder of the event. This could be explained by the processes of flux emergence and cancellation, which have been associated with flaring activity (e.g., Nitta et al., 1996; Li et al., 2000; Wang et al., 2002; Kutsenko et al., 2021). It could also be the result of the stretching (in the vertical) and relaxing of the magnetic field for the “two-ribbon” flare model. As the strapping or envelope field lying over the expanding flux rope is stretched in the vertical, the z-component of the field and therefore ϕ increases. Once the instability of the magnetic field reaches the point to trigger the eruption, the magnetic field relaxes to a less stressed state in the form of the simple post-flare arcade that is no longer stretched as extensively. Leka and Barnes (2003) studied the temporal evolution of the ϕ during a similar time interval for two ARs that produced X- and M-class flares, finding “some flux growth” prior to the flares, but no post-event decrease. The difference in the observed trend for ϕ found in this study and theirs could be due to the different magnetogram data used or the higher AR defining threshold (|Bz|≥ 300 G) utilized in the present study. Similar to that the values in the study by Leka and Barnes (2003), the relative changes in ϕ are small, only about 1%–5%.
An opposite trend is seen for ϕ for the NPR field, where on average, there was approximately 10% decrease over the two timesteps leading up to the start of a flare, followed by a roughly equal increase over one to two timesteps after the flare start (Figure 11). Relating to the changing structure of the magnetic field, this can be explained by the shearing and reconnecting of the non-potential field lines associated with the SMA/MFR structures as the field destabilizes, leading up to the flare, and then relaxes into the post-flare arcade after the eruption. Essentially, field lines in close proximity to the expanding flux rope reconnect below the flux rope, causing them to wrap around the twisted axis. As these field lines become a part of the flux rope, they become more elongated in the horizontal, leading to a decrease in the z-component of that portion of the magnetic field. Following the eruption and decay of the flux rope, the post-flare arcade sets up with more vertically oriented, simple loop structures compared to the flux rope that was present prior to eruption. Higher cadence data would be useful to further examine the rate of this “dip” in ϕ for the NPR field around the start of the flare.
On average, for the NPR field, there is an initial increase in EFree until 24 min before flare start, followed by a slight decrease up to the flare start and a more significant decrease from the flare start to 1 h after. The mean dissipated energy is 41% ± 19% of the maximum free energy, which is lower yet overlapping with the 60% ± 26% found by Aschwanden (2019). The initial decrease in EFree following the peak just before the flare start suggests that the free magnetic pressure reaches a point where the field can no longer fully contain it and it starts to “leak” out. This “leaking” of the pressure and slight loss of free energy is likely brought about by the ongoing reconnection as the field destabilizes but before the critical point of destabilization is reached and the bulk of the energy is released. In other words, once enough free energy has been built up and the free or non-potential magnetic pressure is high enough, each reconnection event that occurs before the eruptive instability is reached releases a small amount of the free energy. It is plausible that these small releases of the free energy just before the eruption are associated with the short-lived small-scale brightening seen in UV and EUV imagery (e.g., Leka et al., 2023).
It should be noted that while the trend just discussed was the average trend seen in many of the 30 flare events investigated, some events did show more a more variable evolution of EFree, with intermittent instances of energy buildup and dissipation superimposed on the overall change of higher pre-flare energy to lower post-flare energy. Other studies that have analyzed the temporal evolution of EFree estimated from NLFFF extrapolation have reported only step function decreases in EFree following the occurrence of the strong flares examined (Thalmann and Wiegelmann, 2008; Murray et al., 2013; Sun et al., 2012), in line with the store-and-release concept for solar eruptions. However, the findings of Aschwanden (2019) and the present study suggest that the evolution of energy during solar flares is more complex than a single-step function, exhibiting a more fragmentary and impulsive nature. The different findings could be the result of different temporal resolution, extrapolation techniques, and/or the portion of the modeled 3D solar magnetic field from which EFree was calculated.
The evolution of τTot and ρTot for the NPR field, on average, is similar to that of EFree, which was expected. For the majority of flare events examined, |Tw| either increased or remained fairly constant in the hour before flare start and then decreased following the eruption as the field relaxed. This was more evident in the flare events where highly twisted (|Tw| ≥ 2) structures were present in the pre-flare field configuration than in events where the pre-flare twist was more moderate (|Tw| ≈ 1), which saw a more variable evolution of twist. Considering τTot and ρTot are essentially
4.2 Correlation with flare properties
Similar to the study by Kazachenko et al. (2017), the relationship between different flare properties and the magnetic field parameters was quantitatively described by the Spearman ranking correlation coefficient (rs), which measures the monotonic relationship between two variables. The different flare properties are as follows:
1. GOES measured peak X-ray flux in W/m2.
2. Duration from the start to the end in seconds.
3. Rise time—the difference between the flare start and max times, in seconds.
4. Decay time—the difference between the flare max and end times, in seconds.
5. Impulsiveness—the ratio of peak X-ray flux to rise time, in W/m2s.
6. GOES reported integrated flux in J/m2.
The method of bootstrapping (Efron and Tibshirani, 1986) was used to estimate the uncertainty in the correlation coefficient due to sampling. Specifically, rs was calculated 104 times for 30 randomly selected data pairs from the dataset with replacement. The mean rs calculated from the bootstrap method was the reported rs for the particular parameter and flare property correlation, with the standard deviation of rs reported as the correlation’s statistical uncertainty. In addition to rs, the p-value (p) and its uncertainty were calculated as well. The commonly used thresholds for rs to express the qualitative strength of the correlation are as follows: |rs| ∈ [0.0, 0.4)—weak, |rs| ∈ [0.4, 0.6)—moderate, |rs| ∈ [0.6, 0.8)—strong, and |rs| ∈ [0.8, 1.0]—very strong (Dodge, 2008). For strong and very strong correlation coefficients, the relationship between the parameter and flare property was fitted with a power-law function of the form
where Y is the flare property and X is the magnetic field parameter. The scaling factor, a, and exponent, b, were found using linear regression in the log–log space.
The process of correlation coefficient calculation was carried out for each data volume/field (AR and NPR), each set of parameters (field parameters and power spectrum parameters), and each timestep leading up to flare start, as well as the sum across the timesteps leading to the start. Tables 3 and 4 provide a summary of rs values calculated from the AR data volumes for the field parameters and power spectrum parameters, respectively. Tables 5 and 6 provide the same for the NPR data volumes. Listed in the tables are the maximum rs values from the different timesteps for each parameter and flare property examined.
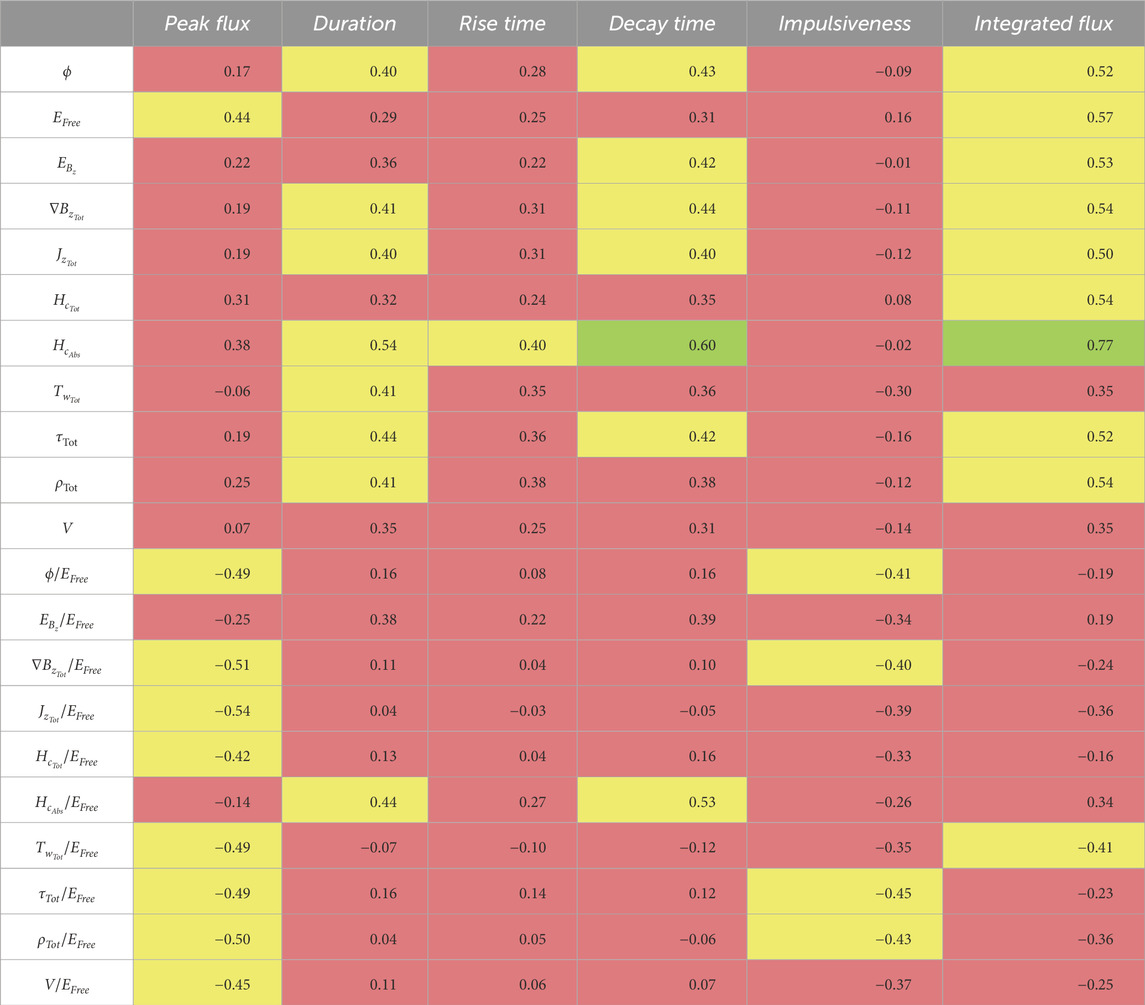
Table 3. Summary of rsvalues calculated from the AR data volumes for the field parameters and flare properties. The coefficients shown are the maximum rsvalues from the different timesteps leading up to the flare start time. Weak correlations are highlighted in red, moderate in yellow, strong in green, and very strong in blue.
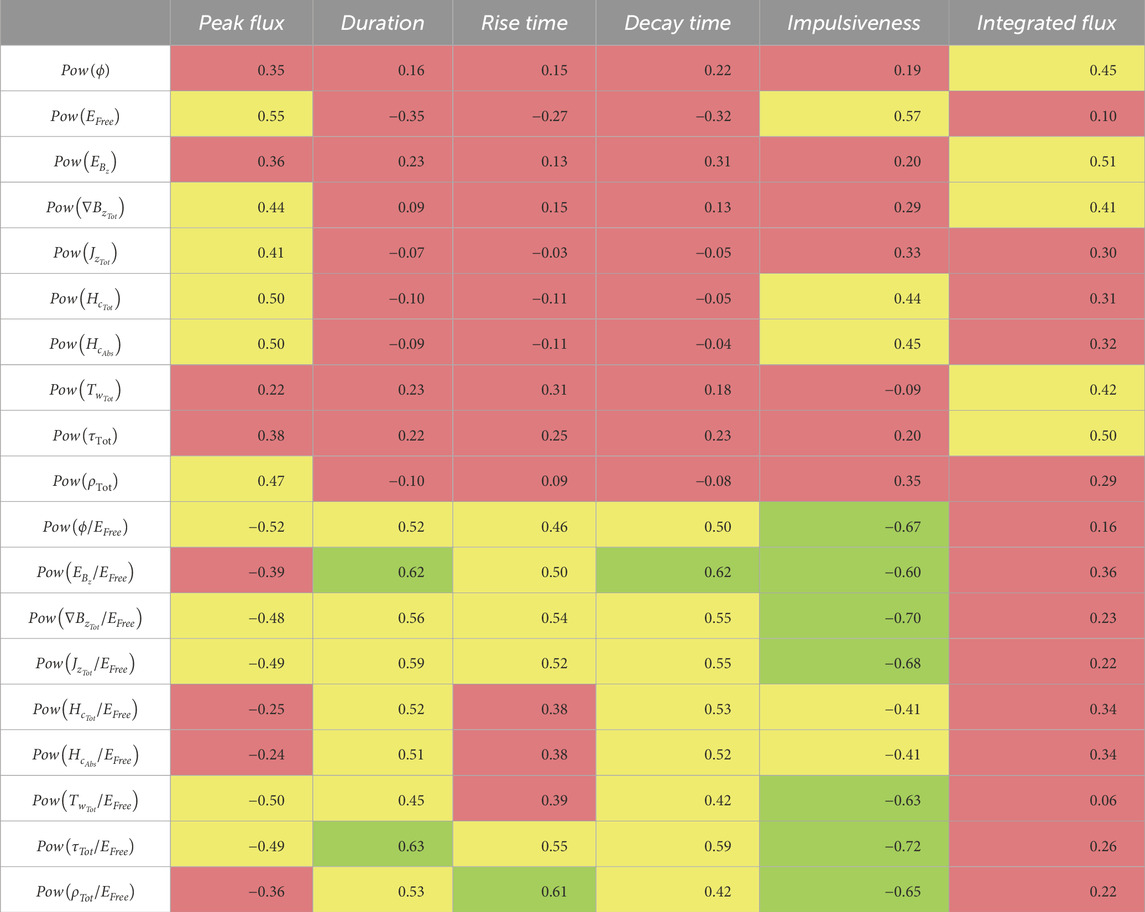
Table 4. Summary of rsvalues calculated from the AR data volumes for the power spectrum parameters and flare properties. The coefficients shown are the maximum rsvalues from the different timesteps leading up to the flare start time. Weak correlations are highlighted in red, moderate in yellow, strong in green, and very strong in blue.
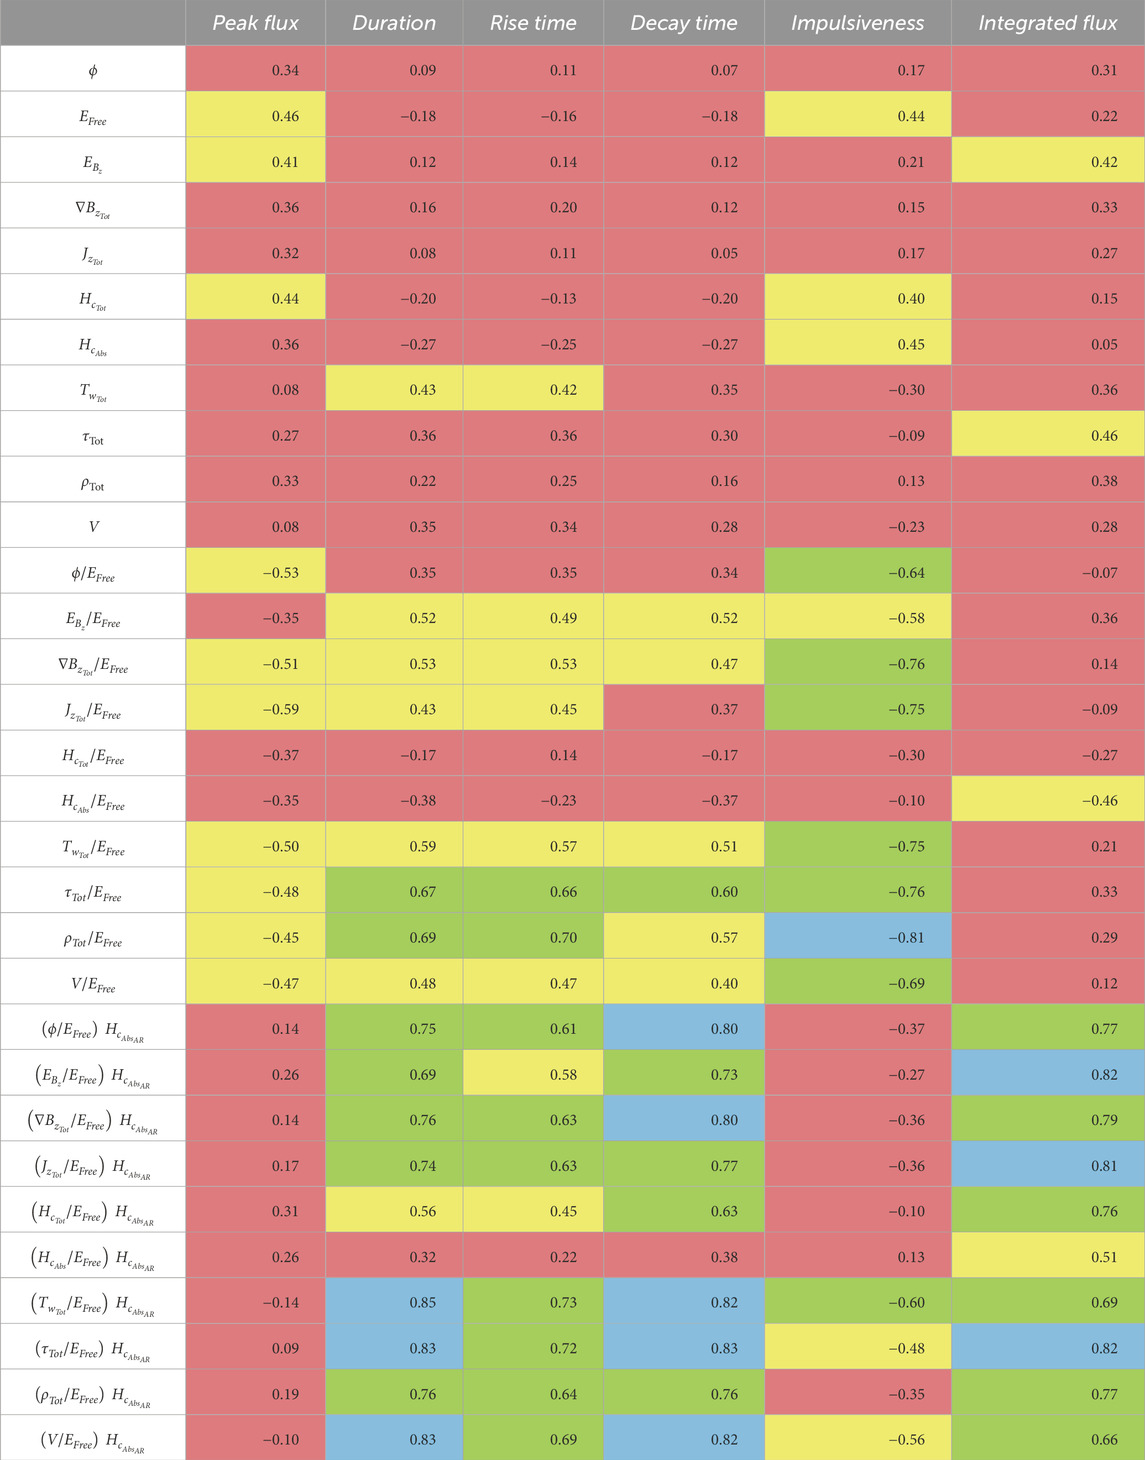
Table 5. Summary of rsvalues calculated from the NPR data volumes for the field parameters and flare properties. The coefficients shown are the maximum rsvalues from the different timesteps leading up to the flare start time. Weak correlations are highlighted in red, moderate in yellow, strong in green, and very strong in blue.
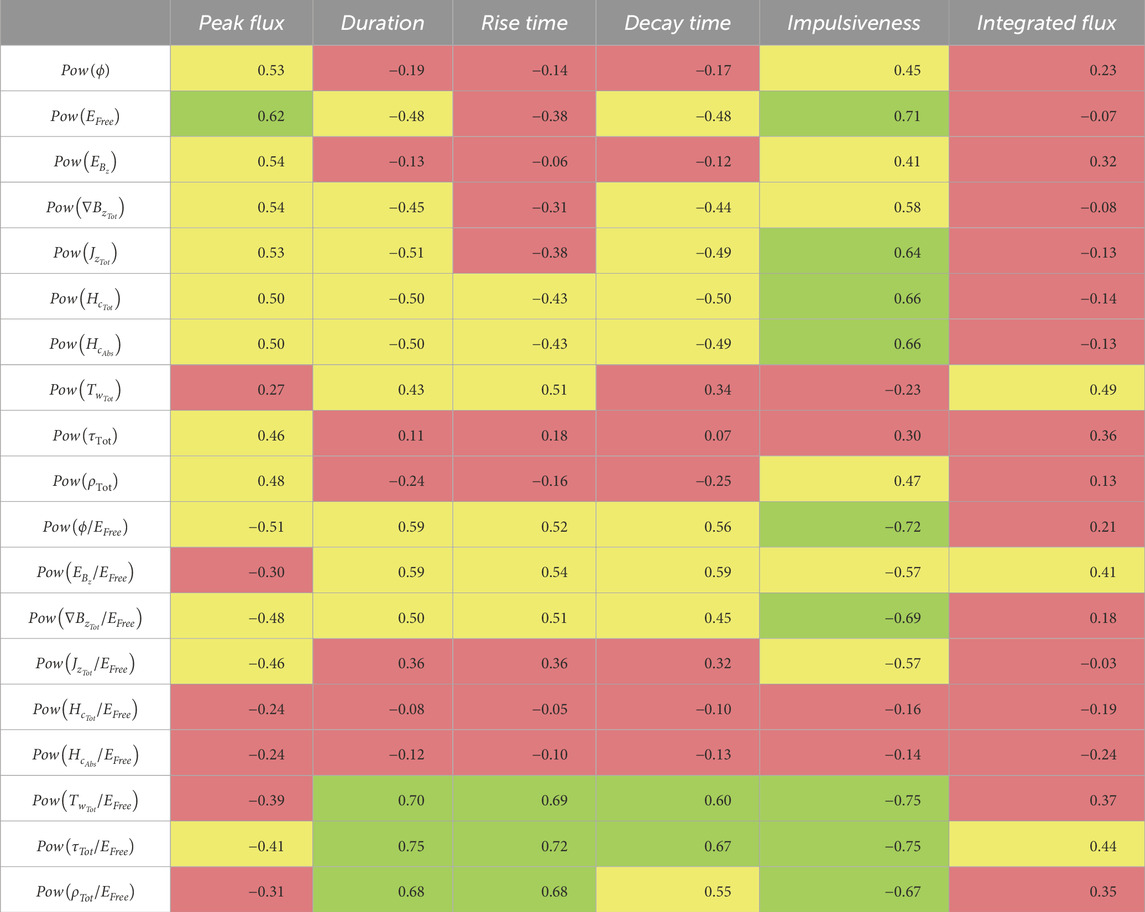
Table 6. Summary of rsvalues calculated from the NPR data volumes for the power spectrum parameters and flare properties. The coefficients shown are the maximum rsvalues from the different timesteps leading up to the flare start time. Weak correlations are highlighted in red, moderate in yellow, strong in green, and very strong in blue.
4.2.1 Individual parameters
For the individual parameters (the top rows of Tables 3–6), the peak flux is strongly correlated with Pow(EFree); impulsiveness is strongly correlated with Pow(EFree),
The relationship found here between
The strong correlation between the Pow(EFree) and peak flux was expected, given that numerous studies have found predictive capability with the parameter EFree regarding flare activity (e.g., Yamamoto and Sakurai, 2009; Bobra and Couvidat, 2015; Aschwanden, 2019). Although the correlation between EFree and peak flux was only moderate, the correlation plots from each timestep, as well as the sum across timesteps, did show a well-defined upper limit to peak flux that was fitted with a quadratic function (see Figure 12). Pow(EFree),
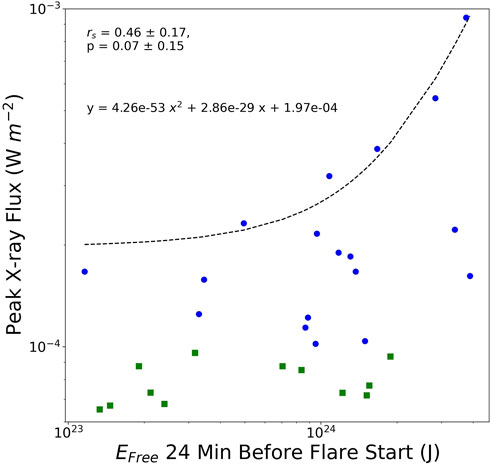
Figure 12. NPR field EFree 24 min before flare start vs. peak X-ray flux. The Spearman correlation coefficient and p-value are annotated, along with the equation for the curve fitted to the apparent relationship for maximum possible peak flux (dashed line). The blue circles represent the X-class flares and the green squares represent the M-class flares.
4.2.2 Free magnetic energy ratio parameters
Given the well-documented relationship of EFree to flaring activity, as well as the strong correlations with the peak flux and impulsiveness just discussed, the next step in examining the relationship of the parameters with the different flare properties was to analyze the ratio of the parameters to the free energy (the bottom rows of Tables 3; 4, and 6; the middle rows of Table 5). The ratios of both sets of parameters were found to correlate well with flare impulsiveness. Strong correlations were found between the power spectrum parameter ratios and the flare duration, rise time, decay time, and impulsiveness for both AR and NPR fields. Strong to very strong correlations were found between the field parameter ratios and the same flare properties for the NPR field. Overall, the power spectrum parameter ratios had stronger correlations for the duration, rise time, and decay time, whereas the field parameter ratios had stronger correlations with the impulsiveness. The strongest correlations for the free energy ratios across both sets of parameters were between
4.2.3 Weighted net current helicity
As discussed in Section 4.2.1., the
4.2.4 Overall
Figure 13 provides the correlation plots for the parameters with the strongest correlation coefficients for each flare property, annotated with the corresponding rs ±△rs, p ±△p, and power-law function. The timestep with the strongest correlations was 60 min before the flare start. However, the range of rs values was generally consistent across the different timesteps.
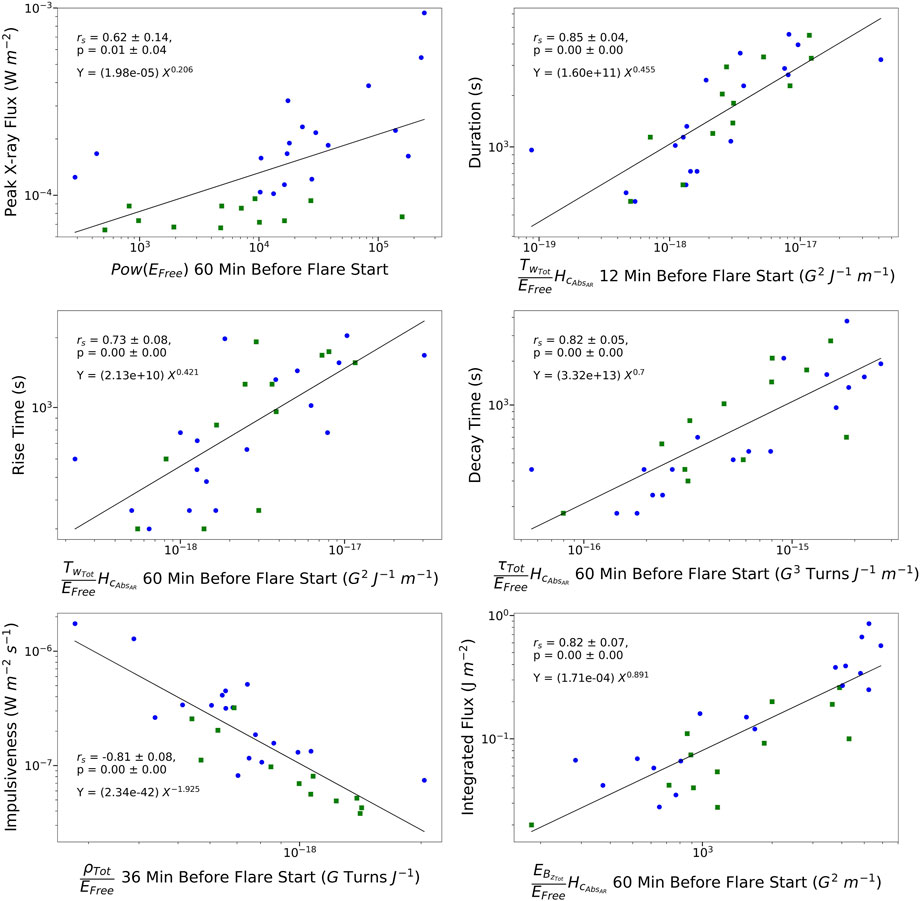
Figure 13. Parameters and flare properties with the strongest correlations. The Spearman correlation coefficient and p-value are annotated, along with the equation for the power-law function fitted to the data (dashed line). The blue circles represent the X-class flares and the green squares represent the M-class flares.
Although the correlation coefficients found are similar to those of other statistical studies that have examined the same flare properties (e.g., Yamamoto and Sakurai, 2009; Kazachenko et al., 2017; 2022; Reep and Knizhnik, 2019), it is worth highlighting that the data used to calculate rs in the present study were all within the hour before flare occurrence. In addition to furthering the space weather community’s investigation and understanding of the physical processes involved in solar flares, the findings from the present study more directly benefit flare forecasting. Using the power-law functions in Figure 13 and the fitted quadratic function in Figure 12, the properties of a flare can be well estimated up to an hour before it is triggered. In theory, estimates of the properties could be continuously calculated with the influx of near real-time HMI data, providing a constant approximation to the nature of any strong flare that may occur within an hour’s time. This of course assumes that the relationships found in this analysis using the well-calibrated HMI data hold true for the near real-time (NRT) HMI data series, which does not go through the same data processing. Alternatively, quasi real-time magnetic field extrapolations could be obtained through the method put forth by Jarolim et al. (2023), which utilizes a neural network that integrates observational data and a NLFFF model, from which estimates of flare properties could be calculated efficiently for forecasting purposes.
5 Conclusion
5.1 Summary
In this study, the 3D solar magnetic field was modeled using optimization-based NLFFF extrapolation during 30 strong and extreme solar flare events. Specifically, 3D magnetic fields were modeled using the 12-min cadence HMI photospheric vector magnetograms, spanning a time period of 1 hour before through 1 hour after the start of 18 X-class flares and 12 M-class (greater than M6.5) flares. Using the modeled data, several magnetic field parameters were calculated from the fields directly, as well as from the power spectrum of surface maps generated by summing the fields along the vertical axis, for the following two different regions:
1. Active region (AR): areas with photospheric |Bz|≥ 300 G.
2. Non-potential region (NPR): areas above the photosphere with BNP greater than three standard deviations above
The superposed epoch (SPE) plots of the magnetic field parameters were analyzed to investigate the evolution of the 3D solar field during the solar flare event and discern consistent trends across all solar flare events in the dataset, as well as across subsets of flare events categorized by their Mount Wilson magnetic classification and modified Zürich/McIntosh sunspot classification. The relationship between the different flare properties (peak X-ray flux, duration, rise time, decay time, impulsiveness, and integrated flux) and the magnetic field parameters was quantitatively described by the Spearman ranking correlation coefficient, rs. In addition to the individual parameters, ratios of the parameters to the free energy, as well as the net current helicity of the AR fields weighted by those ratios, were included in the list of parameters from which correlation with the flare properties were calculated. The key results of the study are as follows:
1. For the majority of the 30 flare events in the dataset, the NPR aligned well with the area of initial flare brightening through the start of the eruptive/flash phase. The alignment was worse for events where the magnetic field configuration was more conducive to emerging-flux type flares, that is, the AR did not have a well-defined PIL or the flare occurred on the edge of the AR away from an inversion line versus directly over one. Overall, the NPR provides a good indication of where within the magnetic field over an AR an eruption will occur if triggered.
2. The parameter that showed the most consistent and discernable trends among the flare events, particularly for the hour leading up to the eruption, was the total unsigned flux (ϕ). For the AR field, ϕ showed a consistent increase up to the start of the flare, followed by a steady decrease following the eruption. This could be the result of flux emergence and cancellation on the timescale of minutes, or the vertical stretching and relaxing of the magnetic field lying over highly twisted/sheared portion of the field from which the eruption is triggered. The opposite was seen for ϕ for the NPR field, which showed a “dip” within one to two timesteps around the flare start.
3. The parameter that showed the second most consistent and discernable trend was EFree. On average, for the NPR field, EFree peaked around 24 min before flare start, and then decreased slightly up until the start, at which point a more significant decrease from the flare start to 1 h after occurred. The mean dissipated energy was found to be 41% ± 19% of the maximum free energy, which is lower yet overlapping with the 60% ± 26% found by Aschwanden (2019). The decreases in EFree prior to eruption could be associated with short-lived small-scale brightening seen in UV and EUV imagery (e.g., Leka et al., 2023). The intermittent instances of energy buildup and dissipation superimposed on the overall change of higher pre-flare energy to lower post-flare energy suggest a more fragmentary and impulsive evolution of the free energy during solar flare events than the single-step function of the store-and-release model, which is consistent with the findings of Aschwanden (2019).
4. Greater consistency in the evolution of the magnetic field parameters during the solar flare events was found for the subsets of any magnetic classification other than βγδ and any penumbra/distribution classification other than ‘kc’. In several of the flare events with the largest and most complex ARs, the post-flare values of the parameters quickly increased back to pre-flare values, indicating that the magnetic field did not fully relax to a less stressed state.
5. A strong correlation (rs = 0.62 ± 0.14) was found for the NPR data volumes/fields between Pow(EFree) 60 min before flare start and the peak X-ray flux, whereas only moderate correlation was found between EFree and peak flux. Pow(EFree) denotes the total power calculated from the EFree surface map generated by summing the NPR data volumes along the vertical axis. It is possible that the power spectrum parameter correlated more strongly given that its calculation is focused on the inertial subrange, that is, the length scale over which energy is transferred. However, although the correlation between EFree and peak flux was only moderate, correlation plots from each timestep, as well as the sum across timesteps, did show a rather well-defined upper limit to peak flux.
6. Strong to very strong correlations were found between the ratio of the parameters to the free energy and impulsiveness, for both sets of parameters (field parameters and power spectrum parameters) calculated from the NPR data volumes/fields. The strongest correlation with impulsiveness was between
7. Given that the net current helicity of the AR field provided a good indication of the nature of the flare event following the initial eruption (strong correlation with decay time and integrated flux) and some of the free energy ratios provided a good indication of the nature of the eruption itself (strong to very strong correlation with impulsiveness), it was hypothesized that weighting the net current helicity of the AR field by the free energy ratios would relate well to the event as a whole and correlate more strongly with the integrated flux. This was confirmed with very strong correlations found for the duration, decay time, and integrated flux. The strongest correlations for the weighted
The findings of this study suggest that the specific magnetic field parameters calculated from the identified portions of the modeled 3D magnetic field have potential predictive capability and could benefit flare forecasting efforts. The location of a flare within an AR if triggered can be forecasted reasonably well through identifying the NPR. Although a perfectly consistent, distinct signature that specifies the exact timing of flare occurrence may not be seen in the time series of the parameters calculated from the modeled magnetic field, the destabilization of the field that is conducive to an eruption is observable. The relationships discussed in this study, calculated solely from data that were within an hour timeframe leading up to flare occurrence, could provide reasonable estimates of the flare properties of any strong/extreme flare that may occur within an hour’s time.
5.2 Limitations and future work
While the trends and relationships found from the statistical analysis show high potential for flare forecasting, a major limitation of the study is the number of events included in the dataset. Although as a rule of thumb a minimum of 30 observations is generally considered sufficient to conduct significant statistics, the confidence in the results is limited. Thus, the next logical step would be to expand the dataset, initially including more X- and M-class flares, then expanding into the lower-class flares as well to find possible differences between the weaker and stronger flares. Following the initial expansion of more flare events, the next step would be to include data from non-flaring ARs to test whether the trends that hold consistent across flare events are discriminating in regards to flare occurrence.
Another limitation of the study is the use of only a single model; therefore, it was not able to determine if the findings are an artifact of the specific model used. To make such a determination, the analysis could be re-performed following the exact same procedures, only utilizing different models to extrapolate the 3D solar magnetic field. If the trends and relationships found continue to hold for varying extrapolation techniques, it would increase the confidence that the findings are grounded in the actual physical processes occurring within the solar magnetic field during flare events. Of particular interest would be the use of models that utilize physics-informed neural networks, such as the method of Jarolim et al. (2024), which builds upon the work of Jarolim et al. (2023) by incorporating chromospheric magnetic field measurements into the extrapolation process to generate more realistic field simulations. The inclusion of the chromospheric data helps correct the lower portions of the solar magnetic field, where the force-free assumption is not valid due to the dense plasma conditions present. As discussed in the study by Korsós et al. (2024), such neural network-based methods provide more realistic field extrapolations with considerable improvement in computational efficiency compared to the standard NLFFF extrapolation, proving more suitable with respect to real-time flare forecasting application.
Finally, the 12-min cadence between observations of the standard hmi.B_720s dataset brings about another limitation: for time scales less than 12 min, for example, flare eruptions, changes in the magnetic field are lost. Sun et al. (2017) created a new high-cadence vector magnetogram dataset for HMI that is more suited for investigating the evolution of the magnetic field during such quick phenomena. The 135-s cadence series hmi.B_135s has the same format and is processed with nearly identical pipeline options as the 720-s data (Sun et al., 2017). Although the noise level in the field strength for the higher cadence dataset is about 50 G higher than that of the standard dataset, measurements in the strong-field regions (|B|≥ 300 G) agree well between the two. Performing the same analysis with the higher cadence could highlight signatures that were potentially missed with the standard 12-min cadence dataset.
Data availability statement
Publicly available datasets were analyzed in this study. These data can be found here: http://jsoc.stanford.edu/ajax/exportdata.html.
Author contributions
SG: writing–review and editing, writing–original draft, methodology, investigation, formal analysis, and conceptualization. VY: writing–review and editing, resources, and investigation. RL: writing–review and editing and investigation. BA: writing–review and editing. DE: investigation, writing–review and editing, and supervision.
Funding
This research was funded by the Air Force Office of Scientific Research (AFOSR/RTB1). The views, opinions, and/or findings expressed are those of the author and should not be interpreted as representing the official views or policies of the Department of Defense or the U.S. Government. VY acknowledges support from NASA 80NSSC20K0025, 80NSSC20K1282, and 80NSSC21K1671 grants, and NSF AGS 2309939, 2300341, and AST 2108235, 2114201 grants.
Acknowledgments
We thank referees for careful reading the manuscript and providing valuable criticism and suggestions.
Conflict of interest
The authors declare that the research was conducted in the absence of any commercial or financial relationships that could be construed as a potential conflict of interest.
Publisher’s note
All claims expressed in this article are solely those of the authors and do not necessarily represent those of their affiliated organizations, or those of the publisher, the editors, and the reviewers. Any product that may be evaluated in this article, or claim that may be made by its manufacturer, is not guaranteed or endorsed by the publisher.
References
Abramenko, V. I. (2005). Relationship between magnetic power spectrum and flare productivity in solar active regions. Astrophysical J. 629, 1141–1149. doi:10.1086/431732
Aschwanden, M. J. (2019). Global energetics of solar flares. IX. Refined magnetic modeling. Astrophysical J. 885, 49. doi:10.3847/1538-4357/ab46c1
Bobra, M. G., and Couvidat, S. (2015). Solar flare prediction using SDO/HMI vector magnetic field data with a machine-learning algorithm. Astrophysical J. 798, 135. doi:10.1088/0004-637X/798/2/135
Bobra, M. G., Sun, X., Hoeksema, J. T., Turmon, M., Liu, Y., Hayashi, K., et al. (2014). The helioseismic and magnetic imager (HMI) vector magnetic field pipeline: SHARPs–space-weather HMI active region patches. Sol. Phys. 289, 3549–3578. doi:10.1007/s11207-014-0529-3
Chen, B., Shen, C., Gary, D. E., Reeves, K. K., Fleishman, G. D., Yu, S., et al. (2020). Measurement of magnetic field and relativistic electrons along a solar flare current sheet. Nat. Astron. 4, 1140–1147. doi:10.1038/s41550-020-1147-7
Couvidat, S., Schou, J., Hoeksema, J. T., Bogart, R. S., Bush, R. I., Duvall, T. L., et al. (2016). Observables processing for the helioseismic and magnetic imager instrument on the solar dynamics observatory. Sol. Phys. 291, 1887–1938. doi:10.1007/s11207-016-0957-3
Davies, K. (1990). Ionospheric radio. Electromagnetic waves. London: Institution of Engineering and Technology. doi:10.1049/PBEW031E
DeRosa, M. L., Schrijver, C. J., Barnes, G., Leka, K. D., Lites, B. W., Aschwanden, M. J., et al. (2009). A critical assessment of nonlinear force-free field modeling of the solar corona for active region 10953. Astrophysical J. 696, 1780–1791. doi:10.1088/0004-637X/696/2/1780
Dodge, Y. (2008). “The concise encyclopedia of statistics,” in The concise encyclopedia of statistics (New York: Springer).
Eastwood, J., Biffis, E., Hapgood, M., Green, L., Bisi, M., Bentley, R., et al. (2017). The economic impact of space weather: where do we stand? Risk Anal. 37, 206–218. doi:10.1111/risa.12765
Efron, B., and Tibshirani, R. (1986). Bootstrap methods for standard errors, confidence intervals, and other measures of statistical accuracy. Stat. Sci. 1, 54–75. doi:10.1214/ss/1177013815
Falconer, D., Barghouty, A. F., Khazanov, I., and Moore, R. (2011). A tool for empirical forecasting of major flares, coronal mass ejections, and solar particle events from a proxy of active-region free magnetic energy. Space weather. 9. doi:10.1029/2009SW000537
Fleishman, G. D., Anfinogentov, S., Loukitcheva, M., Mysh’yakov, I., and Stupishin, A. (2017). Casting the coronal magnetic field reconstruction tools in 3D using the MHD bifrost model. Astrophysical J. 839, 30. doi:10.3847/1538-4357/aa6840
Fleishman, G. D., Gary, D. E., Chen, B., Kuroda, N., Yu, S., and Nita, G. M. (2020). Decay of the coronal magnetic field can release sufficient energy to power a solar flare. Science 367, 278–280. doi:10.1126/science.aax6874
Garland, S. H., Yurchyshyn, V. B., Loper, R. D., Akers, B. F., and Emmons, D. J. (2023). Evolution of coronal magnetic field parameters during x5.4 solar flare. Front. Astronomy Space Sci. 10. doi:10.3389/fspas.2023.1148293
Georgoulis, M. K., Bloomfield, D. S., Michele, M., Anna, M., Soldati, M., Gallagher, P. T., et al. (2021). The flare likelihood and region eruption forecasting (FLARECAST) project: flare forecasting in the big data and machine learning era. J. Space Weather Space Clim. 11, 39. doi:10.1051/swsc/2021023
Gupta, M., Thalmann, J. K., and Veronig, A. M. (2021). Magnetic helicity and energy budget around large confined and eruptive solar flares. Astronomy Astrophysics 653, A69. doi:10.1051/0004-6361/202140591
Hale, G. E., Ellerman, F., Nicholson, S. B., and Joy, A. H. (1919). The magnetic polarity of sun-spots. Astrophysical J. 49, 153. doi:10.1086/142452
Hoeksema, J. T., Liu, Y., Hayashi, K., Sun, X., Schou, J., Couvidat, S., et al. (2014). The helioseismic and magnetic imager (HMI) vector magnetic field pipeline: overview and performance. Sol. Phys. 289, 3483–3530. doi:10.1007/s11207-014-0516-8
Howard, R. (1967). Magnetic field of the sun (observational). Annu. Rev. Astronomy Astrophysics 5, 1–24. doi:10.1146/annurev.aa.05.090167.000245
Inoue, S., Kusano, K., Magara, T., Shiota, D., and Yamamoto, T. T. (2011). Twist and connectivity of magnetic field lines in the solar active region NOAA 10930. Astrophysical J. 738, 161. doi:10.1088/0004-637X/738/2/161
Jaeggli, S. A., and Norton, A. A. (2016). The magnetic classification of solar active regions 1992-2015. Astrophysical J. 820, L11. doi:10.3847/2041-8205/820/1/L11
James, A. W., Valori, G., Green, L. M., Liu, Y., Cheung, M. C. M., Guo, Y., et al. (2018). An observationally constrained model of a flux rope that formed in the solar corona. Astrophysical J. 855, L16. doi:10.3847/2041-8213/aab15d
Jarolim, R., Thalmann, J. K., Veronig, A. M., and Podladchikova, T. (2023). Probing the solar coronal magnetic field with physics-informed neural networks. Nat. Astron. 7, 1171–1179. doi:10.1038/s41550-023-02030-9
Jarolim, R., Tremblay, B., Rempel, M., Molnar, M., Veronig, A. M., Thalmann, J. K., et al. (2024). Advancing solar magnetic field extrapolations through multiheight magnetic field measurements. Astrophysical J. 963, L21. doi:10.3847/2041-8213/ad2450
Jiang, C., Feng, X., Guo, Y., and Hu, Q. (2022). Data-driven modeling of solar coronal magnetic field evolution and eruptions. Innovation 3, 100236. doi:10.1016/j.xinn.2022.100236
Jing, J., Liu, C., Lee, J., Ji, H., Liu, N., Xu, Y., et al. (2018). Statistical analysis of torus and kink instabilities in solar eruptions. Astrophysical J. 864, 138. doi:10.3847/1538-4357/aad6e4
Joint Science Operations Center (2023). HARP - HMI active region patches. http://jsoc.stanford.edu/jsocwiki/HARPDataSeries
Jones, H. P. (1985). Recent studies of magnetic canopies. Aust. J. Phys. 38, 919–928. doi:10.1071/PH850919
Kawabata, Y., Iida, Y., Doi, T., Akiyama, S., Yashiro, S., and Shimizu, T. (2018). Statistical relation between solar flares and coronal mass ejections with respect to sigmoidal structures in active regions. Astrophysical J. 869, 99. doi:10.3847/1538-4357/aaebfc
Kazachenko, M. D., Lynch, B. J., Savcheva, A., Sun, X., and Welsch, B. T. (2022). Toward improved understanding of magnetic fields participating in solar flares: statistical analysis of magnetic fields within flare ribbons. Astrophysical J. 926, 56. doi:10.3847/1538-4357/ac3af3
Kazachenko, M. D., Lynch, B. J., Welsch, B. T., and Sun, X. (2017). A database of flare ribbon properties from the solar dynamics observatory. i. reconnection flux. Astrophysical J. 845, 49. doi:10.3847/1538-4357/aa7ed6
Korsós, M. B., Georgoulis, M. K., Gyenge, N., Bisoi, S. K., Yu, S., Poedts, S., et al. (2020). Solar flare prediction using magnetic field diagnostics above the photosphere. Astrophysical J. 896, 119. doi:10.3847/1538-4357/ab8fa2
Korsós, M. B., Jarolim, R., Erdélyi, R., Veronig, A. M., Morgan, H., and Zuccarello, F. (2024). First insights into the applicability and importance of different 3d magnetic field extrapolation approaches for studying the preeruptive conditions of solar active regions. Astrophysical J. 962, 171. doi:10.3847/1538-4357/ad18bd
Korsós, M. B., Ludmány, A., Erdélyi, R., and Baranyi, T. (2015). On flare predictability based on sunspot group evolution. Astrophysical J. 802, L21. doi:10.1088/2041-8205/802/2/L21
Kuridze, D., Mathioudakis, M., Morgan, H., Oliver, R., Kleint, L., Zaqarashvili, T. V., et al. (2019). Mapping the magnetic field of flare coronal loops. Astrophysical J. 874, 126. doi:10.3847/1538-4357/ab08e9
Kusano, K., Iju, T., Bamba, Y., and Inoue, S. (2020). A physics-based method that can predict imminent large solar flares. Science 369, 587–591. doi:10.1126/science.aaz2511
Kutsenko, A. S., Abramenko, V. I., and Kutsenko, O. K. (2021). On the possibility of probing the flare productivity of an active region in the early stage of emergence. Mon. Notices R. Astronomical Soc. 501, 6076–6082. doi:10.1093/mnras/staa3548
Leka, K., and Barnes, G. (2007). Photospheric magnetic field properties of flaring versus flare-quiet active regions. iv. a statistically significant sample. Astrophysical J. 656, 1173–1186. doi:10.1086/510282
Leka, K., Barnes, G., and Wagner, E. (2018). The NWRA classification infrastructure: description and extension to the discriminant analysis flare forecasting system (DAFFS). J. Space Weather Space Clim. 8, A25. doi:10.1051/swsc/2018004
Leka, K. D., and Barnes, G. (2003). Photospheric magnetic field properties of flaring versus flare-quiet active regions. II. discriminant analysis. Astrophysical J. 595, 1296–1306. doi:10.1086/377512
Leka, K. D., Dissauer, K., Barnes, G., and Wagner, E. L. (2023). Properties of flare-imminent versus flare-quiet active regions from the chromosphere through the corona. II. Nonparametric discriminant analysis results from the NWRA classification infrastructure (NCI). Astrophysical J. 942, 84. doi:10.3847/1538-4357/ac9c04
Leka, K. D., Park, S.-H., Kusano, K., Andries, J., Barnes, G., Bingham, S., et al. (2019). A comparison of flare forecasting methods. III. systematic behaviors of operational solar flare forecasting systems. Astrophysical J. 881, 101. doi:10.3847/1538-4357/ab2e11
Lemen, J. R., Title, A. M., Akin, D. J., Boerner, P. F., Chou, C., Drake, J. F., et al. (2012). The atmospheric imaging assembly (AIA) on the solar dynamics observatory (SDO). Sol. Phys. 275, 17–40. doi:10.1007/s11207-011-9776-8
Li, H., Sakurai, T., Ichimoto, K., and UeNo, S. (2000). Magnetic field evolution leading to solar flares I. Cases with low magnetic shear and flux emergence. Astronomical Soc. Jpn. 52, 465–481. doi:10.1093/pasj/52.3.465
Lin, H., Penn, M. J., and Tomczyk, S. (2000). A new precise measurement of the coronal magnetic field strength. Astrophysical J. 541, L83–L86. doi:10.1086/312900
Liu, C., Deng, N., Wang, J. T. L., and Wang, H. (2017). Predicting solar flares using sdo/hmi vector magnetic data products and the random forest algorithm. Astrophysical J. 843, 104. doi:10.3847/1538-4357/aa789b
Liu, R., Kliem, B., Titov, V. S., Chen, J., Wang, Y., Wang, H., et al. (2016). Structure, stability, and evolution of magnetic flux ropes from the perspective of magnetic twist. Astrophysical J. 818, 148. doi:10.3847/0004-637X/818/2/148
Livingston, W. C., Harvey, J., Pierce, A. K., Schrage, D., Gillespie, B., Simmons, J., et al. (1976). Kitt peak 60-cm vacuum telescope. Appl. Opt. 15, 33–39. doi:10.1364/AO.15.000033
Lu, Y., Wang, J., and Wang, H. (1993). Shear angle of magnetic fields. Sol. Phys. 148, 119–132. doi:10.1007/BF00675538
MacTaggart, D., Prior, C., Raphaldini, B., Paolo, R., and Guglielmino, S. (2021). Direct evidence that twisted flux tube emergence creates solar active regions. Nat. Commun. 12, 6621. doi:10.1038/s41467-021-26981-7
Mason, J. P., and Hoeksema, J. T. (2010). Testing automated solar flare forecasting with 13 Years of michelson Doppler imager magnetograms. Astrophysical J. 723, 634–640. doi:10.1088/0004-637X/723/1/634
McIntosh, P. S. (1990). The classification of sunspot groups. Sol. Phys. 125, 251–267. doi:10.1007/BF00158405
Murray, S. A., Bloomfield, D. S., and Gallagher, P. T. (2013). Evidence for partial taylor relaxation from changes in magnetic geometry and energy during a solar flare. Astronomy Astrophysics 550, A119. doi:10.1051/0004-6361/201219964
Nakariakov, V. M., and Ofman, L. (2001). Determination of the coronal magnetic field by coronal loop oscillations. Astronomy Astrophysics 372, L53–L56. doi:10.1051/0004-6361:20010607
Nita, G. M., Fleishman, G. D., Kuznetsov, A. A., Anfinogentov, S. A., Stupishin, A. G., Kontar, E. P., et al. (2023). Data-constrained solar modeling with gx simulator. Astrophysical J. Suppl. Ser. 267, 6. doi:10.3847/1538-4365/acd343
Nita, G. M., Fleishman, G. D., Kuznetsov, A. A., Kontar, E. P., and Gary, D. E. (2015). Three-dimensional radio and X-ray modeling and data analysis software: revealing flare complexity. Astrophysical J. 799, 236. doi:10.1088/0004-637X/799/2/236
Nita, G. M., Viall, N. M., Klimchuk, J. A., Loukitcheva, M. A., Gary, D. E., Kuznetsov, A. A., et al. (2018). Dressing the coronal magnetic extrapolations of active regions with a parameterized thermal structure. Astrophysical J. 853, 66. doi:10.3847/1538-4357/aaa4bf
Nitta, N., van Driel-Gesztelyi, L., Leka, K., and Shibata, K. (1996). Emerging flux and flares in noaa 7260. Adv. Space Res. 17, 201–204. doi:10.1016/0273-1177(95)00568-y
Norsham, N., Hamidi, Z., and Shariff, N. (2022). Correlation between mount wilson classifications to solar flares using solar dynamics observatory (sdo) and hinode satellites. J. Mech. Eng. 19, 113–126. doi:10.24191/jmeche.v19i1.19690
Pariat, E., Leake, J. E., Valori, G., Linton, M. G., Zuccarello, F. P., and Dalmasse, K. (2017). Relative magnetic helicity as a diagnostic of solar eruptivity. Astronomy Astrophysics 601, A125. doi:10.1051/0004-6361/201630043
Patsourakos, S., Vourlidas, A., Török, T., Kliem, B., Antiochos, S., Archontis, V., et al. (2020). Decoding the pre-eruptive magnetic field configurations of coronal mass ejections. Space Sci. Rev. 216, 131. doi:10.1007/s11214-020-00757-9
Priest, E. R., and Forbes, T. G. (2002). The magnetic nature of solar flares. Astronomy Astrophysics Rev. 10, 313–377. doi:10.1007/s001590100013
Reep, J. W., and Knizhnik, K. J. (2019). What determines the X-ray intensity and duration of a solar flare? Astrophysical J. 874, 157. doi:10.3847/1538-4357/ab0ae7
Roberts, B., Edwin, P. M., and Benz, A. O. (1984). On coronal oscillations. Astrophysical J. 279, 857–865. doi:10.1086/161956
Schou, J., Scherrer, P. H., Bush, R. I., Wachter, R., Couvidat, S., Rabello-Soares, M. C., et al. (2012). Design and ground calibration of the helioseismic and magnetic imager (HMI) instrument on the solar dynamics observatory (SDO). Sol. Phys. 275, 229–259. doi:10.1007/s11207-011-9842-2
Shibata, K., and Magara, T. (2011). Solar flares: magnetohydrodynamic processes. Living Rev. Sol. Phys. 8, 6. doi:10.12942/lrsp-2011-6
Smith, S. F., and Howard, R. (1968). “Magnetic classification of active regions,” in Structure and development of solar active regions. Editor K. O. Kiepenheuer (Berlin, Germany: Springer), 33.
Sun, X., Hoeksema, J. T., Liu, Y., Kazachenko, M., and Chen, R. (2017). Investigating the magnetic imprints of major solar eruptions with SDO/HMI high-cadence vector magnetograms. Astrophysical J. 839, 67. doi:10.3847/1538-4357/aa69c1
Sun, X., Hoeksema, J. T., Liu, Y., Wiegelmann, T., Hayashi, K., Chen, Q., et al. (2012). Evolution of magnetic field and energy in a major eruptive active region based on SDO/HMI observation. Astrophysical J. 748, 77. doi:10.1088/0004-637X/748/2/77
Svalgaard, L., Duvall, J. T. L., and Scherrer, P. H. (1978). The strength of the Sun’s polar fields. Sol. Phys., 29029. doi:10.1007/BF00157268
Thalmann, J. K. (2010). Evolution of coronal magnetic fields. Ph.D. thesis. Germany: Technical University of Braunschweig.
Thalmann, J. K., Sun, X., Moraitis, K., and Gupta, M. (2020). Deducing the reliability of relative helicities from nonlinear force-free coronal models. Astronomy Astrophysics 643, A153. doi:10.1051/0004-6361/202038921
Thalmann, J. K., Tiwari, S. K., and Wiegelmann, T. (2013). Comparison of force-free coronal magnetic field modeling using vector fields from hinode and solar dynamics observatory. Astrophysical J. 769, 59. doi:10.1088/0004-637X/769/1/59
Thalmann, J. K., and Wiegelmann, T. (2008). Evolution of the flaring active region NOAA 10540 as a sequence of nonlinear force-free field extrapolations. Astronomy Astrophysics 484, 495–502. doi:10.1051/0004-6361:200809508
Wang, H., Ji, H., Schmahl, E. J., Qiu, J., Liu, C., and Deng, N. (2002). Sudden disappearance of a small sunspot associated with the 2002 february 20 M2.4 flare. Astrophysical J. 580, L177–L180. doi:10.1086/345713
Wang, S., Liu, C., and Wang, H. (2012). The relationship between the sudden change of the lorentz force and the magnitude of associated flares. Astrophysical J. Lett. 757, L5. doi:10.1088/2041-8205/757/1/L5
Whitney Aegerter, T. R., Emmons, D. J., and Loper, R. D. (2020). Detection of reconnection signatures in solar flares. J. Atmos. Solar-Terrestrial Phys. 208, 105375. doi:10.1016/j.jastp.2020.105375
Wiegelmann, T., Petrie, G. J. D., and Riley, P. (2017). Coronal magnetic field models. Space Sci. Rev. 210, 249–274. doi:10.1007/s11214-015-0178-3
Wiegelmann, T., and Sakurai, T. (2021). Solar force-free magnetic fields. Living Rev. Sol. Phys. 18, 1. doi:10.1007/s41116-020-00027-4
Yamamoto, T. T., and Sakurai, T. (2009). Correlations between flare parameters and magnetic parameters in solar flares. Publ. Astronomical Soc. Jpn. 61, 75–84. doi:10.1093/pasj/61.1.75
Yeates, A. R., Amari, T., Contopoulos, I., Feng, X., Mackay, D. H., Mikić, Z., et al. (2018). Global non-potential magnetic models of the solar corona during the March 2015 eclipse. Space Sci. Rev. 214, 99. doi:10.1007/s11214-018-0534-1
Yurchyshyn, V., Yang, X., Nita, G., Fleishman, G., Abramenko, V., Inoue, S., et al. (2022). Magnetic field re-configuration associated with a slow rise eruptive x1.2 flare in noaa active region 11944. Front. Astronomy Space Sci. 9. doi:10.3389/fspas.2022.816523
Keywords: solar corona, solar photosphere, solar magnetic field, active region, solar flares, NLFFF extrapolation
Citation: Garland SH, Yurchyshyn VB, Loper RD, Akers BF and Emmons DJ (2024) Analysis of modeled 3D solar magnetic field during 30 X/M-class solar flares. Front. Astron. Space Sci. 11:1369749. doi: 10.3389/fspas.2024.1369749
Received: 12 January 2024; Accepted: 02 April 2024;
Published: 10 May 2024.
Edited by:
Luca Sorriso-Valvo, National Research Council (CNR), ItalyReviewed by:
Qiang Hu, University of Alabama in Huntsville, United StatesChristopher Prior, Durham University, United Kingdom
Robertus Erdelyi, The University of Sheffield, United Kingdom
Copyright © 2024 Garland, Yurchyshyn, Loper, Akers and Emmons. This is an open-access article distributed under the terms of the Creative Commons Attribution License (CC BY). The use, distribution or reproduction in other forums is permitted, provided the original author(s) and the copyright owner(s) are credited and that the original publication in this journal is cited, in accordance with accepted academic practice. No use, distribution or reproduction is permitted which does not comply with these terms.
*Correspondence: Seth H. Garland, U2V0aC5HYXJsYW5kQGFmaXQuZWR1
 Seth H. Garland
 Vasyl B. Yurchyshyn
 Robert D. Loper
 Benjamin F. Akers4
 Daniel J. Emmons