 Mohamad E. Abdelaal1,2*†
 Igor. V. Dokuchaev2‡Elena A. Malinovskaya3†Stanislav I. Klimov2‡Genady G. Dolnikov2‡Alexander V. Zakharov2†
- 1Space Physics Department, Moscow Institute of Physics and Technology, Dolgoprudny, Russia
- 2Planetary Physics Department, Space Research Institute of the Russian Academy of Science, Moscow, Russia
- 3Geophysical Hydrodynamics Department, Institute of Atmospheric Physics, Russian Academy of Sciences, Moscow, Russia
The upper atmosphere, comprising the mesosphere and thermosphere, is intricately influenced by various atmospheric and magnetospheric impacts. Various atmospheric waves excited in the troposphere can propagate into the mesosphere-thermosphere (M-T) region, altering its dynamics. Additionally, large-scale disturbances in the middle atmosphere, such as sudden stratospheric warming and geomagnetic disturbances induced by solar activity, affect the upper atmosphere. To better understand these complex processes, observations from multiple platforms and instruments, along with modeling studies, are necessary. This study presents experimental investigations into the electromagnetic signatures generated by atmospheric discharge conditions, including breakdown events and interactions of charged dust particles. A vacuum chamber was used to simulate upper atmospheric conditions. An electromagnetic signal analyzer (EMA) registered signals generated from the atmospheric discharge and the electromagnetic signature of charged dust particles. The results of the experimental investigations revealed distinctive electromagnetic processes occurring during breakdown events and charged particle interactions within Earth’s atmosphere. Signals recorded by the electromagnetic signal analyzer provided valuable insights into the characteristics of atmospheric discharge conditions and the behavior of charged dust particles. The findings contribute to our understanding of the complex interactions in the upper atmosphere. Further analysis of the results highlights the significance of the atmospheric discharge, electromagnetic processes, and dust particle interactions in shaping the dynamics of this region. The experimental approach presented in this study offers a valuable tool for studying atmospheric processes and their implications for space weather dynamics.
1 Introduction
The upper atmosphere of Earth, extending from about 50 km above the surface and reaching into the exosphere, is a dynamic and complex environment teeming with various atmospheric phenomena. This region, encompassing the mesosphere, thermosphere, and beyond, plays a crucial role in regulating the planet’s climate, weather patterns, and interactions with space. The upper atmosphere presents a diverse array of scientific phenomena for investigation, ranging from the captivating manifestations of transient luminous events to the complex interplay of charged particles and electromagnetic radiation (Kato, 1980).
The mesosphere-thermosphere (M-T) system, spanning altitudes from approximately 50–600 km above the Earth’s surface, exhibits complex interactions influenced by both the lower atmosphere and magnetospheric effects (Kivelson and Russell, 1995) (Figure 1). With extremely low air pressure constituting approximately 0.1% of the pressure experienced at the Earth’s surface and temperatures dropping to −90°C, the mesosphere is characterized by its cold and sparse nature (Aikin et al., 1991; Meriwether and Gardner, 2000). The thermosphere, extending from the mesopause to about 600 km, undergoes ionization and dissociation induced by ultraviolet radiation, leading to the formation of ions (Andrews, Holton, and Leovy, 1987; Prolss, 2004). The thermosphere has high temperatures and variability due to solar ultraviolet radiation and geomagnetic activity (Kazimirovsky, 1989; Fagundes et al., 2001).
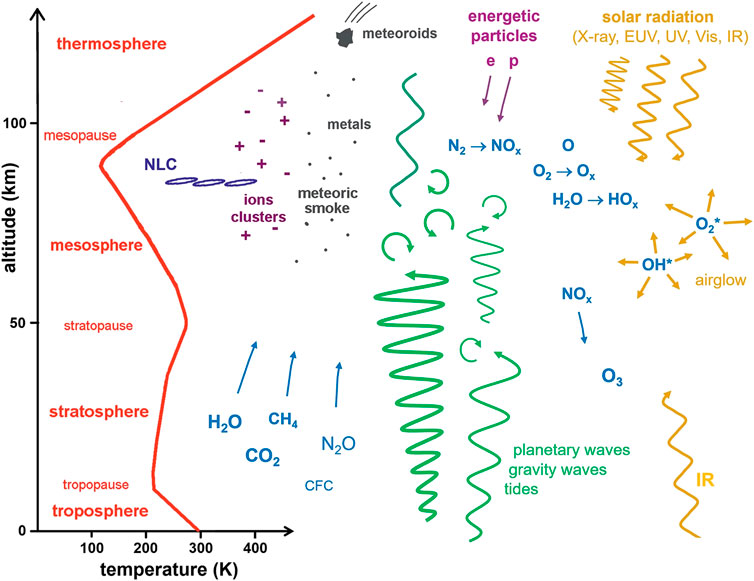
Figure 1. A schematic overview depicts the important processes governing the composition and chemistry of the mesosphere and lower thermosphere (MLT). Arrows denote key processes, including vertical temperature profiles, wave activity, energy inputs from above (solar radiation), energetic particle precipitation, and species transport. For a detailed exploration of these processes, readers are referred to the comprehensive literature (J. Plane et al. (2023)).
The upper regions of the Earth’s atmosphere host a variety of phenomena, with one notable example being Transient Luminous Events (TLEs) (V. V. Surkov and Hayakawa, 2012). These events encompass a variety of luminous across a broad frequency spectrum, ranging from ELF to UHF, including sprites, blue jets, elves, and gigantic jets, each with distinct characteristics and origins. Sprites are observed at altitudes of approximately 50–90 km above sea level and are often associated with intense positive cloud-to-ground lightning. Blue jets, on the other hand, project upward from the tops of thunderstorm clouds to heights of around 15–40 km. Elves, occurring at bottom of the ionosphere at 90 km altitude, result from the interaction between lightning-induced electromagnetic pulses and the ionosphere. Additionally, gigantic jets, first discovered in the early 2000s, extend from thunderclouds all the way to the ionosphere, potentially short-circuiting the cloud charge to the upper atmosphere. (Füllekrug, Mareev, and Rycroft, 2006; Schultz, 2013; Vadim V.; Surkov and Hayakawa, 2020; Boggs et al., 2022). These phenomena highlight the complex interactions between atmospheric electricity, convective processes, and the ionospheric environment, shedding light on the intricate dynamics of Earth’s atmosphere across multiple layers.
In the M-T system, dust particles play a significant role, complicating its dynamics. These particles possess a diverse range of characteristics, including different sizes and compositions. Studies indicate the presence of micron and submicron-sized particles in the mesosphere and thermosphere, which can have distinct interactions with the surrounding plasma environment (O. Havnes et al., 1996). Dust particles in the mesosphere can become charged through several processes, including the attachment of plasma particles (electrons and ions), leading to positive or negative charges, and photoemission. In turn, charged dust particles affect the surrounding plasma. Negatively charged dust can act as electron sinks, potentially causing localized depletion of electrons. Conversely, positively charged dust can increase local electron density, primarily through processes like photoionization.
These interactions extend to fundamental changes in electron and ion diffusivity, affecting the effective conductivity of the plasma. The presence of charged dust particles in the mesospheric plasma leads to a reduction in diffusivity, creating a transition to reduced diffusivity as a significant portion of the charge is absorbed by the dust particles. This reduction, in turn, influences the effective conductivity of electrons and ions, altering the electrical structure of the mesosphere. Additionally, charged dust particles contribute to the generation of electric fields in the mesosphere, impacting the electrical dynamics. Furthermore, the potential production of secondary plasma upon the impact of charged dust particles adds complexity to the overall plasma environment, influencing measured currents and introducing heterogeneities (Zadorozhny, 2001; Mallios et al., 2022).
Understanding the dynamics of dust particles in the upper atmospheric layers involves considering several key factors. Solar activity, especially solar wind and ultraviolet radiation, significantly influences the charging and behavior of dust particles in the upper layers of the atmosphere (Klumov et al., 2000). Additionally, atmospheric waves originating in the lower layers of the atmosphere can propagate upward, influencing the distribution and movement of dust particles in the mesosphere and thermosphere (Havnes et al., 2001).
Sources of dust particles in the atmosphere are diverse, including both natural and anthropogenic origins. Extraterrestrial particles, including micrometeoroids, play a significant role in atmospheric dynamics (J. M. Plane, 2012; J. M. C; Plane et al., 2018). In addition to these extraterrestrial sources, terrestrial events such as volcanic eruptions and industrial activities contribute to the injection of solid particles into the upper layers of the Earth’s atmosphere. (Xu, 2014; Genge, 2018). Understanding the sources of these particles is crucial for unraveling the complex interaction between natural and anthropogenic processes in the upper atmosphere.
Comprehending the physical processes within the atmospheric system is crucial, given its pivotal involvement in ionospheric activities. Solar UV radiation, the primary cause of ionization, transforms this layer into a dynamic arena that significantly influences the propagation of radio waves (Kivelson and Russell, 1995). Moreover, the M-T system serves as a stage for crucial energy transfers and atmospheric wave phenomena, determining the temperature and dynamics of this critical region.
In the context of advancements in mesosphere and thermosphere dynamics, the study of atmospheric electromagnetic phenomena becomes a crucial experimental task. This understanding extends beyond the M-T region, playing a key role in global atmospheric circulation models and the energy balance of neutral and ionized particles in the upper atmosphere (Marshall et al., 2008). Additionally, the sensitivity of the M-T system to space weather phenomena underscores its relevance to this specialized field. To comprehend the complex processes inherent in the M-T system, a comprehensive approach is necessary, involving observations using multiple different instruments (Schlegel, 2007). These observations, combined with laboratory modeling studies, offer a holistic view of the atmospheric dynamics.
The study of electromagnetic radiations generated by thunderstorm discharges in the low-frequency range has been dedicated to the magnetic-wave complex (MWC) of the microsatellite “Chibis-M,” including sensors sensitive to the electrical and magnetic parameters of space plasma. These sensors measure one electric component and three vector components of the magnetic field in the frequency range from 0.1 Hz to 40 kHz (Klimov et al., 2010; Zelenyi et al., 2014). The primary mode of operation of the electromagnetic complex involves monitoring electromagnetic activity using onboard spectral analysis of registered signals and subsequent data download to ground stations. This mode enables global monitoring of variations in broadband electromagnetic oscillations in the ionosphere. During the experiment, data were obtained on the interaction of plasma waves in the ionosphere, especially under the influence of storm activity, reflecting powerful natural and anthropogenic processes in the Lithosphere-Atmosphere-Ionosphere-Magnetosphere system (Korepanov et al., 2014).
Interesting data were obtained on wave packets resembling “pearls” with a central frequency of approximately 0.6 Hz, corresponding to typical frequencies of ion cyclotron waves (Pc1 pulsations) (Figure 2). These observations with an electric field amplitude of about 40 V/m not only expanded the understanding of similar signals recorded by low-orbit satellites but also revealed the excitation of the ionospheric Alfven resonance (IAR) during daylight hours. Contrary to the prevailing opinion that IAR is predominantly a nocturnal phenomenon, the data from “Chibis-M” demonstrate cases of daytime excitation, broadening our understanding of electromagnetic Alfvenic structures in the upper ionosphere. These results make a significant contribution to a broader understanding of atmospheric electromagnetic phenomena and their diurnal dynamics (Korepanov et al., 2014).
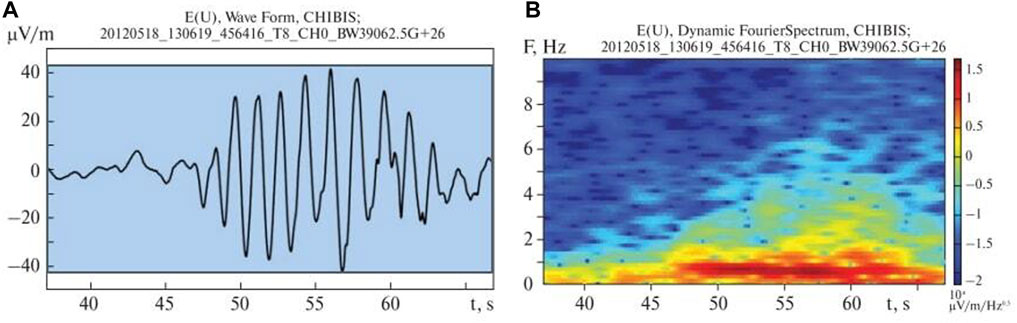
Figure 2. (A) Signals of the “pearl” type; (B) Signal dynamic spectrum. Korepanov et al. (2014).
This study focuses on laboratory research aimed at modeling electromagnetic processes occurring under conditions relevant to near-surface dust formation using piezo ignition, while also exploring the upper atmosphere of Earth in the presence of charged dust particles under vacuum. Investigating the characteristics of electromagnetic processes, we utilize a small 3D-printed chamber equipped with an electromagnetic analyzer. This setup allows us to investigate the characteristics of electromagnetic processes arising from atmospheric discharge in the presence of dust particles under conditions close to the upper atmosphere.
2 Processes involving dust particles and their impact on the atmosphere
Physical processes involving dust particles in the mesosphere and thermosphere of Earth are crucial for understanding the complex dynamics of the upper atmospheric layers. Dust particles in the Earth’s atmosphere originate from diverse sources, including volcanic eruptions, industrial emissions, meteoric debris, desert dust storms, and anthropogenic activities like agriculture, deforestation, and construction. Additionally, biological sources, involving plants, fungi, and microorganisms, contribute organic particles to atmospheric dust. This complex interplay of sources emphasizes the multifaceted nature of dust dynamics in the mesosphere and thermosphere (Xu, 2014; Bullard et al., 2016). The composition of mesospheric dust particles includes metallic elements such as Fe, Mg, Si, and Na, as well as oxides, hydroxides, and carbonates. While the majority of atmospheric dust resides in the lower layers, some particles ascend to the mesosphere and thermosphere (J. M. Plane, 2012).
Cosmic dust particles, formed by the sublimation of comets and collisions of asteroids, enter the atmosphere with hypervelocity speeds (11–72 km/s) and ablate at altitudes ranging from 75 to 120 km in the mesosphere and lower thermosphere. Formed metallic vapors then oxidize and recondense, creating nanoscale particles known as “meteoric smoke particles (MSP).” These MSPs are too small to settle downward and are transported by the general atmospheric circulation, taking approximately 4 years to reach the surface (Carrillo-Sánchez et al., 2016; J. M; Plane, 2012). These MSPs can act as ice condensation nuclei, influencing charge balances in the upper mesosphere and leading to phenomena such as polar mesospheric clouds and summer polar mesospheric echoes. The distribution of these solid particles, determined by neutral atmospheric dynamics, provides a connection between atmospheric layers (Gunnarsdottir et al., 2023; Inhester et al., 1994).
Understanding the intricacies of atmospheric processes responsible for the upward movement of dust particles in the atmosphere is essential for comprehending the dynamics of Earth’s mesosphere and thermosphere. Various atmospheric processes, including convective currents and wind patterns, contribute to this upward movement.
2.1 Processes uplifting dust particles in the atmosphere
In the lower atmosphere, diverse processes contribute to the upward movement of dust particles, shaping their distribution and influencing atmospheric dynamics. Convective flows and wind regimes play pivotal roles in this vertical transport. Convective currents, initiated by temperature differences, induce upward air movement in the troposphere, the lowest atmospheric layer. This convective overturning facilitates the lifting of dust particles from the Earth’s surface to higher atmospheric levels (Roberts and Knippertz, 2012; Corr et al., 2016). Wind patterns associated with convective processes further contribute to vertical dust transport, wherein dust particles can be carried aloft by wind currents generated by convective storms (Bukowski and van den Heever, 2020; Garcia-Carreras et al., 2021). Additionally, dust particles may be ejected into reactive streams from high-altitude sources, such as volcanic eruptions, adding to the complex dynamics of dust movement in the lower atmosphere (Prospero, 1999).
In the upper atmosphere, the dynamics of dust particle transport are governed by a combination of atmospheric waves and solar-driven processes. Atmospheric waves, including gravity waves and planetary waves, induced by sources like storms and terrain, introduce vertical motion, lifting dust particles into the mesosphere and thermosphere. These waves establish a crucial linkage between lower and upper atmospheric layers, influencing the distribution of particulate matter (Medvedev and Yiğit, 2019). Simultaneously, solar radiation contributes to the upward movement of dust particles on Earth through a combination of direct and indirect effects. Directly, solar radiation heats the Earth’s surface, creating temperature gradients that lead to the warming of the air in contact with the ground. This warming results in the formation of thermals and dust devils, which are upward-moving air currents. These thermals can entrain and uplift dust particles from the surface into the lower atmosphere. Additionally, solar radiation drives atmospheric circulation, leading to the upward movement of air masses. As a result, dust particles present in the lower atmosphere can be carried to higher altitudes through this circulation, contributing to the vertical transport of dust particles. Indirectly, solar-driven ionospheric processes interact with dust grains, further influencing their dynamics and participating in the overall vertical transport of particles in the upper atmospheric layers (Schepanski et al., 2014; Zereg et al., 2022).
The size and charge of dust particles significantly influence their growth rate, chemical processes, and the formation of various atmospheric phenomena.
2.2 Growth rates
The growth rate of dust particles in Earth’s atmosphere is a complex and variable process influenced by multiple factors. Particle aging is mostly dependent on the size distribution of the particles; larger particles are more likely to settle by gravity, whilst tiny particles can function as effective nuclei for ice and cloud condensation. The faster the growth rate, the greater the potential for these particles to serve as effective cloud seeds (Weinzierl et al., 2017). The growth rate of dust particles in the Earth’s atmosphere plays a pivotal role in shaping their behavior and influencing atmospheric dynamics. The rate of growth directly impacts the size distribution of particles, determining their residence time in the atmosphere and potential for long-range transport.
2.3 Chemical processes
The size and charge of dust particles also influence chemical processes. Surface charging of insulators creates long-range attractive forces acting on dust particles. Concentrations of major, minor, and trace elements in road dust are associated with the fine (<45 μm) fraction. Fine heavy micro-particles (<10 μm in size) are more prevalent in the finest (<45 μm) than in larger dust fractions (B. S. Yilbas et al., 2019; Yilbas et al., 2015).
2.4 Atmospheric phenomena
The size and charge of dust particles significantly impact the formation of various atmospheric phenomena. Dust particles can substantially influence Earth’s radiative balance by scattering and absorbing solar radiation. They also affect cloud formation and properties, acting as cloud condensation nuclei (CCN) and ice nuclei (Weinzierl et al., 2017). Dust particles can induce radiative feedback in the planetary boundary layer and be lifted to higher altitudes, impacting the spatial heterogeneity of dust loading, radiative fluxes, and planetary boundary layer (PBL) height variations (Zhang et al., 2022). Dust particles in the atmosphere can acquire charge through collision-induced mechanisms, dependent on their electrical behavior. The triboelectric effect, relevant for insulating particles, leads to predominantly positive charges on larger particles and negative charges on smaller ones. Alternatively, for conductive particles polarized by a large-scale electric field, an inductive charging mechanism occurs, resulting in positive charges on larger particles and negative charges on smaller ones (Latham et al., 1997; Mallios et al., 2022). Large-scale atmospheric electric fields, generated by potential differences between the Ionosphere and Earth’s surface due to thunderstorms, solar wind-magnetosphere interaction, and atmospheric tides, introduce electrical forces on charged dust particles. These forces can impact particle settling by either balancing gravitational forces based on charge polarity and electric field direction or inducing electrical torque on non-spherical particles, altering their orientation (Bering et al., 1998). The influence of electrostatic forces on the lifetime of dust particles in the atmosphere is a subject of ongoing scientific investigation, marked by an unresolved debate. Hypotheses propose that electrostatic forces may contribute to extending dust particle lifetimes, yet the extent of this impact remains uncertain. This uncertainty is further underscored by the unknown effect of electrical forces on dust particles, highlighted by experiments favoring their significance but conducted in controlled laboratory conditions with limited applicability to realistic settings. Additionally, theoretical works suggesting the potential insignificance of electrical forces lack the essential experimental or observational verification needed to definitively resolve this ambiguity. The complexities of atmospheric conditions, particle properties, and the interplay of various forces contribute to the intricate nature of this ongoing scientific inquiry.
3 Electromagnetic analyzer (EMA): probing electromagnetic signatures induced by dust
The Electromagnetic Analyzer (EMA) is a sensor integrated into the Dust Complex (DC) and was designed for investigating electromagnetic radiation generated by discharges of dust particles during the dynamics of Martian dust storms as part of the ExoMars spacecraft (Zakharov et al., 2022). Developed to address the unique challenges of the Martian environment, the EMA device allows for measurements of electromagnetic emissions, including micro-discharges, with high sensitivity. The key components of EMA include a 0.9 m antenna deployed on an extending boom and an electronic amplifier board equipped with an analog-to-digital converter (ADC) and a controller, housed in the IS-1 block. The measured bandwidth of the instrument, verified at maximum gain (80 dB), ranges from 0.12 to 1.5 MHz at a 3 dB level. Notably, the sensitivity of EMA at the amplifier input is 7 μV, providing a signal-to-noise ratio of 6 dB.
3.1 Experimental setup and methodology
To investigate electromagnetic phenomena induced by dust, a laboratory experiment was conducted, simulating conditions characteristic of the processes occurring during the dynamics of charged dust particles in rarified atmospheric conditions of dust formations. Discharges were modeled using a silicon lighter, and high-voltage breakdown occurred in the presence of charged microparticles.
Electromagnetic signals, emanating from diverse atmospheric phenomena, exhibit a rich spectrum of frequencies and amplitudes, offering valuable insights into the underlying physical processes. In our research, signals were recorded in the time domain, capturing the temporal evolution of electromagnetic phenomena. The amplitude values in the time-domain representation depict the overall intensity of the signals during specific time intervals. These signals, intricate in their composition, encompass a multitude of frequency components contributing to their complexity.
Upon spectral analysis using Fast Fourier Transform (FFT), specific frequency components within the signal spectra were unveiled. It is noteworthy that the dominant frequency, as discerned in the frequency domain, often diverges from the overall amplitude recorded in the time domain. For instance, while the maximum amplitude observed in the FFT window may signify the strength of a particular frequency component, it affords a nuanced understanding of the signal’s composition. These findings underscore the imperative of scrutinizing electromagnetic signals from both temporal and spectral standpoints to gain deeper insights into their frequency composition and temporal evolution.
In the subsequent sections, we delve into the significance of these frequency components, their potential implications on the atmospheric regions, and the broader atmospheric implications of the recorded electromagnetic phenomena.
3.2 Piezo ignition experiment
In the first experiment, a controlled mechanism for modeling discharge processes in the Earth’s atmosphere utilized a piezo-ignition system. In the Piezo Ignition Experiment, we employed a piezo ignition component extracted from a standard piezo lighter to investigate electromagnetic phenomena. This component, designed for initiating combustion in gas-powered devices, was repurposed to generate signals in the ambient air under standard room temperature and atmospheric pressure. Notably, unlike conventional experiments involving controlled gas environments, our approach did not employ specific gases to simulate Earth’s atmosphere. Instead, when the piezo ignition component was turned on, electrical discharges that were 20 cm away from the antenna were released into the surrounding air generating a spark (Figure 3). This unique setup allowed us to explore the electromagnetic responses under realistic atmospheric conditions without the confounding factors associated with gas-based simulations. The signals generated by the piezo ignition were then captured at different distances from the electromagnetic analyzer, providing valuable insights into the dynamics of electromagnetic phenomena in the upper atmosphere.
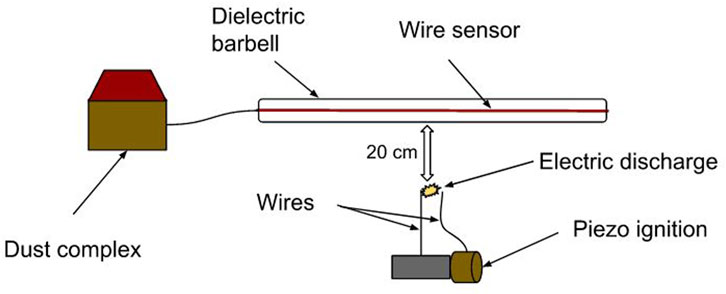
Figure 3. A schematic representation of the piezo ignition experiment setup.
3.3 Experiment in a vacuum chamber
In this experiment, we investigated the phenomena of high-voltage breakdown within a controlled vacuum environment. The experimental configuration involved positioning an electromagnetic sensor at a fixed distance of 10 cm beneath an induction cylinder measuring 7 cm in length and 3 cm in diameter. This cylinder was secured at the same distance below the centrally located injector within the vacuum chamber. The injector was filled with dust particles like Iron powder with particle sizes of 800 nm and 5 μm, along with Tungsten particles measuring 30 μm, were chosen as the materials for injection. After carefully sealing the chamber, the injector was connected to a high-voltage source (Figure 4).
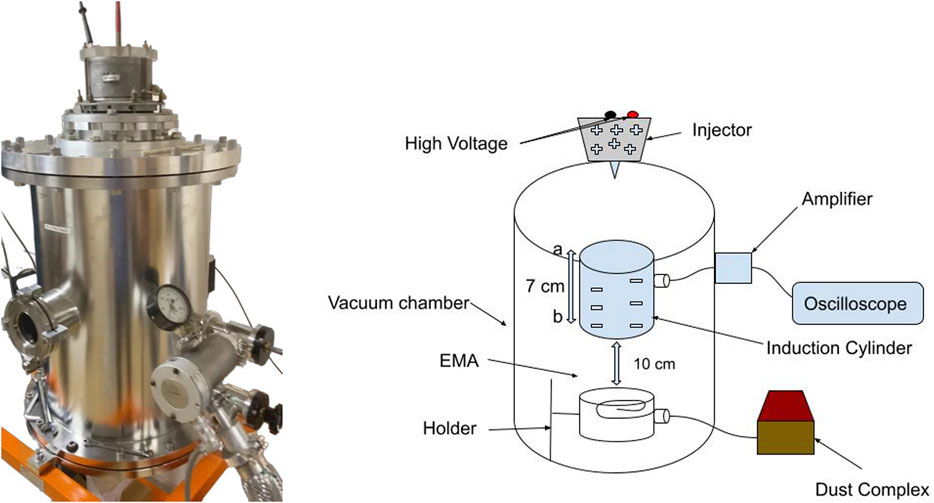
Figure 4. Photo and schematic representation of the experimental Setup for breakdown registration in the vacuum chamber.
The injector utilized in our experiments, developed at the Skobeltsyn Institute of Nuclear Physics Lomonosov Moscow State University (SINP MSU) (Novikov et al., 1997; Семкин et al., 2008) plays a pivotal role in charging and accelerating solid micro-particles with a common range of accelerating voltages from 0.2 to 4.0 MV (Novikov et al., 2005). Predominantly, metallic particles such as Al, Cr, Fe, Ni, Cu, Mo, W, Ti, etc., can be accelerated. The transverse dimensions of the accelerated particles range from 800 nm to 40 μm. At the specified accelerating voltages, particle velocities range from 3 to 100 m/s, with smaller and lighter particles achieving higher velocities under fixed accelerating voltages. The particle flux intensity ranges from one to two particles per unit time. The principle of electrostatic acceleration of solid microparticles is that the solid particles must first acquire an electric charge.
Figure 5 illustrates the design of the charged particle injector developed at SINP MSU. Metal particles are placed on the inner surface of the charging electrode, while a voltage is applied to the charging electrode, and the hopper electrode is grounded. In the presence of an electric field between the hopper and charging electrodes, the dust particles in the hopper chamber begin to rise. As the hopper chamber fills with particles, the electrical conductivity of the gap between the hopper and charging electrodes will increase. During this process, particles come into contact with the tungsten needle of the charging electrode, acquiring an electric charge of the same polarity as the needle upon contact. Subsequently, they are ejected by the electric field of the charging electrode and enter the vacuum chamber, where they interact with bombarded targets and sensors for detection.
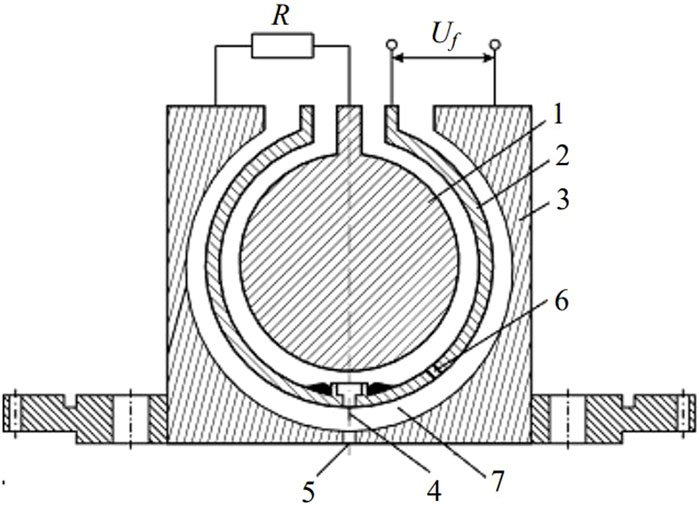
Figure 5. Design of a charged particle injector with constant voltage on a hopper electrode: 1 — hopper electrode; 2 — charging electrode; 3 — housing; 4 — needle; 5 — outlet port; 6 — hole between the hopper and charging chambers; 7 — charging chamber. Семкин et al. (2008).
The maximum charge that can be imparted to the accelerated particle is limited by auto electron emission (for negative particle charging) or auto ion emission (for positive charging) processes. These emission processes occur at critical values of the electric field intensity, namely, 109 V/m and 1010 V/m, respectively, leading to the preference for positively charged particles in experiments. The relationship between particle velocity and the potential applied to the charging electrode, as described in (Семкин et al., 2008), exhibits two distinct regimes. In the first regime, particle velocity increases linearly with the voltage applied to the charging electrode, allowing for direct control of particle velocity at lower voltage levels. However, in the second regime, the relationship becomes non-linear, with particle velocity proportional to the square root of the voltage applied to the charging electrode. Consequently, as voltage surpasses a certain threshold, the rate of increase in particle velocity diminishes.
To initiate the experiment, the vacuum was gradually initiated until reaching a minimal pressure of 6 × 10⁻³ mbar. An amplifier with a signal amplification coefficient of (7.7 × 10¹² C/V) was intricately connected to the induction cylinder. This setup allowed for the recording of signals during the experiments, providing a comprehensive study of signal characteristics, including amplitude, frequency, and temporal dynamics. The oscilloscope was employed to visualize and analyze these signals, enabling a detailed comparison with data obtained from the Electromagnetic Analyzer (EMA).
Upon reaching the minimum pressure in the vacuum chamber, the injector’s high voltage was incrementally increased from 1 kV to 10 kV, and the corresponding signals were monitored on the oscilloscope. Simultaneously, the EMA’s program featured an opened time window for recording breakdown signals at various voltages, with specific attention to instances at 5 kV and 8 kV. This exploration of breakdown events revealed their initiation at 5 kV, and the occurrence frequency proportionally heightened with escalating voltage.
This setup aimed to model discharge processes in a broader spectral and energetic range, reflecting conditions that may arise during electrical discharges in rarefied atmospheres. Inside the vacuum chamber, conditions were simulated in which discharges occur when a high voltage was applied to the injector, surpassing the critical electric field strength, leading to ionization of dust particles and residual gas molecules through mechanisms like field emission and secondary electron emission. The Electromagnetic Analyzer (EMA) recorded signals during these high-voltage discharges, facilitating the study of intense and dynamic electromagnetic reactions.
4 Results and discussion
In these series of experiments, we aimed to imitate the electric discharge in different ways, so we can understand the differences in the characteristics of the signals based on different sources. The laboratory-simulated electrostatic discharges were designed to mimic conditions relevant to atmospheric phenomena.
4.1 Discharge phenomena using piezo ignition
The EMA has been rigorously tested to register signals from a point source, simulating natural atmospheric phenomena at different distances, demonstrating its robust performance even at distances exceeding 1 m. In this experiment, high-frequency sparks are produced by utilizing a piezo ignition component. When activated, the piezo element rapidly compresses and then decompresses, producing a voltage spike. This high-voltage spark creates electromagnetic signals. The Electromagnetic Analyzer (EMA) captures and registers these signals by detecting the changes in the electromagnetic field associated with the rapid compression and release of the piezo element. The resulting recorded signals on the EMA provide valuable data about the electromagnetic phenomena linked to the piezo ignition process, allowing for detailed analysis of frequency, amplitude, and other signal characteristics.
Piezoelectric materials are capable of generating electromagnetic signals due to their unique property of converting mechanical energy into electrical energy and vice versa. When mechanical stress is applied to a piezoelectric material, such as quartz or certain ceramics, it causes a deformation in the material’s crystal lattice structure. This deformation results in a separation of positive and negative charges within the material, creating an electric potential across its surface.
In the case of a piezo ignition device, mechanical stress is applied to the piezoelectric material when the user presses a button or strikes the device. This mechanical stress causes a rapid deformation of the piezoelectric material, generating a high-voltage electrical pulse. This pulse can create a spark across a small air gap and cause combustion.
The rapid deformation and subsequent relaxation of the piezoelectric material generate not only electrical signals but also electromagnetic radiation. According to Maxwell’s equations, any accelerating electric charge emits electromagnetic radiation. Therefore, the rapid deformation process also generates electromagnetic waves across a broad frequency spectrum. Using the Electromagnetic Analyzer (EMA), we were able to detect and analyze these electromagnetic signals.
In Figure 6, the EMA meticulously recorded resulting electromagnetic signals at room temperature and pressure from a precise distance of 20 cm from the piezo ignition source, while Figure 7 depicts the Fourier Transformation Spectrum of the Piezo Ignition Signal. This unique setup revealed several signals generated within a short time window of 350 μS, showcasing the EMA’s capacity to capture multiple electromagnetic signals from a single event. The overall amplitude scope of these signals varied between 100 and 336 mV, emphasizing the diverse and dynamic nature of the recorded signals.
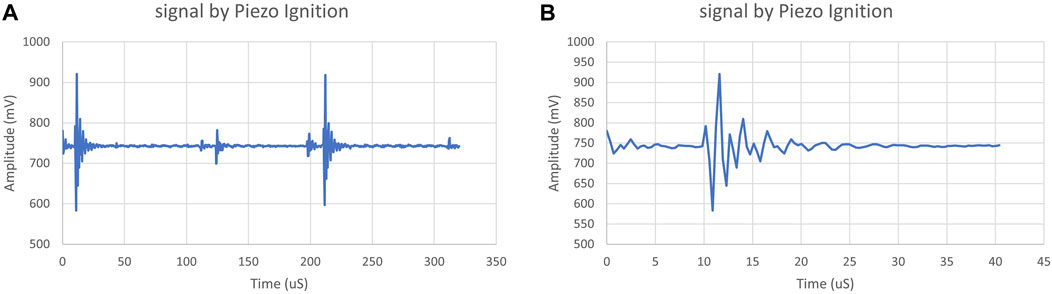
Figure 6. (A) Compilation of Signals emitted by Piezo Ignition, and (B) Signal profile of Piezo Ignition source.
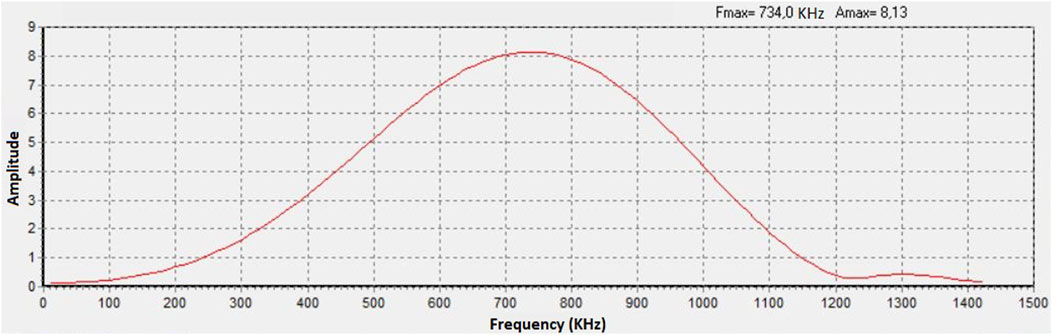
Figure 7. Fourier transformation spectrum of the Piezo Ignition signal.
Within the recorded time window, multiple signals were detected, characterized by repetitive fluctuations in both their timing and intensity. It starts at 752 mV, reflecting the applied threshold, and then fluctuates reaching a maximum of 920 mV and a minimum of 583.4 mV, resulting in a peak-to-peak amplitude of 336.6 mV. This behavior suggests a periodic signal with a frequency range potentially within the EMA’s bandwidth of 100–1500 kHz.
The observed phenomenon of a small pre-signal followed by a larger main signal in the registered signals is likely attributed to the piezoelectric ignition mechanism’s behavior. Piezoelectric materials generate electrical charge in response to mechanical stress, leading to the initial pre-signal as the material begins to deform under applied force. This pre-signal represents the buildup of stress and the initial response of the material. As the stress continues to increase, the piezoelectric material reaches a threshold level, triggering a rapid release of energy and resulting in the larger main signal. This main signal corresponds to the ignition or activation of the device. The repetition of this pre-signal followed by the main signal may occur due to cyclical ignition processes or multiple cycles of stress and relaxation in the piezoelectric material.
The Fourier transformation of the piezo ignition signal, as depicted in the graph, showcases a dominant frequency of 734 kHz, which serves as a fundamental component of the electromagnetic signal generated by the piezo ignition process. The amplitude value of 8.13 on the y-axis signifies the strength or magnitude of this frequency component. It is noteworthy that the frequency and amplitude values portrayed in the Fourier transformation graph reflect the average characteristics observed across multiple piezoelectric ignition signals captured by the electromagnetic analyzer (EMA). It is pertinent to mention that the average frequency values of the signals generated from the piezo ignition typically range between 600 and 800 kHz. While the amplitude value associated with the identified frequency peak provides insights into the strength of this specific frequency component, it may not directly represent the overall signal amplitude. The overall amplitude, however, offers a comprehensive measure of signal strength, indicating the maximum deviation from the baseline. Through Fourier analysis, individual frequency components within the signal were isolated to provide a more detailed spectral representation.
The signals generated by piezo ignition share similarities with various atmospheric phenomena, particularly those involving electrical discharges. Both piezo ignition signals and atmospheric phenomena like lightning, sprites, and elves exhibit characteristic variations in amplitude and frequency over time. The sparks generated by piezo ignition resemble miniature lightning strikes, sharing similar mechanisms of electrical breakdown and plasma formation. These variations reflect the dynamic interplay of electric fields, ionization processes, and atmospheric conditions. While piezo ignition signals are artificially generated, they offer valuable insights into the fundamental principles underlying natural atmospheric phenomena. By further studying the similarities and differences between these signals and atmospheric events, we can deepen our understanding of electromagnetically driven processes occurring within Earth’s atmosphere.
4.2 Discharge events in the vacuum chamber
In the vacuum chamber experiments, breakdown events were meticulously studied to comprehend the underlying mechanism and associated characteristics. The breakdown occurs when the applied voltage surpasses a critical threshold, leading to the ionization of dust particles within the injector. This ionization process gives rise to charged particles and establishes a conductive environment, resulting in electrical discharges. These dynamic events induce variations in the electric field, generating complex electromagnetic signals that are subsequently captured and recorded by both the Electromagnetic Analyzer (EMA) and the oscilloscope.
In our experimental setup, the charge of injected particles was determined by multiplying the output voltage of the charge-sensitive amplifier by its charge sensitivity coefficient, approximately 10–13 Coulombs/volt. This approach ensured that each particle carried its own charge. While discussing the concentration of charged particles within the chamber volume might seem relevant, it is important to note that the injector introduced only one charged particle into the chamber per unit time, with rare instances of simultaneous particle injection. Thus, focusing extensively on particle concentration is not meaningful. Instead, the flux of particles per unit time, or event frequency, ranging from 0.01 to 1 Hz, provides a more informative perspective. Our experiment, aimed at evaluating the capabilities of the Electromagnetic Analyzer (EMA) device, utilized the injector primarily as a tool to generate a stream of charged particles with known parameters, including velocities, charges, and possibly calculated masses and sizes. These particles were then detected by the EMA, allowing us to assess whether they produced electromagnetic radiation detectable by the device. Additionally, the injector’s design characteristics may induce breakdowns, which are detectable by the EMA and warrant further investigation regarding their relevance to atmospheric processes involving dust particles. While our analysis sheds light on the characteristics of the discharge phenomena and the behavior of charged particles in controlled conditions, the implications for atmospheric phenomena remain subject to ongoing research and development.
In our experimental setup, we determined the charge of injected particles by multiplying the output voltage of the charge-sensitive amplifier by its charge sensitivity coefficient, approximately 10–13 Coulombs/volt. This method ensured that each particle carried its own charge. While discussing the concentration of charged particles within the chamber volume may seem relevant, it is essential to note that the injector introduced only one charged particle into the chamber per unit time, with rare instances of simultaneous particle injection. Our experiment aimed to evaluate the capabilities of the Electromagnetic Analyzer (EMA) device. We utilized the injector primarily as a tool to generate a stream of charged particles with known parameters, including velocities, charges, and possibly calculated masses and sizes. These particles were then detected by the EMA, enabling us to assess whether they produced electromagnetic radiation detectable by the device. Additionally, the design characteristics of the injector may induce breakdowns, which are detectable by the EMA and warrant further investigation regarding their relevance to atmospheric processes involving dust particles. While our analysis sheds light on the characteristics of discharge phenomena and the behavior of charged particles in controlled conditions, the implications for atmospheric phenomena remain subject to ongoing research and development.
The introduction of dust particles in this experiment served multiple crucial purposes. Firstly, it enabled investigation into the complex interplay between dust particles and the electric field within the vacuum chamber, shedding light on their influence on breakdown phenomena and electric field behavior under high-voltage conditions. Additionally, observing the dynamics of dust particles during breakdown events facilitated real-time analysis of breakdown mechanisms. Simultaneously, the utilization of charged particles allowed us to discern disparities in the waveform and amplitude of the registered signals, as depicted on the oscilloscope in Figure 8. By determining the velocity of the particles through precise measurements within the 7 cm induction cylinder, and calculating the time taken for passage using oscilloscope records at specific points (Δt, where t2 represents the time registered at the down point of the cylinder, and t1 is the time registered at the top point), we identified an average speed ranging from 3 to 100 m/s within the vacuum environment. These observations provided valuable insights into the interaction dynamics influenced by factors such as particle size, charge, and electric field strength, enhancing our understanding of breakdown phenomena.
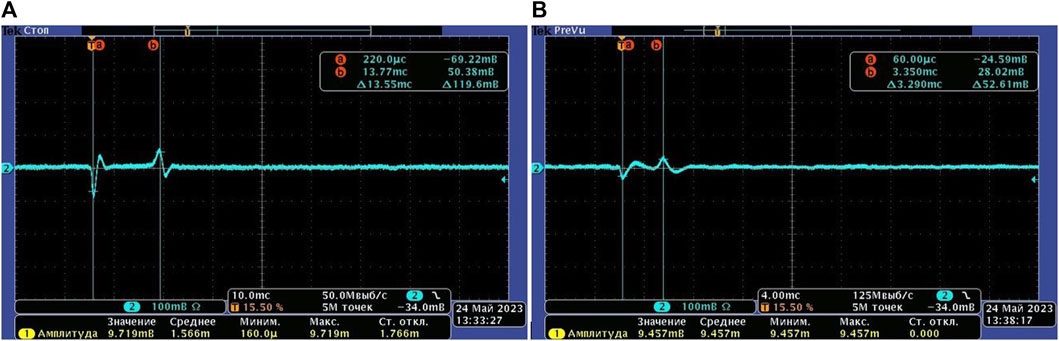
Figure 8. Registered signals of charged particles on the oscilloscope at different velocities - (A) 5,2 m/s and (B) 21,27 m/s.
The breakdown events under different voltage conditions provided valuable insights into discharge phenomena. The increased breakdown voltage at 8 kV compared to 5 kV is attributed to the higher electric field strength required for initiating electrical discharge at elevated voltages (Figure 9). The breakdown signal captured from the injector inside the vacuum chamber under low pressure exhibits distinct characteristics in the time-amplitude domain. It offered valuable insights into discharge phenomena. Specifically, the increased breakdown voltage at 8 kV compared to 5 kV is attributed to the higher electric field strength required for initiating electrical discharge at elevated voltages. The signal, spanning a time window of 320 μs, starts with a sharp peak reaching 1110 mV within the first 4 μs, followed by a secondary peak around 8 μs with an amplitude of approximately 870 mV. Subsequently, the signal undergoes a gradual decrease in amplitude until it reaches the predefined threshold level of 752 mV after 40 μs. Notably, the signal displays a peak followed by smaller peaks, indicating a dynamic discharge process. The overall amplitude of the signal ranges from a maximum of 920 mV to a minimum of 754 mV, underscoring the variability in signal strength over time. Furthermore, frequency analysis through Fast Fourier Transform (FFT) reveals frequency components of 367 kHz, with corresponding amplitudes of 24.68 (Figure 10). Additionally, from the recorded breakdown signals, we have noticed that the average frequency falls between 300 and 500 kHz, with a high amplitude ranging from 15 to 25.
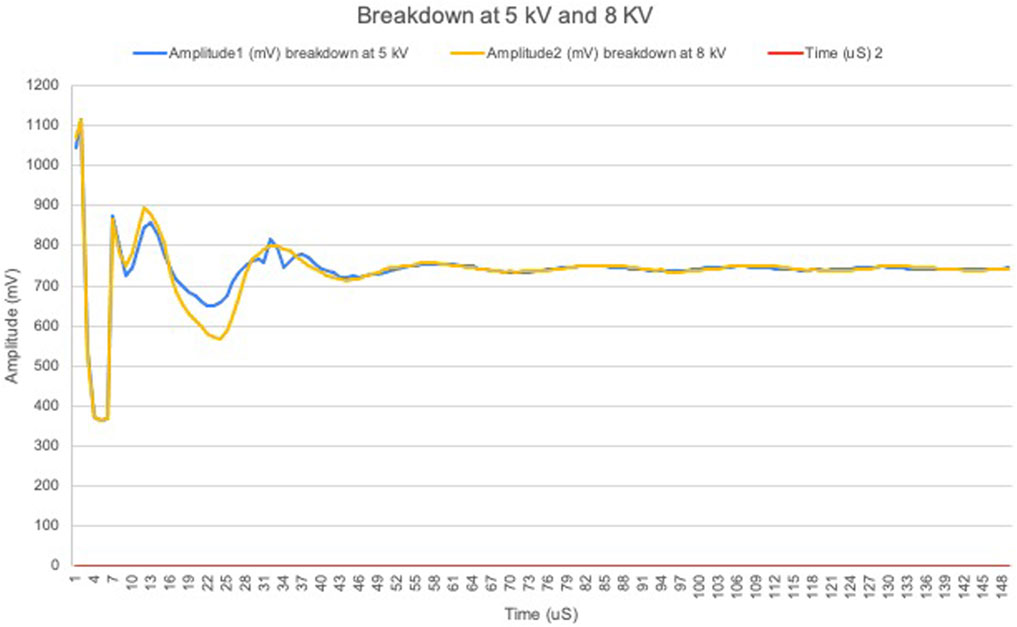
Figure 9. A recorded signal during breakdown at 5 KV and 8 KV high voltages.
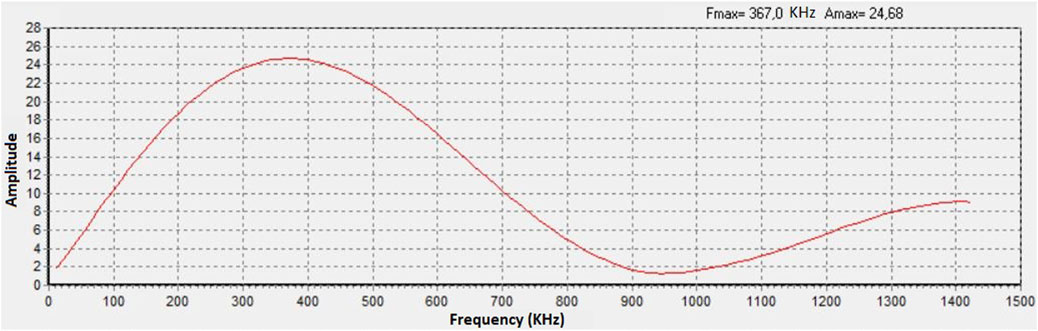
Figure 10. Fourier transformation spectrum of the 8 kV breakdown signal.
The signal recorded from the breakdown phenomenon within the vacuum chamber exhibits intriguing characteristics that bear resemblance to potential discharge events occurring in the upper Earth’s atmosphere. The observed signal comprises a prominent initial peak, followed by smaller peaks, suggesting a recurring pattern in the time-amplitude domain. The registered signal showcases an initial spike reaching a maximum amplitude within the first 4 microseconds, followed by subsequent peaks, with the signal eventually decreasing in amplitude over time. This pattern of peaks and subsequent decrease represent the transient nature of discharge events, such as lightning strikes, observed in the Earth’s atmosphere. Additionally, the gradual decrease in signal amplitude after the initial peak may signify the dissipation of energy over time, akin to the gradual attenuation of electrical discharges in the upper atmosphere. The frequency content of the signal, determined through Fourier transformation, may further elucidate potential similarities between the breakdown phenomena in the vacuum chamber and natural atmospheric discharges, offering valuable insights into the underlying mechanisms governing both phenomena.
The discharge generated from a high voltage up to 8 kV in a vacuum chamber has a frequency range lower than a frequency range generated from the discharge of piezo ignition in room conditions. The frequency of a discharge is influenced by various factors such as the voltage level, the nature of the discharge mechanism, and the surrounding environment. In a vacuum chamber, the absence of air molecules significantly affects the discharge characteristics. Without air molecules to ionize, the discharge process may occur less frequently, resulting in lower-frequency signals compared to discharges in atmospheric conditions. Additionally, the breakdown events in a vacuum chamber may exhibit longer relaxation times and slower dynamics due to the absence of air molecules, which can further contribute to lower-frequency components in the signals.
On the other hand, piezoignition discharges in room conditions involve mechanical pressure applied to a piezoelectric material, leading to rapid mechanical deformation and the generation of electrical fields. These discharges typically occur at lower voltage levels compared to high-voltage discharges in a vacuum chamber. The frequency range of piezoignition discharges can vary depending on factors such as the material properties and the applied mechanical pressure. However, in room conditions with air molecules present, the ionization process may occur more readily, resulting in potentially higher-frequency components in the signals compared to discharges in a vacuum chamber.
4.3 Numerical experiment to determine the possibility of electric field influence on measurements
A computational experiment was conducted using the open-source OpenFOAM package to investigate the potential influence of the electric field generated by the injector on measurements conducted in our experiment. Specifically, we explored a scenario with a maximum potential of 10 kV. Given that the induction cylinder is constructed from a conductive material, the electric potential on its surface deviates from zero. Consequently, the impact of the electric field generated by the injector is effectively neutralized (Figure 11). This neutralization results in a minimal electric field within the chamber where measurements take place. Moreover, owing to the non-zero potential of the induction cylinder walls, the electric field vectors align perpendicular to the trajectory of the particles. This configuration exerts an electric field force that maintains the particles’ central alignment within the cylinder, thereby ensuring their passage without any loss of charge.
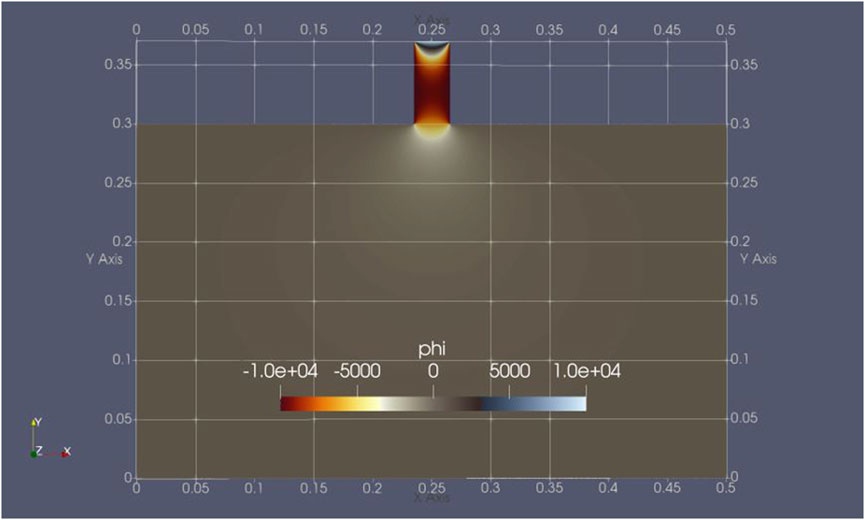
Figure 11. Computational experiment simulation depicting the setup. The upper portion illustrates the injector with the induction cylinder, while the lower portion represents the chamber area extending up to the antenna. Grid dimensions are displayed in meters.
4.4 Electromagnetic nature of discharges
The electromagnetic nature of discharges involves the transfer of charge between particles through tunneling transfer mechanisms (Kok and Lacks, 2009). This process allows high-energy electrons to transfer to the surface of lower-energy particles through close proximity interactions. The threshold potential for this transfer is determined by the difference in charge between the particles. This mechanism may also occur during interactions involving dust particles considered as heavy ions by (B. M. Smirnov 2023; Smirnov 2008) and larger particles (Malinovskaya et al., 2022). Additionally, ions present in the air, dust particles, and particles of varying sizes (∼100 μm) can distort and intensify the electric field, potentially leading to breakdown conditions.
To estimate the magnitude of the change in electrical tension in an experiment involving tungsten particles, we consider the charge transfer process during injection. Assuming a total particle mass of m = 2 gm and the main particle size (d = 30 μm), with an approximate total number of particles close to N = 107, charge q is transferred between particles with a certain probability p upon collision. Consequently, the electric field strength changes with each collision, leading to the loss of charge from each particle. The amount of charge transferred (qx) from one particle to smaller particles during collisions can be expressed as follows:
Where, Nx represents the number of collisions undergone by a single particle with smaller particles. The change in electric field strength, factoring in both the simultaneous loss of charge on some particles and the growth on others, can be expressed as follows:
The context of the study encompasses an experiment involving the visual observation of corona discharges near metalized quartz needles with diameters ranging from 25 to 75 mm, facilitated by a television microscope. These observations revealed a threshold voltage for discharges ranging from approximately 2–5 kV in various experiments. Notably, three types of pulsed corona discharges were identified for negatively charged needles (Смирнов, 1992; Loeb, 2023): flash pulses, periodically recurring discharges, and streamers. Flash pulses and periodically recurring discharges exhibit a visual observation time of approximately 70 ns, while streamers persist for 100–700 ns. The threshold voltage observed in these experiments closely resembles that obtained in the present study. However, the duration of discharge recording by the antenna in our study is longer, potentially influenced by differences in the width of the spectrum of detected electromagnetic waves, as well as variations in sizes and materials. Moreover, fundamental differences between experiments may also contribute to the observed discrepancies.
The pulsed nature of voltage change during discharge is attributed to the shielding effect by avalanche-moving ions as they approach electrodes of opposite polarity. Ionization ceases when the potential of the ion cloud becomes comparable to that of the needle. The duration of screening depends on the deceleration of the cloud and the rate of ion recombination (Смирнов, 1992; Loeb, 2023). Notably, the velocity of positive ions is higher (Briant and Burton, 1976), impacting the strength of the electric field. The frequency of pulses is influenced by electric potential and tip radius.
Furthermore, numerical simulations of the Poisson equation using the OpenFOAM package (specifically, the electrostatic Foam solver) were conducted to explore the distortion of the electric field near oppositely charged needles measuring 1–5 microns in size. The distribution of electric field potential is influenced by the dimensions and charges at the tips (Figure 12). Although the field amplification in asymmetric motion relative to the case with a symmetrical equidistant arrangement of electrodes and clouds is somewhat smaller, the difference is not significantly pronounced.
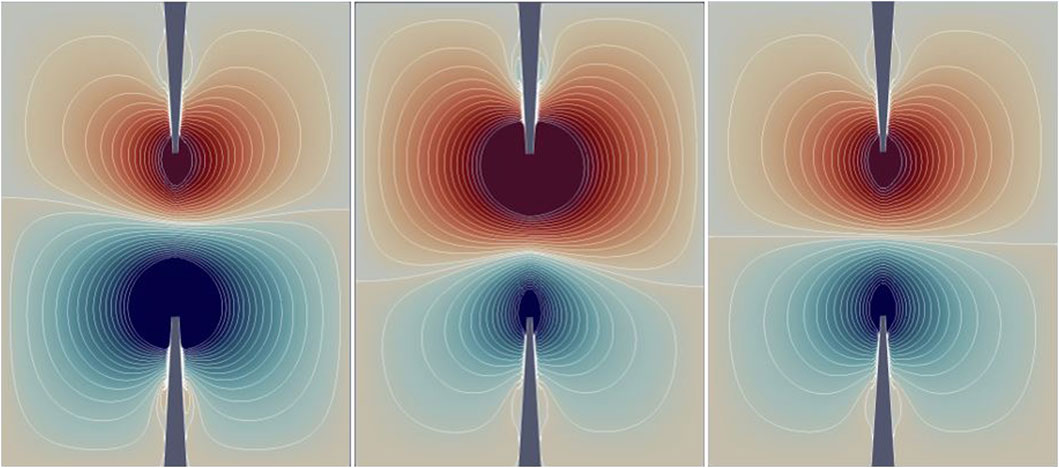
Figure 12. The change in electric field potential near sharp needles of differing charges, each measuring 10 microns in size. These results are derived from numerical modeling for the Poisson equation, providing insight into the distribution of electric field potential surrounding the needles.
We assume that the two points represent charged regions at the boundaries, where a distribution function is applied. As clouds of ions with different signs move in opposite directions, they create an additional electric field. The change in their location influences the potential of the electric field.
The burst signal received at the moment of discharge consists of four consecutive processes.
1. Due to an electric field exceeding the threshold voltage, ions of the corresponding sign fly out from the anode (negatively charged particle) and the cathode (positively charged particle).
Where, ε is the dielectric constant of air, ε0 is the electrical constant,
2. Since ions move at speeds:
where,
3. The charges are in electrostatic equilibrium at the moment the cathode or anode is locked
4. The magnitude of the electric tension increases due to the neutralization of the charge at the edges of the region after some time following recombination and scattering of ions on different electrodes. Subsequently, the reverse movement of ions initiates, accompanied by the generation of a magnetic field. In this case, the spike in values will have a smaller amplitude. This process characterizes the second and subsequent cycles of the pulse signal, albeit with reduced amplitude.
The relative change in the electric field strength reaches its peak when the clouds of charged particles approach the central region (as shown in Figure 13), coinciding with a minimum in speed. This phenomenon demonstrates the realization of electromagnetic damping vibrations at the moment of breakdown.
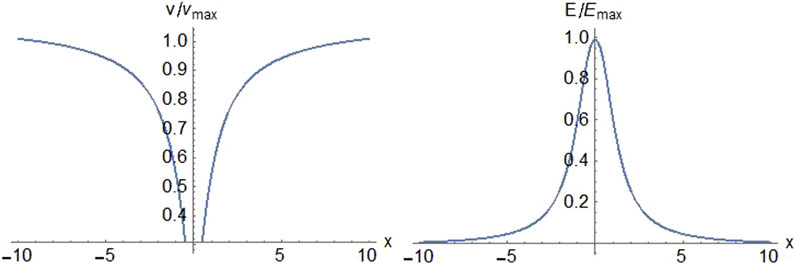
Figure 13. The relative change in both velocity and electric field intensity as clouds of oppositely charged particles move, considering the asymmetry in their velocities (unequal movement speeds).
The presence of an induction cylinder effectively compensates for the influence of the electric field generated by the injector, resulting in an electric field value close to zero inside the installation. These findings are based on computational experiment results. The pulsed nature of voltage changes during discharge is attributed to the shielding effect caused by avalanche-moving ions, leading to spikes in both electric and magnetic field magnitudes. Once the burst concludes, the potential of the ion cloud approaches that of the charged element (needle), causing ionization to cease. The duration of screening depends on the deceleration of the ion cloud and the rate of ion recombination.
5 Conclusion
In conclusion, the comprehensive experimental investigation involving piezo ignition, high-voltage breakdown, and charged dust particles within a vacuum chamber provided valuable insights into electromagnetic phenomena mimicking natural atmospheric conditions. The Electromagnetic Analyzer (EMA) emerged as a reliable tool, successfully registering and characterizing signals associated with diverse events. The piezo ignition experiments demonstrated the EMA’s ability to capture specific frequencies and amplitude characteristics during rapid and intense ignition processes. High-voltage breakdown events in the vacuum, explored at varying voltages, contributed to understanding discharge phenomena, showcasing distinctive frequencies and amplitude fluctuations. Charged dust particle in the experiments revealed the EMA’s capability to detect signals with varying amplitudes and frequencies during particle movement within the induction cylinder. These findings collectively underscore the versatility of the EMA in investigating atmospheric electromagnetic responses under controlled laboratory conditions, shedding light on potential applications and advancing our comprehension of natural atmospheric phenomena.
Data availability statement
The original data supporting this study are available upon request. Further inquiries can be directed to the corresponding author.
Author contributions
MA: Conceptualization, Data curation, Formal Analysis, Investigation, Methodology, Visualization, Writing–original draft, Writing–review and editing. ID: Formal Analysis, Software, Writing–review and editing. EM: Formal analysis, Methodology, Writing–original draft. SK: Methodology, Resources, Writing–review and editing. GD: Writing–review and editing. AZ: Conceptualization, Supervision, Writing–original draft.
Funding
The author(s) declare that financial support was received for the publication of this article. Funding for publication fees was generously provided by Dr. Martina Cuffaro.
Acknowledgments
We would like to express our sincere gratitude to SB and Mikhail V. Kurgansky for their invaluable feedback and insightful comments on this work. Their expertise and thoughtful contributions have greatly enriched the quality and clarity of our research.
Conflict of interest
The authors declare that the research was conducted in the absence of any commercial or financial relationships that could be construed as a potential conflict of interest.
Publisher’s note
All claims expressed in this article are solely those of the authors and do not necessarily represent those of their affiliated organizations, or those of the publisher, the editors and the reviewers. Any product that may be evaluated in this article, or claim that may be made by its manufacturer, is not guaranteed or endorsed by the publisher.
References
Aikin, A. C., Chanin, M. L., Nash, J., and Kendig, D. J. (1991). Temperature trends in the lower mesosphere. Geophys. Res. Lett. 18 (3), 416–419. doi:10.1029/91GL00233
Andrews, D. G., Holton, J. R., and Leovy, C. B. (1987). Middle atmosphere dynamics, 40. Academic Press.
Bering, I. I. I., Edgar, A., Arthur, A. F., and Benbrook, J. R. (1998). The global electric circuit. Phys. Today 51 (10), 24–30. doi:10.1063/1.882422
Boggs, L. D., Mach, D., Bruning, E., Liu, N., Van Der Velde, O. A., Montanyá, J., et al. (2022). Upward propagation of gigantic jets revealed by 3D radio and optical mapping. Sci. Adv. 8 (31), eabl8731. doi:10.1126/sciadv.abl8731
Briant, C. L., and Burton, J. J. (1976). A molecular model for the nucleation of water on ions. J. Atmos. Sci. 33 (7), 1357–1361. doi:10.1175/1520-0469(1976)033<1357:ammftn>2.0.co;2
Bukowski, J., and van den Heever, S. C. (2020). Convective distribution of dust over the arabian peninsula: the impact of model resolution. Atmos. Chem. Phys. 20 (5), 2967–2986. doi:10.5194/acp-20-2967-2020
Bullard, J. E., Baddock, M., Bradwell, T., Crusius, J., Darlington, E., Gaiero, D., et al. (2016). High-latitude dust in the Earth system. Rev. Geophys. 54 (2), 447–485. doi:10.1002/2016RG000518
Carrillo-Sánchez, J. D., Nesvorný, D., Pokorný, P., Janches, D., and Plane, J. M. C. (2016). Sources of cosmic dust in the earth’s atmosphere. Geophys. Res. Lett. 43 (23), 11979–11986. doi:10.1002/2016GL071697
Семкин, Н. Д., Пияков, А. В., and Погодин, А. П.(2008). Эволюция и Перспективы Развития Устройств Для Моделирования Микрометеоритов в Лабораторных Условиях. Прикладная Физика(4), 153–163. Available at: https://applphys.orion-ir.ru/appl-08/08-4/PF-08-4-153.pdf.
Corr, C. A., Ziemba, L. D., Scheuer, E., Anderson, B. E., Beyersdorf, A. J., Chen, G., et al. (2016). Observational evidence for the convective transport of dust over the Central United States. J. Geophys. Res. Atmos. 121 (3), 1306–1319. doi:10.1002/2015JD023789
Fagundes, P. R., Sahai, Y., and Bittencourt, J. A. (2001). “Thermospheric zonal temperature gradients observed at low latitudes,” in Annales Geophysicae (Göttingen, Germany: Copernicus Publications) 19 (9), 11331139.
Füllekrug, M., Mareev, E. A., and Rycroft, M. J. (2006). “Sprites, elves and intense lightning discharges,” in NATO science series II: mathematics, Physics and chemistry (Dordrecht: Springer Netherlands), 225. doi:10.1007/1-4020-4629-4
Garcia-Carreras, L., Marsham, J. H., Stratton, R. A., and Tucker, S. (2021). Capturing convection essential for projections of climate change in african dust emission. Npj Clim. Atmos. Sci. 4 (1), 44. doi:10.1038/s41612-021-00201-x
Genge, M. J. (2018). Electrostatic levitation of volcanic ash into the ionosphere and its abrupt effect on climate. Geology 46 (10), 835–838. doi:10.1130/g45092.1
Gunnarsdottir, T. L., Poggenpohl, A., Mann, I., Mahmoudian, A., Dalin, P., Haeggstroem, I., et al. (2023). Modulation of polar mesospheric summer Echoes (PMSEs) with high-frequency heating during low solar illumination. Ann. Geophys. 41, 93–114. Copernicus GmbH. Available at:. doi:10.5194/angeo-41-93-2023
Havnes, O., Aslaksen, T., and Brattli, A. (2001). Charged dust in the earth’s middle atmosphere. Phys. Scr. 2001 (T89), 133. doi:10.1238/physica.topical.089a00133
Havnes, O., Trøim, J., Blix, T., Mortensen, W., Næsheim, L. I., Thrane, E., et al. (1996). First detection of charged dust particles in the earth’s mesosphere. J. Geophys. Res. Space Phys. 101 (A5), 10839–10847. doi:10.1029/96JA00003
Inhester, B., Klostermeyer, J., Lübken, F. J., and von Zahn, U. (1994). Evidence for ice clouds causing polar mesospheric summer Echoes. J. Geophys. Res. Atmos. 99 (D10), 20937–20954. doi:10.1029/94JD01619
Kazimirovsky, E. S. (1989). “Lower thermosphere (80-100 Km) dynamics response to solar and geomagnetic activity: overview,” in International Council of Scientific Unions, Middle Atmosphere Program. Handbook for MAP, Part 1: Extended Abstracts, International Symposium on Solar Activity Forcing of the Middle Atmosphere. Part 2: MASH Workshop, Williamsburg, 1986. Available at: https://ntrs.nasa.gov/citations/19900018878.
Kivelson, M. G., and Russell, C. T. (1995). Introduction to space Physics. Cambridge, United Kingdom: Cambridge University Press. Available at: https://books.google.com.eg/books?hl=en&lr=&id=qWHSqXGfsfQC&oi=fnd&pg=PR11&dq=Kivelson,+M.+G.,+and+Russell,+C.+T.+(1995).+Introduction+to+space+Physics.+Cambridge+University+Press.&ots=0aM4FfTmZl&sig=ETW8sHOfAQ4C6gg7A_3a3VGK13A&redir_esc=y#v=onepage&q=Kivelson%2C%20M.%20G.%2C%20and%20Russell%2C%20C.%20T.%20(1995).%20Introduction%20to%20space%20Physics.%20Cambridge%20University%20Press.&f=false.
Klimov, S., Novikov, D., Korepanov, V., Marussenkov, A., Ferencz, C., Lichtenberger, J., et al. (2010). “The study of electromagnetic parameters of space weather, micro-satellite ‘chibis-M,” in Small satellite missions for Earth observation. Editors R. Sandau, H.-P. Roeser, and A. Valenzuela (Berlin, Heidelberg: Springer Berlin Heidelberg), 95–102. doi:10.1007/978-3-642-03501-2_8
Klumov, B. A., Popel, S. I., and Bingham, R. (2000). Dust particle charging and formation of dust structures in the upper atmosphere. Journal of Experimental and Theoretical Physics Letters 72, 364–368.
Kok, J. F., and Lacks, D. J. (2009). Electrification of granular systems of identical insulators. Phys. Rev. E 79 (5), 051304. doi:10.1103/PhysRevE.79.051304
Korepanov, V., Dudkin, D., and Dudkin, F. (2014). Study of electromagnetic processes in the ionosphere onboard microsatellite chibis-M. Space Res. Ukraine, 7–12.
Latham, J., Mason, B. J., and Blackett, P. M. S. (1997). Electrical charging of hail pellets in a polarizing electric held. Proc. R. Soc. Lond. Ser. A. Math. Phys. Sci. 266 (1326), 387–401. doi:10.1098/rspa.1962.0068
Loeb, L. B. (2023). Electrical coronas: their basic physical mechanisms. Univ of California Press. Available at: https://books.google.com.eg/books?hl=en&lr=&id=NWLhEAAAQBAJ&oi=fnd&pg=PA1&dq=Loeb,+L.+B.+(2023).+Electrical+coronas:+their+basic+physical+mechanisms.+Univ+of+California+Press.&ots=VA4ukWQyzX&sig=yf_Fkkqk2ZgKxZyLIQJQGutU6VE&redir_esc=y#v=onepage&q=Loeb%2C%20L.%20B.%20(2023).%20Electrical%20coronas%3A%20their%20basic%20physical%20mechanisms.%20Univ%20of%20California%20Press.&f=false
Malinovskaya, E. A., Chkhetiani, O. G., Panchishkina, I. N., Petrova, G. G., and Petrov, A. I. (2022). The relationship between a surface electric field and an arid aerosol under different wind conditions. Dokl. Earth Sci. 502 (1–2), 59–67. doi:10.1134/S1028334X22020106
Mallios, S. A., Daskalopoulou, V., and Amiridis, V. (2022). Modeling of the electrical interaction between desert dust particles and the earth’s atmosphere. J. Aerosol Sci. 165 (September), 106044. doi:10.1016/j.jaerosci.2022.106044
Marshall, J., and Plumb, R. A. (2008). “The general circulation of the atmosphere,” in Atmosphere, ocean, and climate dynamics–an introductory text. Editors R. Dmowska, D. Hrtmann, and H. T. Rossby, 93, 319. Inter. Geophys. Union, Ser. Monogr.
Medvedev, A. S., and Yiğit, E. (2019). Gravity waves in planetary atmospheres: their effects and parameterization in global circulation models. Atmosphere 10 (9), 531. doi:10.3390/atmos10090531
Meriwether, J. W., and Gardner, C. S. (2000). A review of the mesosphere inversion layer phenomenon. J. Geophys. Res. Atmos. 105 (D10), 12405–12416. doi:10.1029/2000JD900163
Novikov, L. S., Akishin, A. I., Semkin, N. D., and Voronov, K. E. (1997). Emission and discharge phenomena induced by hard microparticle impact. European Space Agency,(Special Publication) ESA SP, 493–496. Available at: https://elibrary.ru/item.asp?id=15023309.
Novikov, L. S., Bednyakov, S. A., Soloviev, G. G., Ermolaev, I. K., and Pilyugin, N. N. (2005). “Laboratory modelling of space particles impact on materials and structures,” in Proceedings of the 4th European Conference on Space Debris, 18–20. Available at: https://conference.sdo.esoc.esa.int/proceedings/sdc4/paper/12/SDC4-paper12.pdf.
Plane, J., Gumbel, J., Kalogerakis, K. S., Marsh, D. R., and von Savigny, C. (2023). Opinion: recent developments and future directions in studying the mesosphere and lower thermosphere. Atmos. Chem. Phys. 23 (20), 13255–13282. doi:10.5194/acp-23-13255-2023
Plane, J. M. C. (2012). Cosmic dust in the earth’s atmosphere. Chem. Soc. Rev. 41 (19), 6507–6518. doi:10.1039/c2cs35132c
Plane, J. M. C., Flynn, G. J., Määttänen, A., Moores, J. E., Poppe, A. R., Carrillo-Sanchez, J. D., et al. (2018). Impacts of cosmic dust on planetary atmospheres and surfaces. Space Sci. Rev. 214 (1), 23. doi:10.1007/s11214-017-0458-1
Prospero, J. M. (1999). Long-range transport of mineral dust in the global atmosphere: impact of african dust on the environment of the southeastern United States. Proc. Natl. Acad. Sci. 96 (7), 3396–3403. doi:10.1073/pnas.96.7.3396
Roberts, A., and Knippertz, P. (2012). Haboobs: convectively generated dust storms in west africa. Weather 67 (12), 311–316. doi:10.1002/wea.1968
Schepanski, K., Merkel, U., and Tegen, I. (2014). Mineral dust: meteorological controls and climate impacts. Past. Glob. Chang. Magazine-Dust 22 (2), 62–63. doi:10.22498/pages.22.2.62
Schlegel, K. (2007). “Ionospheric response,” in Space weather- Physics and effects (Berlin, Heidelberg: Springer Berlin Heidelberg: Springer Praxis Books), 203–224. doi:10.1007/978-3-540-34578-7_7
Schultz, C. (2013). Low-frequency radio emissions from high-altitude sprite discharge. Eos, Trans. Am. Geophys. Union 94 (6), 68. doi:10.1002/2013EO060013
Smirnov, B. M. (2023). Generation of electric fields in the troposphere. J. Exp. Theor. Phys. 136 (6), 778–784. doi:10.1134/S1063776123060134
Surkov, V. V., and Hayakawa, M. (2012). Underlying mechanisms of transient luminous events: a review. Ann. Geophys. 30, 1185–1212. Copernicus GmbH. Available at:. doi:10.5194/angeo-30-1185-2012
Surkov, V. V., and Masashi, H. (2020). Progress in the study of transient luminous and atmospheric events: a review. Surv. Geophys. 41 (5), 1101–1142. doi:10.1007/s10712-020-09597-2
Weinzierl, B., Ansmann, A., Prospero, J. M., Althausen, D., Benker, N., Chouza, F., et al. (2017). The saharan aerosol long-range transport and aerosol–cloud-interaction experiment: overview and selected highlights. Bull. Am. Meteorological Soc. 98 (7), 1427–1451. doi:10.1175/bams-d-15-00142.1
Xu, Z. (2014). “Airborne particles in outdoor air: atmospheric dust,” in Fundamentals of air cleaning Technology and its Application in cleanrooms. Editor Z. Xu (Berlin, Heidelberg: Springer Berlin Heidelberg), 47–132. doi:10.1007/978-3-642-39374-7_2
Yilbas, B. S., Ali, H., Khaled, M. M., Al-Aqeeli, N., Abu-Dheir, N., and Varanasi, K. K. (2015). Influence of dust and mud on the optical, chemical and mechanical properties of a pv protective glass. Sci. Rep. 5 (1), 15833. doi:10.1038/srep15833
Yilbas, B. S., Al-Qahtani, H., Al-Sharafi, A., Bahattab, S., Hassan, G., Al-Aqeeli, N., et al. (2019). Environmental dust particles repelling from a hydrophobic surface under electrostatic influence. Sci. Rep. 9 (1), 8703. doi:10.1038/s41598-019-44992-9
Zadorozhny, A. M. (2001). Effects of charged dust on mesospheric electrical structure. Adv. Space Res. 28 (7), 1059–1064. doi:10.1016/s0273-1177(01)80037-5
Zakharov, A. V., Dolnikov, G. G., Kuznetsov, I. A., Lyash, A. N., Esposito, F., and Molfese, C. (2022). Dust complex for studying the dust particle dynamics in the near-surface atmosphere of Mars. Solar System Research 56 (6), 351–368.
Zelenyi, L. M., Gurevich, A. V., Klimov, S. I., Angarov, V. N., Batanov, O. V., Bogomolov, A. V., et al. (2014). The academic chibis-M microsatellite. Cosmic Res. 52, 87–98. doi:10.1134/s0010952514010110
Zereg, K., Gama, A., Aksas, M., Rathore, N., Yettou, F., and Panwar, N. L. (2022). Dust impact on concentrated solar power: a review. Environ. Eng. Res. 27 (6), 210345–210350. doi:10.4491/eer.2021.345
Keywords: electromagnetic signatures, charged dust particles, dust particle interactions, atmospheric discharge, electromagnetic analyzer, experimental modeling
Citation: Abdelaal ME, Dokuchaev IV, Malinovskaya EA, Klimov SI, Dolnikov GG and Zakharov AV (2024) Experimental modeling of atmospheric discharge phenomena and charged dust particle interactions. Front. Astron. Space Sci. 11:1347048. doi: 10.3389/fspas.2024.1347048
Received: 30 November 2023; Accepted: 27 March 2024;
Published: 06 May 2024.
Edited by:
Igo Paulino, Federal University of Campina Grande, BrazilReviewed by:
Mourad Djebli, USTHB, AlgeriaSotirios A. Mallios, National Observatory of Athens, Greece
Copyright © 2024 Abdelaal, Dokuchaev, Malinovskaya, Klimov, Dolnikov and Zakharov. This is an open-access article distributed under the terms of the Creative Commons Attribution License (CC BY). The use, distribution or reproduction in other forums is permitted, provided the original author(s) and the copyright owner(s) are credited and that the original publication in this journal is cited, in accordance with accepted academic practice. No use, distribution or reproduction is permitted which does not comply with these terms.
*Correspondence: Mohamad E. Abdelaal, TW9oYW1hZC5lc3NhbUBwaHlzdGVjaC5lZHU=
†These authors have contributed equally to this work and share first authorship
‡These authors have contributed equally to this work and share senior authorship