 Honghong Wu
 Liping Yang2
 Shiyong Huang
- 1School of Electronic Information, Wuhan University, Wuhan, China
- 2State Key Laboratory for Space Weather, SIGMA Weather Group, National Space Science Center, Chinese Academy of Sciences, Beijing, China
The highly Alfvénic fluctuations (AF) and magnetic-velocity alignment structures (MVAS) are two distinguished components in the near-Sun slow solar wind observed by Parker Solar Probe. The amplitudes of the Els
1 Introduction
The solar wind is a natural laboratory for the study of MHD turbulence (Tu and Marsch, 1995; Bruno and Carbone, 2013), which is often described theoretically by MHD equations in terms of Els
It is widely accepted that z+ represents the outward Alfvén fluctuations in the solar wind originating from the solar atmosphere. However, the origin and nature of z− are controversial. Assumptions include the inward Alfvén waves produced by parametric instabilities (Marsch and Tu, 1993;Del Zanna, 2001; Malara et al., 2001; Shi et al., 2017), the reflection of the outward Alfvén waves (Velli et al., 1989; Chandran et al., 2009; Chandran and Perez, 2019), the velocity shear (Zank et al., 2012; Shi et al., 2020), the compressive fluctuations (Grappin et al., 1990); the convective structures originating from the solar atmosphere (Tu and Marsch, 1990; Tu and Marsch, 1993); and the pseudo structures in the highly Alfvénic solar winds (Wang et al., 2018). The determination of the nature of z− is of importance for the understanding of solar wind turbulence. Whether z − is inward wave, co-propagating fluctuation, or structure directly influences the interaction between z + and z −.
The properties of the turbulent fluctuations reflect their nature. The typical slow solar wind has a lower degree of Alfvénicity than the fast solar wind, being more strongly intermixed with structures of non-Alfvénic nature (Tu and Marsch, 1995). The information in the σc − σr plane provides an important approach to investigate the properties of solar wind fluctuations, in which σc is the cross helocity and σr is the normalized residual energy. Bruno et al. (2007) studied the radial evolution of the distributions in the σc − σr plane and found that there exist advected magnetic structures in the solar wind. Alberti et al. (2022) and Sioulas et al. (2023) both presented the radial evolution of the distribution in the σc − σr plane and argued that more non-Alfvénic fluctuations occurs during the solar wind expansion, resulting in the transition of magnetic spectral index from −5/3 to −3/2 (Chen et al., 2020). The evolution of σc − σr plane reflects that the fluctuations are higher Alfvénic close to the Sun and less Alfvénic away from the Sun. The more Alfvénicity and −3/2 scaling are consistent with the IK phenomenology (Kraichnan, 1965) and the −5/3 scaling is consistent with the Kolmogorov phenomenology (Kolmogorov, 1941) and critical balance models (Goldreich and Sridhar, 1995; Boldyrev, 2006).
Wang et al. (2020) pointed out that σc and σr are dependent with each other and used
The correlation between magnetic and velocity fluctuations is an effective parameter to investigate the fluctuations. Coherence is the correlation as a function of frequency (or scale). Denskat and Neubauer (1983) analyzed the coherence between magnetic and velocity fluctuations in the fast solar wind observed by Helios and found that the coherence is low at low frequency below 2.4 × 10⁻⁵ Hz, and high at higher frequency. They concluded that at low frequency the fluctuations are generated by larger-scale dynamical process and at high frequency the fluctuations are Alfvénic turbulence. Since turbulence is an multi-scale phenomenon, the coherence provides more information about the fluctuations than the correlation. Here we investigate the coherence between z+ and z− for both AF and MVAS. We utilize the PSP measurements inside 0.3 au in the slow solar wind and analyze the fluctuations of z+ and z− in the
2 Data and methods
Here we use measurements from PSP from 2018 October 31 to 2023 April 30. The perihelion reached 0.09 au in the sixth orbit. The fluxgate magnetometer (MAG) in the FIELDS instrument suite (Bale et al., 2016) measures the magnetic field B and the Solar Probe Cup [SPC (Case et al., 2020)] in the Solar Wind Electrons, Protons, and Alphas [SWEAP (Kasper et al., 2016)] instrument suite measures the proton velocity distribution function (VDF), whose moments including proton density np, solar wind velocity V are used. We cut the near-Sun solar wind data from 0.1 au to 0.3 au into 1-h intervals with no overlapping and only reserve the high resolution data with good data coverage (time resolution of 0.8738 and a total data coverage of 95% or better) and obtain 1339 intervals. Most of them are slow solar wind with the average velocity V0 < 450 km/s. We focus our analyses on the 1187 slow solar wind intervals. We fit plasma and magnetic field data to an uniform time grid with the resolution of Δ = 0.8738 s.
The magnetic and velocity are calculated as δv = V − V0 and
where the angled-bracket
The fluctuations of the Els
So that z+ always refers to the dominated fluctuations, whether the Els
We calculate the coherence between z+ and z−. The coherence measures the correlation between z+ and z− in the frequency domain. We construct the field-aligned coordinate system, in which ‖ refers to the direction of B0, ⊥1 refers to the direction perpendicular to both B0 and V0 and ⊥2 completes this orthogonal coordinate system. The coherence spectra is the normalized cross-spectral density of two time signals z+ and z−:
Where i denotes the ‖, ⊥1, and ⊥2 components, PSD++, PSD−− are the power spectra of z+ and z−, and PSD+− is the cross spectral density of z+ and z−. The power spectral density (PSD) of a variable u can be computed by applying the fast Fourier transform (FFT) or wavelet method (Torrence and Compo, 1998) using Morlet wavelet. The coherence can also reflect the phase difference between the fluctuations of z+ and z−. The coherence equals to 1 when the phase difference is 0° or 180° and equals to 0 when the phase difference is 90° or 270°. We transfer the frequency f to the wavenumber kdi in units of the ion inertial scale di using Tayler hypothesis (Taylor, 1938). The applicability of Taylor’s hypothesis in the analysis of PSP data requires to be investigated (Klein et al., 2014; Perez et al., 2021). Several modified Taylor’s hypothesis are proposed to validate the transform from frequency to wavenumber (Klein et al., 2015; Bourouaine and Perez, 2018; Perez et al., 2021; Zank et al., 2022). We apply the modified Taylor’s hypothesis as in Zank et al. (2022), the difference between the original and modified Taylor’s hypothesis is a
We present a typical case of MVAS with high coherence and another typical case of the AF with low coherence. We analyze their time series, power spectra and self-correlation function. The power spectral density (PSD) of a variable u are computed by applying the fast Fourier transform (FFT). The estimated spectral indices are given by the least-squares regressions to the corresponding spectra within 0.004–0.04kdi in the log-log space. The self-correlation function of u is calculated as CF(τ) =< δu(t) ⋅ δu (t + τ) > (Matthaeus and Goldstein, 1982), where
3 Results
Figure 1 shows the number distribution in the
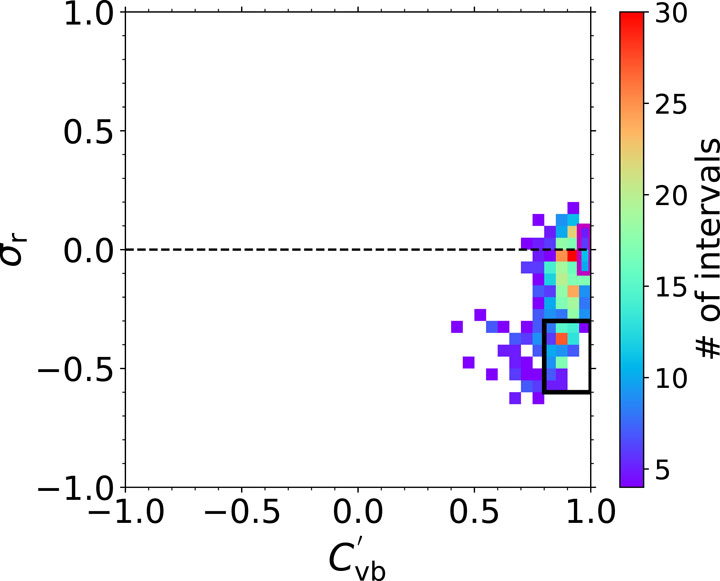
FIGURE 1. Number distribution in the
Figure 2 presents the pixel average amplitudes (top) and the corresponding standard deviations (bottom) of z+ (left) and z− (right) in the
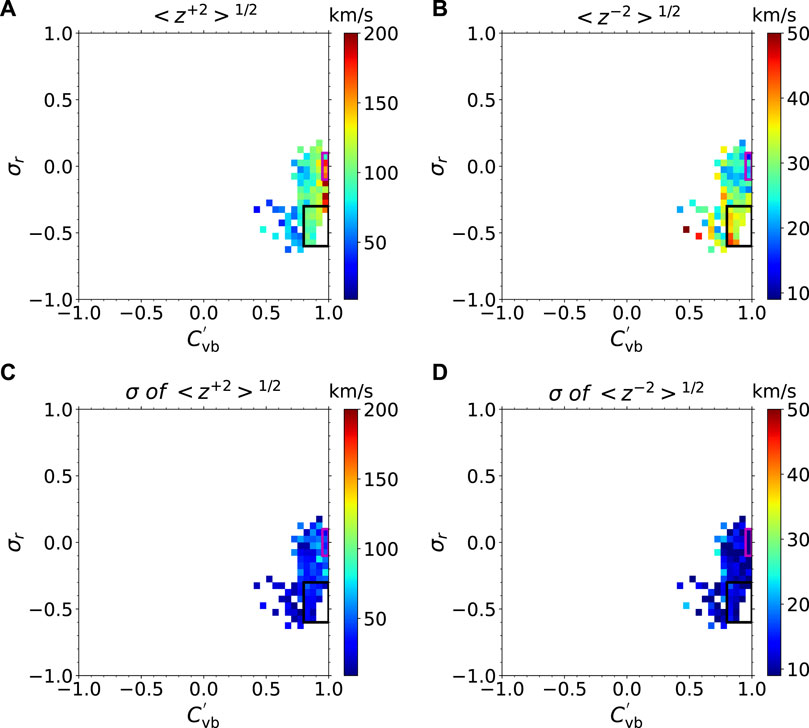
FIGURE 2. Top panels: pixel average amplitudes of z+ (A) and z− (B) in the
The average coherence spectra between three components of z+ and z− are shown in Figure 3. The differences on the average coherence spectra are obvious for the AF and the MVAS. For the MVAS, the average coherence for the perpendicular components can reach 0.55 at large scale, gradually declines to 0.4 around 0.1kdi and drop to 0.25 around 0.2kdi. The parallel components has a lower coherence at all scales and a bump around 0.07kdi. The bump indicates a slight higher coherence. The spectra illustrate an obvious 2D anisotropy that the coherence in the perpendicular direction is larger than that in the parallel direction, while it is almost isotropic in the plane perpendicular to the magnetic field. For those AF, the coherence spectra show little anisotropy. The values of the average coherence are lower than 0.3 at all scales with a nearly constant coherence at large scales. All three components have a bump around 0.07kdi.
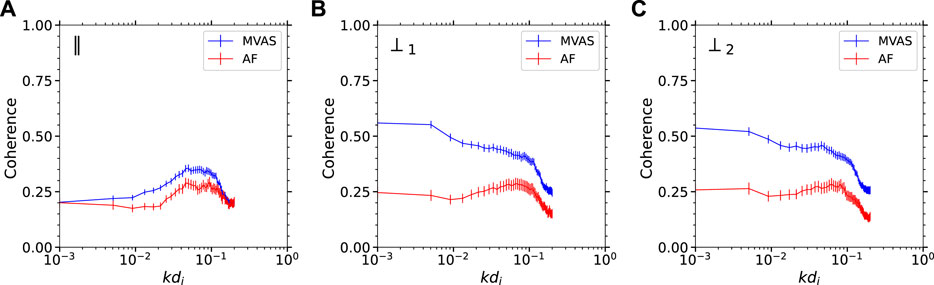
FIGURE 3. The averaged coherence spectra between z+ and z−in the three directions (‖ (A); ⊥1 (B); ⊥2 (C)) of the field-aligned coordinates as shown on the top left corner for the AF and the MVAS, respectively. The error bars represent the standard errors.
Figure 4 shows an interval on 2022 May 29 (interval A). Interval A is measured at 0.17 au and with correlation coefficient Cvb = −0.97 and Alfvén ratio σr = −0.44. Thus, it is a interval of MVAS. Figure 4A shows the magnetic field fluctuations δb and the velocity fluctuations δv in the ⊥1 of the field-aligned coordinates. We can see that the correlation between δb and δv is high but δb is dominated over δv. Figure 4B presents z+ and z− in unit of km/s. It is clear that z+ is much larger than z−. δz−, the root mean square of z−, is 38.5 km/s. Figure 4C displays the wavelet spectrum of coherence between z+ and z− in the ⊥1 direction. The red patch illustrates a high coherence at large scales and the green and blue patch indicates a lower coherence at small scales. Figure 4D presents the corresponding phase difference between z+ and z−. The yellow patch indicates phase difference being 180° at most scales and instants, demonstrating that the peaks of z+ are accompanied by the troughs of z− and vice versa.
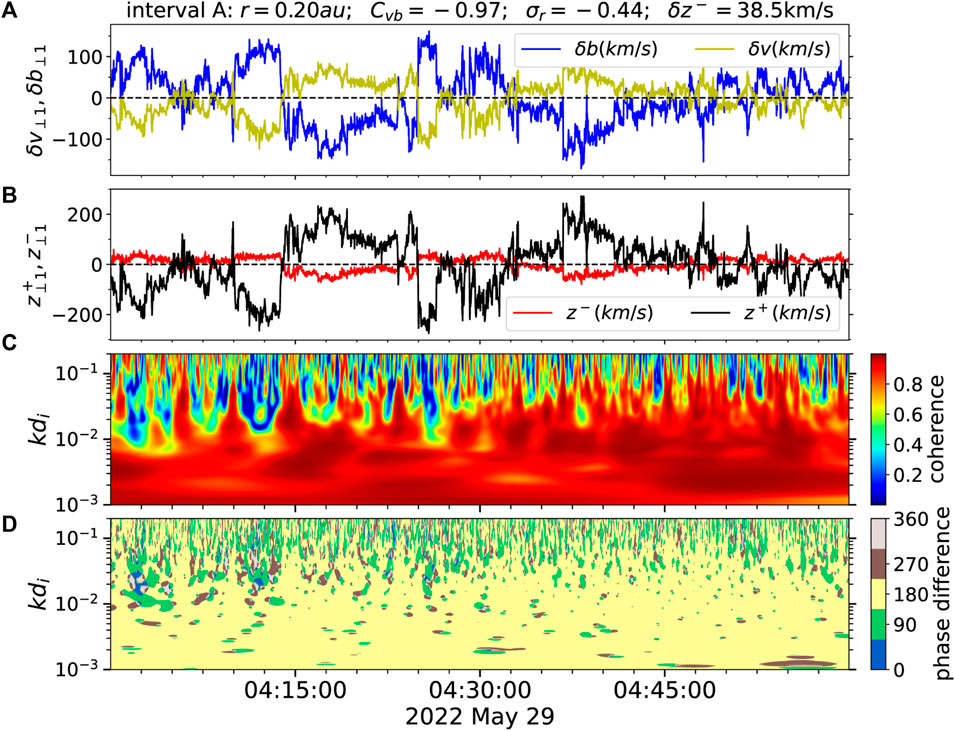
FIGURE 4. The Cvb, σr and z− are given in the title for interval A measured on 2022 May 29 at 0.20 au. (A) The time variations of the components of magnetic field (blue) and velocity fluctuations (yellow) in the ⊥1 direction of the field-aligned coordinates in unit of km/s. (B) The time series of z+ (black) and z− (red) in unit of km/s. (C) The wavelet spectrum of coherence between z+ and z−. (D) The phase difference between z+ and z−.
Figure 5 shows an interval on 2022 December 8 (interval B). Interval B is measured at 0.16 au and with Cvb = 0.97 and Alfvén ratio σr = −0.01. This time interval is highly Alfvénic with δz− = 18.8 km/s. It is obvious that z− is much smaller than z+. The wavelet spectrum shows a large patch of low coherence in blue, corresponding to phase differences of 90° or 270°, implying that the peak values of z+ are accompanied by a zero value of z− and vice versa.
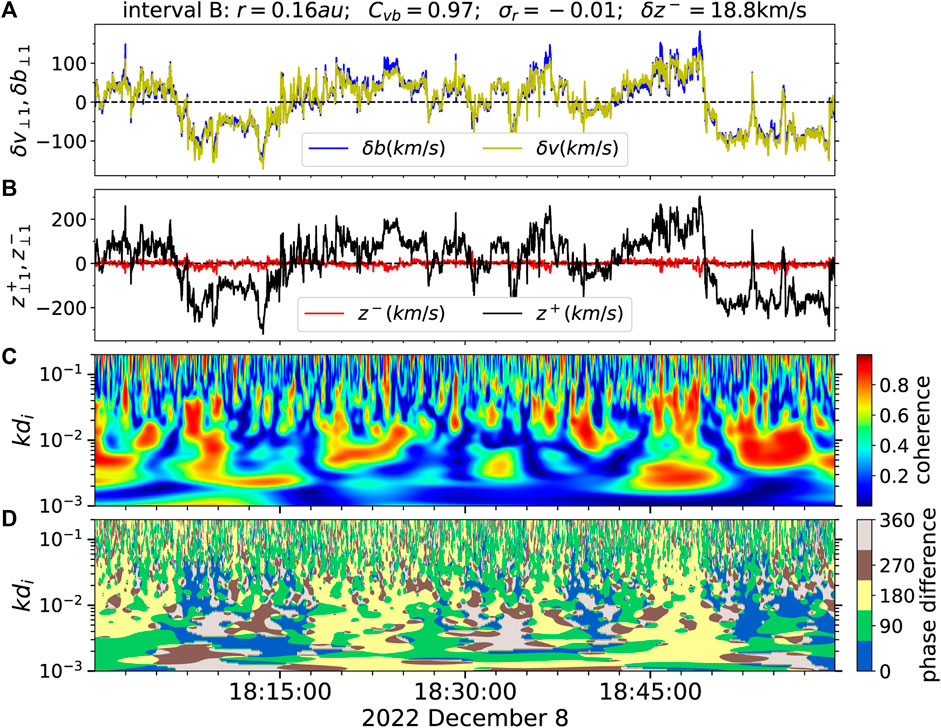
FIGURE 5. The interval B measured on 2022 December 8 at 0.16 au with same format as Figure 4 (A–D).
In the top panels of Figure 6, we show the coherence spectra between z+ and z− in the three directions in the field-aligned coordinates. The differences between those two intervals are obvious. For interval A, the values of coherence between z+ and z− of the ⊥1 and ⊥2 components reach 0.8 at the largest scale and decline to around 0.4 at small scale. The coherence of the ‖ component is around 0.3 at all scales. For interval B, the values of coherence between z+ and z− of the three components are all lower than 0.2 at all scales. The coherence of the ⊥2 component is close to 0.2 and the values of coherence of the ⊥1 and ‖ components are close to 0.
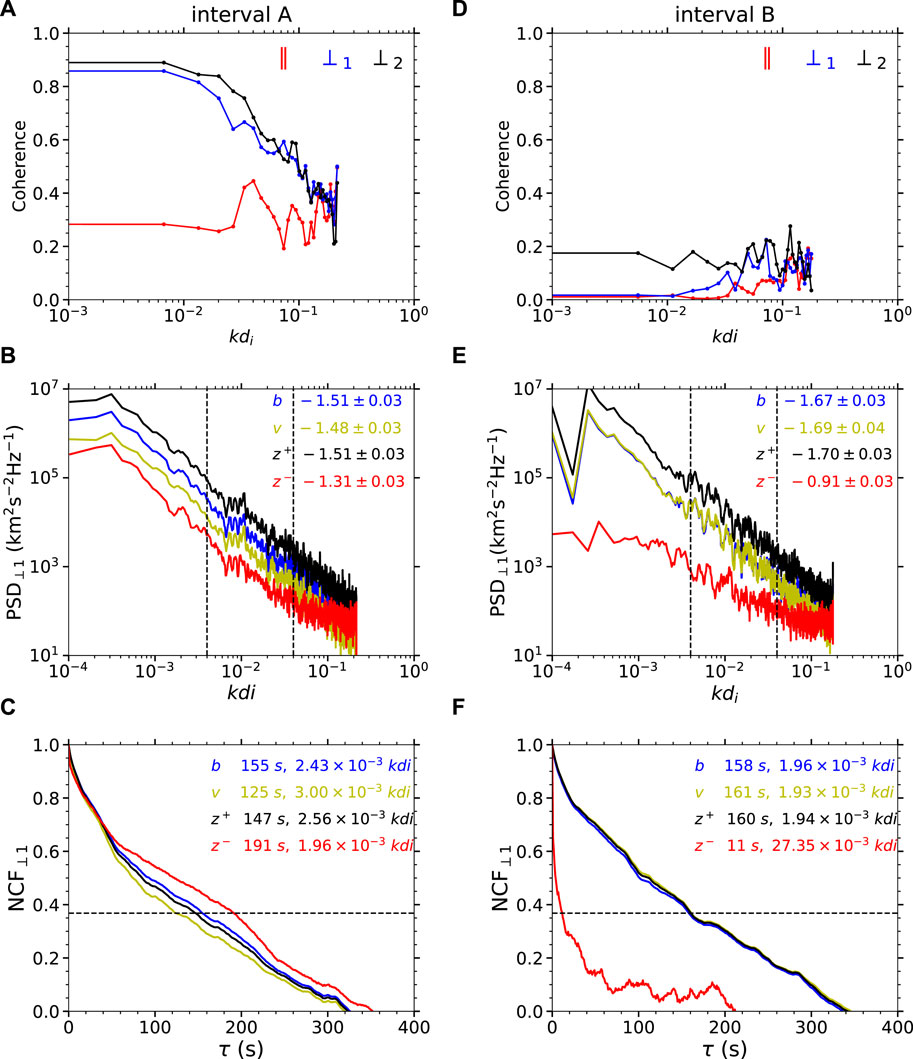
FIGURE 6. Left panels are for interval (A). (A) The coherence spectra between z+ and z− in the three directions in the field-aligned coordinates (‖ in red; ⊥1 in blue and ⊥2 in black). (B) The power spectra of four variables (b in blue; v in yellow; z+ in black; z− in red) in the ⊥1 direction with the corresponding slopes and their standard deviations obtained from the linear fit in the log-log space shown at the right corner. The two black dashed lines mark the range for the least squares fit to the spectra on the log-log plot. (C) The normalized self-correlation functions (NCF) of four variables (b in blue; v in yellow; z+ in black; z− in red) in the ⊥1 direction with the corresponding correlation length (where NCF = 1/e) shown at the right corner. The black dashed line denotes 1 = e. Right panels (D–F) are for interval B with the same format as the left panels (A–C).
In the middle panels of Figure 6, we show the power spectra of δb, δv, z+, and z− for the ⊥1 component to be clear. We can see for both interval A in the left panel and interval B in the right panel, the power spectra of z− are much lower than those of z+. The magnetic spectrum of interval A is dominated over the velocity spectra, while the magnetic spectrum and the velocity spectrum of interval B almost overlap. We perform the least squares fit to the spectra on the log-log plot from 0.004 to 0.04 kdi and obtained the estimated spectral indices. For interval A, the spectral indices of magnetic field, velocity and z+ are all close to −3/2 and the spectral index of z− is −1.31. For interval B, the spectral indices of magnetic field, velocity and z+ are all close to −5/3 and the spectral index of z− is −0.91.
In the bottom panels of Figure 6, we show the normalized self-correlation functions of the ⊥1 components of δb, δv, z+, and z−. NCFs of δb, δv, z+ for both interval A and interval B decrease gradually as time lags τ increase. The correlation lengths are of the same order around 150 s. However, z− is distinguished from the others: NCFs is similar with that of z+ for interval A but drops dramatically to 1/e at only 11 s for intervals B. This means that the relation of the value of z− at a time instant with another instant for intervals B weakens quickly as the distance increases.
4 Conclusions and discussion
In this study, we use the PSP measurements in the slow solar wind from 0.1–0.3 au and calculate the coherence spectra between Els
We analyze two intervals in detail. Interval A is a typical event of MVAS with high coherence and interval B is highly Alfvénic with low coherence. The wavelet spectra of coherence is shown together with the phase difference for the ⊥1 component of z+ and z−. For interval A, the high coherence corresponds to a close to 180° phase difference. The coherence spectra present a clear 2D anisotropy with high (up to 0.85) coherence at large scale for the perpendicular components. The spectral indices of δb, δv, z+ are all around −3/2, while the spectra of z− is flatter with the spectral indices −1.31. The correlation lengths of z+ and z− are at the same order. These results support the scenario that the fluctuations of MVAS are involved in the nonlinear interactions of the solar wind turbulence as proposed in IK theory. The high coherence of z+ and z− may indicate that z+ and z− both originate from MVAS, which complete the nonlinear interactions in the MVAS and contribute to the slow solar wind turbulence.
For interval B, the low coherence corresponds to a close to 90° or 270° phase difference. The coherence spectra are nearly isotropically low with a slight higher (around 0.2) coherence for the ⊥2 component. The spectral indices of δb, δv, z+ are all around −5/3, while the spectra of z− is flatter with the spectral indices −0.91. The correlation lengths of z+ are at the same order with that of δb and δv. However, the normalized self-correlation function of z− drops very quickly and comes to 1/e at only 11 s. The highly Alfvénic fluctuations, the close to −1 spectral index and the small correlation length of z− all imply that z− could not be the inward Alfvénic fluctuations as suggested by Wang et al. (2018). It may be the co-propagating anomalous fluctuations generated in the imbalanced Alfvénic turbulence (Yang et al., 2023). The different origin of z+ and z− may indicate different nonlinear interactions in AF from that in MVAS.
Coherence is a useful window to unveil the nonlinear interactions. Our work suggests that there may exist two kinds of nonlinear interactions in the slow solar wind turbulence. One is in the MVAS, completed by the z+ and z− generated by the MVAS. Another is in the AF between the outward Alfvénic fluctuations and the possible co-propagating anomalous fluctuations. The two kinds may have other different properties, for example, the spectral index of z+. However, due to the limitation of the data, we do not obtain two clearly different statistical distributions of the spectral index for both Alfvénic fluctuations and MVAS. The uncertainty of density measurements may be a major reason. Using the proton density estimated from QTN, we find that the number of MVAS greatly decreases. Thus part of the MVAS determined using SPC data could be pseudo structures and z+ and z− both are influenced by the uncertainty, leading to a larger value of their coherence. The measurement effect should be investigated in the future. The differences between interval A and interval B could also reflect two stages of the evolution of the solar wind turbulence across scale or during the solar wind expansion.
Data availability statement
Publicly available datasets were analyzed in this study. This data can be found here: NASA’s Space Physics Data Facility (https://cdaweb.gsfc.nasa.gov/index.html/).
Author contributions
HW: Conceptualization, Data curation, Formal Analysis, Funding acquisition, Investigation, Methodology, Project administration, Visualization, Writing–original draft, Writing–review and editing. LY: Conceptualization, Data curation, Formal Analysis, Methodology, Writing–review and editing. SH: Data curation, Formal Analysis, Writing–review and editing.
Funding
The author(s) declare financial support was received for the research, authorship, and/or publication of this article. This work is supported by the National Key R&D Program of China (Grant No. 2022YFF0503700), the National Natural Science Foundation of China under contract Nos. 42104152 and 41974198.
Acknowledgments
We acknowledge the NASA Parker Solar Probe mission team and the SWEAP team led by J.C. Kasper, and the FIELDS team led by S.D. Bale, for the use of PSP data.
Conflict of interest
The authors declare that the research was conducted in the absence of any commercial or financial relationships that could be construed as a potential conflict of interest.
Publisher’s note
All claims expressed in this article are solely those of the authors and do not necessarily represent those of their affiliated organizations, or those of the publisher, the editors and the reviewers. Any product that may be evaluated in this article, or claim that may be made by its manufacturer, is not guaranteed or endorsed by the publisher.
References
Alberti, T., Benella, S., Consolini, G., Stumpo, M., and Benzi, R. (2022). Reconciling parker solar probe observations and magnetohydrodynamic theory. Astrophysical J. Lett. 940, L13. doi:10.3847/2041-8213/aca075
Bale, S. D., Goetz, K., Harvey, P. R., Turin, P., Bonnell, J. W., Dudok de Wit, T., et al. (2016). The FIELDS instrument suite for solar probe plus. Measuring the coronal plasma and magnetic field, plasma waves and turbulence, and radio signatures of solar transients. Space Sci. Rev. 204, 49–82. doi:10.1007/s11214-016-0244-5
Boldyrev, S. (2006). Spectrum of magnetohydrodynamic turbulence. Phys. Rev. Lett. 96, 115002. doi:10.1103/PhysRevLett.96.115002
Bourouaine, S., and Perez, J. C. (2018). On the limitations of taylor’s hypothesis in parker solar probe’s measurements near the alfvén critical point. Astrophysical J. Lett. 858, L20. doi:10.3847/2041-8213/aabccf
Breech, B., Matthaeus, W. H., Minnie, J., Bieber, J. W., Oughton, S., Smith, C. W., et al. (2008). Turbulence transport throughout the heliosphere. J. Geophys. Res. Space Phys. 113. doi:10.1029/2007JA012711
Bruno, R., and Carbone, V. (2013). The solar wind as a turbulence laboratory. Living Rev. Sol. Phys. 10, 2. doi:10.12942/lrsp-2013-2
Bruno, R., D’Amicis, R., Bavassano, B., Carbone, V., and Sorriso-Valvo, L. (2007). Magnetically dominated structures as an important component of the solar wind turbulence. Ann. Geophys. 25, 1913–1927. doi:10.5194/angeo-25-1913-2007
Case, A. W., Kasper, J. C., Stevens, M. L., Korreck, K. E., Paulson, K., Daigneau, P., et al. (2020). The solar probe cup on the parker solar probe. Astrophysical J. Suppl. Ser. 246, 43. doi:10.3847/1538-4365/ab5a7b
Chandran, B. D. G., Quataert, E., Howes, G. G., Xia, Q., and Pongkitiwanichakul, P. (2009). Constraining low-frequency alfvénic turbulence in the solar wind using density-fluctuation measurements. Astrophysical J. 707, 1668–1675. doi:10.1088/0004-637x/707/2/1668
Chandran, B. D. G., and Perez, J. C. (2019). Reflection-driven magnetohydrodynamic turbulence in the solar atmosphere and solar wind. J. Plasma Phys. 85, 905850409. doi:10.1017/S0022377819000540
Chen, C. H. K., Bale, S. D., Bonnell, J. W., Borovikov, D., Bowen, T. A., Burgess, D., et al. (2020). The evolution and role of solar wind turbulence in the inner heliosphere. Astrophysical J. Suppl. Ser. 246, 53. doi:10.3847/1538-4365/ab60a3
Del Zanna, L. (2001). Parametric decay of oblique arc-polarized alfvén waves. Geophys. Res. Lett. 28, 2585–2588. doi:10.1029/2001GL012911
Denskat, K. U., and Neubauer, F. M. (1983). Observations of hydromagnetic turbulence in the solar wind. Solar Wind Five, 81–92.
Goldreich, P., and Sridhar, S. (1995). Toward a theory of interstellar turbulence. 2: strong alfvenic turbulence. Astrophys. J. 438, 763–775. doi:10.1086/175121
Grappin, R., Mangeney, A., and Marsch, E. (1990). On the origin of solar wind MHD turbulence: Helios data revisited. J. Geophys. Res. 95, 8197–8209. doi:10.1029/JA095iA06p08197
Howes, G. G., Cowley, S. C., Dorland, W., Hammett, G. W., Quataert, E., and Schekochihin, A. A. (2008). A model of turbulence in magnetized plasmas: implications for the dissipation range in the solar wind. J. Geophys. Res. Space Phys. 113. doi:10.1029/2007JA012665
Kasper, J. C., Abiad, R., Austin, G., Balat-Pichelin, M., Bale, S. D., Belcher, J. W., et al. (2016). Solar wind Electrons Alphas and protons (SWEAP) investigation: design of the solar wind and coronal plasma instrument suite for solar probe plus. Space Sci. Rev. 204, 131–186. doi:10.1007/s11214-015-0206-3
Klein, K. G., Howes, G. G., and TenBarge, J. M. (2014). The violation of the taylor hypothesis in measurements of solar wind turbulence. Astrophysical J. Lett. 790, L20. doi:10.1088/2041-8205/790/2/l20
Klein, K. G., Perez, J. C., Verscharen, D., Mallet, A., and Chandran, B. D. G. (2015). A modified version of taylor’s hypothesis for solar probe plus observations. Astrophysical J. Lett. 801, L18. doi:10.1088/2041-8205/801/1/L18
Kolmogorov, A. (1941). The local structure of turbulence in incompressible viscous fluid for very large Reynolds’ numbers. Akad. Nauk. SSSR Dokl. 30, 301–305.
Kraichnan, R. H. (1965). Inertial-range spectrum of hydromagnetic turbulence. Phys. Fluids 8, 1385–1387. doi:10.1063/1.1761412
Malara, F., Primavera, L., and Veltri, P. (2001). Nonlinear evolution of the parametric instability: numerical predictions versus observations in the heliosphere. Nonlinear Process. Geophys. 8, 159–166. doi:10.5194/npg-8-159-2001
Marsch, E., and Tu, C. Y. (1989). Dynamics of correlation functions with Elsässer variables for inhomogeneous MHD turbulence. J. Plasma Phys. 41, 479–491. doi:10.1017/S0022377800014033
Marsch, E., and Tu, C. Y. (1993). Modeling results on spatial transport and spectral transfer of solar wind Alfvénic turbulence. J. Geophys. Res. 98, 21045–21059. doi:10.1029/93JA02365
Matteini, L., Horbury, T. S., Neugebauer, M., and Goldstein, B. E. (2014). Dependence of solar wind speed on the local magnetic field orientation: role of Alfvénic fluctuations. Geophys. Res. Lett. 41, 259–265. doi:10.1002/2013GL058482
Matthaeus, W. H., and Goldstein, M. L. (1982). Measurement of the rugged invariants of magnetohydrodynamic turbulence in the solar wind. J. Geophys. Res. 87, 6011–6028. doi:10.1029/JA087iA08p06011
Perez, J. C., Bourouaine, S., Chen, C. H. K., and Raouafi, N. E. (2021). Applicability of taylor’s hypothesis during parker solar probe perihelia. A&A 650, A22. doi:10.1051/0004-6361/202039879
Shi, C., Velli, M., Tenerani, A., Rappazzo, F., and Réville, V. (2020). Propagation of alfvén waves in the expanding solar wind with the fast-slow stream interaction. Astrophysical J. 888, 68. doi:10.3847/1538-4357/ab5fce
Shi, M., Li, H., Xiao, C., and Wang, X. (2017). The parametric decay instability of alfvén waves in turbulent plasmas and the applications in the solar wind. Astrophysical J. 842, 63. doi:10.3847/1538-4357/aa71b6
Sioulas, N., Huang, Z., Shi, C., Velli, M., Tenerani, A., Bowen, T. A., et al. (2023). Magnetic field spectral evolution in the inner heliosphere. Astrophysical J. Lett. 943, L8. doi:10.3847/2041-8213/acaeff
Smith, C. W., Matthaeus, W. H., Zank, G. P., Ness, N. F., Oughton, S., and Richardson, J. D. (2001). Heating of the low-latitude solar wind by dissipation of turbulent magnetic fluctuations. J. Geophys. Res. Space Phys. 106, 8253–8272. doi:10.1029/2000JA000366
Taylor, G. I. (1938). The spectrum of turbulence. Proc. R. Soc. Lond. A Math. Phys. Eng. Sci. 164, 476–490. doi:10.1098/rspa.1938.0032
Torrence, C., and Compo, G. P. (1998). A practical guide to wavelet analysis. Bull. Am. Meteorological Soc. 79, 61–78. doi:10.1175/1520-0477(1998)079<0061:apgtwa>2.0.co;2
Tu, C. Y., and Marsch, E. (1990). Evidence for a “background” spectrum of solar wind turbulence in the inner heliosphere. J. Geophys. Res. 95, 4337–4341. doi:10.1029/JA095iA04p04337
Tu, C. Y., and Marsch, E. (1993). A model of solar wind fluctuations with two components: alfvén waves and convective structures. J. Geophys. Res. 98, 1257–1276. doi:10.1029/92JA01947
Tu, C.-Y., and Marsch, E. (1995). MHD structures, waves and turbulence in the solar wind: observations and theories. Space Sci. Rev. 73, 1–210. doi:10.1007/BF00748891
Velli, M., Grappin, R., and Mangeney, A. (1989). Turbulent cascade of incompressible unidirectional alfvén waves in the interplanetary medium. Phys. Rev. Lett. 63, 1807–1810. doi:10.1103/PhysRevLett.63.1807
Wang, X., Tu, C., and He, J. (2020). Fluctuation amplitudes of magnetic-field directional turnings and magnetic-velocity alignment structures in the solar wind. Astrophysical J. 903, 72. doi:10.3847/1538-4357/abb883
Wang, X., Tu, C. Y., He, J. S., Wang, L. H., Yao, S., and Zhang, L. (2018). Possible noise nature of elsässer variable z− in highly alfvénic solar wind fluctuations. J. Geophys. Res. (Space Phys. 123, 57–67. doi:10.1002/2017JA024743
Wu, H., Tu, C., Wang, X., and Yang, L. (2021). Magnetic and velocity fluctuations in the near-sun region from 0.1-0.3 au observed by parker solar probe. Astrophysical J. 922, 92. doi:10.3847/1538-4357/ac3331
Yang, L., He, J., Verscharen, D., Li, H., Bowen, T., Bale, S., et al. (2023). Energy transfer of imbalanced Alfvénic turbulence in the heliosphere. Nat. Commun. 14, 7955. doi:10.1038/s41467-023-43273-4
Zank, G. P., Dosch, A., Hunana, P., Florinski, V., Matthaeus, W. H., and Webb, G. M. (2012). The transport of low-frequency turbulence in astrophysical flows. I. Governing equations. Astrophysical J. 745, 35. doi:10.1088/0004-637X/745/1/35
Keywords: solar wind, turbulence, magnetic field, interplanetary medium, in situ observation
Citation: Wu H, Yang L and Huang S (2024) Coherence of Elsässer Variables in the slow solar wind from 0.1 au to 0.3 au. Front. Astron. Space Sci. 10:1329284. doi: 10.3389/fspas.2023.1329284
Received: 28 October 2023; Accepted: 14 December 2023;
Published: 08 January 2024.
Edited by:
Chen Shi, University of California, United StatesReviewed by:
Zesen Huang, University of California, United StatesLingling Zhao, University of Alabama in Huntsville, United States
Copyright © 2024 Wu, Yang and Huang. This is an open-access article distributed under the terms of the Creative Commons Attribution License (CC BY). The use, distribution or reproduction in other forums is permitted, provided the original author(s) and the copyright owner(s) are credited and that the original publication in this journal is cited, in accordance with accepted academic practice. No use, distribution or reproduction is permitted which does not comply with these terms.
*Correspondence: Honghong Wu, aG9uZ2hvbmd3dUB3aHUuZWR1LmNu