 Garrett Zills1
 Serena Criscuoli
- 1Department of Chemistry and Physics, Augusta University, Augusta, GA, United States
- 2National Solar Observatory, Boulder, CO, United States
Studies of stellar magnetic fields mostly rely on proxies derived from chromospheric lines, typically forming in the UV and shorter wavelengths and therefore accessible only from space based observatories. Even Ca II K or H observations, forming in regions accessible from the ground, are not always available. As a result, there is a crucial need to explore alternative activity proxies to overcome the limitations posed by observational constraints. Using sun-as-a-star observations acquired with the ISS at SOLIS we investigated the correlation between the Ca II K emission index and indices derived from the Hα 656.3 nm and Ca II 854.2 nm lines, which are well known chromospheric diagnostics. We found that both the core intensities and widths of the two lines are positively correlated with the Ca II K emission index (ρ ≳ 0.8), indicating their suitability as reliable indicators of magnetic activity, the width of the Hα line showing the highest correlation (ρ = 0.9). We also found that such correlations vary with the activity cycle. Specifically, during the analyzed cycle 24, the correlations with the Ca II K index varied 14% for the Hα width, 33% for the Hα core intensity, and doubled for the two Ca II 854.2 nm line indices. These results suggest that, among the investigated indices, the Hα width best traces magnetic activity. Results are discussed at the light of current knowledge of the formation heights of the two lines, and of spatially resolved solar observations.
1 Introduction
The analysis of spectral lines is an essential tool in astrophysics for extracting fundamental physical parameters of stars and their atmospheres, as well as investigating properties of planets and their orbits. Indicators derived from lines forming in the chromosphere and transition region are particularly important for investigating magnetic variability at different temporal scales. However, several chromospheric indicators that show high sensitivity to magnetic activity, like Lyα, Fe II and Mg II h and k lines, form in the ultraviolet (UV) region, restricting their observation to space-based platforms. Moreover, Lyα is notoriously affected by interstellar medium absorption which complicates the interpretation of this line (e.g., Youngblood et al., 2016; Smith et al., 2017). For these reasons, the most widely used chromospheric lines are the Ca II K and H lines (393 and 397 nm, respectively), which form in the near UV part of the spectrum and are accessible from the ground. These lines are well known proxies of the photospheric magnetic field (e.g., Babcock and Babcock, 1955; Leighton, 1959; Cincunegui and Mauas, 2004; Ermolli et al., 2010; Fontenla et al., 2011; Bertello et al., 2016; Pevtsov et al., 2016; Petrie et al., 2021; Tähtinen et al., 2022), and they are employed for a variety of studies which include dynamo processes (Skumanich, 1972; Saar and Brandenburg, 1999; Chowdhury et al., 2022; Velloso et al., 2023), the characterization of stellar magnetic fields from the photosphere to the outer layers of stellar atmospheres and winds (e.g., Testa et al., 2015; Reda et al., 2022; Reda et al., 2023), estimates of UV and EUV stellar radiative emission (Lovric et al., 2017; Criscuoli et al., 2018; Sreejith et al., 2020) and long-term monitoring of stellar cycles (e.g., Baliunas et al., 1995; Hall et al., 1995; Egeland et al., 2017; Radick et al., 2018; Buccino et al., 2020). Given that synoptic measurements of the magnetic fields started only in the 1950s, while Ca II UV measurements date back to the beginning of 1900s, the latter are fundamental diagnostics of the long term evolution of the solar magnetic field (e.g., Chatzistergos et al., 2022b), and a fundamental input for solar irradiance reconstructions particularly at times when these were not available (e.g., Berrilli et al., 2020; Chatzistergos et al., 2021; Penza et al., 2022).
In the recent years, there has been an increasing interest in understanding magnetic activity and its effects on stellar radiative emission, as spectral variability may critically affect exoplanet detectability (e.g., Santos et al., 2000; Al Moulla et al., 2023) as well as our ability to estimate the properties of exoplanet’s atmospheres (Rackham et al., 2023). Numerous efforts have therefore been dedicated to investigate different activity diagnostics, especially at spectral ranges accessible from the Earth. These include the Hydrogen Balmer lines, Na D1 and D2, the Ca II infrared triplet and He I D3, among others (e.g., Maldonado et al., 2019; Thompson et al., 2020; de Grijs and Kamath, 2021).
In this paper we investigate and compare the variability of line properties of the Hα 656.3 nm and Ca II 854.2 nm lines obtained from sun-as-a-star observations. We focus on these two lines because, together with Ca II UV lines, Hα 656.3 nm and of Ca II 854.2 nm are among the few lines forming in the chromosphere accessible from the ground, and as such, are widely used chromospheric diagnostics (e.g., de la Cruz Rodríguez and van Noort, 2017).
Sun-as-a-star observations show that the Ca II 854.2 nm line core intensity is positively correlated with solar activity (e.g., Livingston et al., 2010), which also modulates the bisector of the line profile (Pietarila and Livingston, 2011). The Ca II infrared lines as activity indicators have gained increasing attention after the launch of GAIA (Gaia Collaboration et al., 2016), which does not observe the Ca II K or other activity indicators, but uses observations in the Ca II infrared triplet to detect planets via radial velocity measurements (e.g., Busà et al., 2007; Martin et al., 2017; Lanzafame et al., 2023). Similarly, the Calar Alto high-Resolution search for M dwarfs with Exoearths with Near-infrared and optical Échelle Spectrographs (CARMENES, Quirrenbach et al., 2016) does not observe in the Ca II K range but observes at wavelengths longer than 520 nm. The small (compared to other ranges) contamination from telluric and photosperic lines in the Ca II infrared triplet range, also facilitates the interpretation of measurements of these lines (de Grijs and Kamath, 2021). Previous studies indicate that the Ca II infrared triplet lines are indeed excellent activity indicators, meaning that indices extracted from these lines are positively correlated with other activity indicators as those derived from the Ca II UV lines (Martin et al., 2017; Long et al., 2021; Lanzafame et al., 2023), especially for late type stars (e.g., Dempsey et al., 1993; Zhang et al., 2016).
The importance of studying the variability of Hydrogen Balmer lines on different temporal scales lies in their application as diagnostics for various phenomena, including the modeling of stellar flares (Capparelli et al., 2017; Kowalski et al., 2017; Kowalski et al., 2022), the detection and characterization of stellar coronal mass ejections (Vida et al., 2019; Namekata et al., 2021; Leitzinger and Odert, 2022), and the estimation of stellar parameters (e.g., Barklem et al., 2002; Bergemann et al., 2016; Amarsi et al., 2018). Balmer lines serve also as diagnostics of the outer layers of exoplanetary atmospheres (Huang et al., 2017), necessitating a comprehensive understanding of their variability on stellar-rotational timescales to accurately assess the contribution of stellar contamination, especially from magnetic activity (e.g., Cauley et al., 2018; Chen et al., 2020). However, several observational studies conducted on samples of F-G-K stars reported that the variability of Balmer (especially Hα) and Ca II K indices can exhibit correlations, anti-correlations, or no discernible pattern (e.g., Strassmeier et al., 1990; Cincunegui et al., 2007; Gomes da Silva et al., 2014; Flores et al., 2018; Meunier et al., 2022). Recent works by Marchenko et al. (2021); Criscuoli et al. (2023b) showed that the variability on the rotational scale of core-to-wing ratio indices derived from Balmer lines is strongly modulated by the passage of sunspots, and almost insensitive to the presence of network and plage, thus following patterns more similar to the ones observed for photospheric, rather than chromospheric indices. Analysis of sun-as-a-star observations acquired with the Integrated Sunlight Spectrometer at SOLIS (Criscuoli et al., 2023b) and with the Fourier Transform Spectrometer at McMath-Pierce Solar telescope (Livingston et al., 2007; Meunier and Delfosse, 2009; Livingston et al., 2010) indicate that on the solar cycle scale, the Hα core-to-wing ratio index is highly correlated (r ≥ 0.7) with indices derived from the Ca II K line. Meunier and Delfosse (2009); Criscuoli et al. (2023b) also found that the correlation between the two indices is not constant over the magnetic cycle, but increases during periods of increasing activity and decreases during periods of low activity. Criscuoli et al. (2023b) suggested that the observed complex relation between the Hα and Ca II K indices should be ascribed to the temperature response function of the Hα core picking in the lower layers of the photosphere. In this work we expand the analysis presented in Criscuoli et al. (2023b) by studying the variability of both the width and core of Hα and comparing them to the variability of the same indices derived from the Ca II 854.2 nm line.
In Section 2 we describe our observations, followed by a presentation of our analysis of the variability of the Ca II 854.2 nm line and the Hα line in Section 3. In Section 4 we then discuss our results in the context of spatially resolved solar observations and conclusions are drawn in Section 5.
2 Data sets and methods
Our analysis is based on a collection of ground-based solar observations acquired daily using the highly advanced Integrated Sunlight Spectrometer (ISS) (Pevtsov et al., 2014) over a span of about 7 years, from September 2007 to June 2014. The ISS is one of the three instruments comprising the Synoptic Optical Long-term Investigations of the Sun (SOLIS), a synoptic facility for solar observations over a long time frame operated by the National Solar Observatory. The ISS is a spectrograph that acquires disk-integrated observations of the Sun in ten spectral bands with resolving power R
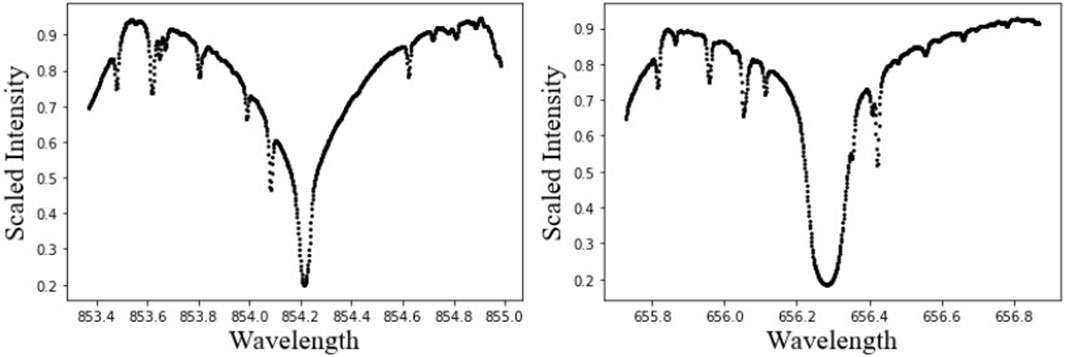
FIGURE 1. Examples of disk-integrated solar profiles acquired with ISS at SOLIS. Left: Ca IR 854.2 nm line. Right: Hα 656.3 nm line. The drop of intensity at the edges of the spectral windows is due to the shape of the prefilters.
For both Hα and Ca II IR lines, the core intensity (IC, hereafter) was estimated by a parabolic fit of the spectral region around the intensity minima. The line width was defined as the full-width-at-half-maximum (FWHM, hereafter), which was computed as the difference between the two wavelength points where the intensity is closest to twice the core intensity plus half the difference between core and continuum intensity. We found this method to provide more reliable results than fitting the lines with analytical functions as Gaussian or Voight functions.
We compare the variations of line profile properties with the NSO Ca II K emission index composite (Bertello et al., 2016), which is a widely used tracer of magnetic activity (see Section 1).
3 Results
3.1 Variability
In Figure 2 we show the variability of the FWHM and IC derived from the two lines, together with the Ca II K Emission Index and the sunspot number1. Clearly, all indices increase over time, showing a minimum in 2009 and a maximum in 2014 (the maximum of solar cycle 24 occurred in 2015). However, different indices show different trends. Both the Ca II K Emission Index and the sunspot number show a rapid increase in the period 2010-2012, and a smaller increase, with large fluctuations after 2012. The indices extracted from the Ca IR line, instead, remain rather flat until about 2013, when they show a sharp increase. Finally, the indices derived from the Hα line present more gradual increase until 2013. It is also important to note that while the Ca II K Emission Index shows a variability of approximately 12%, the variability of the indices derived from the Ca IR and Hα lines ranges between 4% and 6%. We return on this point in Section 4.
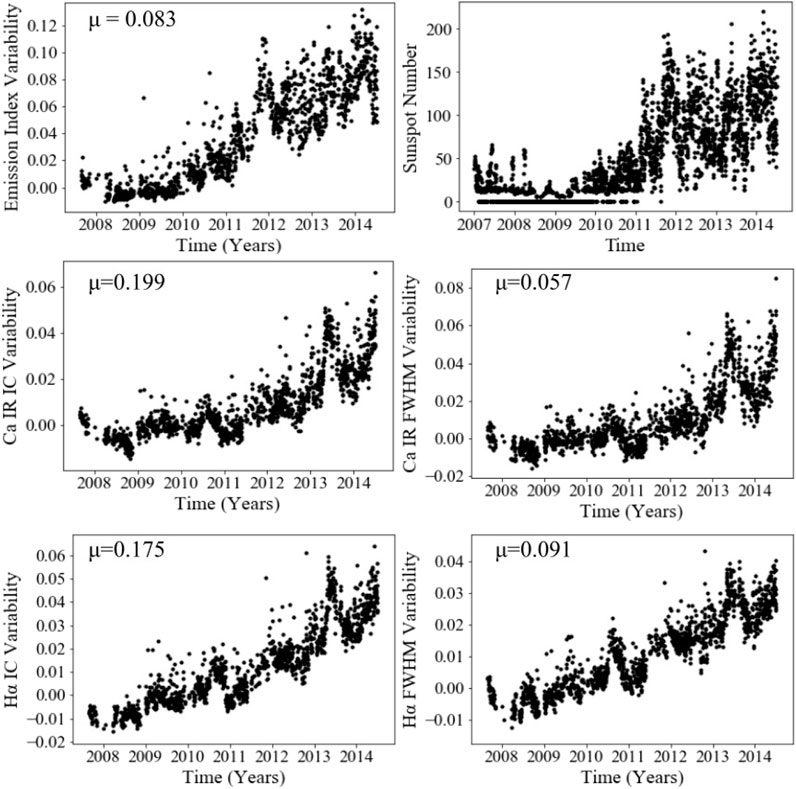
FIGURE 2. Variability of the Ca II K Emission Index and of the line parameters derived from the Hα and Ca IR lines. The variability is here defined as the relative variation with respect to 2009, during which the minimum between cycles 23 and 24 occurred. In each plot μ is the average value of the corresponding shown quantity measured in 2009. The sunspot number in the same period is also shown for comparison.
In order to investigate and compare which of the indices best reproduces the Ca II K index, we compute the Spearman’s rank correlation coefficients between the Emission Index and the indices extracted from Ca IR and Hα lines. The Spearman’s rank correlation coefficient allows to evaluate the degree to which the connection between two variables can be expressed through a (non linear) monotonic function.
3.2 Overall correlations
We first investigated the relation between the different indices over the whole observational range spanning from September first 2007 to July third 2014. Figure 3 shows the scatter plots between the Ca II K emission index and the indices derived from the Ca IR and Hα lines, together with the computed Spearman’s rank correlation coefficient ρ. All the four indices show a high degree of correlation (at a confidence level better than 99.9%) with the Ca II K emission index, the highest correlation found for the Hα FWHM index, and the lowest for the Ca IR FWHM. However, a large scatter is observed at times of high activity (Ca II K emission index larger than 0.086) especially for the indices derived from the Ca IR line, most likely due to the increase of rotational variability. The plots also show that the relation with the Ca II K emission index changes with time, especially in the case of the Ca IR line, in agreement with the trends reported in Figure 2. Changes in relations between activity indices are not uncommon (e.g., Criscuoli, 2016; Pevtsov et al., 2016; Lovric et al., 2017; Salabert et al., 2017; Criscuoli et al., 2018; Chatzistergos et al., 2022a; Meunier et al., 2022) and typically result from differences in the way in which different indices react to magnetic activity, which, in turn, result from different sensitivity to changes in atmospheric parameters, as temperature and pressure, formation height, and different sensitivity to the magnetic field itself, via, e.g., the Zeeman effect. Variations of the relation between the Hα and Ca II IR indices and the Ca II K index are discussed in next session.
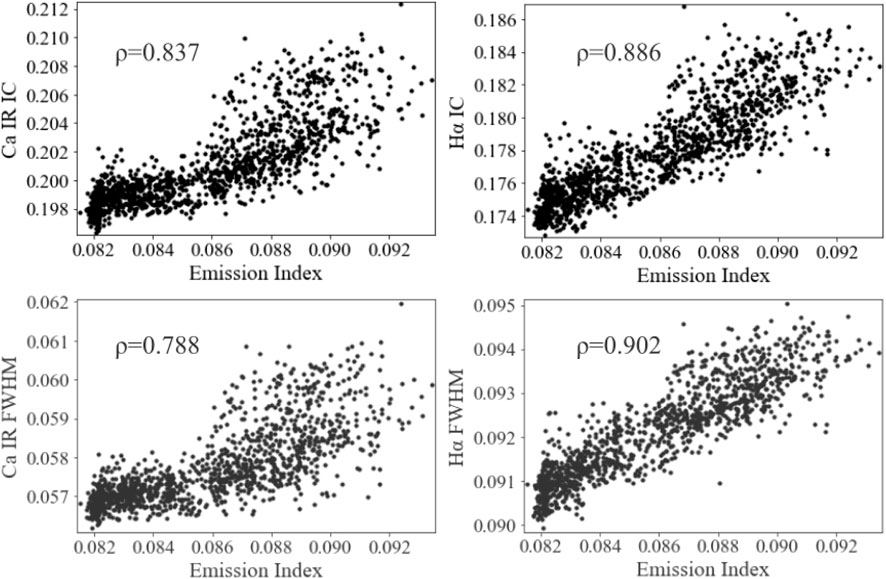
FIGURE 3. Relations between the Ca II K Emission Index and the indices derived from the observations of Hα and Ca IR lines. ρ is the Spearmann’s rank correlation coefficient.
Figure 4 shows the scatter plots of the FWHM and the IC derived from the two lines. The Spearman’s rank correlation coefficients between the indices is rather high in both case, and deviations from a simple linear trend are also clear. However, the plots also show less dispersion than when comparing the indices with the Ca II K Emission Index (Figure 2).
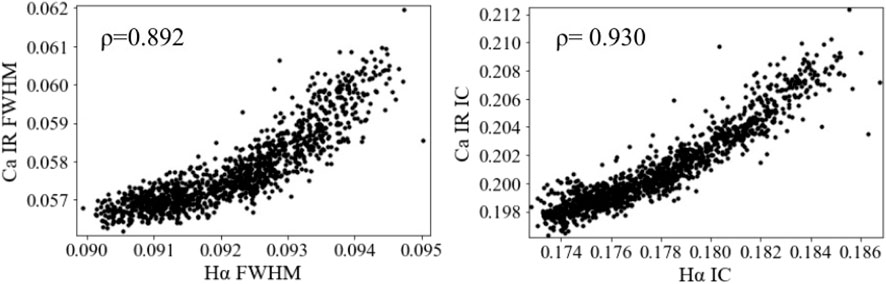
FIGURE 4. Relations between the indices derived from the Hα and the Ca IR lines. Spearman’s rank correlation coefficient (ρ) is also shown.
3.3 Running correlations
Previous studies (Meunier and Delfosse, 2009; Criscuoli et al., 2023b) showed that the correlation between the Hα core-to-wing ratio and Ca II K activity indices vary over the magnetic cycle, dimming during periods of minima and increasing during the ascending phase. To investigate whether similar behaviours are found for the FWHM and IC of the Ca IR line and for the FWHM of Hα line, following Criscuoli et al. (2023b) we computed the Spearman’s correlation coefficients over 4-year running, overlapping 1 day difference windows. We chose a 4-year window because Meunier and Delfosse (2009); Criscuoli et al. (2023b) showed that with shorter temporal windows the correlation between indices strongly depends on the temporal region and on the length of the window. Temporal windows larger than about 3 years tend instead to produce more consistent results, most likely due to the better statistics. Results are shown in Figure 5.
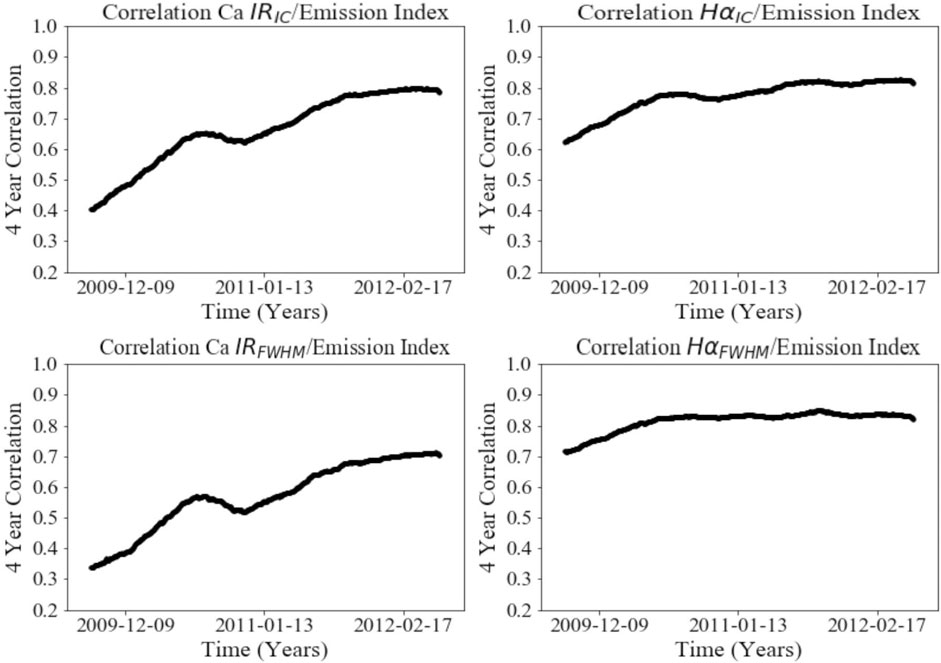
FIGURE 5. Temporal variation of the 4-year Spearman’s rank correlation between the indices derived from the Hα and Ca IR lines and the Ca II K Emission Index.
In agreement with previous studies, all indices show a temporal trend similar to the one reported for the Hα core-to-wing ratio, that is a gradual increase of the correlations as the activity ramps up. However, indices derived from the Ca IR line show larger variations, the correlation ranging between 0.4 and 0.8 in the case of Ca IR IC and 0.3-0.7 in the case of Ca IR FWHM. Indices derived from Hα show smaller variations, Hα IC varying between 0.6 and 0.8 and the Hα FWHM showing an almost constant behaviour, ranging between 0.7 and 0.8.
These results, together with the ones reported in Section 3.1, suggest that indices derived from Hα more closely follow the trends of in the Ca II K Emission Index, the Hα FWHM being the best overall.
We then investigated the trends of the 4-year correlations between the indices computed from Hα and Ca IR lines. Results, shown in Figure 6, indicate that, in agreement with results shown in Section 3.2, overall the indices derived from the Hα and Ca IR lines present higher degree of correlation among themselves rather than with the Ca II K Emission Index, exceeding 0.9 in the case of the IC indices, while relatively large fluctuations are found from the minimum to the maximum of activity.
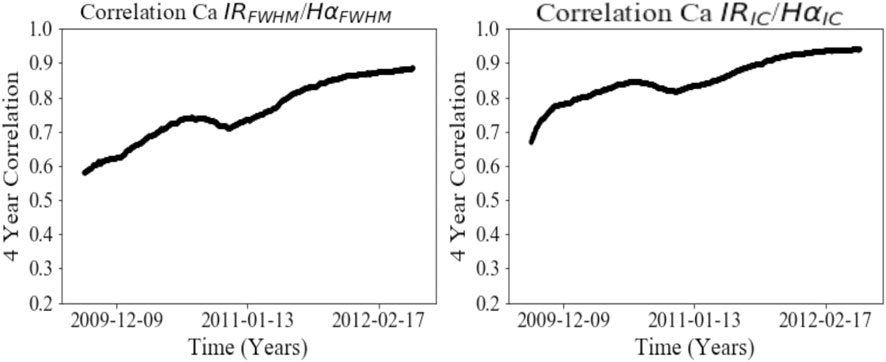
FIGURE 6. Temporal variation of the 4-year Spearman’s rank correlation between the indices derived from the Hα and Ca IR lines.
4 Discussion
As mentioned above, the relation between the Hα core-to-wing ratio and activity has already been investigated in previous studies. In particular, our results are in qualitative agreement with the analysis of Criscuoli et al. (2023b), who also analyzed ISS observations. However, results reported in this study show a higher and steadier correlation with the Ca II K index over time. Difference are to be ascribed to 1) the use of the Spearman’s rank correlation coefficient instead of the Pearson’s coefficient; 2) the use in this study of the Ca II K emission index instead of the Ca II K plage index employed in Criscuoli et al. (2023b). Results presented in this study are more similar to the correlations found by Meunier and Delfosse (2009), who also employed the Ca II K Emission Index.
The fact that we find a better, and steadier correlation between the Ca II K Emission Index and the Hα FWHM index than the Hα IC index, is in agreement with results obtained from the analysis of spatially resolved observations. Specifically, Molnar et al. (2019); Tarr et al. (2023) found that the Hα FWHM well correlates with brightness temperature derived from ALMA measurements in the chromosphere, which, as explained in Section 1, typically show higher magnetic sensitivity than diagnostics forming in the photosphere. On the other hand, Cauzzi et al. (2009), who also analyzed spatially resolved observations, found that the Hα core intensity is almost insensitive to the presence of network, a result later confirmed by the analysis of disk-integrated observations and models presented in Criscuoli et al. (2023b), thus reducing the overall correlation of Hα IC with the Ca II K emission index especially during periods of low activity.
The trends found for Ca IR FWHM are also in qualitative agreement with what one would expect from results obtained from spatially resolved observations and theoretical considerations. The wings of the Ca IR line form and have a larger response in the photosphere (Andretta et al., 2005), so that it is no surprise that the Ca IR FWHM shows overall lower, and more variable correlation over the cycle with the Ca II K Emission Index. However, following discussion in Cauzzi et al. (2009); Criscuoli et al. (2023b) we would have expected the trends of Ca IR FWHM to more closely follow the trends found for Hα IC, the latter also showing trends more typical of photospheric, rather than chromospheric, indices.
Spatially resolved observations also indicate that the Ca IR core fills more than the Hα core in magnetic regions (Cauzzi et al., 2009; Chae et al., 2021). In particular, Chae et al. (2021) found that in plage regions the Ca IR core may fill and go into emission, showing features similar to the Ca II K line, while the Hα line is always in absorption. For Ca IR IC we would have therefore expected larger variability, and higher and more constant (over time) correlation with the Ca II Emission Index, especially when compared with the Hα IC. Following the discussion in Cauzzi et al. (2009) we would have also expected the Ca IR IC and the Hα FWHM to display similar results, these two indices displaying a similar sensitivity to temperature.
Most likely, the (partial) discrepancies between results presented in this study and what is expected from the analysis of spatially resolved observations and models should be ascribed to residual calibration and instrumental issues in ISS observations. Criscuoli et al. (2023b), by comparing Hα core-to-wing ratio variability from ISS with results obtained from models and from McMath Pierce observations (Livingston et al., 2010) noted that the variability of Hα is most likely overestimated by the ISS. Similarly, we note here that the variability of Ca IR IC measured by the ISS is larger than the variability (min-to-max) measured with the McMath Pierce (Livingston et al., 2010) during cycle 23, which was more active than cycle 24. On the other hand, both Ca IR indices derived from ISS seem to show no long-term (years) trend (see Figure 2) until 2012, although the ascending phase of cycle 24 started in 2010, which is at odds as well with results presented in Livingston et al. (2010) and subsequent analysis by Pietarila and Livingston (2011).
Caution should be exercised when extrapolating our results to stars other than the Sun, especially to fast rotators. With an equatorial velocity of 2.2 km ⋅ s−1, the Sun is a slow rotator and rotational broadening effects are negligible, thus making it ideal to study magnetically induced effects. For stars other than the Sun, however, rotational broadening effects have to be compensated for by either making use of models or observed line profiles of non-active stars (Andretta et al., 2005; Busà et al., 2007; Martin et al., 2017), but these methods are limited to the cases in which the rotational broadening is smaller than line-shape changes induced by magnetic activity. Typical limit value reported in the literature is v ⋅ sin(i) < 15 km ⋅ s−1 (although detailed calculations depend in general on the physical parameters of the star, e.g., surface gravity, metallicity and effective temperature, Collins et al., 1995; Andretta et al., 2005). For solar-like, slow rotators, the line shape parameters investigated in our study are likely to be very good activity indicators. Our conclusion that Hα FWHM is the best indicator is also likely to be true considering that line widths are typically less affected than line core intensities by rotational broadening. The sensitivity of the Ca II 854.2 nm line, on the other hand, should be more carefully evaluated especially for faster rotators, this line being narrower than Hα and Doppler shift and limb-darkening being more pronounced in the IR.
Finally, for completeness we note that our results are in disagreement with results published in Toriumi and Airapetian (2022); Toriumi et al. (2022), who employed ISS observations calibrated making use of radiometric measurements, to investigate the relations between the Hα and Ca II 854.2 nm emission and the disk-integrated photospheric magnetic flux. Those authors found that the irradiance measured at the two spectral ranges shows a small, negative Pearson correlation coefficient with the magnetic flux, which is surprising given that the magnetic flux and the Ca II K emission are positively correlated, so that a positive correlation with the flux is expected according to our results. Indeed, results not shown, we found that the investigated line indices show a positive correlation with the photospheric magnetic flux derived from SOLIS observations (Bertello et al., 2012). Understanding the source of such discrepancies goes beyond the scope of this paper. However, we note that the degree of correlation between indices derived from ISS observations strongly depends on the data selection. As explained in Section 2, we restricted our analysis to the period 2007 - mid 2014 to avoid abrupt changes of line profiles associated with the instrument relocation. Additionally, we selected observations with minimal calibration uncertainties. We found that without such data selection, all the correlations between the various indices decrease. For instance, the Spearman correlation coefficient between the Hα IC and the Ca II K Emission index decreases from 0.886 to 0.33, and the Pearson correlation coefficient is −0.1, in line with the results published in both works by Toriumi et al. It is therefore likely that the primary source of discrepancy between our findings and those of Toriumi et al. stems from differences in the selection of ISS data, although uncertainties introduced by radiometric measurements cannot be discarded.
5 Conclusion
We analyzed and compared the variability of the core intensity and of the full-width-at-half-maximum of two chromospheric lines, Hα 656.3 nm and Ca II 854.2 nm, as derived from sun-as-a-star observations obtained with the ISS at SOLIS. We found that all four indices vary in phase with the magnetic activity and show high degree of correlation (≳ 0.8) with the Ca II K Emission Index, thus making them excellent proxies of magnetic activity. We also found that the degree of correlation changes with time, increasing during periods of maximum activity, in agreement with previous studies focused on Balmer lines (Meunier and Delfosse, 2009; Criscuoli et al., 2023b). The highest, and less variable over time, degree of correlation is found for the Hα FWHM, in agreement with theoretical and observational studies performed on spatially resolved data. Surprising instead are the min-to-max variations of the correlation coefficients between the Ca IR core and the Ca II K Emission Index, given the demonstrated sensitivity of the Ca II 854.2 nm core even to weak magnetic activity (Cauzzi et al., 2009; Chae et al., 2021). We also found that the min-to-max variability of both core indices seems to be too high compared to results presented in previous studies (Meunier and Delfosse, 2009; Livingston et al., 2010). These discrepancies (with both spatially resolved and disk integrated measurements) are not surprising. Criscuoli et al. (2023b) already reported quantitative but in some cases also qualitative discrepancies between long-term variations of indices derived from Balmer lines as measured by the ISS, McMath Pierce, HARPS-N and models. The trends found for the Ca IR line therefore contribute to strengthen the conclusion drawn in Criscuoli et al. (2023a) that inter-calibration between different instruments is necessary to achieve the accuracy needed to study the variability of line properties over decades.
Data availability statement
Publicly available datasets were analyzed in this study. This data can be found here: https://solis.nso.edu/0/iss/.
Author contributions
GZ: Investigation, Software, Writing–original draft, Writing–review and editing. SC: Conceptualization, Investigation, Supervision, Writing–original draft, Writing–review and editing. LB: Data curation, Writing–review and editing. AP: Data curation, Project administration, Writing–review and editing.
Funding
The author(s) declare financial support was received for the research, authorship, and/or publication of this article. This research was supported by the National Science Foundation REU program, award number 1950911.
Acknowledgments
This work utilizes SOLIS data obtained by the NSO Integrated Synoptic Program (NISP), managed by the National Solar Observatory, which is operated by the Association of Universities for Research in Astronomy (AURA), Inc. under a cooperative agreement with the National Science Foundation. The authors are grateful to Dr. Matthew DeLand for reading the manuscript and providing insightful comments.
Conflict of interest
The authors declare that the research was conducted in the absence of any commercial or financial relationships that could be construed as a potential conflict of interest.
Publisher’s note
All claims expressed in this article are solely those of the authors and do not necessarily represent those of their affiliated organizations, or those of the publisher, the editors and the reviewers. Any product that may be evaluated in this article, or claim that may be made by its manufacturer, is not guaranteed or endorsed by the publisher.
Footnotes
1Source: WDC-SILSO, Royal Observatory of Belgium, Brussels. Publicly available at https://www.sidc.be/SILSO/datafiles
References
Al Moulla, K., Dumusque, X., Figueira, P., Lo Curto, G., Santos, N. C., and Wildi, F. (2023). Stellar signal components seen in HARPS and HARPS-N solar radial velocities. Astronomy Astrophysics 669, A39. doi:10.1051/0004-6361/202244663
Amarsi, A. M., Nordlander, T., Barklem, P. S., Asplund, M., Collet, R., and Lind, K. (2018). Effective temperature determinations of late-type stars based on 3D non-LTE Balmer line formation. Astronomy Astrophysics 615, A139. doi:10.1051/0004-6361/201732546
Andretta, V., Busà, I., Gomez, M. T., and Terranegra, L. (2005). The Ca II Infrared Triplet as a stellar activity diagnostic. I. Non-LTE photospheric profiles and definition of the RIRT indicator. Astronomy Astrophysics 430, 669–677. doi:10.1051/0004-6361:20041745
Babcock, H. W., and Babcock, H. D. (1955). The sun’s magnetic field, 1952-1954. Astrophysical J. 121, 349. doi:10.1086/145994
Baliunas, S. L., Donahue, R. A., Soon, W. H., Horne, J. H., Frazer, J., Woodard-Eklund, L., et al. (1995). Chromospheric variations in main-sequence stars. Astrophysical J. 438, 269. doi:10.1086/175072
Barklem, P. S., Stempels, H. C., Allende Prieto, C., Kochukhov, O. P., Piskunov, N., and O’Mara, B. J. (2002). Detailed analysis of Balmer lines in cool dwarf stars. Astronomy Astrophysics 385, 951–967. doi:10.1051/0004-6361:20020163
Bergemann, M., Serenelli, A., Schönrich, R., Ruchti, G., Korn, A., Hekker, S., et al. (2016). The Gaia-ESO Survey: Hydrogen lines in red giants directly trace stellar mass. Astronomy Astrophysics 594, A120. doi:10.1051/0004-6361/201528010
Berrilli, F., Criscuoli, S., Penza, V., and Lovric, M. (2020). Long-term (1749-2015) variations of solar UV spectral indices. Sol. Phys. 295, 38. doi:10.1007/s11207-020-01603-5
Bertello, L., Pevtsov, A., Tlatov, A., and Singh, J. (2016). Correlation between sunspot number and Ca II K emission index. Sol. Phys. 291, 2967–2979. doi:10.1007/s11207-016-0927-9
Bertello, L., Pevtsov, A. A., Harvey, J. W., and Toussaint, R. M. (2011). Improvements in the determination of ISS Ca ii K parameters. Sol. Phys. 272, 229–242. doi:10.1007/s11207-011-9820-8
Bertello, L., Pevtsov, A. A., and Pietarila, A. (2012). Signature of differential rotation in sun-as-a-star Ca II K measurements. Astrophys. J. 761, 11. doi:10.1088/0004-637X/761/1/11
Buccino, A. P., Sraibman, L., Olivar, P. M., and Minotti, F. O. (2020). An application of a solar-type dynamo model for ϵ Eridani. Mon. Notices R. Astronomical Soc. 497, 3968–3975. doi:10.1093/mnras/staa1908
Busà, I., Aznar Cuadrado, R., Terranegra, L., Andretta, V., and Gomez, M. T. (2007). The Ca II infrared triplet as a stellar activity diagnostic. II. Test and calibration with high resolution observations. Astronomy Astrophysics 466, 1089–1098. doi:10.1051/0004-6361:20065588
Capparelli, V., Zuccarello, F., Romano, P., Simões, P. J. A., Fletcher, L., Kuridze, D., et al. (2017). Hα and hβ emission in a C3.3 solar flare: comparison between observations and simulations. Astrophysical J. 850, 36. doi:10.3847/1538-4357/aa9187
Cauley, P. W., Kuckein, C., Redfield, S., Shkolnik, E. L., Denker, C., Llama, J., et al. (2018). The effects of stellar activity on optical high-resolution exoplanet transmission spectra. Astronomical J. 156, 189. doi:10.3847/1538-3881/aaddf9
Cauzzi, G., Reardon, K., Rutten, R. J., Tritschler, A., and Uitenbroek, H. (2009). The solar chromosphere at high resolution with IBIS. IV. Dual-line evidence of heating in chromospheric network. Astronomy Astrophysics 503, 577–587. doi:10.1051/0004-6361/200811595
Chae, J., Cho, K., Kang, J., Lee, K.-S., Kwak, H., and Lim, E.-K. (2021). Multilayer spectral inversion of solar Hα and Ca II 8542 line spectra with height-varying absorption profiles. J. Korean Astronomical Soc. 54, 139–155.
Chatzistergos, T., Ermolli, I., Krivova, N. A., Barata, T., Carvalho, S., and Malherbe, J.-M. (2022a). Scrutinising the relationship between plage areas and sunspot areas and numbers. Astronomy Astrophysics 667, A167. doi:10.1051/0004-6361/202244913
Chatzistergos, T., Krivova, N. A., and Ermolli, I. (2022b). Full-disc Ca ii K observations—a window to past solar magnetism. Front. Astronomy Space Sci. 9, 336. doi:10.3389/fspas.2022.1038949
Chatzistergos, T., Krivova, N. A., Ermolli, I., Yeo, K. L., Mandal, S., Solanki, S. K., et al. (2021). Reconstructing solar irradiance from historical Ca II K observations. I. Method and its validation. Astronomy Astrophysics 656, A104. doi:10.1051/0004-6361/202141516
Chen, G., Casasayas-Barris, N., Pallé, E., Yan, F., Stangret, M., Cegla, H. M., et al. (2020). Detection of Na, K, and Hα absorption in the atmosphere of WASP-52b using ESPRESSO. Astronomy Astrophysics 635, A171. doi:10.1051/0004-6361/201936986
Chowdhury, P., Belur, R., Bertello, L., and Pevtsov, A. A. (2022). Analysis of solar hemispheric chromosphere properties using the kodaikanal observatory Ca-K index. Astrophysical J. 925, 81. doi:10.3847/1538-4357/ac3983
Cincunegui, C., Díaz, R. F., and Mauas, P. J. D. (2007). Hα and the Ca II H and K lines as activity proxies for late-type stars. Astronomy Astrophysics 469, 309–317. doi:10.1051/0004-6361:20066503
Cincunegui, C., and Mauas, P. J. D. (2004). Library of flux-calibrated echelle spectra of southern late-type dwarfs with different activity levels. Astronomy Astrophysics 414, 699–706. doi:10.1051/0004-6361:20031671
Collins, I., George, W., and Truax, R. J. (1995). Classical rotational broadening of spectral lines. Class. Rotational Broadening Spectr. Lines 439, 860. doi:10.1086/175225
Criscuoli, S. (2016). Angular dependence of the facular-sunspot coverage relation as derived by MDI magnetograms. Sol. Phys. 291, 1957–1975. doi:10.1007/s11207-016-0947-5
Criscuoli, S., Bertello, L., Choudhary, D. P., DeLand, M., Kopp, G., Kowalski, A., et al. (2023a). Ground-based monitoring of the variability of visible Solar spectral lines for improved understanding of solar and stellar magnetism and dynamics. arXiv e-prints. doi:10.3847/25c2cfeb.a90eebbd
Criscuoli, S., Marchenko, S., DeLand, M., Choudhary, D., and Kopp, G. (2023b). Understanding sun-as-a-star variability of solar balmer lines. Astrophysical J. 951, 151. doi:10.3847/1538-4357/acd17d
Criscuoli, S., Penza, V., Lovric, M., and Berrilli, F. (2018). The correlation of synthetic UV color versus Mg II index along the solar cycle. Astrophysical J. 865, 22. doi:10.3847/1538-4357/aad809
de Grijs, R., and Kamath, D. (2021). Stellar chromospheric variability. Universe 7, 440. doi:10.3390/universe7110440
de la Cruz Rodríguez, J., and van Noort, M. (2017). Radiative diagnostics in the solar photosphere and chromosphere. Space Sci. Rev. 210, 109–143. doi:10.1007/s11214-016-0294-8
Dempsey, R. C., Bopp, B. W., Henry, G. W., and Hall, D. S. (1993). Observations of the CA II infrared triplet in chromospherically active single and binary stars. Astrophysical Journals 86, 293. doi:10.1086/191779
Egeland, R., Soon, W., Baliunas, S., Hall, J. C., Pevtsov, A. A., and Bertello, L. (2017). The Mount wilson observatory S-index of the sun. Astrophysical J. 835, 25. doi:10.3847/1538-4357/835/1/25
Ermolli, I., Criscuoli, S., Uitenbroek, H., Giorgi, F., Rast, M. P., and Solanki, S. K. (2010). Radiative emission of solar features in the Ca II K line: comparison of measurements and models. Astronomy Astrophysics 523, A55. doi:10.1051/0004-6361/201014762
Flores, M., González, J. F., Jaque Arancibia, M., Saffe, C., Buccino, A., López, F. M., et al. (2018). HD 38858: a solar-type star with an activity cycle of ˜10.8 yr. Searching for variations in the Balmer and metallic lines. Astronomy Astrophysics 620, A34. doi:10.1051/0004-6361/201833330
Fontenla, J. M., Harder, J., Livingston, W., Snow, M., and Woods, T. (2011). High-resolution solar spectral irradiance from extreme ultraviolet to far infrared. J. Geophys. Res. Atmos. 116, D20108. doi:10.1029/2011JD016032
Gaia Collaboration Prusti, T., de Bruijne, J. H. J., Brown, A. G. A., Vallenari, A., Babusiaux, C., et al. (2016). The Gaia mission. Astronomy Astrophysics 595, A1. doi:10.1051/0004-6361/201629272
Gomes da Silva, J., Santos, N. C., Boisse, I., Dumusque, X., and Lovis, C. (2014). On the long-term correlation between the flux in the Ca ii H and K and Hα lines for FGK stars. Astronomy Astrophysics 566, A66. doi:10.1051/0004-6361/201322697
Hall, J. C., Lockwood, G. W., and Gibb, E. L. (1995). Activity cycles in cool stars. 1: observation and analysis methods and case studies of four well-observed examples. Astrophysical J. 442, 778. doi:10.1086/175483
Huang, C., Arras, P., Christie, D., and Li, Z.-Y. (2017). A model of the Hα and Na transmission spectrum of HD 189733b. Astrophysical J. 851, 150. doi:10.3847/1538-4357/aa9b32
Kowalski, A. F., Allred, J. C., Carlsson, M., Kerr, G. S., Tremblay, P.-E., Namekata, K., et al. (2022). The atmospheric response to high nonthermal electron beam fluxes in solar flares. II. Hydrogen broadening predictions for solar flare observations with the daniel K. Inouye solar telescope. arXiv e-prints 928, 190. doi:10.3847/1538-4357/ac5174
Kowalski, A. F., Allred, J. C., Uitenbroek, H., Tremblay, P.-E., Brown, S., Carlsson, M., et al. (2017). Hydrogen balmer line broadening in solar and stellar flares. Astrophysical J. 837, 125. doi:10.3847/1538-4357/aa603e
Lanzafame, A. C., Brugaletta, E., Frémat, Y., Sordo, R., Creevey, O. L., Andretta, V., et al. (2023). Gaia data release 3: stellar chromospheric activity and mass accretion from Ca II IRT observed by the radial velocity spectrometer. Astronomy Astrophysics 674, A30. doi:10.1051/0004-6361/202244156
Leighton, R. B. (1959). Observations of solar magnetic fields in plage regions. Astrophysical J. 130, 366. doi:10.1086/146727
Leitzinger, M., and Odert, P. (2022). Stellar coronal mass ejections. Serbian Astronomical J. 205, 1–22. doi:10.2298/SAJ2205001L
Livingston, W., Wallace, L., White, O. R., and Giampapa, M. S. (2007). Sun-as-a-Star spectrum variations 1974-2006. Astrophysical J. 657, 1137–1149. doi:10.1086/511127
Livingston, W., White, O. R., Wallace, L., and Harvey, J. (2010). Sun-as-a-Star, chromospheric lines, 1974-2009. Mem. della Soc. Astron. Ital. 81, 643.
Long, L., Zhang, L.-y., Bi, S.-L., Shi, J., Lu, H.-P., Han, X. L., et al. (2021). Chromospheric activity of periodic variable stars based on the LAMOST low- and medium-resolution spectral survey. Astrophysical Journals 253, 51. doi:10.3847/1538-4365/abe30b
Lovric, M., Tosone, F., Pietropaolo, E., Del Moro, D., Giovannelli, L., Cagnazzo, C., et al. (2017). The dependence of the [FUV-MUV] colour on solar cycle. J. Space Weather Space Clim. 7, A6. doi:10.1051/swsc/2017001
Maldonado, J., Phillips, D. F., Dumusque, X., Collier Cameron, A., Haywood, R. D., Lanza, A. F., et al. (2019). Temporal evolution and correlations of optical activity indicators measured in Sun-as-a-star observations. Astronomy Astrophysics 627, A118. doi:10.1051/0004-6361/201935233
Marchenko, S., Criscuoli, S., DeLand, M. T., Choudhary, D. P., and Kopp, G. (2021). Solar activity and responses observed in Balmer lines. Astronomy Astrophysics 646, A81. doi:10.1051/0004-6361/202037767
Martin, J., Fuhrmeister, B., Mittag, M., Schmidt, T. O. B., Hempelmann, A., González-Pérez, J. N., et al. (2017). The Ca ii infrared triplet’s performance as an activity indicator compared to Ca ii H and K: empirical relations to convert Ca ii infrared triplet measurements to common activity indices. Astronomy Astrophysics 605, A113. doi:10.1051/0004-6361/201630298
Meunier, N., and Delfosse, X. (2009). On the correlation between Ca and Hα solar emission and consequences for stellar activity observations. Astronomy Astrophysics 501, 1103–1112. doi:10.1051/0004-6361/200911823
Meunier, N., Kretzschmar, M., Gravet, R., Mignon, L., and Delfosse, X. (2022). Relationship between Ca and Hα chromospheric emission in F-G-K stars: indication of stellar filaments? Astronomy Astrophysics 658, A57. doi:10.1051/0004-6361/202142120
Molnar, M., Reardon, K., Chai, Y., Gary, D., Uitenbroek, H., Cauzzi, G., et al. (2019). SOLAR CHROMOSPHERIC TEMPERATURE DIAGNOSTICS: A JOINT ALMA-Hα ANALYSIS. Astrophysical J. 881, 99. doi:10.3847/1538-4357/ab2ba3
Namekata, K., Maehara, H., Honda, S., Notsu, Y., Okamoto, S., Takahashi, J., et al. (2021). Probable detection of an eruptive filament from a superflare on a solar-type star. Nat. Astron. 6, 241–248. doi:10.1038/s41550-021-01532-8
Penza, V., Berrilli, F., Bertello, L., Cantoresi, M., Criscuoli, S., and Giobbi, P. (2022). Total solar irradiance during the last five centuries. Astrophysical J. 937, 84. doi:10.3847/1538-4357/ac8a4b
Petrie, G., Criscuoli, S., and Bertello, L. (2021). “Solar magnetism and radiation,” in Solar Physics and solar wind. Editors N. E. Raouafi, and A. Vourlidas, 1, 83. doi:10.1002/9781119815600.ch3
Pevtsov, A. A., Bertello, L., and Marble, A. R. (2014). The sun-as-a-star solar spectrum. Astron. Nachrichten 335, 21–26. doi:10.1002/asna.201312012
Pevtsov, A. A., Virtanen, I., Mursula, K., Tlatov, A., and Bertello, L. (2016). Reconstructing solar magnetic fields from historical observations. I. Renormalized Ca K spectroheliograms and pseudo-magnetograms. Astronomy Astrophysics 585, A40. doi:10.1051/0004-6361/201526620
Pietarila, A., and Livingston, W. (2011). Solar cycle variation in sun-as-a-star Ca II 854.2 nm bisectors. Astrophysical J. 736, 114. doi:10.1088/0004-637X/736/2/114
Quirrenbach, A., Amado, P. J., Caballero, J. A., Mundt, R., Reiners, A., Ribas, I., et al. (2016). “CARMENES: an overview six months after first light,”Ground-based and Airborne Instrumentation for Astronomy VI of Society of Photo-Optical Instrumentation Engineers (SPIE) Conference Seriesm 25-29 February 2024 USA, 990812. Editors C. J. Evans, L. Simard, and H. Takami, 9908. doi:10.1117/12.2231880
Rackham, B. V., Espinoza, N., Berdyugina, S. V., Korhonen, H., MacDonald, R. J., Montet, B. T., et al. (2023). The effect of stellar contamination on low-resolution transmission spectroscopy: needs identified by NASA’s Exoplanet Exploration Program Study Analysis Group 21. RAS Tech. Instrum. 2, 148–206. doi:10.1093/rasti/rzad009
Radick, R. R., Lockwood, G. W., Henry, G. W., Hall, J. C., and Pevtsov, A. A. (2018). Patterns of variation for the sun and sun-like stars. Astrophysical J. 855, 75. doi:10.3847/1538-4357/aaaae3
Reda, R., Di Mauro, M. P., Giovannelli, L., Alberti, T., Berrilli, F., and Corsaro, E. (2022). A synergic strategy to characterize the habitability conditions of exoplanets hosted by solar-type stars. Front. Astronomy Space Sci. 9, 909268. doi:10.3389/fspas.2022.909268
Reda, R., Giovannelli, L., Alberti, T., Berrilli, F., Bertello, L., Del Moro, D., et al. (2023). The exoplanetary magnetosphere extension in Sun-like stars based on the solar wind-solar UV relation. Mon. Notices R. Astronomical Soc. 519, 6088–6097. doi:10.1093/mnras/stac3825
Saar, S. H., and Brandenburg, A. (1999). Time evolution of the magnetic activity cycle period. II. Results for an expanded stellar sample. Astrophysical J. 524, 295–310. doi:10.1086/307794
Salabert, D., García, R. A., Jiménez, A., Bertello, L., Corsaro, E., and Pallé, P. L. (2017). Photospheric activity of the Sun with VIRGO and GOLF. Comparison with standard activity proxies. Astronomy Astrophysics 608, A87. doi:10.1051/0004-6361/201731560
Santos, N. C., Mayor, M., Naef, D., Pepe, F., Queloz, D., Udry, S., et al. (2000). The CORALIE survey for Southern extra-solar planets. IV. Intrinsic stellar limitations to planet searches with radial-velocity techniques. Astronomy Astrophysics 361, 265–272.
Skumanich, A. (1972). Time scales for Ca II emission decay, rotational braking, and lithium depletion. Astrophysical J. 171, 565. doi:10.1086/151310
Smith, G. H., Hargrave, M., and Eckholm, E. (2017). Relations between FUV excess and coronal soft X-ray emission among dwarf stars. Publ. Astronomical Soc. Aust. 34, e049. doi:10.1017/pasa.2017.47
Sreejith, A. G., Fossati, L., Youngblood, A., France, K., and Ambily, S. (2020). Ca II H&K stellar activity parameter: a proxy for extreme ultraviolet stellar fluxes. Astronomy Astrophysics 644, A67. doi:10.1051/0004-6361/202039167
Strassmeier, K. G., Fekel, F. C., Bopp, B. W., Dempsey, R. C., and Henry, G. W. (1990). Chromospheric CA II H and K and H-alpha emission in single and binary stars of spectral types F6-M2. Astrophysical Journals 72, 191. doi:10.1086/191414
Tähtinen, I., Virtanen, I. I., Pevtsov, A. A., and Mursula, K. (2022). Reconstructing solar magnetic fields from historical observations. VIII. AIA 1600 Å contrast as a proxy of solar magnetic fields. Astronomy Astrophysics 664, A2. doi:10.1051/0004-6361/202141164
Tarr, L. A., Kobelski, A. R., Jaeggli, S. A., Molnar, M., Cauzzi, G., and Reardon, K. P. (2023). Spatio-temporal comparisons of the hydrogen-alpha line width and ALMA 3 mm brightness temperature in the weak solar network. Front. Astronomy Space Sci. 9, 436. doi:10.3389/fspas.2022.978405
Testa, P., Saar, S. H., and Drake, J. J. (2015). Stellar activity and coronal heating: an overview of recent results. Philosophical Trans. R. Soc. Lond. Ser. A 373, 201. doi:10.1098/rsta.2014.0259
Thompson, A. P. G., Watson, C. A., Haywood, R. D., Costes, J. C., de Mooij, E., Collier Cameron, A., et al. (2020). The spectral impact of magnetic activity on disc-integrated HARPS-N solar observations: exploring new activity indicators. Mon. Notices R. Astronomical Soc. 494, 4279–4290. doi:10.1093/mnras/staa1010
Toriumi, S., and Airapetian, V. S. (2022). Universal scaling laws for solar and stellar atmospheric heating. Astrophys. J. 927, 179. doi:10.3847/1538-4357/ac5179
Toriumi, S., Airapetian, V. S., Namekata, K., and Notsu, Y. (2022). Universal scaling laws for solar and stellar atmospheric heating: catalog of power-law index between solar activity proxies and various spectral irradiances. Astrophys. J. Suppl. Ser. 262, 46. doi:10.3847/1538-4365/ac8b15
Velloso, E. N., Anthony, F., do Nascimento, J. D., Silveira, L. F. Q., Hall, J., and Saar, S. H. (2023). Multicomponent activity cycles using hilbert-huang analysis. Astrophysical Journall 945, L12. doi:10.3847/2041-8213/acb8b4
Vida, K., Leitzinger, M., Kriskovics, L., Seli, B., Odert, P., Kovács, O. E., et al. (2019). The quest for stellar coronal mass ejections in late-type stars. I. Investigating Balmer-line asymmetries of single stars in Virtual Observatory data. Astronomy Astrophysics 623, A49. doi:10.1051/0004-6361/201834264
Wallace, L., Hinkle, K. H., Livingston, W. C., and Davis, S. P. (2011). An optical and near-infrared (2958-9250 Å) solar flux atlas. Astrophysical Journals 195, 6. doi:10.1088/0067-0049/195/1/6
Youngblood, A., France, K., Loyd, R. O. P., Linsky, J. L., Redfield, S., Schneider, P. C., et al. (2016). The MUSCLES treasury survey. II. Intrinsic LYα and extreme ultraviolet spectra of K and M dwarfs with exoplanets. Astrophysical J. 824, 101. doi:10.3847/0004-637X/824/2/101
Keywords: solar activity, spectral index, sun-as-a-star variability, solar-like stars, solar magnetism, spectral variability, stellar chromosphere, spectroscopy
Citation: Zills G, Criscuoli S, Bertello L and Pevtsov A (2024) Sun-as-a-star variability of Hα and Ca II 854.2 nm lines. Front. Astron. Space Sci. 10:1328364. doi: 10.3389/fspas.2023.1328364
Received: 26 October 2023; Accepted: 19 December 2023;
Published: 08 January 2024.
Edited by:
Christoffer Karoff, Aarhus University, DenmarkReviewed by:
Derek L. Buzasi, Florida Gulf Coast University, United StatesVladimir Airapetian, National Aeronautics and Space Administration, United States
Copyright © 2024 Zills, Criscuoli, Bertello and Pevtsov. This is an open-access article distributed under the terms of the Creative Commons Attribution License (CC BY). The use, distribution or reproduction in other forums is permitted, provided the original author(s) and the copyright owner(s) are credited and that the original publication in this journal is cited, in accordance with accepted academic practice. No use, distribution or reproduction is permitted which does not comply with these terms.
*Correspondence: Serena Criscuoli, c2NyaXNjdW9AbnNvLmVkdQ==