- 1Changchun Institute of Optics, Chinese Academy of Sciences, Changchun, China
- 2University of Chinese Academy of Sciences, Beijing, China
To comprehensively analyze the jitter error in large-aperture optical telescopes, this paper introduces normalized point source sensitivity (PSSn) to evaluate the telescope system. First, the concept and basic properties of PSSn were introduced, and then the jitter error under expected random loads and the contribution percentage of each mode to the total jitter were analyzed through a model. The PSSn of the system under the influence of different error sources was studied, and its variation trend was estimated. A comparison of evaluation methods, such as the Strehl ratio, and the proposed method reflects the characteristics of more accurate data and a more concise calculation. The jitter error evaluation method proposed in this article, combined with PSSn, provides practical and beneficial guidance for the design and detection of large-aperture optical telescope systems.
1 Introduction
In order to conduct more in-depth and detailed exploration of the universe, telescope technology, as one of the main exploration methods, is increasingly being valued by scientists from various countries. Furthermore, with the ongoing improvement of performance requirements for target observation, the scale of large-aperture optical telescopes is also increasing. In order to achieve better optical imaging quality, the requirements for system jitter errors are becoming increasingly strict. The system contains numerous error sources, such as mechanical vibration, noise, and external environmental interference, which have different frequency domain characteristics and more complex statistical correlations. Jitter not only affects the stability of the system structure but also leads to a decrease in the quality of the imaging system. In this context, traditional analysis methods such as root mean square have become difficult to adapt to the system error analysis of large-aperture optical telescopes.
The spot diagram represents the imaging of multiple light rays from a single point source after passing through an optical system. Due to the presence of aberrations in the optical system, the imaged image no longer converges to a single point but presents a dispersed form. In many cases, it cannot accurately evaluate image quality, so it cannot reflect the actual situation. The resolution method refers to the minimum distance that can distinguish two object points or images, reflecting the ability of optical systems to distinguish object details. Like the spot diagram method, it is mainly applicable to small aberration systems. Rayleigh judgment is based on the principle that the maximum wave aberration between the actual wavefront and the reference spherical wave does not exceed λ/4 to judge whether the image quality is perfect. However, in some cases, the Rayleigh judgment may not be comprehensive enough, as it only considers the maximum value of wavefront aberration and does not fully consider the proportion of defects on the wavefront in the entire wavefront.
The Strehl ratio, also known as center illuminance, represents the ratio of energy concentration of the point spread function (PSF) of the actual telescope to the point spread function at the diffraction limit of the telescope. This ratio can better reflect the optical performance of telescopes and systems processed by adaptive optics. Usually represented by SD, according to Strehl judgment, when SD ≥ 0.8, the optical system can be considered complete. However, its computational complexity is high and is often used to evaluate the imaging quality of small aberration optical systems; therefore, it is rarely used in practical applications. For systems far from the diffraction limit, the applicability of the Strehl ratio significantly decreases. More importantly, as the influence of atmospheric visibility on the performance of optical systems continues to increase, the Stellite ratio is no longer suitable as an evaluation indicator. In this case, the central intensity ratio (CIR) is widely adopted. Whether it is used to describe small aberrations in the Strehl ratio or CIR used in atmospheric visibility-dominated situations, they only consider the central frequency domain characteristics of the point spread function. If there is an evaluation index that comprehensively considers the characteristics of energy distribution throughout the frequency domain, it will better evaluate the imaging quality of the system (Barr et al., 1990; Miyashita et al., 2003; Angeli et al., 2011).
The 30-m telescope (TMT) is an international collaborative project, with both the primary and secondary mirrors designed with double-curved surfaces, while the three-mirror system reflects light from the secondary mirror onto instruments used for scientific observation. Initiated by the United States, Canada, Japan, China, and India, it is currently one of the largest optical telescopes under construction. In this context, the US 30-m telescope team proposed using PSSn as the standard for error allocation in large-aperture telescopes. This article will study the jitter error evaluation method for large-aperture optical telescopes based on PSSn (Pazder et al., 2008; Vogiatzis and Angeli, 2008; Seo et al., 2009a).
2 PSSn and perturbation calculation
PSSn is the average of telescope errors in the background, fully utilizing the optical energy of the point spread function region, and, therefore, can comprehensively evaluate the imaging quality of the system (Cho et al., 2008). The basic definition is
Here,
In order to utilize the synthetic properties of PSSn and simplify the expression, where f is the vector of the spatial frequency of the optical transfer function (OTF) (Sobek, 2005; Seo et al., 2009b),
Use a symbol and a known operation expression to represent another operation, for simplicity, Sets the form of the operation, rather than defining the operator:
PSF is represented in the matrix form using Zemax ray tracing software, and the following formula is derived and applied:
Here,
Here,
Finite element programs usually first calculate the natural frequency and mode shape. Modal analysis methods are then used to calculate the frequency response function (FRF). The forcing function and frequency response are input through power spectral density (PSD), allowing for the calculation of the PSD response function. Finally, the RMS response generated under the PSD response function is integrated. In modal response, by setting the expected PSD and subsequent integration analysis, PSD of the field-of-view response and the pointing error of each optical device can be obtained (YANGX et al., 2013). RMS of any response is the square root of the area under the PSD response function. The formulas are provided in Equations 7, 8. The transformation of the system’s principal coordinates is completed based on the above characteristics.
Here,
Multiplying the PSD response by the weighting function W, the line-of-sight error caused by jitter is divided into a drift term and a jitter term. Due to the significant impact of the jitter term on MTF compared to the drift term, the RMS value of the jitter term is mainly analyzed using the following equation:
Here, W is used to divide the response, T is the sensor integration time, f is the response frequency,
MTF under jitter influence based on the RMS value is calculated as follows:
Here,
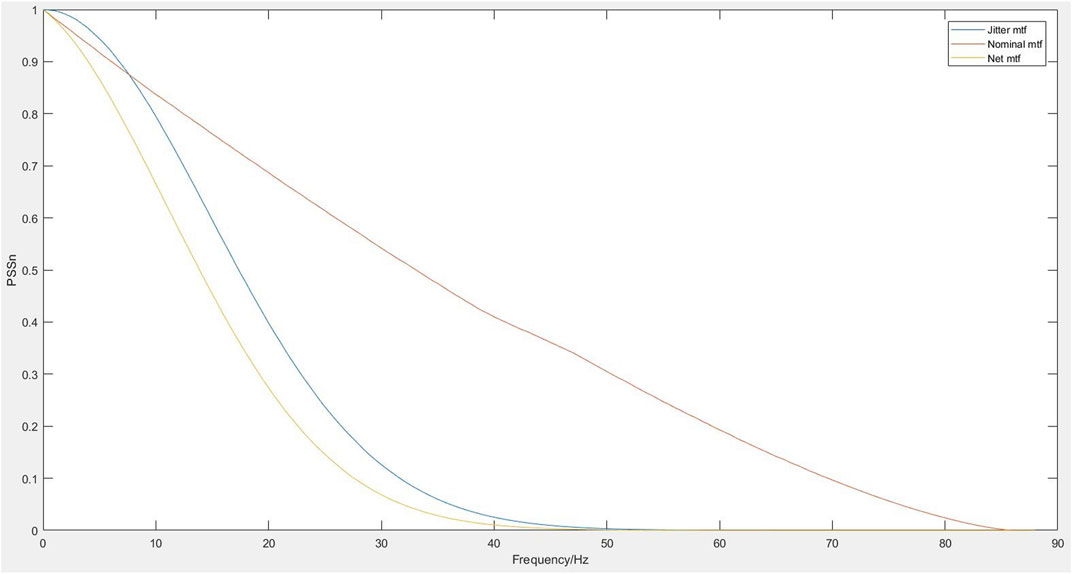
By modeling and setting disturbance factors, MTF and PSSn can be linked for disturbance calculation, as shown in Figure 1. The jitter curve is used to analyze and evaluate the impact factors.
By establishing the relationship between PSSn and MTF, perturbation factors and MTF are combined to make them interrelated. Subsequently, in the follow-up integration of optical–mechanical systems and the application of the large mass method, the recent research methods are extended to the field of jitter error evaluation and analysis so as to effectively meet the challenge of the detection and evaluation of jitter errors in large-aperture telescopes. In Figure 1, three curves are presented, namely, the MTF curve of the initial optical system, the MTF curve of the influence factor, and the MTF curve under the influence of jitter. For the modulation transfer function, which is affected by the jitter factor under the set power spectral density, the PSSn analysis method is applied to the optical integrated structure model; combined with the mode contribution ratio and the mode information in the frequency domain, it can help optimize the design of the system.
3 Modeling analysis
To address the degradation of imaging quality caused by jitter errors in optical telescope systems, an optical model and finite element system structure were established to unify their coordinate systems (McBride et al., 2016; Du et al., 2020). The frequency response function and root mean square were obtained using modal and power spectral density, and the effect of jitter was converted into a modulation transfer function through optical–mechanical integration. Then, the point source sensitivity function was used to analyze and evaluate the optical–mechanical system under the influence of jitter effects.
3.1 Optical–mechanical system
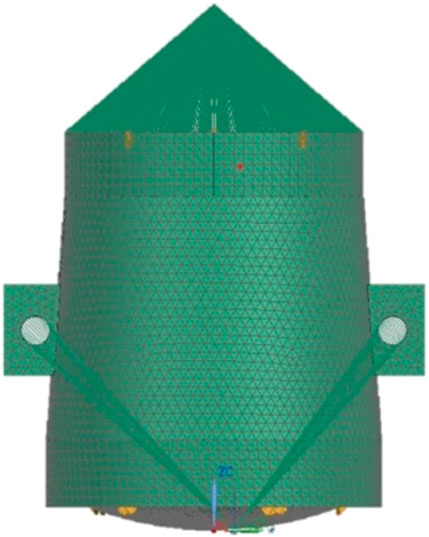
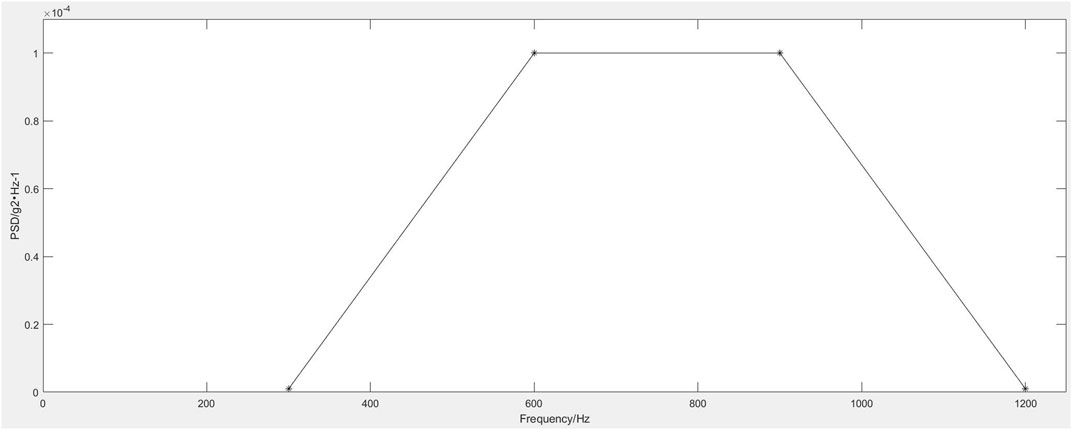
The opto-mechanical structure model of the primary and secondary mirrors is established, and the PSD input curve is set, as shown in Figure 2 and Figure 3, respectively.
3.2 Modal and sweep analysis
In modal response, PSD of the field-of-view response and the pointing error of each optical device can be calculated by setting the PSD input forcing function and the frequency response function of the field-of-view response. RMS of any response is the square root of the area under the PSD response function. Based on the above characteristics, the transformation of the system’s principal coordinates can be completed, which is derived from the calculation of natural frequencies and vibration modes (Lee et al., 2012; Liu et al., 2021).
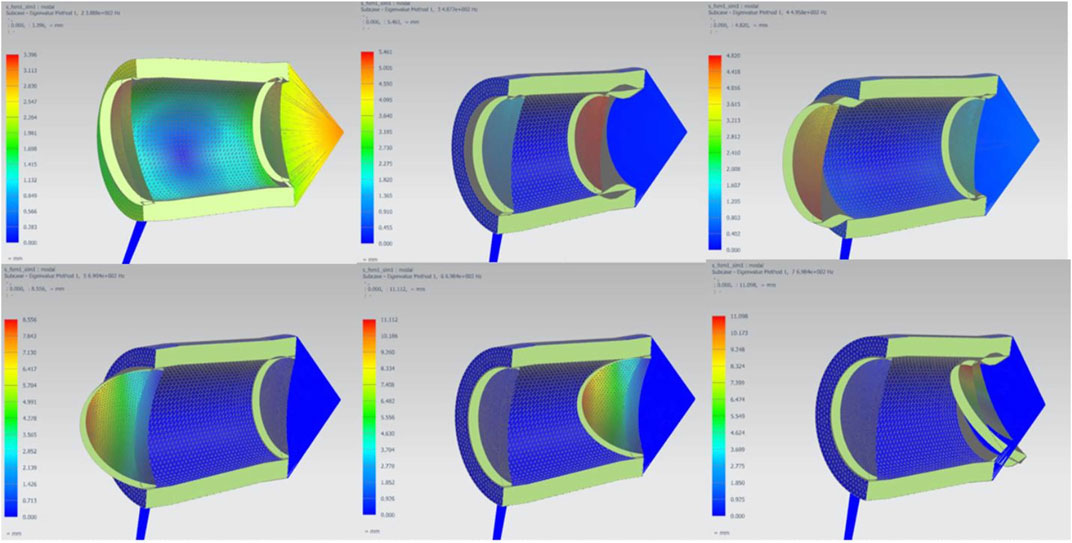
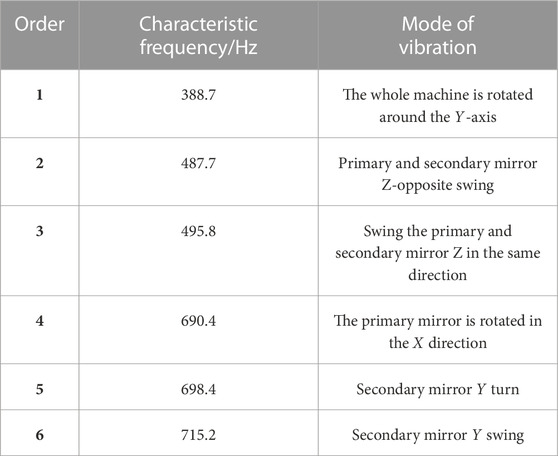
Modal analysis is one of the main methods for studying the dynamic characteristics of structures. Finite element modal analysis can be used to calibrate modes, improve model accuracy, and solve the natural frequencies and modes of the model, essentially solving eigenvalues and eigenvectors. View slicing is enabled, and the first six characteristic frequencies and corresponding vibration modes of the system are shown in Figure 4. Relevant data as shown in Table 1.
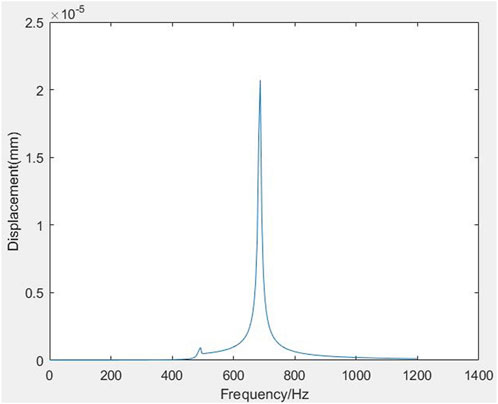
In order to conduct frequency sweep analysis under acceleration excitation, the large mass method is generally used, where the mass used is 106 times the model mass. The purpose is to determine the response of the structure under a simple harmonic load of a known frequency in order to find its resonant frequency and avoid structural damage due to resonance. The sweep frequency range is set from 2 to 1,202 Hz, with a step size of 5 and a frequency of 240, as shown in Figure 5. Different nodes in the structure are selected to draw a cloud chart. From the chart, it is found that under the same working conditions, the response of each node is slightly different, but the overall trend is roughly similar. The sweep frequency peaks are concentrated at 490 Hz and 687 Hz, which are close to the second- and fourth-order characteristic frequencies, respectively.
3.3 Integrated analysis
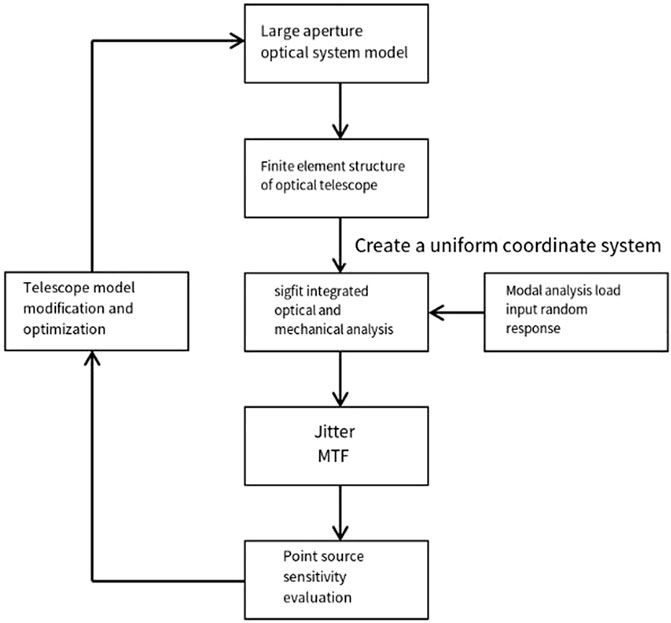
Based on the primary and secondary mirror and focal plane coordinate systems, the optical analysis model is connected in random response through polynomial fitting to obtain a linear optical model. The sensitivity coefficients of the optical response of each optical surface are used to establish equations for forced response analysis to obtain the dynamic response of optical performance (ZHAI et al., 2023). By applying the acceleration dynamic load and specifying nominal MTF through the interference module and disturbance range, a macro-file containing the system surface error generated using SigFit is imported into the optical analysis based on the given forced frequency, random load, damping coefficient, and detector integration time. The jitter error is calculated using the ray tracing algorithm, and the subsequent results can be used to modify and optimize the model structure. The specific process is shown in Figure 6.
By integrating optical and mechanical models through SigFit, images of jitter MTF are obtained, the interference area of the telescope is determined, and subsequent design optimization is carried out to minimize the impact of jitter. At the same time, the point source sensitivity system is used to evaluate jitter errors.
The basic principle is to calculate the natural frequency and mode shape of the telescope using finite element and optical performance analysis tools and then decompose each optical surface of each mode into average rigid body motion and elastic deformation. The report provides the percentage contribution of each mode shape to the total field-of-view jitter, which helps accurately locate the area of the telescope structure for redesign. For the integration time of detector sensing, random errors are decomposed into drift and jitter components and converted into jitter MTF response functions. This function can generate optical system MTF in a random environment, providing data support for the application of PSSn. Figure 7 shows the relationship between various variable factors and PSSn. It can be seen that the damping coefficient is directly proportional to PSSn, as it is a random vibration. As the damping coefficient increases, the amplitude of structural vibration decreases, which means it tends to stabilize, and the factors affected by vibration decrease. When the integration time of the detector is not 0, the overall impact on PSSn tends to stabilize as the integration time increases. When only considering the load factor, the higher the load factor, the greater the system’s bearing capacity and the greater the impact of vibration. In the forced frequency analysis, the starting frequency is 400 Hz, and as the ending frequency increases, PSSn gradually decreases. After 800 Hz, the change is not significant, and the two changes that are more obvious are related to the above swept-frequency peak.
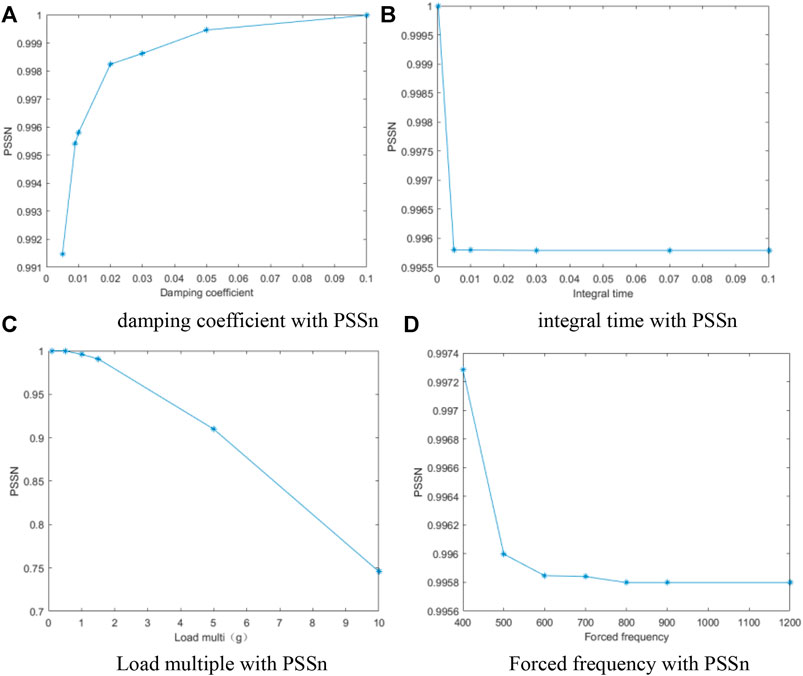
FIGURE 7. Relationship between various variable factors and PSSn. (A) Damping coefficient with PSSn. (B) Integral time with PSSn. (C) Load multiple with PSSn. (D) Forced frequency with PSSn.
SigFit is used to calculate the jitter component of the random response, as shown in Figure 8, where LI/LO represents the image space and object space, TX/TY represents the axial displacement of the X/Y-axis, LI-TV/LO-TV represents the linear displacement vector sum (mm) of the image space and object space on the XY plane, RX/RY represents the rotation around the X/Y-axis, and LI-RV/LO-RV represents the vector sum of the rotation between the image space and object space (rad), respectively. RB-TX/RB-TY/RB-TZ represents X/Y eccentricity and Z offset and RB-RX/RB-RY/RB-RZ represents X/Y/Z tilt, respectively. d-RoC represents the surface offset, and S-RMS represents the surface accuracy error. The first mode is essentially a free mode, where the key modes of the jitter component and the contribution percentage of each surface error in the system are concentrated in the second and fourth orders. Correspondingly, the peak frequencies of the above frequency sweep analysis indicate that the second and fourth orders are the main causes of errors. Taking the object space angular displacement LO-RV as an example, the contribution percentages of the second and fourth orders to LO-RV are 80.529% and 18.496%, respectively, while the contributions of other order modes are relatively small.
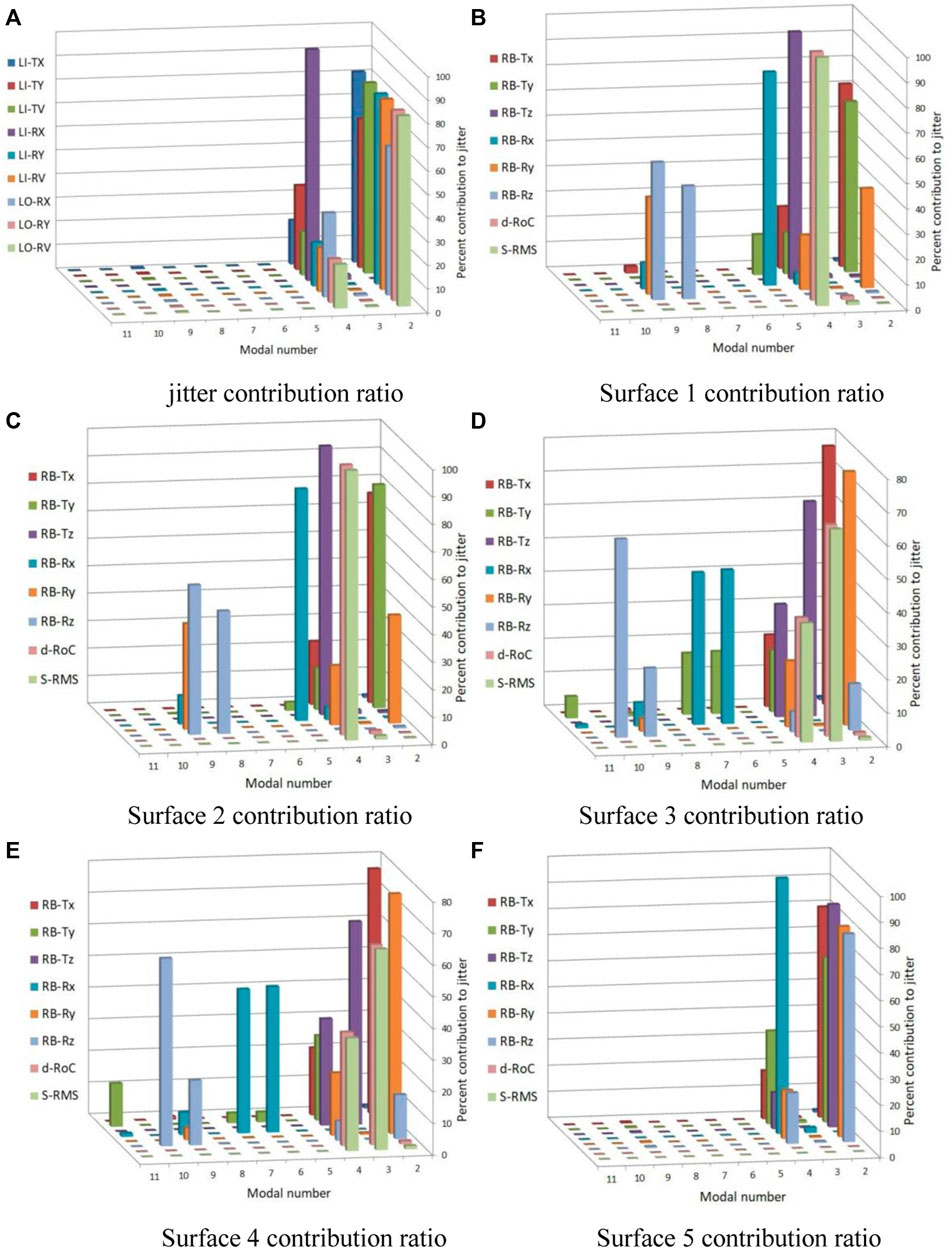
FIGURE 8. Modal contribution ratio. (A) Jitter contribution ratio. (B) Surface 1 contribution ratio. (C) Surface 2 contribution ratio. (D) Surface 3 contribution ratio. (E) Surface 4 contribution ratio. (F) Surface 5 contribution ratio.
By obtaining the modal contribution ratio of each frequency order, the maximum value can be found and its vibration mode can be studied. Combined with the optical sensitivity coefficient, the optical element that is most affected by jitter can be obtained. Subsequently, its sensitivity characteristics can be used for optical and mechanical optimization or the pasting of monitoring sensors at corresponding positions.
Table 2 shows the data comparison between the Strehl ratio factor and PSSn under the control variables of various influencing factors. The calculation method of the Strehl ratio factor is the area under the MTF-Net curve divided by the area under the MTF-Nominal curve. It is used to multiply the nominal Strehl ratio of an unperturbed system and provides a single measure of system performance that can be applied to optimization techniques. When the sensor integration time is 0.03 s, that is, the serial number 8, the Strehl ratio factor is calculated to be 9.9555E-01, and jitter decreases with the decrease in detector integration time. In the case of 0.01 s, sequence number 1 increases the resulting Strehl ratio factor to 9.9556E-01. Alternatively, if the integration time is infinite, then all frequencies will cause jitter. Although the changing trend of the two datasets in the ten groups is the same under various influencing factors, the advantage of PSSn is that it makes full use of the optical energy in the point diffusion function region. The difference in the error margin between the two in serial number 9 is even 2%, and the PSSn is closer to 1 under the same conditions. Therefore, the data are more accurate and can be used to comprehensively evaluate the imaging quality of the system. Moreover, the processing and calculation processes are not as complicated as those for the Strehl ratio. Subsequently, the system structure design can be improved according to the modal contribution ratio and the relationship between various variables and PSSn, and the overall performance of the system can be improved. Other evaluation methods, such as spot diagrams, resolution, and the Rayleigh criterion, have their own shortcomings compared with PSSn. For small-caliber components, RMS and PSSn analysis and evaluation are usually combined, which can accumulate the application experience of the PSSn evaluation method in practical engineering. However, in the application of large-aperture optical telescope systems, the use of RMS makes it difficult to fully reflect the influence of each error source on the performance of the integrated system. In view of the comprehensiveness of the PSSn evaluation method, if the error of different frequency band distributions is reasonably considered, the error limit range can be moderately increased. It can effectively reduce the overestimation in error analysis, and considering the error in different frequency bands conforms to both scientific and economic principles.
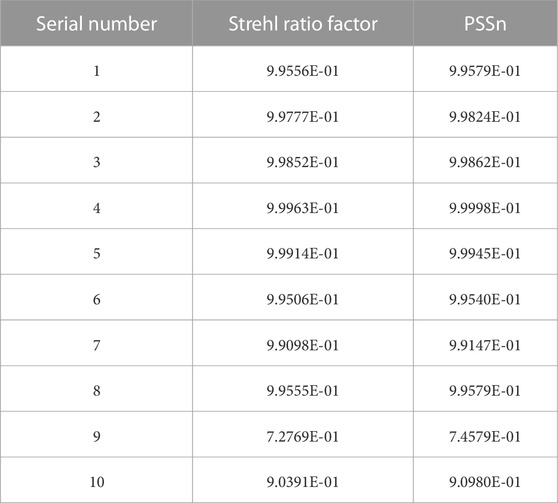
TABLE 2. Comparison between the Strehl ratio factor and PSSn under control variables of influencing factors.
4 Conclusion
In this paper, the jitter error under a certain working condition is determined, and the proportion of influence of each order of frequency on jitter and the maximum contribution value is obtained. By introducing PSSn to evaluate the jitter error of a large-aperture telescope, the influence of jitter introduction is converted into a modulation transfer function, and the deformation results can be co-analyzed with the system, considering the overall and internal structural changes, efficiently and accurately reflecting the overall system performance. At the same time, the optical model and finite element analysis are used to link jitter with the optical performance analysis index. This approach helps understand the modes that have a greater impact on optical imaging under different working conditions, provides a reference for the design, helps in accurately predicting the working state of the optical telescope under the jitter environment, quantifies the system structure, and effectively improves the cost performance of the optical machine system. It is used to guide the structural design of large-aperture optical telescopes.
Data availability statement
The original contributions presented in the study are included in the article/Supplementary material; further inquiries can be directed to the corresponding author.
Author contributions
LY-G: writing–original draft and methodology. YF: writing–review and editing. ZJ-K: investigation and writing–review and editing. HY-L: supervision and writing–review and editing.
Funding
The author(s) declare that financial support was received for the research, authorship, and/or publication of this article. This research was supported by the Science and Technology Development Plan Project of Jilin Province (20230101008JC), Excellent Member of Youth Innovation Promotion Association CAS (Y202053), International Partnership Program of the Chinese Academy of Sciences (181722KYSB20200001), and National Natural Science Foundation of China (NSFC) (11973040).
Conflict of interest
The authors declare that the research was conducted in the absence of any commercial or financial relationships that could be construed as a potential conflict of interest.
Publisher’s note
All claims expressed in this article are solely those of the authors and do not necessarily represent those of their affiliated organizations, or those of the publisher, the editors, and the reviewers. Any product that may be evaluated in this article, or claim that may be made by its manufacturer, is not guaranteed or endorsed by the publisher.
Supplementary material
The Supplementary Material for this article can be found online at: https://www.frontiersin.org/articles/10.3389/fspas.2023.1311323/full#supplementary-material
References
An, Q., Zhang Jingxu, 张., Yang Fei, 杨., and Zhao Hongchao, 赵. (2016). Evaluation of the performance of large telescope based on normalized point source sensitivity. Infrared Laser Eng. 45, 1218001. doi:10.3788/irla20164512.1218001
Angeli, G. Z., Byoung-Joon, S., Carl, N., and Mitchell, T. (2011). A convenient telescope performance metric for imaging through turbulence. Proc. SPIE - Int. Soc. Opt. Eng. 8127. doi:10.1117/12.896919
Barr, L. D., Fox, J., Poczulp, G. A., and Roddier, C. A. (1990). Seeing studies on a 1.8-m mirror. Adv. Technol. Opt. Telesc. IV 1236. doi:10.1117/12.19220
Chen, L. S., and Hu, Z. W. (2016). The research on the application of normalized point source sensitivity in wide field optical spectrometer of the thirty meter telescope. Acta Astron. Sin. 57 (5), 585–596. doi:10.15940/j.cnki.0001-5245.2016.05.008
Cho, M., Corredor, A., Pootrakul, S., Vogiatzis, K., and Angeli, G. (2008). Thermal performance prediction of the TMT optics. Model. Syst. Eng. Proj. Manag. Astronomy III 7017, 369–381. SPIE. doi:10.1117/12.789212
Du, W., Liu, Y., Gao, W., and Hu, X. (2020). Analysis of passive athermalization structure design and integrated opto-mechanical-thermal of zoom lens of photoelectric countermeasure platform. Laser and Optoelectron. Prog. 57 (13), 131204. doi:10.3788/lop57.131204
Lee, D.-O., Yoon, S.-H., and Han, J.-H. (2012). Integrated framework for jitter analysis combining disturbance, structure, vibration isolator and optical model. Act. Passive Smart Struct. Integr. Syst. 8341. SPIE. doi:10.1117/12.915428
Liu, R., Li, Z., Xu, W., Yang, X., Zhang, D., Yao, Z., et al. (2021). Dynamic analysis and experiment of a space mirror based on a linear state space expression. Appl. Sci. 11 (12), 5379. doi:10.3390/app11125379
McBride, I. I., William, R., Daniel, R., and McBride, (2016). Using frequency response functions to manage image degradation from equipment vibration in the Daniel K. Inouye Solar Telescop. Model. Syst. Eng. Proj. Manag. Astronomy VII 9911. SPIE. doi:10.1117/12.2234316
Miyashita, A., Ogasawara, R., Takato, N., Kosugi, G., Takata, T., and Uraguchi, F. (2003). Temperature control for the primary mirror and seeing statistics of the Subaru Telescope. Large Ground-based Telesc. 4837. SPIE. doi:10.1117/12.458192
Pazder, J. S., Vogiatzis, K., and Angeli, G. Z. (2008). Dome and mirror seeing estimates for the thirty meter telescope. Model. Syst. Eng. Proj. Manag. Astronomy III 7017. SPIE. doi:10.1117/12.789636
Seo, B.-J., Nissly, C., Angeli, G., Ellerbroek, B., Nelson, J., Sigrist, N., et al. (2009a). Analysis of normalized point source sensitivity as a performance metric for large telescopes. Appl. Opt. 48 (31), 5997–6007. doi:10.1364/ao.48.005997
Seo, B.-J., Nissly, C., Angeli, G., MacMynowski, D., Sigrist, N., Troy, M., et al. (2009b). Investigation of primary mirror segment's residual errors for the Thirty Meter Telescope. Opt. Model. Perform. Predict. IV 7427. doi:10.1117/12.828046
Sobek, R. D. (2005). Mitigating wind induced telescope jitter. Acquis. Track. Pointing XIX 5810, 1–10. doi:10.1117/12.603963
Vogiatzis, K., and Angeli, G. Z. (2008). Monte Carlo simulation framework for TMT. Model. Syst. Eng. Proj. Manag. Astronomy III 7017. SPIE. doi:10.1117/12.787933
Yangx, X., Meng, H. R., Yin, Y. M., Wang, S., and Wu, Q. (2013). Jitter measurement for large opto-electronic telescope using accelerometers. J. Electron. Meas. Instrum. 27 (9), 823–830. doi:10.3724/sp.j.1187.2013.00823
Keywords: large-aperture telescope, normalized point source sensitivity, integrated modeling, mode contribution, jitter evaluation
Citation: Yuan-Guo L, Fei Y, Jia-Kang Z and Yin-Long H (2023) Jitter error evaluation in large-aperture optical telescopes based on normalized point source sensitivity. Front. Astron. Space Sci. 10:1311323. doi: 10.3389/fspas.2023.1311323
Received: 09 October 2023; Accepted: 21 November 2023;
Published: 15 December 2023.
Edited by:
Hairen Wang, Chinese Academy of Sciences (CAS), ChinaReviewed by:
Jianqiang Ma, Ningbo University, ChinaDonglin Ma, Huazhong University of Science and Technology, China
Copyright © 2023 Yuan-Guo, Fei, Jia-Kang and Yin-Long. This is an open-access article distributed under the terms of the Creative Commons Attribution License (CC BY). The use, distribution or reproduction in other forums is permitted, provided the original author(s) and the copyright owner(s) are credited and that the original publication in this journal is cited, in accordance with accepted academic practice. No use, distribution or reproduction is permitted which does not comply with these terms.
*Correspondence: Yang Fei, eWFuZ2ZseWluZ0AxNjMuY29t
 Liu Yuan-Guo
 Yang Fei1*