 Raluca Ilie
 Mei-Yun Lin
 Muhammad Fraz Bashir
 Abhiraj Majumder
- 1Electrical and Computer Engineering Department, University of Illinois at Urbana Champaign, Urbana, IL, United States
- 2Department of Earth, Planetary, and Space Sciences, University of California, Los Angeles, Los Angeles, CA, United States
Most studies have yet to consider and assess the transport and energization of N+ ions throughout the ionosphere-magnetosphere system, in addition to that of O+ and other heavy ion species. The limited observational record of N+ presence in near-Earth plasma, partly due to instrument limitations to distinguish ion species of similar masses, has obscured its significant contribution to the near-Earth plasma. This letter reviews the most notable observations of N+ ions, starting from the early low altitude measurements from Sputnik III in the ionosphere to the measurements reported by the Enhanced Polar Outflow Probe (e-POP) mission. The available observational data set suggests that nitrogen ions are constant companions of outflowing oxygen ions, and their abundances vary with season, solar cycle, time of day, and geomagnetic activity. This strong record of nitrogen presence in the ionosphere-magnetosphere system raises the question of ionic composition and the need for caution when interpreting O+ measurements from current missions.
1 Introduction
The energization and subsequent vertical transport of H+, He+, and O+ ions from the high latitude ionosphere to the terrestrial magnetosphere has been an active area of research in the last several decades (Schunk and Raitt, 1980; Mukai et al., 1994; Schunk and Sojka, 1997; Daglis et al., 1999; Winglee et al., 2002; Nosé et al., 2005; Barakat and Schunk, 2006; Glocer et al., 2009; Garcia et al., 2010; Ilie et al., 2013; Ilie et al., 2015). However, the energization, circulation, and redistribution of N+, in addition to that of O+, has received less attention, even though several direct and indirect measurements (Bashir and Ilie, 2018; Bashir and Ilie, 2021) have confirmed that N+ plays a crucial role in the near-Earth plasma dynamics.
The first ionospheric measurements of upflowing nitrogen ions were reported as early as 1961 by the Sputnik III mission. The existing observational record spans six solar cycles and consists of measurements spanning a wide range of altitudes, from
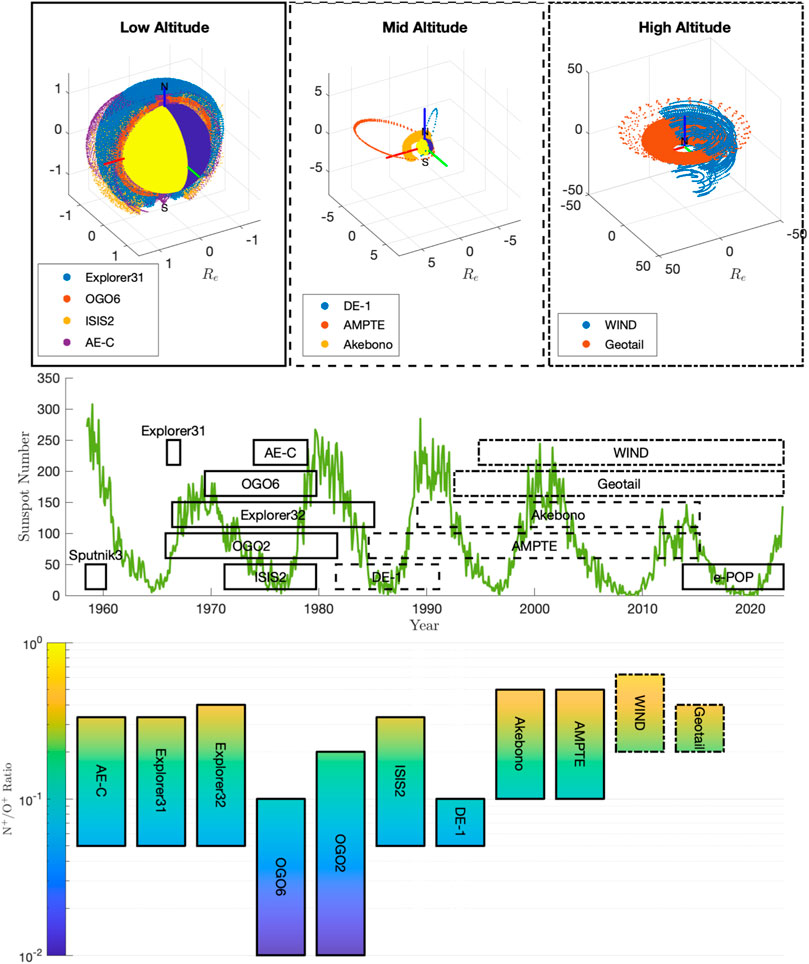
FIGURE 1. Top panel: Spacecraft trajectories for missions that reported a N+ to O+ ratio (see Table 1) differentiated by altitude: low-altitude (left), mid-altitude (center), and high-altitude (right). Middle panel: Sunspot number from 1958 to 2022 (green line) indicative of solar cycles 19 through 24. The “nitrogen measuring” missions and the corresponding operation time are represented by horizontal bars. Note that the actual data availability for N+ covers a time window less than the mission lifetime (as seen in the top panel). Bottom panel: The N+ to O+ density ratio reported based on mission-specific measurements. The color bar represents the reported range of the N+ to O+ ratio.
However, the N+ to O+ density ratio has been reported to vary not only with the solar cycle but also with the season, geomagnetic activity, latitude, magnetic local time (MLT), and time of day. These variations imply that N + and O + obey different chemical and energization processes as they are lofted from the ionosphere and possibly follow different paths of energization as they convect and drift throughout the magnetosphere. Therefore, their differential transport and circulation depend not only on the external drivers but also on the local atmospheric conditions.
Instruments onboard most space missions could not reliably separate the N+ from O+, and relatively few currently active ion spectrometers in space have the appropriate mass resolution to distinguish between these two ion species. Therefore, the separate observational record of N+ has been overlooked. These satellite-borne ion composition observations reveal several essential features attributable to “non-classical” acceleration mechanisms, i.e., centrifugal acceleration due to field line convection and curvature changes, transverse heating of ions as a result of wave-particle interactions, ponderomotive forces of Alfvén waves or Field Aligned Currents (FACs) driving the parallel electric field, and low altitude frictional heating Peterson et al. (1994); Yau et al. (2007). Therefore, questions regarding the relative contribution of the different sources of the high-altitude ionospheric outflow remain unanswered. In this letter, we review the most notable observations of nitrogen ions in the ionosphere-magnetosphere system to provide the reader with the context of these observations while emphasizing the need to develop instrumentation capable of distinguishing between O+ and N+ ions.
2 Production and loss of nitrogen ions in the ionosphere
There are several possible mechanisms responsible for producing N+ in the sunlit ionosphere: dissociative ionization of N2 by photons or photo-electrons, charge transfer reactions between
This section presents the altitude profiles of production and loss processes for N+ ions from 200 to 2,500 km altitude in the polar ionosphere. These are derived from hybrid simulations using the Seven Ion Polar Wind Outflow Model (7iPWOM) (Lin et al., 2020), and the solution is based on the combined hydrodynamic approximation below 1,000 km altitude and particle-in-cell approach above 1,000 km altitude. Since solar activity is known to alter the density profiles of atmospheric neutrals, as well as the photo- and secondary electron spectra (Solomon et al., 1988), we present here the steady-state simulation results for summer solstice, both for Solar Maximum conditions (F10.7 = 180 × 10−22 WHz/m2), as well as for Solar Minimum (F10.7 = 80 × 10−22 WHz/m2), as shown in Figure 2. For both cases, the solution is based on a steady-state numerical simulation for which the magnetic field lines originated at 80° latitude and 12 MLT in the northern hemisphere. The neutral densities are obtained from NRLMSISE-00 empirical model (Picone et al., 2002), while neutral NO, NO(2D), N(2D), and N(4S) densities are retrieved from the Global Ionosphere Thermosphere Model (GITM) (Ridley et al., 2006). It is important to note that the neutral densities, in particular the density of neutral hydrogen, are of great importance for determining the global fluence of ionospheric outflow as the ionosphere and thermosphere are strongly coupled through the resonant charge exchange reactions between ionospheric ions and the colocated neutral hydrogen population. For instance, the supply of H+ to the ionosphere is limited by the local distribution of hydrogen density. However, there is controversy regarding the available supply of neutral hydrogen; studies report that the predicted neutral H density by the NRLMSISE-00 model is either overestimated by as much as ∼36%–67% (Waldrop and Paxton, 2013) or underestimated by as much as a factor of two (Nossal et al., 2012; Kotov et al., 2018). Furthermore, the density of hydrogen in the upper thermosphere is reported to vary with the solar cycle and is reported to be larger during solar minimum conditions as compared to solar maximum (Qian et al., 2018). Therefore, the production and loss rates presented in Figure 2 are only intended to provide context for the chemistry involving N+ ions in the high-latitude terrestrial ionosphere and are not representative of all conditions.
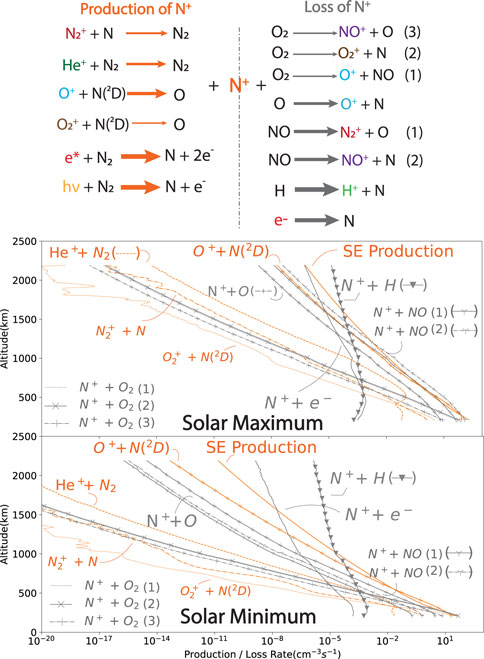
FIGURE 2. Chemical reactions leading to the N+ production (colored lines) and loss (grey lines) between 200 and 2,500 km altitude range, based on the 7iPWOM simulation results for Solar Maximum (middle row) and Minimum (bottom row) summer noon conditions. The top diagram shows the chemical reactions responsible for the production and loss of N+ ions, where the thickness of the arrows represents the magnitude of reaction rates (cm−3s−1).
The top panel in Figure 2 lists the chemical reactions contributing to the production and loss of N+ ions, based on the reaction rates published in Lin et al. (2020). Each of the ion species involved in the ion-neutral-electron collisions is shown in colored text: O+ (blue), N+ (orange), He+ (dark green), H+ (light green),
The Suprathermal Electron(SE) production (solid orange line) and the charge exchange between neutral N(2D) species (orange + symbol line) dominate the production of N+ ions at altitudes between 200 and 2,500 km. In contrast, N+ ions are lost via charge exchange reactions with neutral NO (grey Y symbol line) and neutral O (grey + symbol line) in the low-altitude F2 region, while the dissociative recombination with electrons (solid grey line) and charge exchange with neutral H species (grey triangle line) take over the loss of N+ ions in the high-altitude region. In addition, the production and loss profiles indicate that the interplay between O+, N+, and molecular ions via ionospheric chemistry is critical to determining the budget of heavy ions in the low-altitude region. The production rates of molecular
Although the primary reactions to produce and lose N+ ions are similar between Solar Maximum and Minimum conditions, the relative contributions of these reactions change under different solar activities, especially the SE production rate. For example, the loss rate of N+ ions via charge exchange with neutral H is larger than the production rates of N+ via SE production above 1,500 km altitude during Solar Maximum. However, this transition occurs at around 1,000 km altitude during Solar Minimum conditions. These variations in the production and loss altitude profiles hint at a dynamic interplay between all ionospheric species at lower altitudes, significantly altering the peak production rates for N+ for various conditions. In addition, the abundances of N+ ions in the polar ionosphere are mainly controlled by the SE production rate, therefore hinting at a possible connection between N+ density and solar driving via the F10.7 index. Furthermore, the N+ production rates during Solar Minimum conditions dominate up to 1,000 km altitude. In contrast, during Solar Maximum conditions, the SE production and the charge exchange between neutral N(2D) species are most effective below 500 km altitude. This suggests that N+ ions might have extended lifetimes during Solar Minimum compared to Solar Maximum conditions.
3 Observations of nitrogen ions in the ionosphere
The first direct measurements of ionic composition in the topside ionosphere came from the Bennett type Radio Frequency (RF) quadrupole mass spectrometer onboard the Soviet Sputnik III satellite (Istomin, 1961). Sputnik III was launched on 15 May 1958, to study the upper atmosphere and the near-Earth space, on an orbit with 65.18° inclination, spanning space from 217 km to 1,864 km altitude, and re-entered the atmosphere in 1960. The mass spectrometer it carried provided measurements of ions with masses between 6 and 48 atomic mass units. Figure 3 shows the first measurements of N+ and
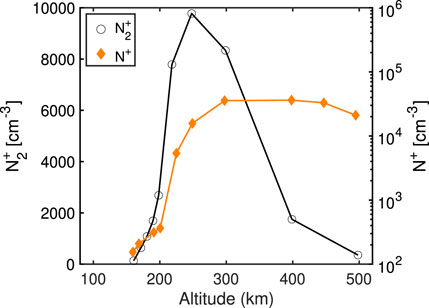
FIGURE 3. First direct mass spectrometric measurements showing the altitude profile of positive ions of molecular (black line) and atomic nitrogen (orange line) in the atmosphere. Figure digitized and adapted from Istomin (1961).
These measurements indicated that at lower altitudes, below 150 km, the abundance of N+ is somewhat small, with N+ densities being less than 102 cm−3; however, as the altitude increases, the N+ density increases rapidly by 2–3 orders of magnitude. While the abundances of
The first U.S.-led detailed experimental study of atmospheric composition was based on data from the R.F. ion spectrometer onboard Polar Orbiting Geophysical Observatory (OGO 2), designed to measure thermal ions in the mass range of 1–45 amu. Figure 4 shows the concentrations of H+, He+, N+, and O+ ions as a function of dipole latitude and altitude (Taylor et al., 1968), as measured by OGO 2 on 15 October 1965 (quiet time, Dst ∈ [0, 2] nT) at dawn (panel a) and dusk (panel b). These measurements show that heavy ions dominate the atmospheric composition in the high latitude regions, while lighter ions prevail in the equatorial region. Furthermore, ion concentrations exhibit these high latitude variabilities both at dawn and at dusk local times. However, these observations not only showed evidence of latitudinal variation in the exospheric ion composition but also that N+ ions become significantly important at high latitudes, in the polar and auroral regions, where they can exceed the He+ abundances, and sometimes even the H+ (Brinton et al., 1968) density. Panel c) shows the N+ to O+ ratio, also as a function of dipole latitude and altitude. During the dusk pass, spacecraft measurements indicate that the N+/O+ is significantly higher than during the dawn pass, showing over one order of magnitude difference between the two data sets. This is mainly due to the different sampling altitudes between dusk (∼1,300–2,000 km) vs. dawn (∼400–900 km). Furthermore, during the dusk pass (at a sampling altitude between ∼1,300–1,700 km), above 60° latitude in the northern hemisphere, the N+/O+ ∈ [0.2, 0.6], while measurements taken during the dusk pass (at a sampling altitude between ∼600–800 km) yield a N+/O+ around 0.1.
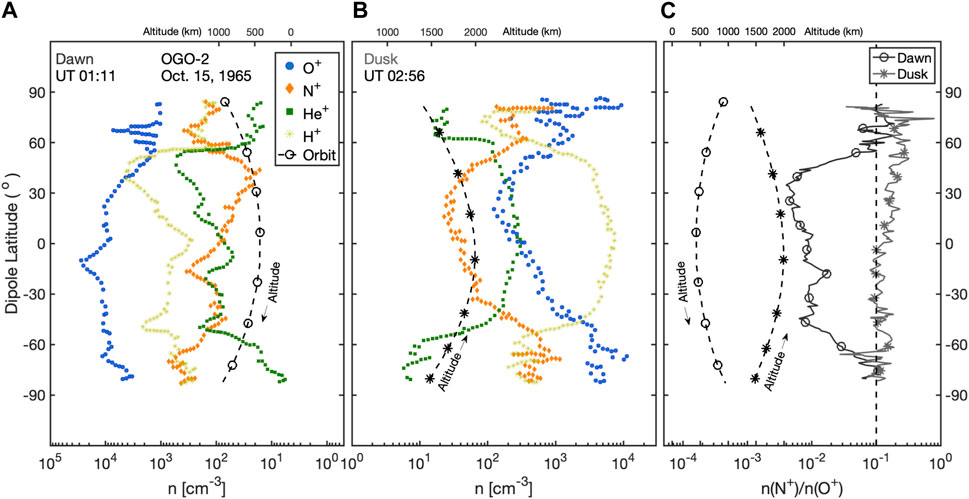
FIGURE 4. Global distribution of ion composition observed by OGO 2 between 0111 (dawn - panel a) and 0256 UT (dusk -panel b) on 15 October 1965, showing the concentrations of H+ (light green), He+ (dark green), N+(orange) and O+ (blue) ions as a function of dipole latitude and altitude. Panel (C) shows the N+/O+, based on measurements shown in (A) and (B). Figure digitized and adapted from Taylor et al. (1968).
These measurements were also confirmed by the mass spectrometer data from the Explorer 31 (DME-A) satellite, which showed that N+ is a significant ionospheric constituent, often exceeding He+ in concentration (Hoffman, 1967). Figure 5 shows the ion concentration profiles during 15 August 1966 (quiet time), as measured by Explorer 31. N+ density was reported to vary between 5% and 30% of that of O+, while H+ abundances were reported to be only 5% of the O+ concentration at these altitudes. These observational data sets suggest that, even during solar minimum conditions and geomagnetically quiet times, N+ ions are the second most abundant ion species found in the Earth’s ionosphere (Hoffman, 1970), findings aligned and confirmed by earlier measurements (Istomin, 1961; Holmes et al., 1965).
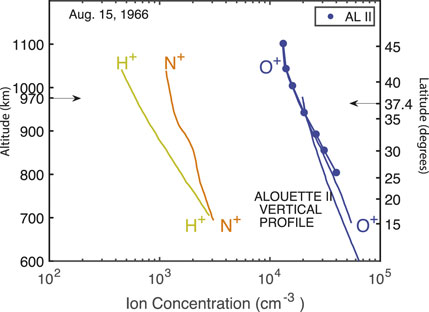
FIGURE 5. Explorer 31 measurements of ion concentration vs. altitude and latitude: H+ (light green), N+(orange), and O+ (blue). Figure digitized and adapted from Hoffman (1970).
Similarly, Explorer 32 (Atmosphere Explorer-B or AE-B), launched on 25 May 1966, was designed to measure temperatures, composition, densities, and pressures in the topside ionosphere. The spacecraft carried a Bennett RF ion spectrometer, which measured the abundances of thermal positive ions of 1–4 and 12–19 amu. Based on measurements collected during the 10-month-long lifespan of the spacecraft, a global study of the diurnal variation of the atmosphere revealed substantial altitude variations of ion composition between 58° and 71° geomagnetic latitude. In addition, measurements at altitudes between 500 and 1,500 km and during geomagnetically active times reported that the abundances of O+ and N+ ions were a factor of ∼2.5 higher than during geomagnetically quiet times (Brinton et al., 1971).
The second satellite launched under the NASA International Satellite for Ionospheric Studies (ISIS) program, ISIS-2, was deployed on 1 April 1971, into an 88.1° prograde orbit with apogee and perigee of 1,440 and 1,360 km, respectively. ISIS-2 carried out an Ion Mass Spectrometer (IMS) experiment designed to measure the composition and distribution of positive ions in the terrestrial ionosphere in the mass range of 1–64 amu (Hoffman, 1970). The first measurements from the IMS instrument (Hoffman et al., 1974) showed significant variations in ion composition, particularly in the night-side equatorial region and in the daytime poleward of the plasmapause region. It was recorded that during daytime (summer conditions), above 20° latitude, the O+ ion is the dominant species, and its abundance remains constant to the pole. The density of N+ ions consistently varies together with the density of O+ at roughly one order of magnitude lower concentration, except at mid to low latitudes, where the ratio of O+/N+ is ∼20. It is noted that the same ratio approaches ∼3 on each side of the equatorial maximum abundance of O+ on the night-side. These features seem typical during undisturbed conditions (Hoffman et al., 1974) and in line with previous measurements.
During geomagnetically active times, the picture changes significantly. Figure 6 shows the ionic concentrations based on IMS observations during the double-dip geomagnetic storm of 4 August 1972, which recorded a minimum Dst of −125 nT and a Kp = 9. Measurements during the times when the Kp index reached the maximum value show that the N+ ion becomes the dominant outflowing species at 1,400 km, from 55° latitude towards the pole (Hoffman et al., 1974). In addition, large concentrations (
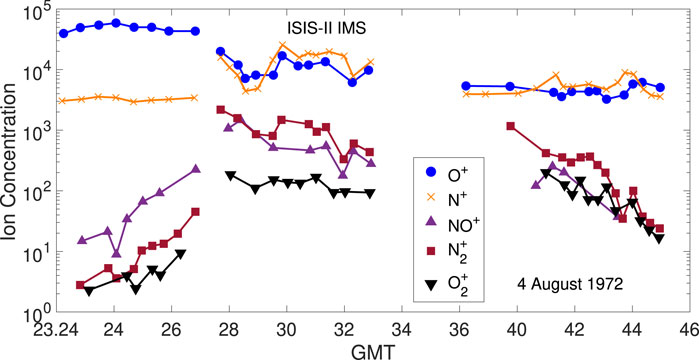
FIGURE 6. ISIS 2 measurements of ion composition during August 1972 storm showing increased N+ (orange), O+ (blue) and molecular ions species abundances at 1,400 km. Figure digitized and adapted from Hoffman et al. (1974).
Furthermore, the Akebono spacecraft (launched on 22 February 1989) carried the Suprathermal Ion Mass Spectrometer (SMS) (Whalen et al., 1990), which sampled the two-dimensional thermal (0–25.5 eV) and suprathermal (55 eV/q-4.1 keV/q) ion energy distributions in the satellite spin plane. SMS measurements (Whalen et al., 1990) also confirmed the presence of N+ above the ionosphere. Spin averaged data taken on 7 November 1989, when the satellite was at 5,000 km in the southern hemisphere auroral zone near local noon, revealed the existence of a peak near m/q = 16 with a noticeable shoulder on the lower mass side. Inspection of the high-resolution data indicated that in fact both N+ and O+ ions were present at this time and with a O+/N+ density ratio of
Furthermore, cold atomic N+, and molecular
4 Observations of nitrogen ions in the magnetosphere
The ionosphere and the solar wind constitute the mass and energy source for the terrestrial magnetosphere. At the same time, the ionosphere is the primary supply of cold plasma to the plasmasphere and also a critical source for the plasmasheet population (e.g., Shelley et al., 1972; Cladis, 1988; Horwitz et al., 1990; Seki et al., 2015; Kistler et al., 2016; Welling and Liemohn, 2016), and a sufficient reservoir for the magnetosphere under any geomagnetic condition (Chappell et al., 1987). The first discovery of nitrogen ions (both N+ and N++) in the magnetosphere was made by the Dynamic Explorer 1 (DE-1) (Chappell et al., 1982) mission, which carried the first mass spectrometer that could resolve masses near O+ peak in the mass spectrum, with a projected mass resolution δm/m = 3%. The Retarding Ion Mass Spectrometer (RIMS) Experiment onboard the DE-1 satellite measured ions with a mass between 1 and 32 amu and energies ranging from 0 to 50 eV. During the moderate geomagnetic storm of 30 December 1981 (when the Kp index reached a maximum of 6), the RIMS instrument recorded the presence of N+ and N++ in the 04 to 16 MLT sector in the magnetosphere. Figure 7, adapted and digitized from (Chappell et al., 1982), shows the mass spectra measured in the high mass channel for two time periods: when the spacecraft was in the plasmasphere (solid line for measurements taken at 10:06 UT) and in the polar cap (dashed line at 07:37 UT). It is noted that the N+ and O+ peaks are clearly resolved in both cases, while no He+ counts are being recorded during both these times. Measurements from 30 December 1981, show cold (
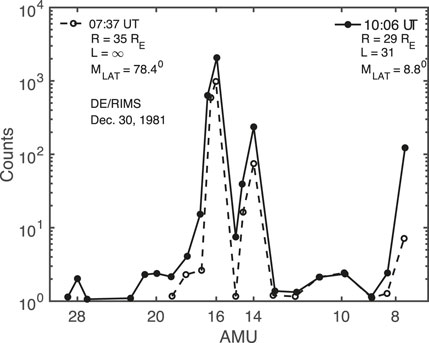
FIGURE 7. DE-RIMS measurements showing counts per accumulation versus mass. Figure adapted and digitized from Chappell et al. (1982).
In addition, the largest enhancements on the N+ fluxes are seen at the outer edge of the plasmasphere, suggesting the possibility of an existing N+ torus, analogous to the previously reported O+ torus features (Chappell et al., 1982). Furthermore, based on spacecraft position, peak flux, and flow velocity, it was inferred that these outflowing N+ ions could be interpreted as 0.3 eV field aligned N+ ion beams with a density of 0.8 cm−3, and they present similar characteristics as the low energy O+. A possible explanation of these observed enhancements of N+ fluxes at the outer edge of the plasmasphere is provided by the fact that the N+ undergoes more efficient charge-exchange reactions than O+ does and has a shorter average lifetime in the inner magnetosphere primarily due to the difference in charge exchange cross sections between the two species and the ambient neutral hydrogen. These differences imply that O+ ions are more likely to be transported inwards, towards lower L-shells, before they charge exchange with the ambient neutral H population, while energetic N+ ions have a shorter lifetime in the inner magnetosphere as they lost via charge exchange reaction significantly faster. This prohibits their transport deeper into the inner magnetosphere, and therefore they tend to populate the outer edge of the plasmasphere (Liu et al., 2022).
As Figure 7 shows, during this time, the highest fluxes of N+ are seen in the plasmasphere region as high as 3 RE and the count rate ratio N+/O+ is about 0.1. These observations of magnetospheric N+ are aligned with the measurements reported in the low altitude ionosphere (Brinton et al., 1971; Hoffman et al., 1974). The low energy N+ were reported to exhibit seemingly similar characteristics with the low energy O+ and numerical modeling results suggest that, for low energy ions (
Energetic nitrogen ions of above 10 keV have also been detected at higher altitudes in the magnetosphere by the Active Magnetospheric Particle Tracer Explorers (AMPTE) charge-energy-mass (CHEM) instrument (Hamilton et al., 1988). Figure 8 shows the measurements for the energy density at low and high L shells during the first great magnetic storm of 9 February 1986 (with a recorded Dst minimum of −312 nT), after the launch of AMPTE spacecraft. The top panel shows the hourly Dst index throughout the storm, while the following two panels show measurements of the energy density for ring current species, at L = 3–5 and L = 5–7, respectively. While at all L-shells, the bulk of energy density is mostly carried by the H+ population, the N+ energy density closely follows the trend seen for O+. In addition, all ring current species show an increase in density during the storm period, but the relative increase of O+ and N+ ions is much larger at all distances. At lower L shells, during storm maximum, oxygen ions seem to be the dominant species, with nitrogen ions following closely, while at higher L shells, most of the energy density is carried by the H+ population.
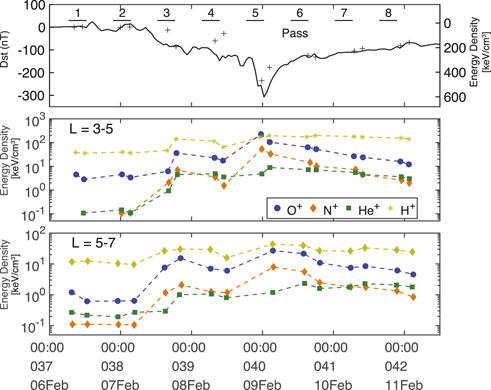
FIGURE 8. Top panel shows the hourly Dst index through the storm, together with the inverted energy density. The periods during the eight orbits when the spacecraft was inside L = 7 are shown using horizontal lines. Middle and bottom panels show the energy density as a function of time for H+ (light green), He+ (dark green), N+ (orange) and O+ (blue) for L = 3–5, and L = 5–7 respectively. Figure digitized and adapted from Hamilton et al. (1988).
Figure 9 shows the energy spectra for H+ (light green), He+ (dark green), N+ (orange) and O+ (blue) ions, adapted from (Hamilton et al., 1988). These measurements also show that the fluxes of high energy ring current N+ are comparable with those of O+ during active times and tend to be at least one order of magnitude higher than those of He+ ions. Furthermore, Magnetospheric Multiscale (MMS) observations showed that the high energy population (
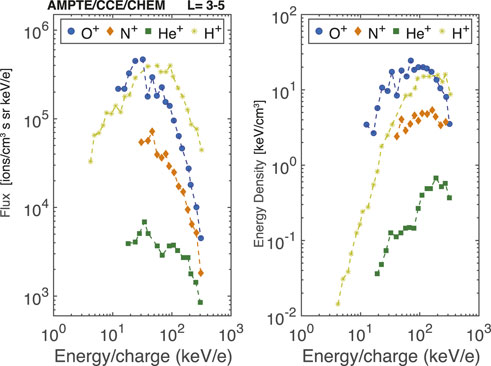
FIGURE 9. Energy spectra (left) and energy density (right) of ring current ions species, H+ (light green), He+ (dark green), N+ (orange) and O+ (blue), during 9 February 1986, geomagnetic storm. Figure digitized and adapted from Hamilton et al. (1988).
While solar activity controls the ionic composition of the upper atmosphere (Young et al., 1982; Moore et al., 1999; Cully et al., 2003; Peterson et al., 2006; Brambles et al., 2013; Chappell, 2015), the mass density in the magnetosphere, and hence the abundances of heavy ions of ionospheric origin in the near-Earth plasma are increasing with geomagnetic activity (Daglis, 1997; Nosé et al., 2003). This suggests that throughout the main phase of a magnetic storm, not only O+, but also N+ ions have the potential to become the dominant ring current ions (Hamilton et al., 1988; Ilie et al., 2021) in terms of energy density.
The Suprathermal Ion Composition Spectrometer (STICS) of the Geotail/EPIC (Energetic Particles and Ion Composition) instrument (Williams et al., 1994) had the capability to measure the mass and mass per charge of energetic ions within the energy range of 9.4–210 keV/e. Therefore, Geotail observations also show that both O+ and N+ are major constituents of the dayside (11–16 MLT) outer ring current, especially during increased geomagnetic activity (Christon et al., 2002). Furthermore, the density of N+ ions is trailing after hydrogen and oxygen ions, even during moderate geomagnetic storms. Figure 10, adapted from (Christon et al., 2002), shows the solar cycle variations of F10.7, Dst, and Kp indices, together with the N+/O+ ratio, from 1990 to 2002. Tracking the N+/O+ ratio together with the F10.7 index, a proxy for solar radiation and hence solar activity, reveals an inverse relationship between the N+/O+ ratio and solar cycle. It can be seen that this ratio ranges between 0.36 and 0.42 during low solar activity and decreases to 0.21–0.27 during times of increased solar activity. Therefore, one can note a drop by a factor of
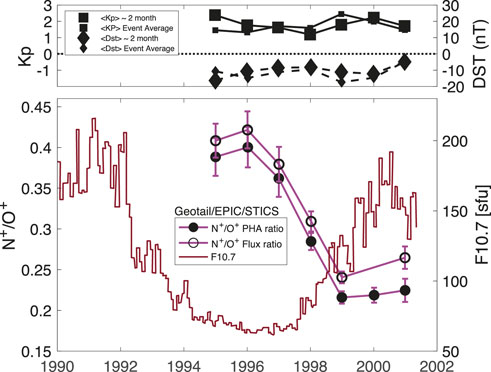
FIGURE 10. Solar cycle variations, average Dst and average Kp (top panel), and outer ring current N+/O+ ratio together with F10.7 (bottom panel), for intervals when Geotail was in the afternoon local sector, from 1990 to 2002. Figure digitized and adapted from Christon et al. (2002).
Figure 11, adapted from (Christon et al., 2002), shows histograms of nitrogen and oxygen ion pulse-height analyzed events for different solar and geomagnetic conditions. These measurements, based on 12 years of Geotail data, reveal large variations in the ratio of N+/O+ in the dayside outer ring current, ranging from 0.14 during active times at solar maximum to larger than unity during quiet times at solar minimum. This ratio is also affected by geomagnetic activity, but to a lesser extent, and it is likely due to the fact that solar activity is the dominant factor in this analysis, as it is responsible for altering the ionospheric source population and means of acceleration for heavy ion outflow. Nevertheless, even during modest geomagnetic storms, N+ is generally the third most abundant magnetospheric ion in the 22.7–210 keV/q range, after H+ and O+ in the dayside outer ring current.
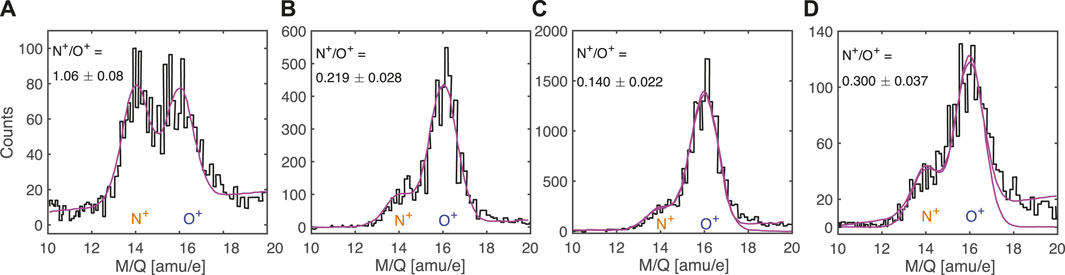
FIGURE 11. Histograms of N+ and O+ pulseheight analyzed events in the 10–20 M/q (mass-per-charge) range for varying solar and geomagnetic conditions (A) solar minimum - quiet time, (B) solar minimum - storm time, (C) solar maximum - storm time, (D) solar maximum - quiet time. Figure adapted from Christon et al. (2002).
These findings complement measurements based on instrumentation onboard the WIND spacecraft (Mall et al., 2002), which showed that the abundance of nitrogen ions in the magnetosphere displays both a solar cycle and a day-night variation. The N+ density has been reported to vary by as much as a factor of 2 with solar activity (Christon et al., 2002). Furthermore, the ratio of N+/O+ displays a solar cycle relationship with a higher value (0.45) at solar minimum conditions than at solar maximum when it reaches only 0.2 (Mall et al., 2002). Figure 12, adapted from (Mall et al., 2002), shows the variation of N+/O+ ratio with solar activity in the outer ring current region at 9–15 RE. The factor of two variations has been linked to the altitude and latitude variations in ionospheric N+/O+ ratio since at times of enhanced ionospheric outflow, the ratio of magnetospheric N+/O+ approaches the ratio of N+/O+ at the topside ionosphere (Christon et al., 2002). In addition, Geotail data shows that oxygen and nitrogen ions are detected together in the outer ring current region nearly continuously, findings that are consistent with previous measurements coming from AMPTE/CCE data (Gloeckler and Hamilton, 1987) and a more recent study by Christon et al. (2020).
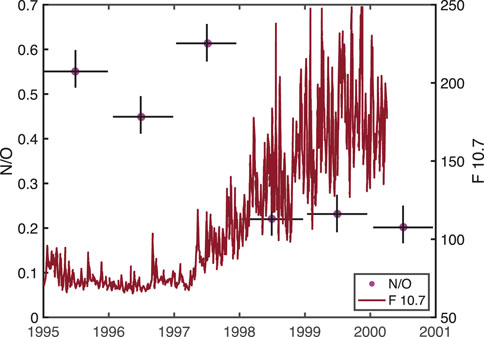
FIGURE 12. The ratio of N+/O+ (energy/charge interval of 10–210 keV/e) and normalized F10.7 cm flux as a function of time as inferred from the WIND/STICS data. Figure digitized and adapted from Mall et al. (2002).
More recently, the first observation of the N+ band of electromagnetic ion cyclotron (EMIC) (Bashir and Ilie, 2021) waves has been reported by Van Allen probe wave observation during the recovery phase of a geomagnetic storm. The existence of the N+ band indirectly suggests the presence of N+ ions in the inner magnetosphere, as reported by the past observations (Chappell et al., 1982; Hamilton et al., 1988) and also theoretically inferred N+ composition using the indirect method for EMIC waves (Bashir and Ilie, 2018).
5 Discussion
These observations reopen the question of ionic composition in the ionosphere-magnetosphere system and the need for caution when interpreting O+ measurements. Understanding plasma composition requires ultimately including a variety of ions that are currently known, although less reported, to be present in the low-altitude ionosphere. Table 1 summarizes the N+ measuring space missions and relevant details regarding orbits and onboard instrumentation. This review is intended to motivate and guide the development of instrumentation and possibly space missions, capable of measuring abundances and tracking the transport of both O+ and N+ ions, which are not quantified, nor understood, at this time (Ilie and Liemohn, 2016). Knowledge of the different behavior and paths of energization for O+ and N+ will provide the context for the interpretation and analysis of data from many currently operating ionospheric and magnetospheric missions.
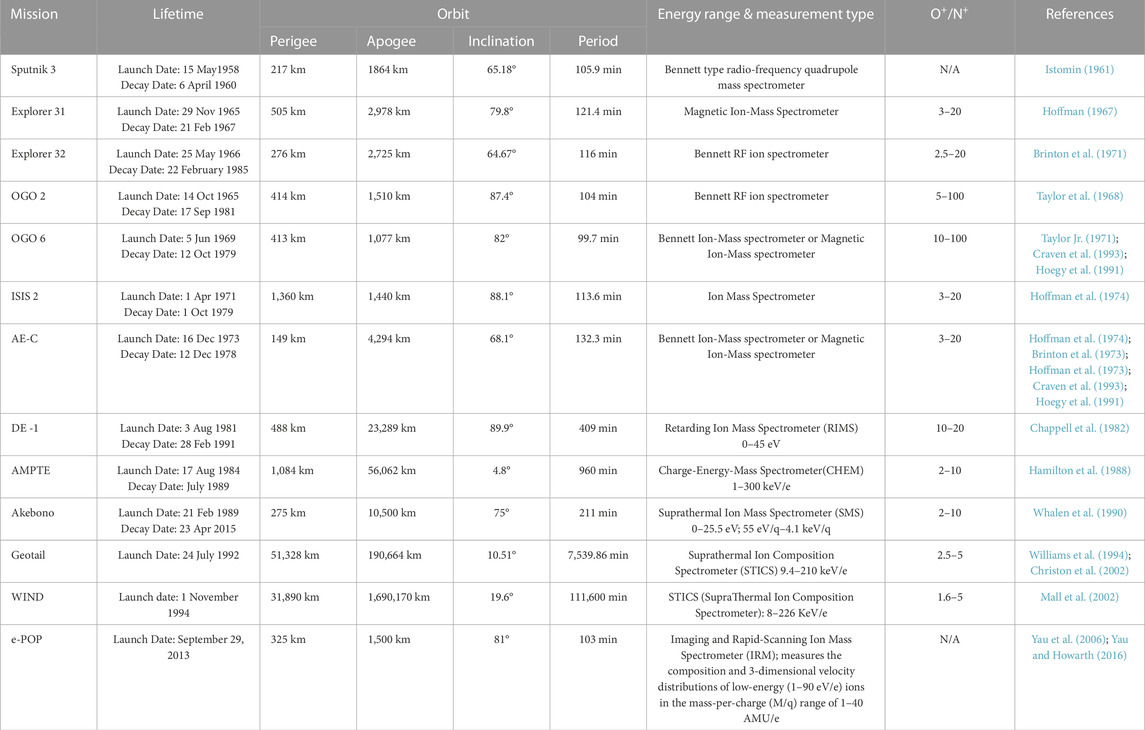
TABLE 1. List of N+ measuring space missions, including launch dates, orbital details, relevant instrumentation, and reported O+/N+ ratio.
Author contributions
All authors listed have made a substantial, direct, and intellectual contribution to the work and approved it for publication.
Funding
Work at the University of Illinois at Urbana-Champaign was performed with financial support from AFOSR YIP award no. AF FA 9550-18-1-0195, the NASA grant 80NSSC20K1231, and the NSF ICER Award No.1664078. MB acknowledges support from the NASA grants 80NSSC20K1270, and 80NSSC23K0403. M-YL would like to thank the financial support from NASA FINESST Fellowship 80NSSC21K1425.
Conflict of interest
The authors declare that the research was conducted in the absence of any commercial or financial relationships that could be construed as a potential conflict of interest.
Publisher’s note
All claims expressed in this article are solely those of the authors and do not necessarily represent those of their affiliated organizations, or those of the publisher, the editors and the reviewers. Any product that may be evaluated in this article, or claim that may be made by its manufacturer, is not guaranteed or endorsed by the publisher.
References
Barakat, A. R., and Schunk, R. W. (2006). A three-dimensional model of the generalized polar wind. J. Geophys. Res. Space Phys. 111, A12314. doi:10.1029/2006ja011662
Bashir, M. F., and Ilie, R. (2018). A new N+ band of electromagnetic ion cyclotron waves in multi-ion cold plasmas. Geophys. Res. Lett. 45, 10150–10159. doi:10.1029/2018GL080280
Bashir, M. F., and Ilie, R. (2021). The first observation of N+ Electromagnetic ion cyclotron waves. J. Geophys. Res. Space Phys. 126, e2020JA028716. doi:10.1029/2020ja028716
Brambles, O. J., Lotko, W., Zhang, B., Ouellette, J., Lyon, J., and Wiltberger, M. (2013). The effects of ionospheric outflow on ICME and SIR driven sawtooth events. J. Geophys. Res. Space Phys. 118, 6026–6041. doi:10.1002/jgra.50522
Brinton, H. C., Grebowsky, J. M., and Mayr, H. G. (1971). Altitude variation of ion composition in the midlatitude trough region: evidence for upward plasma flow. J. Geophys. Res. Space Phys. 76, 3738–3745. doi:10.1029/ja076i016p03738
Brinton, H. C., Pharo, M. W. I., Rahman, N. K., and Taylor, H. A. J. (1968). Latitudinal variation of the composition of the topside ionosphere, first results of the OGO-2 ion spectrometer. OSTI.GOV, Technical Report. Available at: https://www.osti.gov/biblio/4839431.
Brinton, H. C., Scott, L. R., Pharo, M. W., and Coulson, J. T. (1973). The bennett ion-mass spectrometer on atmosphere explorer-c and -e. Radio Sci. 8, 323–332. doi:10.1029/RS008i004p00323
Chappell, C. R., Green, J. L., Johnson, J. F. E., Waite, J. H. J., and Olsen, R. C. (1982). The discovery of nitrogen ions in the earth’s magnetosphere. Geophys. Res. Lett. 9, 937–940. doi:10.1029/gl009i009p00937
Chappell, C. R., Moore, T. E., and Waite, J. H. (1987). The ionosphere as a fully adequate source of plasma for the earth’s magnetosphere. J. Geophys. Res. 92, 5896–5910. doi:10.1029/JA092iA06p05896
Chappell, C. R. (2015). The role of the ionosphere in providing plasma to the terrestrial magnetosphere—an historical overview. Space Sci. Rev. 192, 5–25. doi:10.1007/s11214-015-0168-5
Christon, S. P., Hamilton, D. C., Mitchell, D. G., Plane, J. M. C., and Nylund, S. R. (2020). Suprathermal magnetospheric atomic and molecular heavy ions at and near earth, jupiter, and saturn: observations and identification. J. Geophys. Res. Space Phys. 125, e27271. doi:10.1029/2019ja027271
Christon, S. P., Mall, U., Eastman, T. E., Gloeckler, G., Lui, A. T. Y., McEntire, R. W., et al. (2002). Solar cycle and geomagnetic N+1/O+1 variation in outer dayside magnetosphere: possible relation to topside ionosphere. Geophys. Res. Lett. 29, 2-1–2-3. doi:10.1029/2001gl013988
Cladis, J. (1988). Transport of ionospheric ions in the magnetosphere: theory and observations. Adv. Space Res. 8, 165–173. doi:10.1016/0273-1177(88)90283-9
Cohen, I. J., Mitchell, D. G., Kistler, L. M., Mauk, B. H., Anderson, B. J., Westlake, J. H., et al. (2017). Dominance of high-energy (>150keV) heavy ion intensities in Earth’s middle to outer magnetosphere. J. Geophys. Res. Space Phys. 122, 9282–9293. doi:10.1002/2017ja024351
Craven, P. D., Comfort, R. H., Richards, P. G., and Grebowsky, J. M. (1993). Comparisons of modeled N+, O+, H+, and He+ in the midlatitude ionosphere with mean densities and temperatures from Atmosphere Explorer. PhD Thesis 100, 257–268. doi:10.1029/94ja02306
Craven, P. D., Comfort, R. H., Richards, P. G., and Grebowsky, J. M. (1995). Comparisons of modeled N+, O+, H+, and He+ in the midlatitude ionosphere with mean densities and temperatures from Atmosphere Explorer. J. Geophys. Res. Space Phys. (1978–2012) 100, 257–268. doi:10.1029/94ja02306
Cully, C. M., Donovan, E. F., Yau, A. W., and Arkos, G. G. (2003). Akebono/Suprathermal Mass Spectrometer observations of low-energy ion outflow: dependence on magnetic activity and solar wind conditions. J. Geophys. Res. (Space Phys. 108, 1093. doi:10.1029/2001JA009200
Daglis, I. A. (1997). “The role of magnetosphere-ionosphere coupling in magnetic storm dynamics,” in Magnetic storms, geophysical monograph series, vol. 98. Editors B. T. Tsurutani, W. D. Gonzalez, Y. Kamide, and J. K. Arballo (Washington, D.C: AGU), 107.
Daglis, I. A., Thorne, R. M., Baumjohann, W., and Orsini, S. (1999). The terrestrial ring current: origin, formation, and decay. Rev. Geophys. 37, 407–438. doi:10.1029/1999RG900009
Garcia, K. S., Merkin, V. G., and Hughes, W. J. (2010). Effects of nightside O+ outflow on magnetospheric dynamics: results of multifluid MHD modeling. J. Geophys. Res. (Space Phys. 115, A00J09. doi:10.1029/2010JA015730
Glocer, A., Tóth, G., Gombosi, T., and Welling, D. (2009). Modeling ionospheric outflows and their impact on the magnetosphere, initial results. J. Geophys. Res. (Space Phys. 114, 5216. doi:10.1029/2009JA014053
Gloeckler, G., and Hamilton, D. C. (1987). Ampte ion composition results. Phys. Scr. T18, 73–84. doi:10.1088/0031-8949/1987/t18/009
Hamilton, D. C., Gloeckler, G., Ipavich, F. M., Wilken, B., Stuedemann, W., and Kremser, G. (1988). Ring current development during the great geomagnetic storm of February 1986. J. Geophys. Res. 93, 14343–14355. doi:10.1029/JA093iA12p14343
Hoegy, W. R., Grebowsky, J., and Brace, L. H. (1991). Ionospheric ion composition from satellite measurements made during 1970–1980: altitude profiles. Adv. Space Res. 11, 173–182. doi:10.1016/0273-1177(91)90340-p
Hoffman, J. H. (1967). Composition measurements of the topside ionosphere. Science 155, 322–324. doi:10.1126/science.155.3760.322
Hoffman, J. H., Dodson, W. H., Lippincott, C. R., and Hammack, H. D. (1974). Initial ion composition results from the Isis 2 satellite. J. Geophys. Res. 79, 4246–4251. doi:10.1029/ja079i028p04246
Hoffman, J. H., Hanson, W. B., Lippincott, C. R., and Ferguson, E. E. (1973). The magnetic ion-mass spectrometer on atmosphere explorer. Radio Sci. 8, 315–322. doi:10.1029/RS008i004p00315
Hoffman, J. H. (1970). Studies of the composition of the ionosphere with a magnetic deflection mass spectrometer. Int. J. Mass Spectrom. Ion Phys. 4, 315–322. doi:10.1016/0020-7381(70)85047-1
Holmes, J. C., Johnson, C. Y., and Young, J. M. (1965). Ionospheric chemistry, 756. Space Research Conference.
Horwitz, J. L., Comfort, R. H., Richards, P. G., Chandler, M. O., Chappell, C. R., Anderson, P., et al. (1990). Plasmasphere-ionosphere coupling: 2. Ion composition measurements at plasmaspheric and ionospheric altitudes and comparison with modeling results. J. Geophys. Res. 95, 7949–7959. doi:10.1029/JA095iA06p07949
Ilie, R., Bashir, M. F., and Kronberg, E. A. (2021). “A brief review of the ring current and outstanding problems,” in Magnetospheres in the solar system. Editors R. Maggiolo, N. André, H. Hasegawa, D. T. Welling, Y. Zhang, and L. J. Paxton (Washington, D.C: AGU), 311–321. doi:10.1002/9781119815624.ch20
Ilie, R., and Liemohn, M. W. (2016). The outflow of ionospheric nitrogen ions: A possible tracer for the altitude-dependent transport and energization processes of ionospheric plasma. J. Geophys. Res. Space Phys. 121, 9250–9255. doi:10.1002/2015ja022162
Ilie, R., Liemohn, M. W., Toth, G., Yu Ganushkina, N., and Daldorff, L. K. S. (2015). Assessing the role of oxygen on ring current formation and evolution through numerical experiments. J. Geophys. Res. Space Phys. 120, 4656–4668. doi:10.1002/2015JA021157
Ilie, R., Skoug, R. M., Valek, P., Funsten, H. O., and Glocer, A. (2013). Global view of inner magnetosphere composition during storm time. J. Geophys. Res. Space Phys. 118, 7074–7084. doi:10.1002/2012ja018468
Istomin, V. G. (1961). Nitrogen ions in the upper atmosphere and the ionization of the region at night.
Kistler, L. M., Mouikis, C. G., Spence, H. E., Menz, A. M., Skoug, R. M., Funsten, H. O., et al. (2016). The source of o+ in the storm time ring current. J. Geophys. Res. Space Phys. 121, 5333–5349. doi:10.1002/2015JA022204
Kotov, D. V., Richards, P. G., Truhlík, V., Bogomaz, O. V., Shulha, M. O., Maruyama, N., et al. (2018). Coincident observations by the kharkiv is radar and ionosonde, dmsp and arase (erg) satellites, and flip model simulations: implications for the nrlmsise-00 hydrogen density, plasmasphere, and ionosphere. Geophys. Res. Lett. 45, 8062–8071. doi:10.1029/2018GL079206
Lin, M.-Y., Ilie, R., and Glocer, A. (2020). The contribution of N+ ions to earth’s polar wind. Geophys. Res. Lett. 47, e2020GL089321. doi:10.1029/2020GL089321
Liu, J., Ilie, R., Borovsky, J. E., and Liemohn, M. W. (2022). A new mechanism for early-time plasmaspheric refilling: the role of charge exchange reactions in the transport of energy and mass throughout the ring current—Plasmasphere system. J. Geophys. Res. Space Phys. 127, e2022JA030619. doi:10.1029/2022JA030619
Liu, W. L., Fu, S. Y., Zong, Q. G., Pu, Z. Y., Yang, J., and Ruan, P. (2005). Variations of N+/O+ in the ring current during magnetic storms. Geophys. Res. Lett. 32, L15102. doi:10.1029/2005gl023038
Mall, U., Christon, S., Kirsch, E., and Gloeckler, G. (2002). On the solar cycle dependence of the N+/O+ content in the magnetosphere and its relation to atomic N and O in the Earth’s exosphere. Geophys. Res. Lett. 29, 34-1–34-3. doi:10.1029/2001GL013957
Moore, T. E., Peterson, W. K., Russell, C. T., Chandler, M. O., Collier, M. R., Collin, H. L., et al. (1999). Ionospheric mass ejection in response to a CME. Geophys. Res. Lett. 26, 2339–2342. doi:10.1029/1999gl900456
Mukai, T., Hirahara, M., Machida, S., Saito, Y., Terasawa, T., and Nishida, A. (1994). Geotail observation of cold ion streams in the medium distance magnetotail lobe in the course of a substorm. Geophys. Res. Lett. 21, 1023–1026. ISSN 0094-8276. doi:10.1029/93gl02424
Nosé, M., McEntire, R. W., and Christon, S. P. (2003). Change of the plasma sheet ion composition during magnetic storm development observed by the Geotail spacecraft. J. Geophys. Res. Space Phys. 108, 1201. doi:10.1029/2002ja009660
Nosé, M., Taguchi, S., Hosokawa, K., Christon, S. P., McEntire, R. W., Moore, T. E., et al. (2005). Overwhelming O+ contribution to the plasma sheet energy density during the October 2003 superstorm: geotail/EPIC and IMAGE/LENA observations. J. Geophys. Res. Space Phys. 110. doi:10.1029/2004ja010930
Nossal, S. M., Mierkiewicz, E. J., and Roesler, F. L. (2012). Observed and modeled solar cycle variation in geocoronal hydrogen using nrlmsise-00 thermosphere conditions and the bishop analytic exosphere model. J. Geophys. Res. Space Phys. 117. doi:10.1029/2011JA017074
Peterson, W., Abe, T., Fukunishi, H., Greffen, M., Hayakawa, H., Kasahara, Y., et al. (1994). On the sources of energization of molecular ions at ionospheric altitudes. J. Geophys. Res. Space Phys. 99, 23257–23274. doi:10.1029/94ja01738
Peterson, W. K., Collin, H. L., Lennartsson, O. W., and Yau, A. W. (2006). Quiet time solar illumination effects on the fluxes and characteristic energies of ionospheric outflow. J. Geophys. Res. Space Phys. 111, A11S05. doi:10.1029/2005ja011596
Picone, J. M., Hedin, A. E., Drob, D. P., and Aikin, A. C. (2002). Nrlmsise-00 empirical model of the atmosphere: statistical comparisons and scientific issues. J. Geophys. Res. Space Phys. 107, SIA 15-21–SIA 15–16. doi:10.1029/2002JA009430
Qian, L., Burns, A., Solomon, S., Smith, A., McInerney, J., Hunt, L., et al. (2018). Temporal variability of atomic hydrogen from the mesopause to the upper thermosphere. J. Geophys. Res. Space Phys. 123, 1006–1017. doi:10.1002/2017JA024998
Ridley, A. J., Deng, Y., and Tóth, G. (2006). The global ionosphere thermosphere model. J. Atmos. Solar-Terrestrial Phys. 68, 839–864. doi:10.1016/j.jastp.2006.01.008
Schunk, R. W., and Raitt, W. J. (1980). Atomic nitrogen and oxygen ions in the daytime high-latitude F-region. J. Geophys. Res. Space Phys. 85, 1255–1272. doi:10.1029/ja085ia03p01255
Schunk, R. W., and Sojka, J. J. (1997). Global ionosphere-polar wind system during changing magnetic activity. J. Geophys. Res. 102, 11625–11651. doi:10.1029/97ja00292
Seki, K., Nagy, A., Jackman, C. M., Crary, F., Fontaine, D., Zarka, P., et al. (2015). A review of general physical and chemical processes related to plasma sources and losses for solar system magnetospheres. Space Sci. Rev. 192, 27–89. doi:10.1007/s11214-015-0170-y
Shelley, E. G., Johnson, R. G., and Sharp, R. D. (1972). Satellite observations of energetic heavy ions during a geomagnetic storm. J. Geophys. Res. 77, 6104–6110. doi:10.1029/JA077i031p06104
Solomon, S. C., Hays, P. B., and Abreu, V. J. (1988). The auroral 6300 Å emission: observations and modeling. J. Geophys. Res. Space Phys. 93, 9867–9882. doi:10.1029/JA093iA09p09867
Taylor, H. A. J., Brinton, H. C., Pharo, M. W. I., and Rahman, N. K. (1968). Thermal ions in the exosphere; Evidence of solar and geomagnetic control. J. Geophys. Res. 73, 5521–5533. doi:10.1029/ja073i017p05521
Taylor, H. A. (1971). Observed solar geomagnetic control of the ionosphere-implications for reference ionospheres. Space Res. 12, 1275–1290.
Waldrop, L., and Paxton, L. J. (2013). Lyman airglow emission: implications for atomic hydrogen geocorona variability with solar cycle. J. Geophys. Res. Space Phys. 118, 5874–5890. doi:10.1002/jgra.50496
Welling, D. T., and Liemohn, M. W. (2016). The ionospheric source of magnetospheric plasma is not a black box input for global models. J. Geophys. Res. Space Phys. 121, 5559–5565. doi:10.1002/2016ja022646
Whalen, B. A., Burrows, J. R., Yau, A. W., Budzinski, E. E., Pilon, A. M., Iwamoto, I., et al. (1990). The suprathermal ion mass spectrometer(SMS) onboard the Agebono (EXOS-D) satellite. J. geomagnetism Geoelectr. 42, 511–536. doi:10.5636/jgg.42.511
Williams, D. J., Lui, A. T. Y., McEntire, R. W., Angelopoulos, V., Jacquey, C., Christon, S. P., et al. (1994). Magnetopause encounters in the magnetotail at distances of ∼ 80 Re. Geophys. Res. Lett. 21, 3007–3010. doi:10.1029/94gl01298
Wilson, G. R., and Craven, P. D. (1998). Under what conditions will ionospheric molecular ion outflow occur? Geosp. Mass Energy Flow Results Int. Solar-Terrestrial Phys. Program 104, 85–95. doi:10.1029/GM104p0085
Winglee, R. M., Chua, D., Brittnacher, M., Parks, G. K., and Lu, G. (2002). Global impact of ionospheric outflows on the dynamics of the magnetosphere and cross-polar cap potential. J. Geophys. Res. (Space Phys. 107, 1237. doi:10.1029/2001JA000214
Yau, A., Foss, V., and Abstracts, A. H. (2019). Swarm-E (e-POP) observations of atomic N+ and molecular ions in topside ion up-flows and down-flows: occurrence characteristics and impact on magnetosphere-plasmasphere-thermosphere coupling. Geophys. Res. Abstr. 21, 140486134. EBSCOhost, search.ebscohost.com.
Yau, A. W., Abe, T., and Peterson, W. (2007). The polar wind: recent observations. J. Atmos. Solar-Terrestrial Phys. 69, 1936–1983. doi:10.1016/j.jastp.2007.08.010
Yau, A. W., and Howarth, A. (2016). Imaging thermal plasma mass and velocity analyzer. J. Geophys. Res. Space Phys. 121, 7326–7333. doi:10.1002/2016JA022699
Yau, A. W., James, H. G., Bernhardt, P. A., Cogger, L. L., Enno, G. A., Hayakawa, H., et al. (2009). The Canadian enhanced polar outflow probe (e-POP) mission. Data Sci. J. 8, S38–S44. doi:10.2481/dsj.8.s38
Yau, A. W., James, H. G., and Liu, W. (2006). The canadian enhanced polar outflow probe (e-pop) mission in ilws. Adv. Space Res. 38, 1870–1877. doi:10.1016/j.asr.2005.01.058
Keywords: ionospheric composition, magnetospheric composition, nitrogen ions, observations, heavy ions
Citation: Ilie R, Lin M-Y, Bashir MF and Majumder A (2023) A review of N+ observations in the ionosphere-magnetosphere system. Front. Astron. Space Sci. 10:1224659. doi: 10.3389/fspas.2023.1224659
Received: 18 May 2023; Accepted: 20 September 2023;
Published: 04 October 2023.
Edited by:
Thomas Earle Moore, Third Rock Research, United StatesReviewed by:
Octav Marghitu, Space Science Institute, RomaniaNaritoshi Kitamura, Nagoya University, Japan
Copyright © 2023 Ilie, Lin, Bashir and Majumder. This is an open-access article distributed under the terms of the Creative Commons Attribution License (CC BY). The use, distribution or reproduction in other forums is permitted, provided the original author(s) and the copyright owner(s) are credited and that the original publication in this journal is cited, in accordance with accepted academic practice. No use, distribution or reproduction is permitted which does not comply with these terms.
*Correspondence: Raluca Ilie, cmlsaWVAaWxsaW5vaXMuZWR1