 Biao Yang
 Yanbin Wang
94% of researchers rate our articles as excellent or good
Learn more about the work of our research integrity team to safeguard the quality of each article we publish.
Find out more
ORIGINAL RESEARCH article
Front. Astron. Space Sci. , 14 June 2023
Sec. Planetary Science
Volume 10 - 2023 | https://doi.org/10.3389/fspas.2023.1217990
This article is part of the Research Topic New Advances in Lunar and Related Planetary Studies View all 10 articles
Introduction: In the 1960s, the Apollo missions deployed seismometers on the near side of the Moon, and the obtained moonquake data enabled the seismic study of internal structure of the Moon. The lunar seismic waveforms are dominated by strong coda waves caused by scattering in the near surface, which masks the reflected and converted waves from the discontinuities inside the Moon. The Double Array Stacking method is an important technique to enhance the reflected and converted waves. However, its performance would be affected by many factors including signal to noise ratio, arrival time errors, differences in amplitude and polarity of waveforms caused by different station azimuth, and source mechanisms, thus needs to be further analyzed.
Method: In this study, we use the pseudo-spectral and finite-difference hybrid method on staggered grid to simulate wave propagation of deep moonquakes, considering near surface scattering, to analyze the influence of the above factors on the stacking results of reflected and converted phases from outer core of the Moon.
Results and discussion: Our results indicate that coda and noises would greatly reduce the stacking energy but have no significant impact on the peak position of the stacked waveforms. The arrival time errors have a significant influence on the vertical component of ScP phase and the radial component of the ScS phase, but have little influence on the transverse component of ScS phase. The difference in amplitude also leads to differences in stacking energy, but the stacking image shows good consistency in the shape. When the polarities of seismic phases are relatively consistent, the peak of the stacking energy comes from reflected phases from the core mantle boundary of the Moon. This research may be helpful to improve the detection accuracy of the internal structure of the Moon and provide a solid reference for the deployment of future seismic stations, which is of great significance for understanding the formation and evolution process of the Moon.
The Apollo missions, launched in the 1960s and 1970s, successfully deployed the first array of seismometers on extraterrestrial body. Many researches have been conducted to detect the interior structure of the Moon based on Apollo moonquake waveforms. However, the late phases are almost completely buried among long-last strong coda waves caused by endless scattering in the shallow subsurface of the Moon (Frohlich and Nakamura, 2009). The Moon has experienced strong volcanic activity and impact modification without hydraulic cementation, resulting in the accumulation of broken basalt layers and impact splashes on the shallow surface of the Moon (Blanchette Guertin et al., 2012; Zhang et al., 2022), leading to strong lunar seismic wave scattering and long duration of lunar seismic coda waves far beyond that of earthquakes, even reaching several hours (Garcia et al., 2019). The strong coda submerges the reflected and converted waves from the discontinuities inside the Moon, causing great difficulties in picking up the arrival times of lunar seismic phases. The large error in the arrival times results in insufficient constraints on the interior structures, including significant uncertainty of the lunar crust and core detection (Lognonné et al., 2003; Garcia et al., 2019). By modeling the propagation of lunar seismic waves inside the Moon model with lateral heterogeneous upper crust, several researches had reproduced the main characteristics of coda waves and estimated the velocity perturbation in the lunar regolith (Jiang et al., 2015a; Onodera et al., 2021; Zhang et al., 2022).
It is important to detect the core of the Moon (Garcia et al., 2019) thus a series of methods had been developed, such as arrival time inversion (Nakamura et al., 1974), electromagnetic sounding inversion (Hood et al., 1999), laser ranging inversion (Williams et al., 2001; Williams et al., 2014), joint inversion of Love number, average mass and moment of inertia (Khan et al., 2004; Khan and Mosegaard, 2005; Khan et al., 2006; Krorod and Kuskov, 2011; Khan et al., 2014; Matsumoto et al., 2015) and molecular dynamics simulation of Fe-S alloy composition inside the lunar core (Kuskov and Belashchenko, 2016; Morard et al., 2018). By seismic inversion based on arrival times of P and S waves, Garcia et al. (2019) proposed that the average density of the outer core is between 4–5 g/cm3, indicating a core composed of iron and a large number of light elements (with a radius of approximately 350 km). Meanwhile, the poor fitting of arrival times of S waves indicates that there is a very low S-wave velocity at the bottom of the mantle, which may indicate a partially melted layer in the lower mantle.
The Double Array Stacking method (Weber et al., 2011) has unique advantages in searching for reflected and converted seismic phases from lunar core. Before stacking, waveforms of deep moonquake clusters are filtered by polarization filter to enhance the signal of effective seismic phases. Then the waveforms after polarization filtering are enveloped to prevent potential reverse-polarity arrivals from negating each other in the stack. Weber et al. (2011) estimated a radius of inner core as 240 ± 10 km and a radius of outer core radius as 330 ± 20 km using Double Array Stacking of PcP, ScS, ScP, and PcS phases. The radius of outer core of the Moon in the VPREMOON model (Garcia et al., 2011) is also constrained by the reflected and converted waves from the core-mantle boundary. Before stacking, they analyzed the effect of enhancing amplitude by polarization filtering used in Weber et al. (2011) and amplitudes of different seismic phases. They believe that the amplitudes of PcP, ScP, and PcS phases are much weaker than those of ScSH phase. Under the interference of noises and coda, polarization filtering does not enhance the amplitude of those phases. Finally, Garcia et al. (2011) only use ScSH phase for Double Array Stacking and obtained a radius of outer core as 380 ± 40 km. Yuan (2018) developed Velocity Scanning Stacking based on previous studies (Lin et al., 2011; Weber et al., 2011), which can scan and analyze the velocities of P and S waves at different depths while stacking seismic phases, constraining the depth of the discontinuity and velocity structure of the Moon at the same time. The depths of the discontinuity are determined by multiplying the stacking results of four seismic phases under the optimal velocity structure, giving an inner core radius of 230 ± 20 km and an outer core radius of 310 ± 10 km. Besides, they believed that there is partial melting at a depth of 1300 km.
In the above research (Garcia et al., 2011; Weber et al., 2011; Yuan. 2018), there are differences in the data selection, data processing and seismic phase selection. In data selection, Weber et al. (2011) and Yuan (2018) choose the stacking waveforms of deep moonquake clusters while Garcia et al. (2011) choose the original waveforms of moonquakes. In data processing, Weber et al. (2011) and Yuan (2018) use polarization filtering to enhance the amplitude of seismic phases and envelope to prevent potential influence of opposite-polarity arrivals while Garcia et al. (2011) question the effectiveness of polarization filtering, only performing broadband filtering. In seismic phase selection, Weber et al. (2011) and Yuan (2018) choose ScS, ScP, PcS, and PcP phases for stacking while Garcia et al. (2011) believe that the stacking results of weak seismic phases are unreliable, so only choose ScSH phase for stacking.
The radius of outer core of the Moon obtained by Weber et al. (2011) and Garcia (2011) differs greatly, but it isn’t yet clear which one is more reliable. Therefore, in-depth analysis and comparative research are needed to confirm the effectiveness of polarization filtering and envelope and analyze the performance of different seismic phases, to improve the reliability of the detection results. Besides data processing and seismic phase selection, several other factors may affect the stacking results in Apollo data and need to be considered. Significant errors in picking first arrivals, masked by noises and coda, result in significant uncertainty in source location. Although the Apollo observation station formed a huge triangular network, the limited instrument sensitivity, dispersive moonquakes and unconfirmed focal mechanism, make it difficult to study the interior structure of the Moon (Zhang et al., 2021). Therefore, evaluating the reliability and accuracy of Double Array Stacking through numerical simulation tests is of great significance for reducing the uncertainty of current models and conducting future moonquake data analysis.
In this study, we use the pseudo-spectral and finite-difference hybrid method based on staggered grid (Wang et al., 2011; Jiang et al., 2015b) and Moon model (Wang et al., 2013; Jiang et al., 2015a) with velocity perturbation in upper crust (Jiang et al., 2015a) to simulate the waveforms of deep moonquakes with scattering. We first analyze the influence of polarization filtering and envelope on the stacking results of waveforms with strong noises and coda by stacking the simulated waveforms after polarization filtering and envelope processing. Then, we analyze the influence of coda and noises, arrival time errors, and differences in amplitude and polarity of waveforms caused by different station azimuth and source mechanisms on the results of stacking. Finally, we explore the reliability of results of stacking using reflected and converted phases to detect lunar core under these factors and discuss how to reduce the influence and improve the reliability and accuracy of stacking.
We use the pseudo-spectral and finite-difference hybrid method (Wang et al., 2011; Jiang et al., 2015b) to model seismic wave propagation of deep moonquakes with strong scattering effects in the upper crust. The model is a two-dimensional great circle cross-section of the Moon passing through the source and station defined in a two-dimensional cylindrical coordinate system, extending from the surface to a depth of 1650 km radially, and from 0° to 180° laterally. The source of moonquake is located close to the edge of the model (r = 867 km, θ = 5°), and the core-mantle boundary is included in the model allowing the reflection and conversion of seismic waves from the core mantle boundary can be calculated and recorded by the station. We add velocity perturbation in the upper crust of the Moon (Jiang et al., 2015a) to calculate the strong scattering of lunar seismic waves.
The peak frequency of the Apollo moonquake data is 0.45 Hz and the design frequency band of seismometer for the Chang’e-7 mission is 120 s to 100 Hz (Zhang et al., 2021). Under this circumstance, it is of great significance to explore the variation of amplitudes of reflected and converted seismic phases from lunar core-mantle boundary at various frequencies for the selection of frequency bands in future research of lunar core detection. Therefore, we adopted 2 kinds of Herrmann pseudo δ function (Herrmann, 1979) as the source time function with the width of 3.0 s and 5.0 s, respectively.
The model is discretized into 1650 grid points in the r direction, 4096 and 2048 grid points in the θ direction for source time function of 3.0 s and 5.0 s, respectively. The maximum grid spacing on the surface in θ direction is 1.33 km and 2.66 km for the two discretized models, and the grid spacing in r direction is fixed to 1.0 km. We adopt the velocity structure model used by Jiang et al. (2015a) with a minimum velocity of 1.8 km/s for S-waves in the crust, corresponding to the minimum wavelengths of 5.4 km and 9.0 km for source time function of 3.0 s and 5.0 s, respectively. The time interval is determined as 0.015 s from the stability condition defined by the minimum grid interval and the maximum P-wave velocity in the whole model. We calculate for 80,000 time steps, corresponding to a propagation time of 1200 s of seismic wave in Moon model. The moment tensor components of the source are Mrr = 0, M θθ = 0, M rθ = M θr = 1 for the focal mechanism of deep moonquake, corresponding to a horizontal sliding fault (Wang et al., 2013).
Since our modeling are performed in a 2-D cross-section of the Moon, the geometric spreading and source radiation of synthetic waveforms slightly differ from waveforms of deep moonquake observation. Our synthetic waveforms are corrected to compensate for the differences between 2-D and 3-D geometric spreading and 2-D line and 3-D point source radiation (Helmerger and Vidalee, 1988; Wang et al., 2001; Wang et al., 2013):
where
Intrinsic attenuation of Moon medium causes waveform decaying during propagation. The anelastic attenuation is quantified by the attenuation coefficient (Graves et al., 1996), which can be expressed as:
where
The seismic wavefield is generated by the interference and superposition of different types of vibrations with different polarization characteristics. Considering strong scattering of lunar seismic wave, it is necessary to use the nonlinear filtering technique to suppress coda and noises to obtain waveforms with clearer seismic phases. White (1964) proposed a time-averaged product of vertical and radial components as a filter and referred to it as the Motion Product Detector (MPD):
where j is the time step, n determines the length of the average window, and the output (OZ, OR) after filtering is the product of M and Z, M, and R, respectively:
White (1964) theoretically analyzed the effects of MPD and found it can effectively enhance the amplitudes of body waves and suppress surface waves, scattered waves and noises.Shimsoni and Smith (1964) applied MPD to actual data and verified its effectiveness on seismic phase enhancement. For the first time, Jarosch (1977) used MPD in processing seismic data of the Apollo artificial impacts, picked up the arrival time of body wave and finally obtained the shallow structure of the subsurface of the Moon. Weber et al. (2011) used MPD to filter moonquake waveforms, which were used then for Double Array Stacking to obtain the radius of lunar core. For horizontally polarized shear waves (SH), the energy is expected to only appear on the transverse component (T). To process waveforms on T component, Weber et al. (2011) proposed the following formula:
where j is the time step, n determines the length of the average window, and the output (OT) after filtering is the product of T.
Since the 1960s, seismic array technology has brought new impetus to seismology. In addition to improving signal-to-noise ratio, seismic array technology can study the fine structure of the Earth’s interior (Kárason and van der Hilst, 2001; Rost and Thomas, 2002), including regional fault and mantle (Arlit et al., 1999; Castle and Creager, 1999; Krüger et al., 2001; Ritter et al., 2001), and the heterogeneity of the outer and inner core (Vidale and Earle, 2000;Rost and Revenaugh, 2001; Thomas et al., 2002). Migration is a method originally used in geophysics exploration. In global seismology, migration is used to image mantle heterogeneity in many regions (Lynnes and Lay, 1989; Revenaugh, 1995; Boston and Rondenay, 2002). In previous studies, migration is used for teleseismic arrays to study the discontinuity in the Earth’s interior (Neal and Pavlis, 1999; Neal and Pavlis, 2001). The specific procedure is to shift the waveforms to the same zero point according to the theoretical arrival times of reflected seismic phases and stack these waveforms. The depth of discontinuity in the velocity model, which corresponds to the strongest amplitude of the stacked waveforms, is considered as the depth of the discontinuity in the Earth’s interior.
Weber et al. (2011) extended this method to Double Array Stacking method and applied it to the processing of observation data from different moonquakes and stations. If the estimated radius in the velocity model deviates from the given core radius of the Moon, the shifted waveforms would be chaotic and the stacked amplitudes would be tiny. Otherwise, waveforms after stacking would maintain the original waveforms with a relatively large amplitude. Various time windows corresponding to different reflected and converted phases are selected for stacking, and then the energy of the waveforms within the window are calculated by:
where E and N represent the average energy of the waveform within the window and the window length, respectively. Amp(i) represents the amplitude at point i and dt is the time step. Before stacking, waveforms will be normalized. In our study, waveforms in different windows are normalized separately to ensure consistent contribution of each moonquake waveform to the stacking results.
We use two Herrmann function with width of 3.0 s and 5.0 s as the source time function and a lateral heterogeneous Moon model to simulate the propagation of seismic wave from deep moonquake. Figures 1A, C, E show waveforms on vertical (V), radial (R), and transverse (T) components calculated with model without velocity perturbation in the upper crust. In the case of high value of Q in the Moon, ScP and sScP phases on V component and ScS and sScS phases on R and T components are very obvious. Figures 1B, D, F show scattered waveforms on V, R, and T components. Compared with Figures 1A, C, E amplitudes of the seismic phases reflected and converted from core mantle boundary are weaker and strong coda appear.
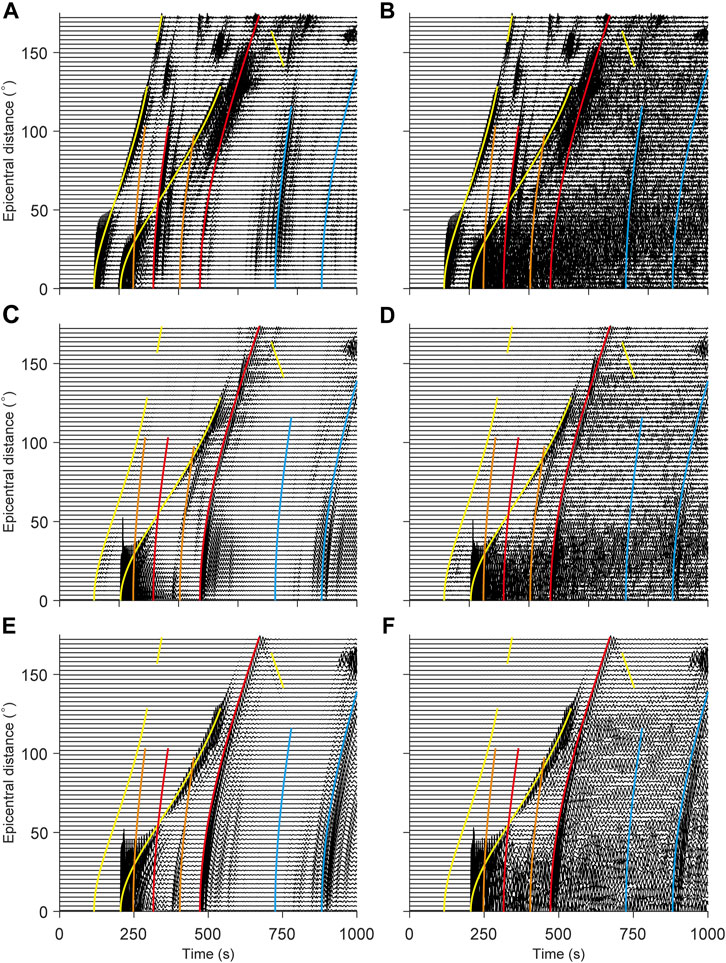
FIGURE 1. Synthetic waveforms of moonquakes with source time of 5 s (A, C, E) are the V, R, and T components of the moonquake waveforms without scattering. (B, D, F) are the V, R, and T components of the scattered moonquake waveforms. The yellow lines represent direct P and S waves, the orange lines represent PcP and PcS waves, the red lines represent ScP and ScS waves, and the blue lines represent sScP and sScS waves, respectively.
However, the in-phase axes of ScP and sScP phases on V component, as well as ScS and sScS phases on R and T components, can still be seen, indicating that the scattering waves affect more on picking PcP and PcS seismic phases, less on picking ScS, ScP, sScS, and sScP seismic phases. Therefore, it can be predicted that for Double Array Stacking of Apollo moonquake waveforms, these seismic phases (ScS, ScP, sScS, and sScP) are more reliable than that of PcP and PcS.
The amplitude of seismic phases of the synthetic waveforms at high frequency (source time function of 3 s, Supplementary Figure S1) is relatively weaker than that at low frequency (source time of 5 s, Figure 1). ScP, ScS, sScP, and sScS seismic phases are submerged in coda at high frequency. The most sensitive detection frequency of the Apollo seismometer in peak mode is 0.45 Hz. After processing (Garcia et al., 2011), frequency band of Apollo waveforms is broadened to 0.3–0.9 Hz, higher than that in our modeling. No doubt that seismic phases in Apollo data are masked by the coda and noises. Garcia et al. (2011) found that polarization filtering will enhance noises rather than seismic phases in Apollo data and the energy peak of stacking results of PcP, ScP, and PcS phases comes from scattered waves and noises rather than seismic phases.
Therefore, they argued that the method of combining results of four seismic phases (Weber et al., 2011; Yuan, 2018) to estimate the radius of lunar core is unreliable. Therefore, it is important to analyze the reliability of stacking results of weak seismic phases. In our modeling, amplitudes of PcP and PcS phases are weaker than that of ScP and ScS. Seismic phases with different amplitudes are used to analyze the reliability of stacking.
In order to eliminate the influence of reverse polarity of seismic phases, Weber et al. (2011) conducted Hilbert transform on the polarized waveforms and took the absolute value to obtain the envelopes. In order to verify the direct impact of the two operations on synthetic waveforms, we perform the same polarization filtering (time window of 2.4 s) on the simulated scattered waveforms (source time of 5 s) and take the envelopes.
Figures 2A, C, E show the scattered waveforms after polarization filtering on V, R, and T components. Compared to the original waveforms (Figures 1B, D, F), the seismic phases of the polarized waveforms are more prominent, especially on T component. After polarization filtering, the in-phase axes of the three seismic phases (S, ScS, and sScS) are very obvious. Figures 2B, D, F are envelopes of polarized waveforms, which show more obvious in-phase axis of the seismic phase.
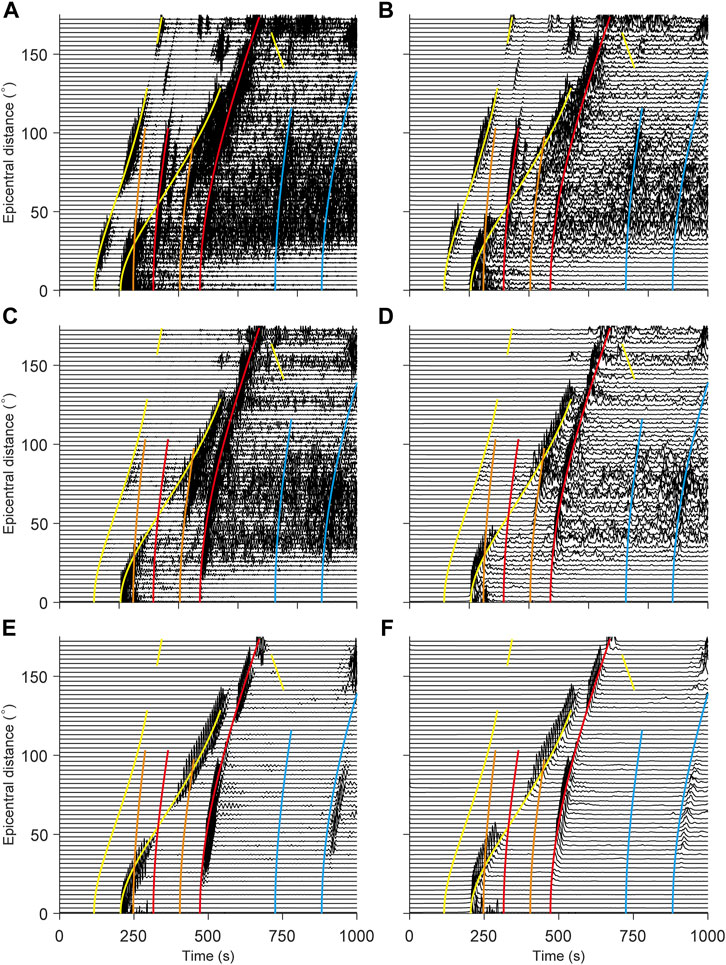
FIGURE 2. Scattering waveforms after polorization filtering (A, C, E) and its envelopes (B, D, F). The colored lines show travel time curves of seismic phases as indicated in Figure 1.
As shown in Figure 2, the in-phase axes of four seismic phases (ScS, ScP, sScS, and sScP) are the most obvious and other phases are masked by coda. There are stronger coda and noises in Apollo moonquake observation. Therefore, Garcia et al. (2011) believe polarization filtering will enhance the amplitude of noises rather than that of seismic phases used in the processing of Apollo seismic data. To analyze the effect of polarization filtering on scattered waveforms with strong noises, we added Gaussian noises (SNR = 10) to synthetic moonquake waveforms. Then we align ScS and ScP phases by their arrival times and select waveforms within 20 s time window before and after arrivals of seismic phases (i.e., with a window of 40 s).
Figure 3 shows scattered waveforms with noises, waveforms after polarization filtering and their envelopes on R component. ScS seismic phases with strong amplitudes (Figure 3A), whose in-phase axis are still obvious, are less affected by noises, while ScP seismic phases with weak amplitudes (Figure 3D) are submerged in noises. However, polarization filtering enhances the amplitudes of ScP phases and restore an obvious in-phase axis (Figure 3E). In conclusion, polarization filtering can suppress scattered waves and noises and enhance amplitudes of seismic phases, which is suitable to process the scattered and noisy data before stacking.
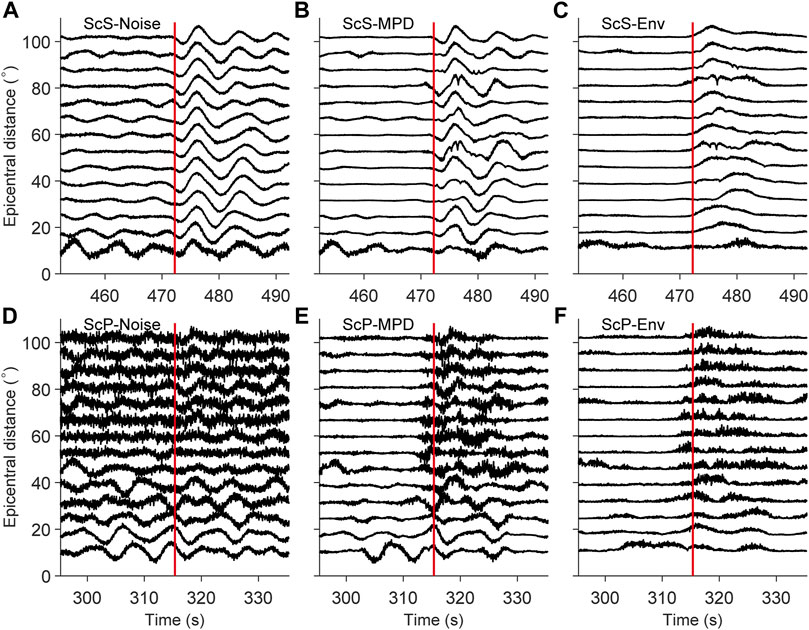
FIGURE 3. R component of scattering waveforms adding radom noises (A, D), and waveforms after polorized filtering (B, E) and their envelopes (C, F). (A–C) are results for ScS, and (D–F) are those for ScP. The red lines represent in-phase axes after alignment.
Weber et al. (2011) synthesized the stacking results of four seismic phases (PcP, PcS, ScP, and ScS) to estimate the radius of the lunar core. According to the analysis of simulated moonquake waveforms, the in-phase axes of PcP and PcS phases are not as clear as that of ScP and ScS phases. However, the in-phase axes of sScP and sScS phases can be seen in the waveforms, which means inconsistent reliability of seismic phases on Double Array Stacking and requires further analysis.
We picked up waveforms of 8 seismic phases reflected and converted from lunar core by their arrival times (i.e., PcP, PcS, ScP, ScS, sPcP, sPcS, sScP, and sScS). Besides, the width of time window also affects the stacking results. Stacking results of short windows are less affected by scattered waveforms, but may not contain the complete waveform of seismic phases, while stacking results of long windows will be affected by the scattered waveforms and other seismic phases. Therefore, we choose four time window lengths (5 s, 10 s, 15 s, and 20 s) for each seismic phase stacking to find the appropriate window length. Figures 4, 5 show the stacking results of waveforms without scattering of PcP, PcS, ScP, and ScS phases and sPcP, sPcS, sScP, and sScS phases, respectively.
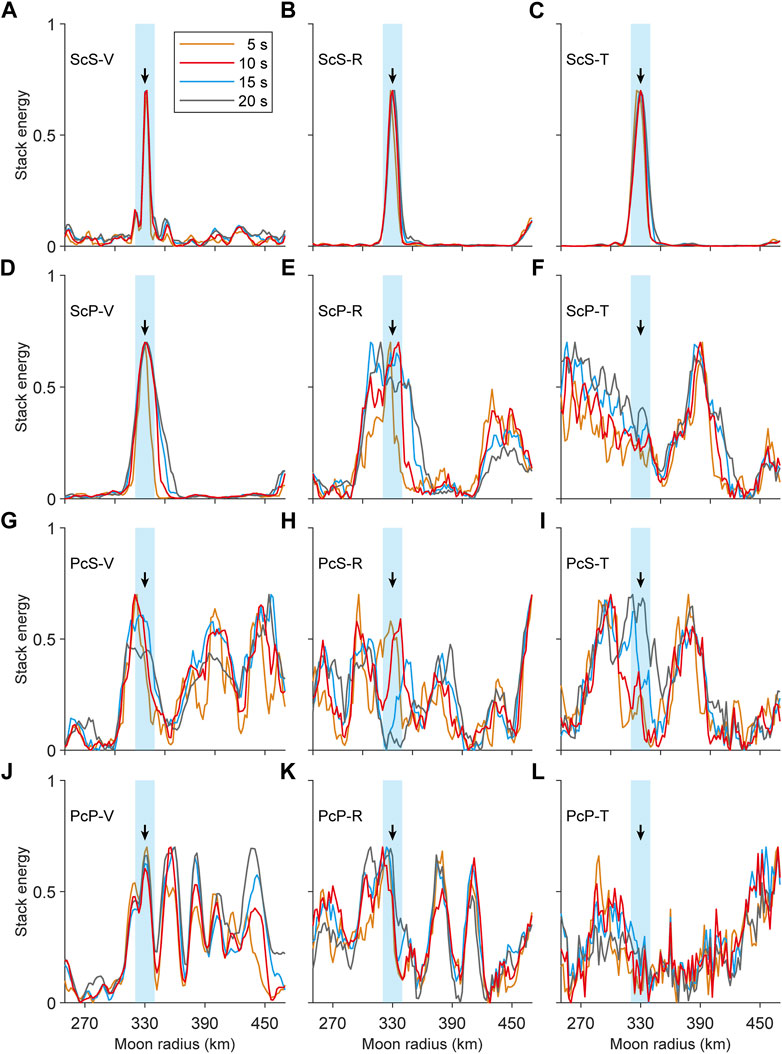
FIGURE 4. Array stacking results of PcP (J–L), PcS (G–I), ScP (D–F) and ScS (A–C) phases. The black arrows represent the outer core radius (330 km) in the model, and the light blue strips represent an error range of 10 km. The four colored curves represent the stacking results of different time windows.
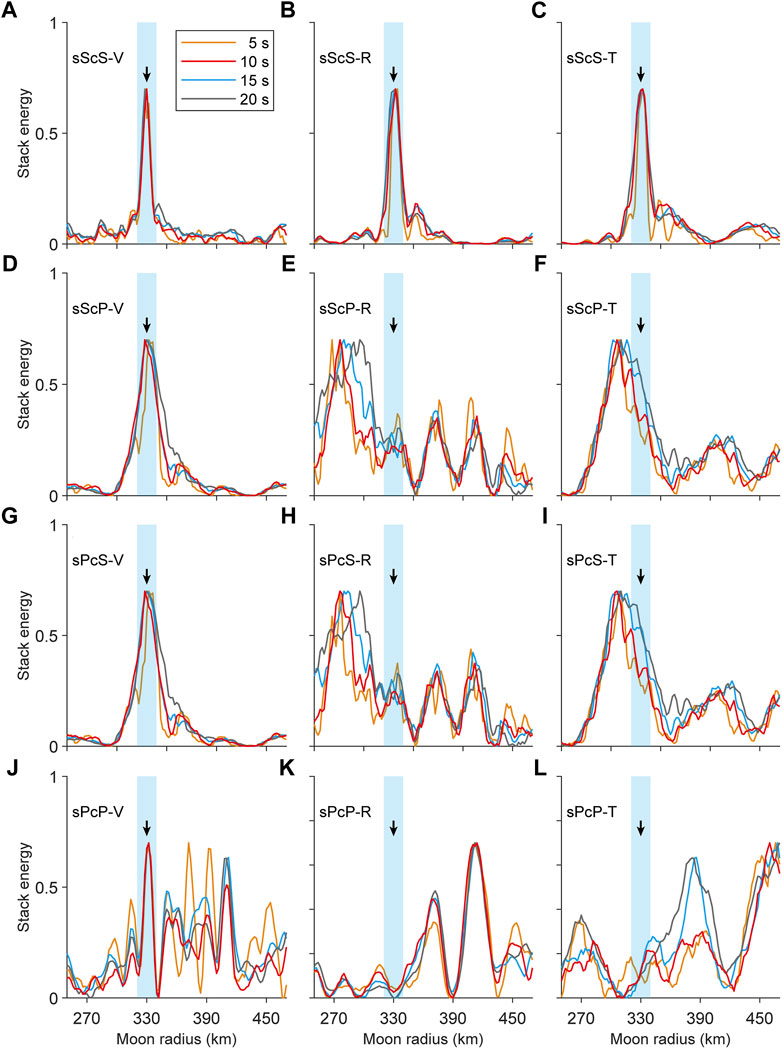
FIGURE 5. Array stacking results of sPcP (J–L), sPcS (G–I), sScP (D–F) and sScS (A–C) phases. The black arrows represent the outer core radius in the model (330 km), and the light blue strips represent an error range of 10 km. The four colored curves represent the stacking results of different time windows.
The peaks of the stacking results of PcP and sPcP phases on V component (Figures 4J, 5J) are relatively stable and doesn’t change with the time window while peaks on T component (Figure 4I) change significantly, indicating that energy on V component comes from the seismic phases and energy on T component mainly comes from scattered waves and noises. However, energies of PcP and sPcP phases on V component appear multiple peaks (Figures 4J, 5J), with one peak at 330 km, indicating that PcP and sPcP phases are mixed with other seismic phases. Multiple energy peaks make PcP and sPcP phases not suitable for estimating the core radius. The energy peak of PcS and sPcS phases on R and T components changes with window length, indicating strong interference from scattered waves, and noises. Although peak of PcS on V component (Figure 4G) is stable but deviated from 330 km. Travel times of sPcS and sScP phases are very close, so the peak (Figure 5G) at 330 km in stacking results of sPcS on V component is from sScP phases.
The energy peak of ScP and sScP phases on V component (Figures 4D, 5D) is clear at 330 km but becomes broad as the length of window increases. Although energy peak of ScP on R component is also at around 330 km but the energy peak on V component is more stable than that on R component (Figure 4E), because the amplitude of ScP on V component is stronger. The ScS and sScS phases are the best and most suitable for estimating the radius of lunar core. The energy peaks of ScS and sScS on three components are at 330 km with narrow width. Compared to stacking energy of ScS phase, stacking energy of sScS phase appears several secondary peaks, corresponding to other seismic phases before and after the main seismic phase.
In summary, the stacking energy of P-wave seismic phases on V component (PcP, sPcP, ScP, and sScP) and of the S-wave seismic phases (PcS, sPcS, ScS, and sScS) on T component appear peaks at core radius. The stronger the amplitudes of seismic phases, the weaker the interference from scattered waves, noises and other seismic phases, and the narrower the energy peak is. Due to the strong interference from scattered waves and other seismic phases, four seismic phases (PcP, sPcP, PcS, and sPcS) aren’t suitable for Double Array Stacking. Meanwhile, the other four seismic phases (ScS, sScS, ScP, and sScP) are suitable for estimating the lunar core radius.
To analyze the influence of scattered waves and noises, polarization filtering and envelope on stacking results, we compare the results of ScP and sScP phases on V component and ScS and sScS phases on R component. Figure 6 shows the comparison of stacking results after normalization. The purple, red, blue, and gray solid lines represent the stacking results of waveforms without scattering, waveforms with scattered waves and noises, waveforms after polarization filtering, and their envelopes, respectively. It can be seen that coda and noises directly reduce the energy but the position of peaks is consistent with the stacking results of waveforms without scattering. In addition, polarization filtering effectively suppresses secondary peaks in stacking results of ScP, sScP, and sScS phases, which is most obvious in stacking of sScP and sScS phases. However, compared with other factors, envelope broadens and shifts the peaks in the stacking results and even produces false peaks. It will be more obvious after normalization separately (Supplementary Figure S2). Broadened peaks can be attributed to lower main frequency of waveforms reduced by envelope while false peaks can be attributed to the loss of phase information, indicating that envelopes aren’t suitable for estimation of the core radius.
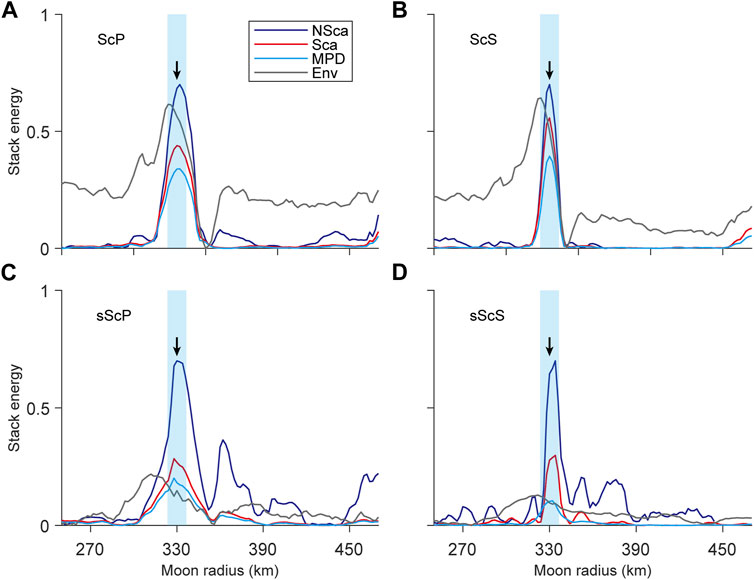
FIGURE 6. Comparison of four stacking results of ScP (A), ScS (B), sScP (C) and sScS (D) phases after normalization. Purple, red, blue, and gray lines represent the stacking results of waveforms without scattering, with scattering and noises, after polarization filtering and their envelopes, respectively. The black arrows represent the outer core radius in the model (330 km), and the light blue strips represent an error range of 10 km.
The arrivals of seismic phases in synthetic waveforms are in good agreement with the theoretical travel time curves. While in observations, there are arrival time errors due to source parameter error, structure difference between Moon model and actual Moon and errors in seismic phase picking caused by coda and noises. Because we align the waveforms by theoretical travel time curves before stacking, arrival time errors will definitely have a significant impact on the stacking results, so it is necessary to analyze the performance of stacking results of different seismic phases with different degrees of arrival time errors. We generate 4 groups of normal random numbers with a standard deviation of 1, 2, 3, and 4 s and add them into theoretical travel time curves. We use the travel time curves with errors to cut waveform windows of two seismic phases (ScP and ScS) and analyze their stacking results.
Figure 7 shows the stacking results of ScP phases on V component, ScS phases on R and T components. It can be seen that arrival time errors obviously affect the stacking results of ScP phases. As shown in Figure 7D, the peak deviate from 330 km, the core radius in the model when standard deviation of arrival time error is 2 s while the peaks in stacking results of ScS phase on R and T components are still consistent with core radius in the model (Figures 7E, F). When the arrival time error is larger (σ = 3 s, 4 s), ScP phase stacking can’t obtain ideal results. Multiple peaks appear and deviate from core radius (330 km) in the model. At the same time, stacking results of ScS phase on R component become unreliable, showing peak deviation and multiple peaks. It is worth noting that the stacking results of the ScSH phase on T component are minimally affected by arrival time errors and can obtain the core radius of the Moon even when the arrival time error is large, which can be attributed to the lack of interference from the P waves on T component.
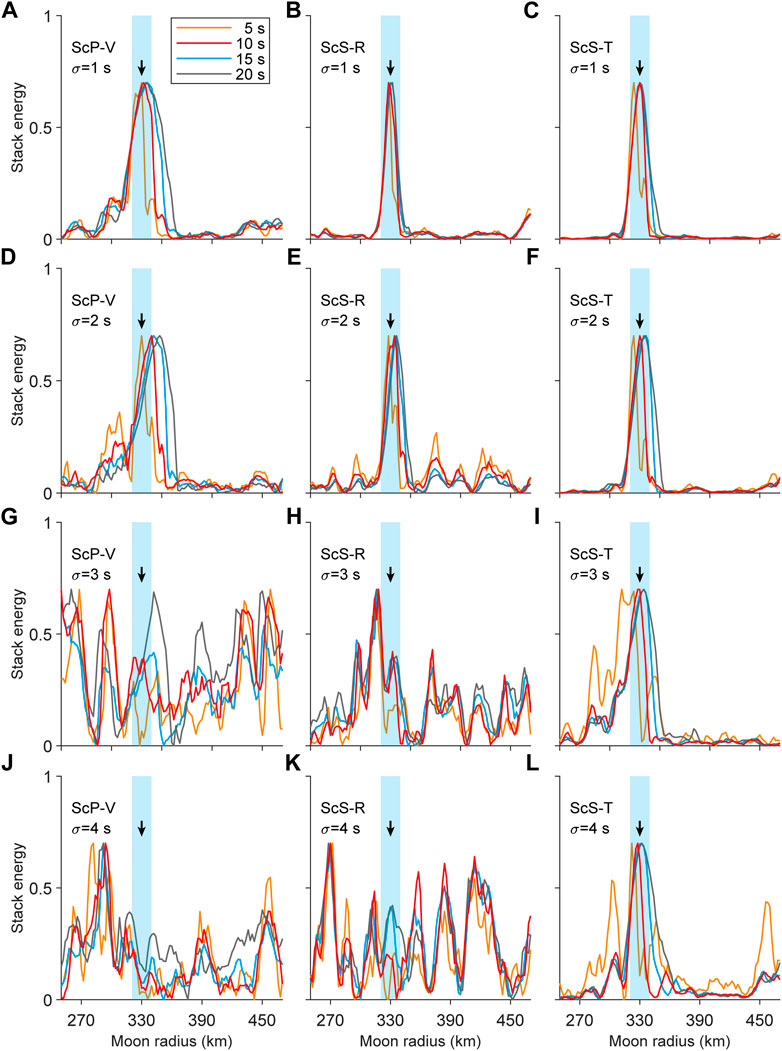
FIGURE 7. Stacking results of ScP phases on V components (A, D, G, J) and ScS phases on R (B, E, H, K) and T (C, F, I, L) components with random arrival time errors with standard deviation of 1, 2, 3, and 4 s, respectively. The black arrows represent the outer core radius in the model (330 km), and the light blue strips represent an error range of 10 km. The four colored curves represent the stacking results of different time windows.
From our simulation tests, it can be seen that ScS phase on T component is the best for Double Array Stacking, superior to ScS phase on R component and ScP phase on V component. For existing Apollo moonquake data, the inspiration is that we can improve the reliability and accuracy of results of Double Array Stacking by optimizing P and S wave picking, accuracy of source location, and eliminating data with significant arrival time errors. For moonquake observation data with better signal-to-noise ratio and wider frequency band in the future, we can use cross-correlation to reduce the impact of arrival time errors. We conducted a simple test on the effect of cross-correlation using synthetic waveforms. Before stacking, we align the waveforms based on time shifts calculated from cross-correlation. The stacking results of ScS phases on R component (Figures 8A–C) and T component (Figures 8B–D) are improved obviously, showing the effectiveness of cross-correlation.
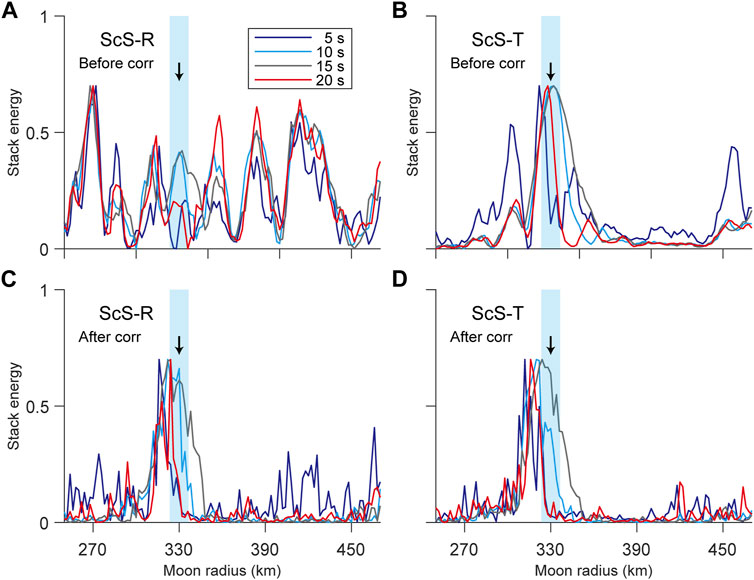
FIGURE 8. The stacking results of ScS phases on R and T components with arrival time errors of standard deviation of 4 s (A, B) before cross-correlation alignment (C, D) after cross-correlation alignment. The black arrows represent the outer core radius in the model (330 km), and the light blue strips represent an error range of 10 km. The four colored curves represent the stacking results of different time windows.
The focal mechanisms of moonquakes used for Double Array Stacking are unknown, the distribution of sources and stations is relatively scattered, and the stations aren’t high-density arrays. These factors can lead to inconsistent polarity and amplitude of seismic phases in different observed moonquake waveforms. In order to analyze the influence of inconsistent amplitude and polarity on Double Array Stacking, we need synthetic waveforms with multiple focal mechanisms. In this study, we use a great circle cross-section (Figure 9), passing through stations and seismic sources, as the two-dimensional model. The projection of moment tensor of a point source of moonquakes from spherical (R, Θ, and Φ) to a line source in cylindrical (r, θ, and z) coordinates (Wang et al., 2014) can be given as:
where Mrr, Mθθ, Mrθ, Mzθ, Mrz, Mzz are moment tensors for a line source in the cylindrical coordinate systems while MRR, MΘΘ, MRΘ, MRΦ, MΦΦ, MΘΦ are moment tensors for a point source in the spherical coordinate system, respectively. Transformation of source mechanism is related with azimuth α, which means that different source mechanisms and azimuths in the spherical coordinate system exhibit different source mechanisms in the cylindrical coordinate system.
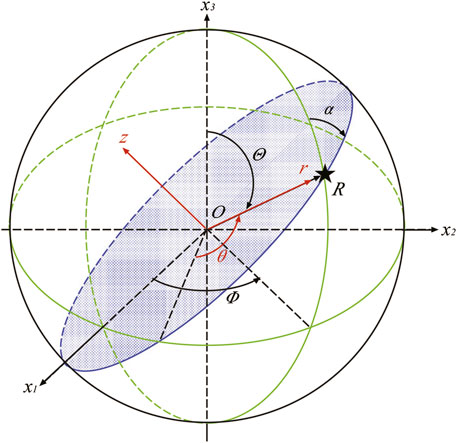
FIGURE 9. Coordinate transformation from the spherical coordinate system (R, Θ, and Φ) to the cylindrical coordinate system (r, θ, and z) (Wang et al., 2014). The blue shaded plane is the two-dimensional lunar model we used, which is a greta circle plane passing through the source and station. α is the azimuth of the source-station path at the epicenter.
We simulate several moonquakes of different focal mechanisms in cylindrical coordinate systems (Table 1), and discuss performance of their stacking results. There are significant differences in the waveforms of moonquakes of different focal mechanisms. In some moonquakes, reflected and converted phases are obvious, while in other moonquakes, ScP and ScS phases are weak and masked by coda. Even after polarization filtering, those seismic phases can’t be clearly seen.

TABLE 1. The moment tensors of simulated moonquakes.
In order to analyze the influence from the difference of seismic phase amplitudes, we stack four phases (ScP, ScS, sScP, and sScS) of these four moonquakes, separately. Figure 10 shows the comparison of stacking images after separate normalization. It can be seen that the variation of amplitudes directly affects the energy of stacking results, but positions of the peaks are still consistent. After normalization separately, the stacking energy images of waveforms of different focal mechanism almost overlap (Supplementary Figure S3), indicating that there is little influence of amplitude variation of seismic phases on lunar core estimation.
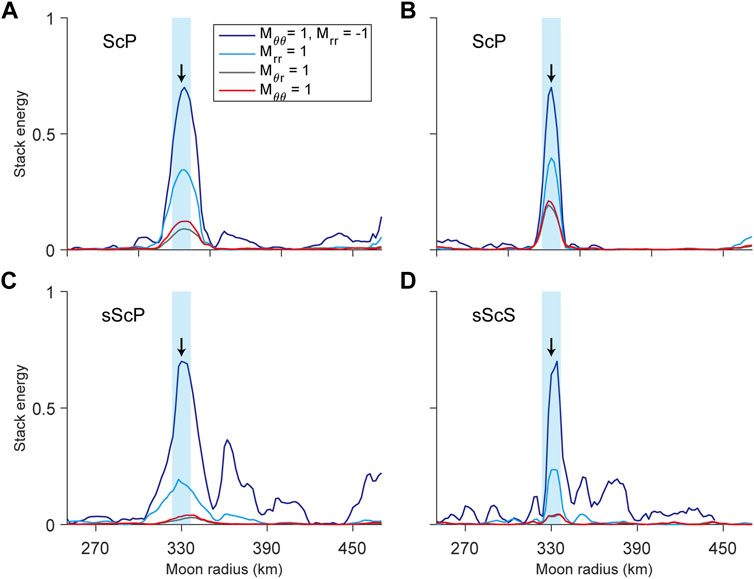
FIGURE 10. Comparison of stacking results of wavefroms of four moonquakes with different focal mechanisms [ScP (A), ScS (A), sScP (C) and sScS (D) phases]. Purple, red, blue, and gray lines represent the stakcing results of the four focal mechanisms in Table 1 without normalization, respectively. The black arrows represent the outer core radius in the model (330 km), and the light blue strips represent an error range of 10 km.
The difference in focal mechanisms and azimuths not only affects the amplitude of waveforms, but also affects the polarity of seismic phases. Stacking waveforms with reverse polarity will reduce the amplitude of seismic phases reflected and converted from core, leaving energy of noises and scattered waves behind. Weber et al. (2011) used envelope to prevent potential influence of waveforms with reverse polarity. However, our stacking tests show envelopes aren’t suitable for stacking. Due to the strong coda and noises, it is difficult to analyze the polarity of the seismic phases from core. Therefore, it is necessary to analyze the stacking results of waveforms with different proportion of reverse polarity to show the effects of polarity variation on stacking.
We linearly stack the waveforms of two different source mechanisms (Mθθ = 1, Mrr = 1) to obtain enough waveforms of different focal mechanisms, and control the proportion of waveforms with opposite polarity:
where
As shown in Figure 11, stacking results of ScS phases vary when the portion factor (α) changes. When the proportion of waveforms with reverse polarity reaches 50%, the energy of the stacking waveforms is weak with peaks come from noises and scattered waves. When α is around 31%–33%, the stacking energy is several times stronger than the energy when α is 50%. The peak corresponds to the radius of the lunar core, while the local peaks come from scattered waves and noises. When α is less than 30%, the stacking energy is very strong, and the peak is located near 330 km, the given radius of the core. If the stacking results of Apollo data present strong energy and obvious peak, it indicates that they can be used to obtain the radius of the lunar core. Conversely, it indicates that proportion of waveforms with reverse polarity is high so the stacking results are unreliable.
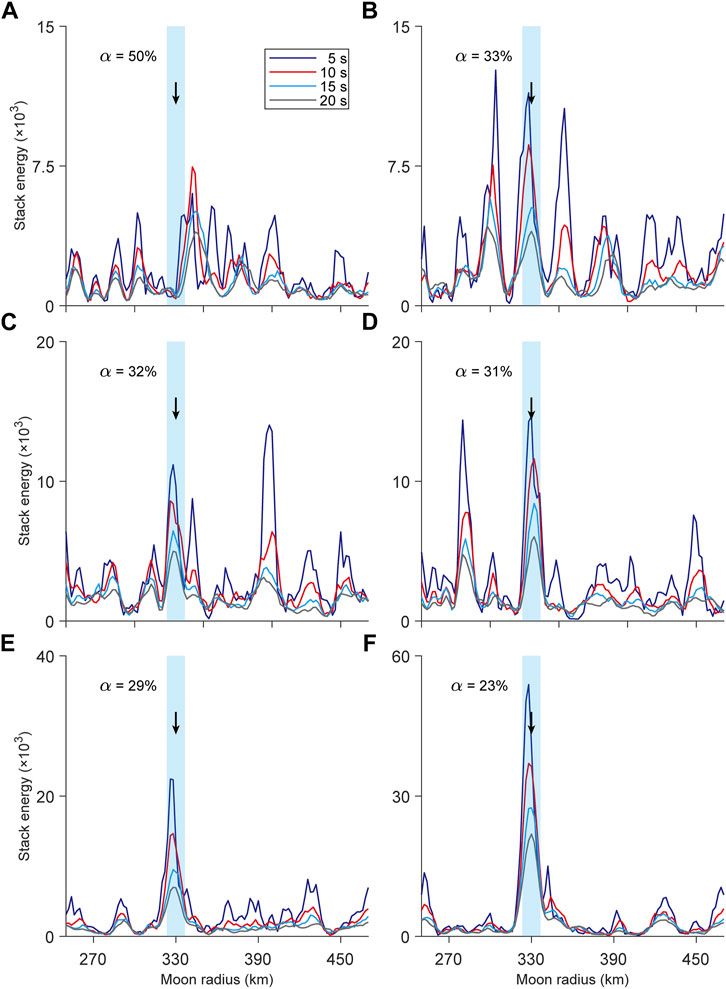
FIGURE 11. The stacking results of the waveforms of different α [50% (A), 33% (B), 32% (C), 31% (D), 29% (E), 23% (F)]. The black arrows represent the outer core radius in the model (330 km), and the light blue strips represent an error range of 10 km. The four colored curves represent the stacking results of different time windows.
We modeled the propagation of P-SV and SH waves in the Moon and calculated moonquake waveforms with major frequencies of 0.2 and 0.3 Hz. By comparison, it was found that the relative amplitude of the reflected phases from core mantle boundary in low frequency are stronger and therefore are more suitable for studying the radius of lunar core. After polarization filtering, the reflection phases are more prominent, especially for ScS and sScS phases on T component. Envelopes with lower frequency also enhance the events but reduce the sensitivity of the estimated core size.
Through stacking tests of multiple phases, it is found that without other interference factors, the stacking results on V component of P-wave phases (PcP, sPcP, ScP, and sScP) and T component of S-wave phases (PcS, sPcS, ScS, and sScS) can obtain core radius in the model correctly. The amplitudes of ScS, sScS, ScP, and sScP phases are stronger so their stacking results are less affected by coda and noises and obtain more accurate core radius.
By comparing the stacking results of waveforms without scattering, waveforms with scattering and noises, and waveforms after polarization filtering and their envelopes, it is found that coda and noises affect the stacking energy but don’t change the energy peak position, therefore don’t affect obtaining radius of the core. After polarization filtering, secondary peaks are suppressed which is beneficial for estimating radius of the lunar core. However, false peaks appear in the stacking results of envelopes, which can be attributed to loss of the information of seismic phase.
After considering arrival time errors, there is a significant difference in the reliability of stacking results of different seismic phases, with ScSH phases being the most reliable, indicating that the analysis of moonquake waveforms should be based on the results of ScSH phases. In the future, the analysis and collection of moonquake data should consider how to reduce arrival time errors such as deploying instruments underground to reduce the impact of strong scattering in the regolith.
By comparing the stacking results of waveforms from different focal mechanisms, we analyze the influence of differences in amplitude and polarity of waveforms caused by different station azimuths and focal mechanisms. The difference of amplitude of seismic phases only affects the energy of the stacking results but doesn’t affect their morphology obviously, so the estimation of the core radius isn’t much affected. When the proportion of seismic phases with reverse polarity involved in stacking is less than 30%, the peak can directly reflect the core radius of the Moon.
In this study, we clarify the influences of scattered waves, noises, arrival time errors, variation of amplitude, and polarity of waveforms on the identification of lunar core through numerical modeling of moonquake waveforms with scattering. This study confirms the feasibility of the Double Array Stacking method, and the enhancement on seismic phases and their stacking results of polarization filtering, and finds that the envelopes (Weber et al., 2011; Yuan, 2018) aren’t suitable for studying the radius of the lunar core. Results of this study may provide an important reference for subsequent data mining of moonquakes, and help to study the depth of interior discontinuities of the Moon and other planets in the future.
The datasets presented in this study can be found in online repositories. The names of the repository/repositories and accession number(s) can be found in the article/Supplementary Material.
BY and YW contributed to conception and design of the study. BY performed numerical modeling and the statistical analysis. BY wrote the first draft of the manuscript. All authors contributed to the article and approved the submitted version.
This work has been supported by the National Natural Science Foundation of China (Grant No. 41930103).
The authors declare that the research was conducted in the absence of any commercial or financial relationships that could be construed as a potential conflict of interest.
All claims expressed in this article are solely those of the authors and do not necessarily represent those of their affiliated organizations, or those of the publisher, the editors and the reviewers. Any product that may be evaluated in this article, or claim that may be made by its manufacturer, is not guaranteed or endorsed by the publisher.
The Supplementary Material for this article can be found online at: https://www.frontiersin.org/articles/10.3389/fspas.2023.1217990/full#supplementary-material
Arlitt, R., Kissling, E., Ansorge, J., and and Tor Working Group, (1999). Three-dimensional crustal structure beneath the TOR array and effects on teleseismic wavefronts. Tectonophysics314, 309–319. doi:10.1016/s0040-1951(99)00250-4
Blanchette-Guertin, J. F., Johnson, C. L., and Lawrence, J. F. (2012). Investigation of scattering in lunar seismic coda. J. Geophys. Res.117, E06003. doi:10.1029/2011je004042
Bostock, M. G., and Rondenay, S. (2002). Migration of scattered teleseismic body waves. Geophys. J. Int.137, 732–746. doi:10.1046/j.1365-246x.1999.00813.x
Castle, J. C., and Creager, K. C. (1999). A steeply dipping discontinuity in the lower mantle beneath Izu-Bonin. J. Geophys. Res.04, 7279–7292. doi:10.1029/1999jb900011
Cerjan, C., Kosloff, D., Kosloff, R., and Reshef, M. (1985). A nonreflecting boundary condition for discrete acoustic and elastic wave equations. Geophysics50 (4), 705–708. doi:10.1190/1.1441945
Frohlich, C., and Nakamura, Y. (2009). The physical mechanisms of deep moonquakes and intermediate-depth earthquakes: How similar and how different. Phys. Earth Planet. Interiors173 (3-4), 365–374. doi:10.1016/j.pepi.2009.02.004
Garcia, R. F., Gagnepain-Beyneix, J., Chevrot, S., and Lognonné, P. (2011). Very preliminary reference Moon model. Phys. Earth Planet. Interiors188, 96–113. doi:10.1016/j.pepi.2011.06.015
Garcia, R. F., Khan, A., Drilleau, M., Margerin, L., Kawamura, T., Sun, D., et al. (2019). Lunar seismology: An update on interior structure models. Space Sci. Rev.215 (8), 50. doi:10.1007/s11214-019-0613-y
Graves, R. W. (1996). Simulating seismic wave propagation in 3D elastic media using staggered-grid finite differences. Bull. Seismol. Soc. Am.86 (4), 1091–1106.
Helmberger, D. V., and Vidale, J. E. (1988). Modeling strong motions produced by earthquakes with two-dimensional numerical codes. Bull. Seismol. Soc. Am.78 (1), 109–121. doi:10.1785/bssa0780010109
Herrmann, R. B. (1979). SH-Wave generation by dislocation sources—a numerical study. Bull. Seismol. Soc. Am.69 (1), 1–15. doi:10.1785/bssa0690010001
Hood, L. L., Mitchell, D. L., Lin, R. P., Acuna, M. H., and Binder, A. B. (1999). Initial measurements of the lunar induced magnetic dipole moment using Lunar Prospector magnetometer data. Geophys. Res. Lett.26, 2327–2330. doi:10.1029/1999gl900487
Jarosch, H. S. (1977). The use of surface reflections in lunar seismograms. Bull. Seismol. Soc. Am.67, 1647–1659. doi:10.1785/bssa0670061647
Jiang, X. H., Wang, Y. B., and Takashi, F. (2015). Numerical simulation of lunar seismic coda caused by scattering in upper Moon crust. Chin. J. Geophys. (in Chinese)58 (5), 1675–1691.
Jiang, X. H., Wang, Y. B., Qin, Y., and Takenaka, H. (2015). Global SH-wave propagation in a 2D whole Moon model using the parallel hybrid PSM/FDM method. Earthquake Science28, 163–174. doi:10.1007/s11589-015-0121-4
Kárason, H., and van der Hilst, R. D. (2001). Tomographic imaging of the lowermost mantle with differential times of refracted and diffracted core phases (PKP, Pdiff). Journal of Geophysical Research106 (B4), 6569–6587. doi:10.1029/2000jb900380
Khan, A., Connolly, J. A. D., Pommier, A., and Noir, J. (2014). Geophysical evidence for melt in the deep lunar interior and implications for lunar evolution. Journal of Geophysical Research Planets119 (10), 2197–2221. doi:10.1002/2014je004661
Khan, A., Maclennan, J., Taylor, S. R., and Connolly, J. A. D. (2006). Are the earth and the moon compositionally alike? Inferences on lunar composition and implications for lunar origin and evolution from geophysical modeling. Journal of Geophysical Research Planets111 (E5), E05005. doi:10.1029/2005je002608
Khan, A., and Mosegaard, K. (2005). Further constraints on the deep lunar interior. Geophysical Research Letters32, 22203. doi:10.1029/2005gl023985
Khan, A., Mosegaard, K., Williams, J. G., and Lognonné, P. (2004). Does the moon possess a molten core? Probing the deep lunar interior using results from LLR and lunar prospector. Journal of Geophysical Research Planets109, 09007. doi:10.1029/2004je002294
Kronrod, V. A., and Kuskov, O. L. (2011). Inversion of seismic and gravity data for the composition and core sizes of the Moon. Izvestiya, Physics of the Solid Earth47, 711–730. doi:10.1134/s1069351311070044
Krüger, F., Baumann, M., Scherbaum, F., and Weber, M. (2001). Mid-mantle scatterers near the Mariana slab detected with a double array method. Geophysical Research Letters28, 667–670. doi:10.1029/2000gl011570
Kuskov, O. L., and Belashchenko, D. K. (2016). Thermodynamic properties of Fe–S alloys from molecular dynamics modeling: Implications for the lunar fluid core. Physics of the Earth and Planetary Interiors258, 43–50. doi:10.1016/j.pepi.2016.07.006
Lin, P. Y. P., Weber, R. C., Garnero, E. J., and Schmerr, N. C. (2011). “Further constraints and uncertainties on the deep seismic structure of the moon,” in Proceedings of the AGU fall meeting 2011, December 2011. San Francisco, CA, USA.
Lognonné, P., Gagnepain-Beyneix, J., and Chenet, H. (2003). A new seismic model of the moon: Implications for structure, thermal evolution and formation of the moon. Earth and Planetary Science Letters211 (1–2), 27–44. doi:10.1016/s0012-821x(03)00172-9
Lynnes, C. S., and Lay, T. (1989). Inversion of P coda for isotropic scatterers at the Yucca Flat test site. Bulletin of the Seismological Society of America79, 790–804.
Matsumoto, K., Yamada, R., Kikuchi, F., Kamata, S., Ishihara, Y., Iwata, T., et al. (2015). Internal structure of the Moon inferred from Apollo seismic data and selenodetic data from GRAIL and LLR. Geophysical Research Letters42, 7351–7358. doi:10.1002/2015gl065335
Morard, G., Bouchet, J., Rivoldini, A., Antonangeli, D., et al. (2018). Liquid properties in the Fe–FeS system under moderate pressure: Tool box to model small planetary cores. American Mineralogist103 (11), 1770–1779.
Nakamura, Y., Latham, G., Lammlein, D., Ewing, M., Duennebier, F., and Dorman, J. (1974). Deep lunar interior inferred from recent seismic data. Geophysical Research Letters1, 137–140. doi:10.1029/gl001i003p00137
Neal, S. L., and Pavlis, G. L. (2001). Imaging P- to S conversions with broad-band seismic arrays using multichannel time-domain deconvolution. Geophysical Journal International146, 57–67. doi:10.1046/j.1365-246x.2001.00507.x
Neal, S. L., and Pavlis, G. L. (1999). Imaging P- to-S conversions with multichannel receiver functions. Geophysical Research Letters26, 2581–2584. doi:10.1029/1999gl900566
Onodera, K., Kawamura, T., Tanaka, S., Ishihara, Y., and Maeda, T. (2021). Numerical simulation of lunar seismic wave propagation: Investigation of subsurface scattering properties near Apollo 12 landing site. Journal of Geophysical Research Planets126, e2020JE006406. doi:10.1029/2020je006406
Revenaugh, J. (1995). The contribution of topographic scattering to teleseismic coda in southern California. Geophysical Research Letters22, 543–546. doi:10.1029/95gl00162
Ritter, J. R. R., Jordan, M., Christensen, U. R., and Achauer, U. (2001). A mantle plume below the Eifel volcanic fields, Germany. Earth and Planetary Science Letters186 (1), 7–14. doi:10.1016/s0012-821x(01)00226-6
Rost, S., and Revenaugh, J. (2001). Seismic detection of rigid zones at the top of the core. Science294, 1911–1914. doi:10.1126/science.1065617
Rost, S., and Thomas, C. (2002). Array seismology: Methods and applications. Review of Geophysics40 (3), 2-1–2-27. doi:10.1029/2000rg000100
Shimshoni, M., and Smith, S. W. (1964). Seismic signal enhancement with three-component detectors. Geophysics29, 664–671. doi:10.1190/1.1439402
Thomas, C., Kendall, J. M., and Weber, M. (2002). The lowermost mantle beneath northern Asia—I. Multi-Azimuth studies of a D″ heterogeneity. Geophysical Journal International151 (1), 279–295. doi:10.1046/j.1365-246x.2002.01759.x
Vidale, J. E., and Earle, P. S. (2000). Fine-scale heterogeneity in the Earth’s inner core. Nature404, 273–275. doi:10.1038/35005059
Wang, Y. B., Luo, Y., Qin, Y. F., and Zhang, X. B. (2014). Global SH-wavefield calculation for a two-dimensional whole-Earth model with the parallel hybrid PSM/FDM algorithm. Earthquake Science27, 277–284. doi:10.1007/s11589-014-0085-9
Wang, Y. B., Takenaka, H., and Furumura, T. (2001). Modelling seismic wave propagation in a two dimensional cylindrical whole Earth model using the pseudospectral method. Geophysical Journal International145 (3), 689–708. doi:10.1046/j.1365-246x.2001.01413.x
Wang, Y. B., Takenaka, H., Jiang, X. H., and Lei, J. (2013). Modelling two-dimensional global seismic wave propagation in a laterally heterogeneous whole-moon model. Geophysical Journal International192 (3), 1271–1287. doi:10.1093/gji/ggs094
Wang, Y. B., and Takenaka, H. (2011). SH-wavefield simulation for a laterally heterogeneous whole-Earth model using the pseudospectral method. Science China Earth Sciences54 (12), 1940–1947. doi:10.1007/s11430-011-4244-8
Weber, R. C., Lin, P., Garnero, E. J., Williams, Q., and Lognonne, P. (2011). Seismic detection of the lunar core. Science331, 309–312. doi:10.1126/science.1199375
Williams, J. G., Boggs, D. H., Yoder, C. F., Ratcliff, J. T., and Dickey, J. O. (2001). Lunar rotational dissipation in solid body and molten core. Journal of Geophysical Research106, 27933–27968. doi:10.1029/2000je001396
Williams, J. G., Konopliv, A. S., Boggs, D. H., Park, R. S., Yuan, D. N., Lemoine, F. G., et al. (2014). Lunar interior properties from the GRAIL mission. Journal of Geophysical Research Planets119, 1546–1578. doi:10.1002/2013je004559
Yuan, Y. F. (2018). The analysis of the lunar core structure based on lunar seismic data. Wuhan, China: Department of Geophysics, School of Geophysics and Spatial Information, China University of Geosciences.
Zhang, X., and Zhang, J. H. (2021). Research progress and prospect of moonquakes. Reviews of Geophysics and Planetary Physics (in Chinese)52 (4), 391–401.
Keywords: lunar core, double array stacking, scattering, polarization filtering, numerical simulation
Citation: Yang B and Wang Y (2023) Analysis of reliability and accuracy of lunar core detection based on Apollo moonquake observation. Front. Astron. Space Sci. 10:1217990. doi: 10.3389/fspas.2023.1217990
Received: 06 May 2023; Accepted: 30 May 2023;
Published: 14 June 2023.
Edited by:
Jinhai Zhang, Chinese Academy of Sciences (CAS), ChinaReviewed by:
Xiang Zhang, UMR7154 Institut de Physique du Globe de Paris (IPGP), FranceCopyright © 2023 Yang and Wang. This is an open-access article distributed under the terms of the Creative Commons Attribution License (CC BY). The use, distribution or reproduction in other forums is permitted, provided the original author(s) and the copyright owner(s) are credited and that the original publication in this journal is cited, in accordance with accepted academic practice. No use, distribution or reproduction is permitted which does not comply with these terms.
*Correspondence: Yanbin Wang, eWJ3YW5nQHBrdS5lZHUuY24=
Disclaimer: All claims expressed in this article are solely those of the authors and do not necessarily represent those of their affiliated organizations, or those of the publisher, the editors and the reviewers. Any product that may be evaluated in this article or claim that may be made by its manufacturer is not guaranteed or endorsed by the publisher.
Research integrity at Frontiers
Learn more about the work of our research integrity team to safeguard the quality of each article we publish.