 Yanan Feng1,2
 Xiaohu Li1,3*
 Tom J. Millar4
 Ryszard Szczerba5
 Ke Wang6
 Donghui Quan1,7Shengli Qin1,8
 Xuan Fang1,9,10,11Juan Tuo1,2Zhenzhen Miao1
 Rong Ma1,2Fengwei Xu6,12Jingfei Sun1Biwei Jiang13,14Qiang Chang15Jianchao Yang1,2
 Gao-Lei Hou16
 Fangfang Li1
 Yong Zhang1,11,17
- 1Xinjiang Astronomical Observatory, Chinese Academy of Sciences, Urumqi, China
- 2School of Astronomy and Space Science, University of the Chinese Academy of Sciences, Beijing, China
- 3Key Laboratory of Radio Astronomy, Chinese Academy of Sciences, Urumqi, China
- 4Astrophysics Research Centre, School of Mathematics and Physics, Queen’s University Belfast, Belfast, United Kingdom
- 5Nicolaus Copernicus Astronomical Center, Polish Academy of Sciences, Warsaw, Poland
- 6The Kavli Institute for Astronomy and Astrophysics at Peking University (KIAA-PKU), Beijing, China
- 7Research Center for Intelligent Computing Platforms, Zhejiang Laboratory, Hang Zhou, China
- 8Department of Astronomy, Yunnan University, Kunming, China
- 9National Astronomical Observatories, Chinese Academy of Sciences, Beijing, China
- 10Department of Physics, Faculty of Science, The University of Hong Kong, Hang Zhou, China
- 11Laboratory for Space Research, Faculty of Science, The University of Hong Kong, Hang Zhou, China
- 12Department of Astronomy at Peking University (DoA-PKU), Beijing, China
- 13Institute for Frontiers in Astronomy and Astrophysics, Beijing Normal University, Beijing, China
- 14Department of Astronomy, Beijing Normal University, Beijing, China
- 15School of Physics and Optoelectronic Engineering, Shandong University of Technology, Zibo, China
- 16MOE Key Laboratory for Non-Equilibrium Synthesis and Modulation of Condensed Matter, School of Physics, Xi’an Jiaotong University, Xi’an, China
- 17School of Physics and Astronomy, Sun Yat-sen University, Guangzhou, China
The fact that whether SiC2 is a parent species, formed in the photosphere or as a by-product of high-temperature dust formation, or a daughter species, formed in chemistry driven by the photodestruction of the parent species in the outer envelope, has been debated for a long time. In this study, we analyze the Atacama Large Millimeter Array (ALMA) observations of four SiC2 transitions in the circumstellar envelopes (CSEs) of three C-rich asymptotic giant branch (AGB) stars (AI Vol, II Lup, and RAFGL 4211) and find that SiC2 exhibits an annular, shell-like distribution in these targets, suggesting that SiC2 can be a daughter species in the CSEs of carbon-rich AGB stars. The results may provide important references for future chemical models.
1 Introduction
Late evolutionary stars with masses between 0.8 and 8 M⊙ (Höfner and Olofsson, 2018) experience dramatic mass losses. The stellar wind continues to eject material outward, eventually forming a circumstellar envelope (CSE), often referred to as the molecular space factory. According to different C/O ratios, asymptotic giant branch (AGB) stars are divided into three classes: O-rich AGB stars (oxygen-rich, C/O < 1), S-type AGB stars (C/O ≈ 1), and C-rich AGB stars (carbon-rich, C/O > 1). Over 105 molecular species have been detected in the circumstellar envelope of the evolved stars (Decin, 2021). These species, distributed in different areas of CSEs, can help us trace shell properties, such as local temperature and gas composition, and help us understand the chemical synthesis within the objects. A large number of carbon-bearing species are observed in abundance surrounding the carbon stars, for instance, CO, CS, HC3N, and C2H, some of which come from the inner layers of CSEs, while some are formed in the outer regions (Decin et al., 2008; Li et al., 2016).
Silacyclopropynylidene (SiC2) was first detected and confirmed in IRC +10216 by Thaddeus et al. (1984), who derived a fairly large column density, 1.5 × 1014 cm−2. Glassgold et al. (1986) suggested that SiC2 was formed by the reaction of Si+ with C2H2 or C2H, followed by dissociative recombination with electrons. Glassgold et al. (1991) suggested alternative pathways, initiated by reactions of SiS with
The spatial distribution of SiC2 in IRC +10216 was discussed by Takano et al. (1992) and Guelin et al. (1993), who showed a spherical shell-like structure indicative of a daughter species. Lucas et al. (1995) and Gensheimer et al. (1995) used the Plateau de Bure and the Berkeley–Illinois–Maryland Array (BIMA), respectively, to map SiC2 emissions, showing that it had a shell structure. The first confirmation that SiC2 was present close to the star came from Cernicharo et al. (2010), who used the Herschel Space Observatory to detect some 55 transitions from energy levels 500–900 K above the ground state, implying that SiC2 was present in the dust-forming zone. Subsequently, Fonfría et al. (2014), using the CARMA interferometer, and Prieto et al. (2015), using the Atacama Large Millimeter Array (ALMA), detected emissions from both the central region and the outer shell.
In a work devoted to single-dish observations of 25 C-rich AGB stars (Massalkhi et al., 2018), SiC2 and SiC were detected in about half of the sources. They found that the abundance of SiC2 decreased with the increasing envelope density, indicating that SiC2 is a parent species in these CSEs. De Beck and Olofsson (2020) detected SiC2 in the S-type AGB star W Aql, and showed that the emission occurs in a ring of a radius of 1–2″.
Most evidence shows that SiC2 is formed in LTE conditions close to the star, although IRC +10216 has an increase in the abundance of SiC2 at approximately 10″, indicating an additional formation in the outer regions of CSEs. To date, no millimeter-wave interferometric array observation of SiC2 has been published in CSEs of C-rich AGB stars other than IRC +10216. In this work, we provide evidence that SiC2 seems to be a daughter molecule through high-resolution observations of three C-rich AGB stars. We describe the observations in Section 2. The results are discussed in Section 3. The conclusion is presented in Section 4. The spatial distribution and the fractional abundance of SiC2 in AI Vol together with 50, 5−40, 4 transitions in RAFGL 4211 are discussed in the main paper, while the rest of the results are presented in the Supplementary Material.
2 Observations
Observations were made using the ALMA 12-m array. The spectral line observations in three bands of AI Vol, RAFGL 4211, and II Lup covering four Windows with a bandwidth of 2 GHz were performed on 16 August 2015 (2013.1.00070.S, PI: Nyman, Lars-Åke). The data were extracted from the ALMA Archive1. For AI Vol, the configuration used for the observation is a 12-m main array, with baselines 21–783 m. The image cube per spw averages every 2 × 488 kHz channel. The rms requirement is 3 mJy per 1 arcsec beam, per 0.9 MHz (∼2.7 km s−1). The synthesized rms is 1.3 mJy/beam, and the synthesized beam is 1.4″ × 0.9″. The parameters of the observed transitions are shown in Table 1. The frequency resolution during the observation is 1,128.9984 kHz, corresponding to the velocity resolution of 2.526−3.122 km s−1. The wide frequency range covers four lines of SiC2 (40, 4−30, 3, 42, 3−32, 2, 42, 2−32, 1, and 50, 5−40, 4).
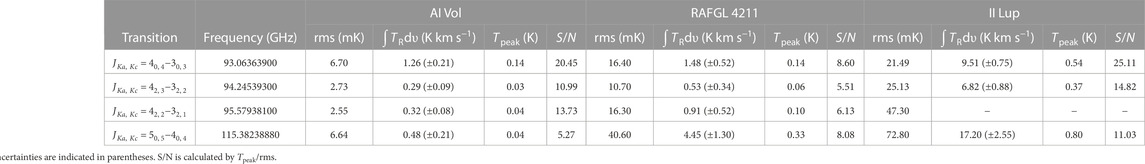
TABLE 1. Spectral line parameters of different transitions in SiC2 obtained via shell fitting using GILDAS.
AI Vol, RAFGL 4211, and II Lup are all carbon-rich AGB stars with mass losses. A survey conducted by Smith et al. (2015) at the 3-mm band revealed that the three carbon-rich stars possess abundant molecules but the sensitive detection of molecular spatial distributions relies on more advanced telescopes, such as ALMA. In this study, we present the physical parameters taken from the literature and the synthesized beam for the observed sources, which are listed in Table 2.
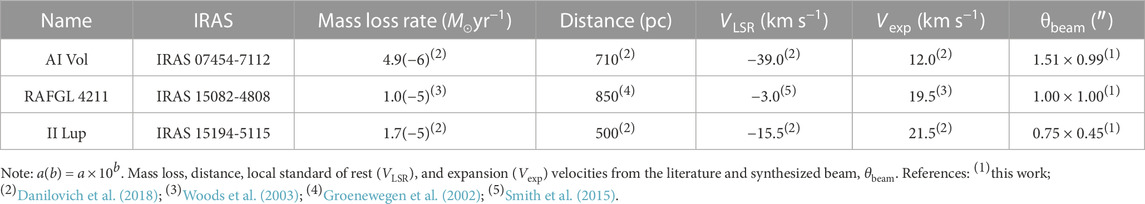
TABLE 2. Source and observational parameters.
The imaging process of the calibrated data was manually performed using CASA 4.3.12 software. The “clean” task was employed, and to achieve a balance between the spatial resolution and noise gain in the resulting image, the Briggs weighting function was applied along with adjustments to the “robust” parameter of 0.5. The rms was calculated near the center of the field, excluding all emissions within the region. The rms values for all channel maps were obtained using the task “imstat” in CASA software. Each pixel on the image plane corresponded to a size of 0.2 arcseconds. Then, we used Python software to map and analyze ALMA product data. To calculate the molecular column density, we employed shell fitting using GILDAS software3, along with Splatalogue4 and CDMS databases5 (Müller et al., 2005).
3 Result
3.1 Spatial distribution of SiC2
We found four transitions of SiC2 from each source, except for the 42, 2−32, 1 transition, which was not observed in II Lup. Based on Sμ2 from Table 3, the 42, 2−32, 1 transition of SiC2 in the 3-mm wavelength range ranked third in terms of signal intensity. However, we did not detect any signal. Our data were obtained from the ALMA Archive, and from the data information, we found that the other three transitions of SiC2 and the data from two additional sources had map sizes of 800 × 800 or 640 × 640 pixels. In contrast, the data without signal detection only covered a map size of 300 × 300 pixels. We speculate that there may have been some unknown special circumstances during the observations that led to the absence of a signal.
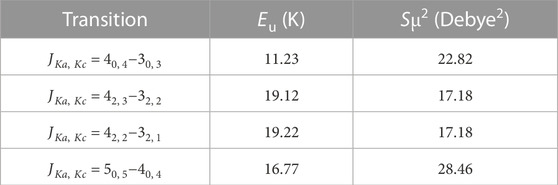
TABLE 3. Upper energy, Eu, and Sμ2 of molecular SiC2 in the observed transitions extracted from the “Splatalogue” database.
AI Vol does not have the strongest spectral line signal, but the signal-to-noise ratio of the spatial brightness distribution is higher than that of the other two stars. Cernicharo et al. (2015) have reported the observations and model results of a C-rich AGB star, IRC +10216. They suggest that a companion star may explain the spiral structure of its CSE. Lykou et al. (2018) reported spiral structures of several parent molecules in II Lup, suggesting that a companion star is the main forming mechanism of mass loss. The results show that the spectral line signal of AI Vol is stronger than RAFGL 4211 (in Figure 6; Supplementary Figure SA9). In order to get reliable results, we concentrate on analyzing the distribution around the center star of AI Vol (in Section 3.1.1). The rotational diagram method was used to calculate fractional abundance, and its detailed analysis is presented in Section 3.2.
3.1.1 AI Vol
Figures 1, 2 show the SiC2 (40, 4−30, 3 and 42, 2−32, 1) radial velocity channel map toward the C-rich AGB star AI Vol (the other transitions are shown in Supplementary Figures SA1, A2). Around the local standard of the rest velocity VLSR of AI Vol (−39 km s−1), SiC2 shows a ring distribution around the center star with a diameter of ∼4–6″ (∼2,840.95−4,258.08 au), and the signal strength reaches 20.4 and 13.7σ for 40, 4−30, 3 and 42, 2−32, 1 transitions. Based on the images presented by Decin et al. (2015), it is evident that the parent molecules, such as SiO, exhibit a concentrated distribution within a compact structure surrounding the central star. In contrast, our observation reveals a characteristic pattern specific to the daughter molecules, distributed in hollow rings around the star (Agúndez et al., 2015; 2017). The brightness distributions of Figures 1, 2 under different velocity components are all generated from the transitions (40, 4−30, 3 and 42, 2−32, 1) without the spatial extension caused by the fine structure.
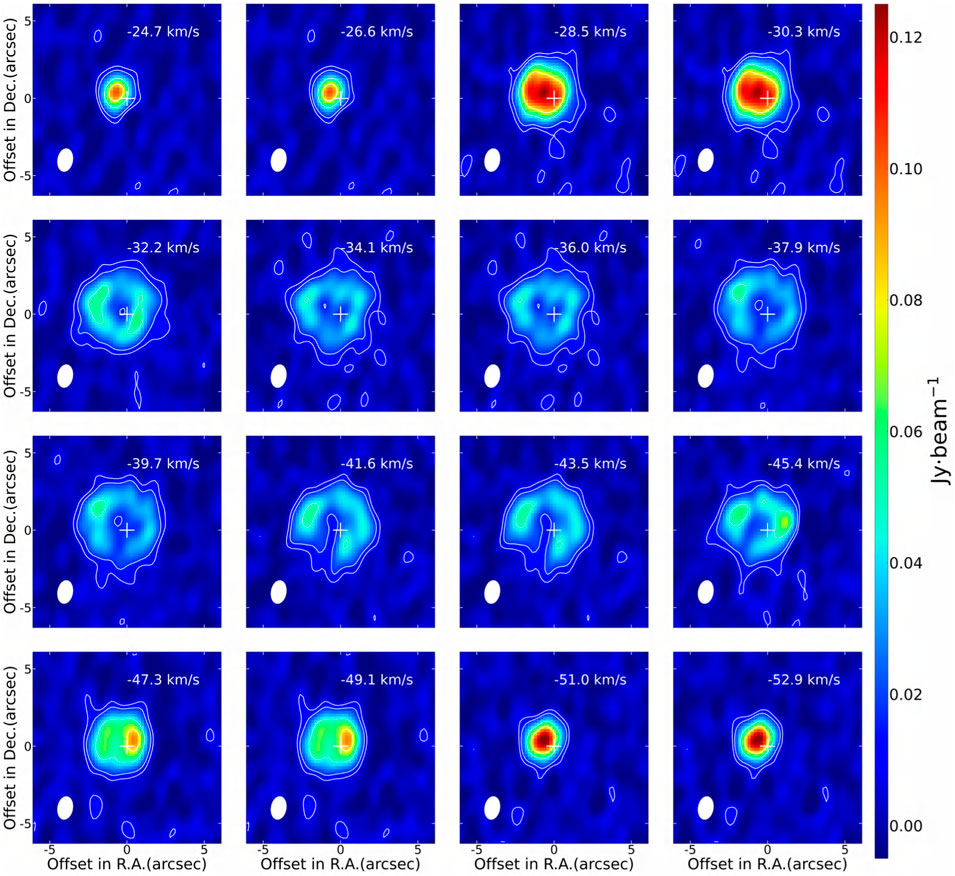
FIGURE 1. Channel maps of SiC2 (40, 4−30, 3) toward AI Vol. The shape of the synthesized beam is shown in the lower left corner of each panel with a size of 1.51 × 0.99″, with PA 9.82°. The systemic velocity is displayed in the top right corner of each panel. The white cross represents the position of the star on the map. The white contour maps display the flux levels of the SiC2 transition at 5, 10, 30, and 50 times the rms noise, 1σ = 1.6 mJy⋅beam−1. The selected range of the color bar can show the spatial distribution of molecules better. The brightness distribution of the elongated cavity is similar to that in IRC +10216 (Lucas et al., 1995).
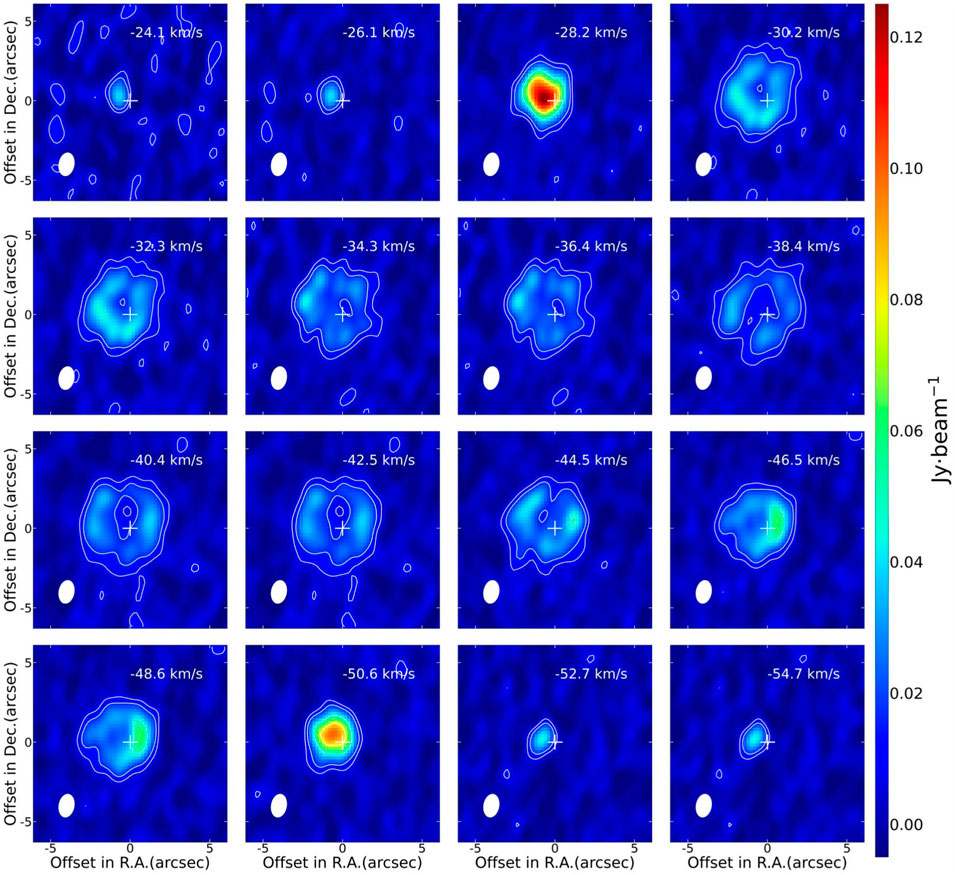
FIGURE 2. Channel maps of SiC2 (42, 2−32, 1) toward AI Vol. The shape of the synthesized beam is shown in the lower left corner of each panel with a size of 1.48 × 0.98″, with PA 10.44°. The velocity (km s−1) is displayed in the top right corner of each panel. The white cross represents the center of the star in the map. The white contours display the flux levels of the SiC2 transition at 5, 10, 30, and 50 times the rms noise, 1σ = 1.5 mJy⋅beam−1.
The brightness distribution of the 40, 4−30, 3 transition of SiC2 and the 2–1 transition of SiO around VLSR channels (from 32.3 to 46.5 km s−1) are shown in Figure 3. We can see that the maximum emission of SiC2 occurs at the radius of ∼3″, with a hole in the distance from the star ∼2″. The studies conducted by Takano et al. (1992) and Agúndez et al. (2015) showcased the spatial distribution of the daughter species centered around VLSR. SiO is present as the parent species in three types of AGB stars (Cherchneff, 2006; Ramstedt et al., 2009). SiC2 and SiO, shown in Figure 3, represent the spatial distribution characteristics of the daughter species and parent species, respectively, exhibiting distinct hollow and compact structures.
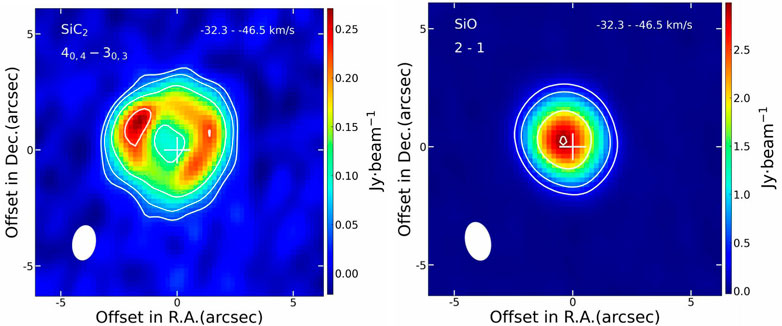
FIGURE 3. Brightness distribution of SiC2 (left panel) and SiO (right panel) transitions at the source velocity (−32.3−−46.5 km s−1) in AI Vol. The color bar shows the brightness distribution of different regions. The white cross represents the center of the star in the map. The beam size of the observation in SiC2 is 1.51 × 0.99″, with PA 9.82°. The beam size of the observation in SiO is 1.64 × 1.06″, with PA −12.99°. The white contours display the flux levels of SiC2 at 3, 5, 10, and 20 times the rms noise, with 1σ = 11.3 mJy⋅beam−1. For SiO (2–1), the flux levels are at 5, 10, 30, and 50 times the rms noise, where 1σ = 58.9 mJy⋅beam−1.
The northeast part of the shell emission has relatively stronger spectral signals. The SiC2 (40, 4−30, 3) transition for AI Vol is stronger than the other transitions, and the hollow shell structure can be seen more clearly. SiC2 at different velocity components showed an elongated cavity extending from the inner region to a location with a southern radius of ∼2″. This structure may be caused by a companion star, but AI Vol has no spiral structure typical of a companion star (Cernicharo et al., 2015). The gas expands at a lower velocity near the star, and lower-excited state transitions farther from the star are more spatially distributed than higher-excited state transitions of the same source. This is seen in Figure 4, where the zeroth-order moment map of the (50, 5−40, 4) transition has a smaller extent than the (40, 4−30, 3) transition.
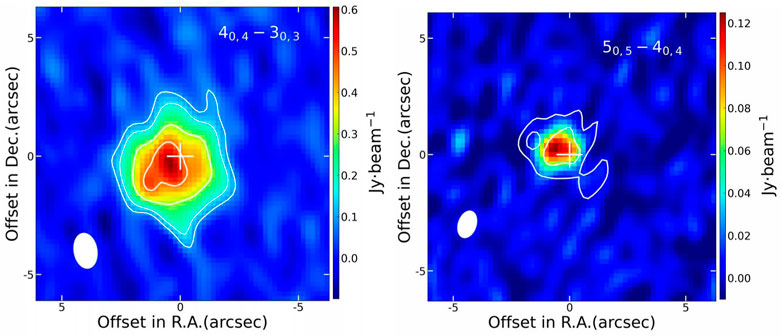
FIGURE 4. Zeroth moment map of the SiC2 (40, 4−30, 3 and 50, 5−40, 4) line at 93.063639 and 115.382375 GHz toward AI Vol. The beam size of observation is 1.51 × 0.99″, with PA 9.82°. The molecular transitions are displayed in the top right corner of each panel. In the right panel, the beam size of observation is 1.20 × 0.79″, with PA 18.86°. In the left panel, the white contours display the flux levels at 3, 5, 10, and 15 times the rms noise, with 1σ = 30.5 mJy⋅beam−1. In the right panel, the flux levels are shown at 3 and 5σ (1σ = 0.1 mJy⋅beam−1).
The difference between Figures 3, 4 lies in their representation of data. In Figure 3, we present channel maps which provide images of vertical slices through the expanding envelope, while Figure 4 shows the line intensity integrated over all velocities. From Figure 3, we can see the clear feature of SiC2 as a daughter molecule. Figure 4 offers a broader perspective by showcasing the distribution of all signals. Moreover, it reveals that the gas intensity spatial distribution of AI Vol for different transitions varies in size. Compared to transitions with low rotational quantum numbers, transitions with high rotational quantum numbers are distributed closer to the star.
The inner region of AGB stars is at ≲ 20R* (3.89 × 1014 cm), and the intermediate area of the CSE of AI Vol is at ≲ 70R* (1.36 × 1015 cm) (Decin et al., 2008). So the radius of SiC2 molecules in AI Vol coincides with the region of the daughter species in the model (Li et al., 2016).
3.1.2 RAFGL 4211 and II Lup
Figure 5; Supplementary Figures SA3–A5 show the channel maps of the four transitions of SiC2 for RAFGL 4211. The synthesized beam of observation is 1.00 × 1.00″, with position angles (PA) 0°. Signal strengths range from 5σ to 8σ. The brightness distribution radius is
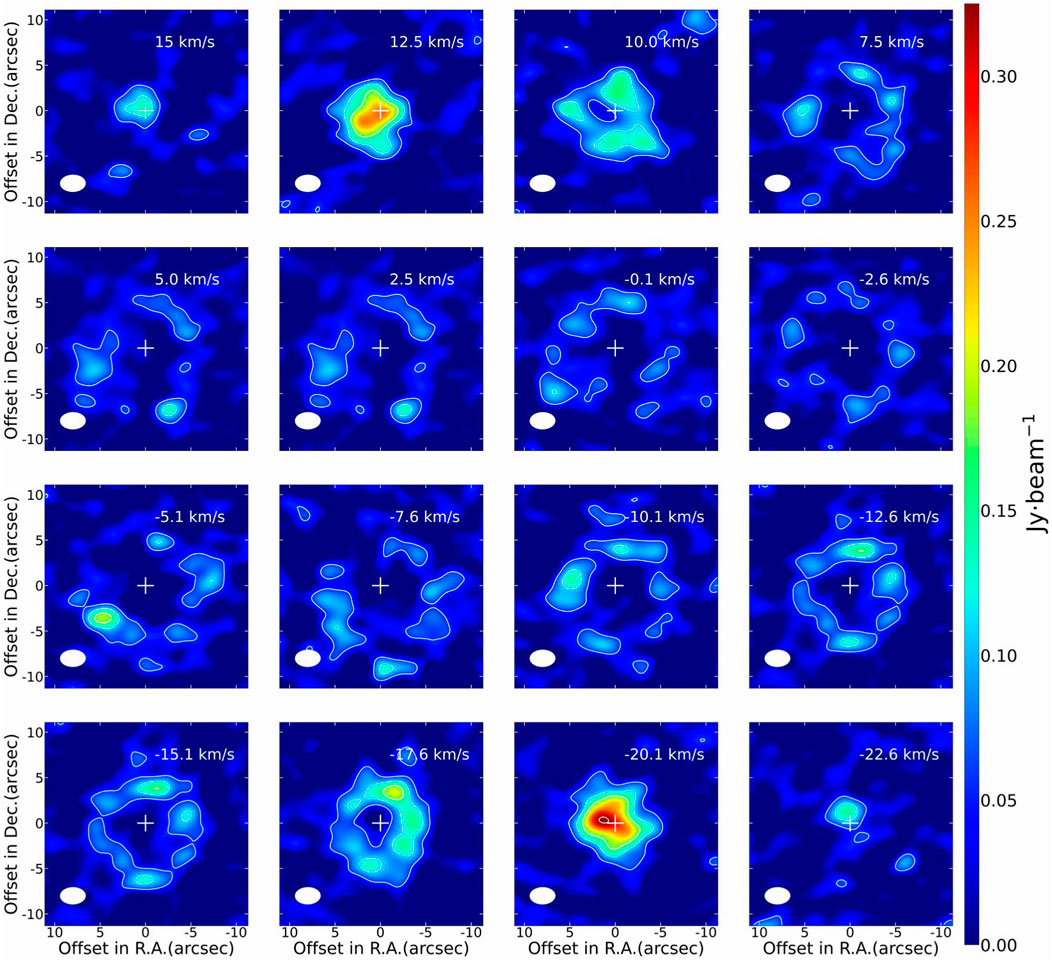
FIGURE 5. Channel maps of SiC2 (50, 5−40, 4) toward RAFGL 4211. The shape of the synthesized beam is shown in the lower left corner of each panel with a size of 1.40 × 0.93″, with PA 89.13°. The white cross represents the center of the star in the map. The white contours delineate the flux levels of SiC2, indicating increments of 5, 10, 15, and 30 times the rms noise (1σ = 11.0 mJy⋅beam−1).
Supplementary Figures SA6–A8 show the channel map of the three transitions of II Lup. The emissions 42, 2−32, 1 have no notable signals and linewidths (the third panel at the bottom of Supplementary Figure SA9). The synthesized beam of observation is 0.75 × 0.45″. The signal strengths range from 6σ to 11σ. Supplementary Figure SA8 shows that 50, 5−40, 4 emission has the form of a ring around the central position. The brightness distribution radius of the II Lup near VLSR = 15.5 km s−1 velocity is
3.1.3 Summary of morphology
The SiC2 channel map (Figures 2, 5) of AI Vol and RAFGL 4211 shows distinct daughter species characteristics. The SiC2 radius greater than the 20R* distribution in the three C-rich AGB stars is consistent with the distribution of daughter species in O-rich AGB stars (Li et al., 2014). The distribution in hollow rings of the three sources indicates that SiC2 is formed in the star’s outer layer through chemical reactions. This is the same as the ring distribution of SiC2 in IRC +10216 (Takano et al., 1992). Gensheimer et al. (1995) reported that the inner and outer radii of SiC2 of IRC +10216 are mainly distributed in the range of ∼2× 10¹⁶–6 × 1016 cm. In the analyzed observations of three sources, the SiC2 spatial distribution range is approximately 2.12 × 10¹⁶–8.90 × 1016 cm. Altogether, combining the ring brightness distribution of SiC2 obtained in this work, we confirm that SiC2 is the daughter molecule in the CSEs of C-rich AGB stars.
3.2 Abundance
We use the rotational diagram method to estimate the abundance of SiC2, and the spectral line profiles of the four transitions are shown in Figure 6. Using the parameters in Table 1, the molecular excitation temperature and column density are calculated under the assumption of LTE, and the equation is as follows (Zhang et al., 2009; Wang et al., 2014, e.g.):

FIGURE 6. Spectral line shapes of SiC2 toward AI Vol, integrated with a 100 × 100 pixel range centered on the star.
Here, N represents the total column density of the molecule, Q represents the partition function, Eu represents the upper-level energy, Tex represents the excitation temperature, k represents the Boltzmann constant, υ(Hz) represents the rest frequency, W (∫TRdυ) represents the spectral line integral intensity, and Sμ2 represents the product of the line strength and the square of the electric dipole moment. The values of Sμ2 and Eu/k are taken from the Splatalogue database6. As the upper energy levels are close in temperature, the errors in the derived quantities are rather large.
In order to determine the relative abundance of SiC2 to H2, it is necessary to evaluate the average H2 column density within the radius occupied by SiC2. This can be achieved by employing the following equation (Gong et al., 2015):
For AI Vol,
and
The slope is represented by mR, and the intercept is represented by CR. δN is the uncertainty contribution from the rotation partition function and the intercept of the rotational diagram.
In practical calculations, first, the excited temperature and column density of SiC2 are fitted by using the rotation diagram method that is described in Eq. 1 and plotted in Figure 7; second, the fractional abundance of SiC2 is calculated by f =
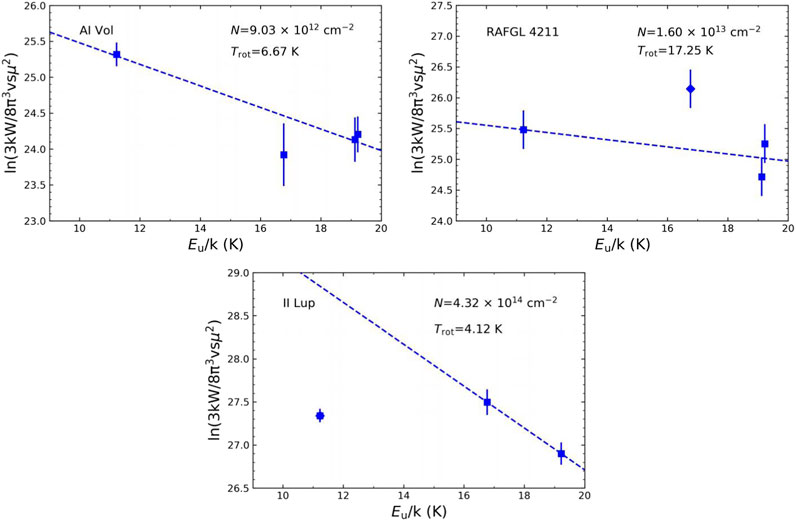
FIGURE 7. Rotational diagram for the observed SiC2 lines toward AI Vol, RAFGL 4211, and II Lup. The blue dotted lines represent the results from linear least squares fitting by taking into account the weights of the errors. During fitting procedures, the data for SiC2 transitions of 50, 5−40, 4 (blue diamond) in RAFGL 4211 and 40, 4−30, 3 (blue diamond) in II Lup were excluded. The upper right corner in each panel shows the fitted column density and excitation temperature.
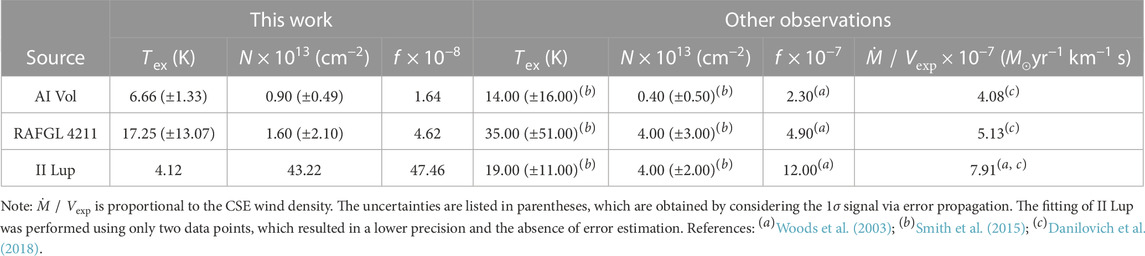
TABLE 4. Deduced excitation temperature (Tex), column density (N), and fractional abundance (f) of SiC2 relative to H2 in the target sources by the rotational diagram method, along with the previous observational results.
In the previous astrochemical models of C-rich CSEs of AGB stars, SiC2 is always treated as a parent species with an initial abundance of ∼10−5 (Li et al., 2014; Massalkhi et al., 2018; Van de Sande and Millar, 2022). However, this study clearly shows that this molecule is a daughter species, and therefore, the chemistry of SiC2 in chemical models needs to be reinvestigated.
3.3 SiC2 chemistry
Previous studies on silicon chemistry in CSEs of AGB stars mainly arise from these models constructed for the carbon-rich AGB star IRC +10216. The detailed discussion on the chemistry of the triangular molecule SiC2 in the inner CSE can be found in Willacy and Cherchneff (1998) and in the outer CSE in Takano et al. (1992), Gensheimer et al. (1995), and MacKay and Charnley (1999), where SiC2 is found to be mainly formed via ion-neutral reactions and are broken down into SiC due to photodissociation induced by the photons from the interstellar medium. Cernicharo et al. (2010) introduced three key reactions to the formation of SiC2 (i.e., Si reacts with C2H2, Si reacts with C2H, and Si+ reacts with C2H), and then, it can successfully explain the enhanced abundance of SiC2 from observations. The chemistry of these cyclic molecules is complex. The study of c–SiC3 by Yang et al. (2019) suggested that the carbon–silicon molecules in the CSE may not only come from complex ion–molecule reactions or the photodissociation of high-molecular weight carbon–silicon molecules but also from bimolecular neutral–neutral reactions, leading to the formation of naked carbon–silicon molecules via photochemical dehydrogenation. Since SiC2 is likely the gas-phase precursor in forming SiC dust in carbon stars (Massalkhi et al., 2018), the interaction between gas and dust, in addition to the non-spherical and clumpy structures of the envelopes of the stars, will need to be considered in future chemical models.
4 Conclusion
To explore whether SiC2 is a parent or a daughter species, we have analyzed the ALMA observations of SiC2 (40, 4−30, 3, 42, 3−32, 2, 42, 2−32, 1, and 50, 5−40, 4) for the three carbon stars and compared them with SiC2 results in the C-rich AGB star IRC +10216. The abundance of SiC2 in the three stars is calculated by the rotational diagram method. Our analysis revealed that SiC2 molecules in the CSEs of carbon stars exhibited a hollow shell structure, with a distinct brightness distribution at different velocities; therefore, we conclude that SiC2 exists as a daughter molecule in the CSEs of these sources. Our results are in contrast to some previous reports which concluded that SiC2 is a parent molecule in the envelopes of carbon stars. More sensitive observations may, of course, detect SiC2 emissions at low levels in the inner CSE. Our findings provide new insights into the chemical processes occurring in the CSEs of evolved stars and contribute to our understanding of the chemical evolution of ISM. A further detailed understanding of SiC2 formation requires studying and comparing more C-rich AGB stars by combining the results of single-dish and high-resolution interferometric observations.
Data availability statement
Publicly available datasets were analyzed in this study. These data can be found in the following: the datasets analyzed for this study can be found in the ALMA Science Archive: https://almascience.nrao.edu. This paper makes use of the following ALMA data: ADS/JAO.ALMA 2013.1.00070.S.
Author contributions
YF prepared the project, processed the ALMA Archive data, and wrote the draft. XL initiated the project, guided the work, and revised the manuscript. TM was involved in interpreting the results, and reviewing and revising the manuscripts. RS provided continuous manuscript revisions. KW provided insights and feedback during the analysis process of the results. FX helped with the data analysis. DQ, SQ, XF, BJ, QC, G-LH, FL, and YZ provided comments and suggestions on the manuscript. JT, ZM, RM, JS, and JY were involved in analyzing the results and provided suggestions for the manuscript. All authors contributed to the article and approved the submitted version.
Funding
XL acknowledges the support from the Xinjiang Tianchi project (2019). TM is grateful to the Leverhulme Trust for the award of an Emeritus Fellowship. This work was also funded by the National Science Foundation of China (12173023), the China Manned Space Project (CMS-CSST-2021-A09), the National Science Foundation of China (11973013), the National Key Research and Development Program of China (22022YFA1603102), the National Natural Science Foundation of China (92261101), the Innovation Capability Support Program of Shaanxi Province (2023-CX-TD-49), and the National Natural Science Foundation of China (11973075). XF, SQ, and YZ thank the Xinjiang Uygur Autonomous Region of China for their support through the Tianchi Talent Program.
Acknowledgments
The authors appreciate the invaluable suggestions of the two reviewers on this work, which has significantly improved the quality of this paper. This paper makes use of the following ALMA data: ADS/JAO.ALMA 2013.1.00070.S. ALMA is a partnership of ESO (representing its member states), NSF (the United States), and NINS (Japan), together with NRC (Canada), MOST and ASIAA (Taiwan), and KASI (the Republic of Korea), in cooperation with the Republic of Chile. The Joint ALMA Observatory is operated by ESO, AUI/NRAO, and NAOJ. The authors are very grateful to Professor Lars-Åke Nyman (the PI of the ALMA project that provided the data for this work) for his valuable comments and suggestions. This research has made use of Astropy7, a community-developed core Python package for astronomy, and Matplotlib.
Conflict of interest
The authors declare that the research was conducted in the absence of any commercial or financial relationships that could be construed as a potential conflict of interest.
Publisher’s note
All claims expressed in this article are solely those of the authors and do not necessarily represent those of their affiliated organizations, or those of the publisher, the editors, and the reviewers. Any product that may be evaluated in this article, or claim that may be made by its manufacturer, is not guaranteed or endorsed by the publisher.
Supplementary material
The Supplementary Material for this article can be found online at: https://www.frontiersin.org/articles/10.3389/fspas.2023.1215642/full#supplementary-material
Footnotes
1https://almascience.nao.ac.jp/aq
3http://www.iram.fr/IRAMFR/GILDAS
4https://splatalogue.online//advanced.php
5http://www.astro.uni-koeln.de/cdms/catalog
6https://splatalogue.online//advanced.php
References
Agúndez, M., Cernicharo, J., Quintana-Lacaci, G., Castro-Carrizo, A., Velilla Prieto, L., Marcelino, N., et al. (2017). Growth of carbon chains in IRC +10216 mapped with ALMA. Astron. Astrophys. 601, A4. doi:10.1051/0004-6361/201630274
Agúndez, M., Cernicharo, J., Quintana-Lacaci, G., Velilla Prieto, L., Castro-Carrizo, A., Marcelino, N., et al. (2015). The peculiar distribution of CH3CN in IRC +10216 seen by ALMA. Astrophys. J. 814, 143. doi:10.1088/0004-637X/814/2/143
Agúndez, M., Fonfría, J., Cernicharo, J., Kahane, C., Daniel, F., and Guélin, M. (2012). Molecular abundances in the inner layers of IRC +10216. Astron. Astrophys. 543, A48. doi:10.1051/0004-6361/201218963
Cernicharo, J., Marcelino, N., Agúndez, M., and Guélin, M. (2015). Molecular shells in IRC +10216: tracing the mass loss history. Astron. Astrophys. 575, A91. doi:10.1051/0004-6361/201424565
Cernicharo, J., Waters, L., Decin, L., Encrenaz, P., Tielens, A., Agúndez, M., et al. (2010). A high-resolution line survey of IRC +10216 with herschel/hifi-first results: detection of warm silicon dicarbide (SiC). Astron. Astrophys. 521, L8. doi:10.1051/0004-6361/201015150
Cherchneff, I. (2006). A chemical study of the inner winds of asymptotic giant branch stars. Astron. Astrophys. 456, 1001–1012. doi:10.1051/0004-6361:20064827
Danilovich, T., Ramstedt, S., Gobrecht, D., Decin, L., De Beck, E., and Olofsson, H. (2018). Sulphur-bearing molecules in agb stars-ii. abundances and distributions of CS and SiS. Astron. Astrophys. 617, A132. doi:10.1051/0004-6361/201833317
De Beck, E., and Olofsson, H. (2020). The surprisingly carbon-rich environment of the S-type star W Aql 642. Astron. Astrophys., A20. doi:10.1051/0004-6361/202038335
Decin, L., Cherchneff, I., Hony, S., Dehaes, S., De Breuck, C., and Menten, K. M. (2008). Detection of “parent” molecules from the inner wind of AGB stars as tracers of non-equilibrium chemistry. Astron. Astrophys. 480, 431–438. doi:10.1051/0004-6361:20078892
Decin, L. (2021). Evolution and mass loss of cool aging stars: a daedalean story. Annu. Rev. Astron. Astrophys. 59, 337–389. doi:10.1146/annurev-astro-090120-033712
Decin, L., Richards, A. M. S., Neufeld, D., Steffen, W., Melnick, G., and Lombaert, R. (2015). ALMA data suggest the presence of spiral structure in the inner wind of CW Leonis. Astron. Astrophys. 574, A5. doi:10.1051/0004-6361/201424593
Fonfría, J. P., Fernández-López, M., Agúndez, M., Sánchez-Contreras, C., Curiel, S., and Cernicharo, J. (2014). The complex dust formation zone of the AGB star IRC +10216 probed with CARMA 0.25 arcsec angular resolution molecular observations. Mon. Notices Royal Astron. Soc. 445, 3289–3308. doi:10.1093/mnras/stu1968
Gensheimer, P. D., Likkel, L., and Snyder, L. E. (1995). Full synthesis maps of circumstellar SiC2 in IRC +10216. Astrophys. J. 439, 445. doi:10.1086/175186
Glassgold, A. E., Lucas, R., and Omont, A. (1986). Molecular ions in the circumstellar envelope of IRC +10216. Astron. Astrophys. 157, 35–48.
Glassgold, A. E., Mamon, G. A., and Huggins, P. J. (1991). The formation of molecules in protostellar winds. Astrophys. J. 373, 254–265. doi:10.1086/170045
Gong, Y., Henkel, C., Spezzano, S., Thorwirth, S., Menten, K., Wyrowski, F., et al. (2015). A 1.3 cm line survey toward IRC +10216. Astron. Astrophys. 574, A56. doi:10.1051/0004-6361/201424819
Groenewegen, M., Sevenster, M., Spoon, H., and Pérez, I. (2002). Millimetre observations of infrared carbon stars. mass loss rates and expansion velocities. Astron. Astrophys. 390, 511–522. doi:10.1051/0004-6361:20020728
Guelin, M., Lucas, R., and Cernicharo, J. (1993). MgNC and the carbon-chain radicals in IRC +10216. Astron. Astrophys. 280, L19–L22.
Höfner, S., and Olofsson, H. (2018). Mass loss of stars on the asymptotic giant branch. Astron. Astrophys. Rev. 26, 1–92. doi:10.1007/s00159-017-0106-5
Li, X., Millar, T. J., Heays, A. N., Walsh, C., van Dishoeck, E. F., and Cherchneff, I. (2016). Chemistry and distribution of daughter species in the circumstellar envelopes of O-rich AGB stars. Astron. Astrophys. 588, A4. doi:10.1051/0004-6361/201525739
Li, X., Millar, T. J., Walsh, C., Heays, A. N., and Van Dishoeck, E. F. (2014). Photodissociation and chemistry of N2 in the circumstellar envelope of carbon-rich agb stars. Astron. Astrophys. 568, A111. doi:10.1051/0004-6361/201424076
Lucas, R., Guélin, M., Kahane, C., Audinos, P., and Cernicharo, J. (1995). Plateau de bure observations of IRC +10216: high sensitivity maps of SiC2, SiS, CS. Astrophys. Space Sci. 224, 293–296. doi:10.1007/BF00667860
Lykou, F., Zijlstra, A. A., Kluska, J., Lagadec, E., Tuthill, P. G., Avison, A., et al. (2018). The curious case of II Lup: a complex morphology revealed with SAM/NACO and ALMA. Mon. Not. R. Astron. Soc. 480, 1006–1021. doi:10.1093/mnras/sty1903
MacKay, D. D. S., and Charnley, S. B. (1999). The silicon chemistry of IRC+10°216. Mon. Notices Royal Astron. Soc. 302, 793–800. doi:10.1046/j.1365-8711.1999.02175.x
Massalkhi, S., Agúndez, M., Cernicharo, J., Velilla Prieto, L., Goicoechea, J. R., Quintana-Lacaci, G., et al. (2018). Abundance of SiC2 in carbon star envelopes. Astron. Astrophys. 611, A29. doi:10.1051/0004-6361/201732038
Müller, H. S. P., Schlöder, F., Stutzki, J., and Winnewisser, G. (2005). The cologne database for molecular spectroscopy, CDMS: a useful tool for astronomers and spectroscopists. J. Mol. Struct. 742, 215–227. doi:10.1016/j.molstruc.2005.01.027
Nyman, L.-Å., and Olofsson, H. (1995). Molecular abundances in carbon-rich circumstellar envelopes. Astrophys. Space Sci. 224, 527–528. doi:10.1007/bf00667938
Prieto, L. V., Cernicharo, J., Quintana-Lacaci, G., Agúndez, M., Castro-Carrizo, A., Fonfría, J. P., et al. (2015). Si-bearing molecules toward IRC +10216: ALMA nuveils the molecular envelope of cwleo. Astrophys. J. Lett. 805, L13. doi:10.1088/2041-8205/805/2/l13
Ramstedt, S., Schöier, F. L., and Olofsson, H. (2009). Circumstellar molecular line emission from S-type AGB stars: mass-loss rates and SiO abundances. Astron. Astrophys. 499, 515–527. doi:10.1051/0004-6361/200911730
Smith, C. L., Zijlstra, A. A., and Fuller, G. A. (2015). A molecular line survey of a sample of AGB stars and planetary nebulae. Mon. Notices Royal Astron. Soc. 454, 177–200. doi:10.1093/mnras/stv1934
Takano, S., Saito, S., and Tsuji, T. (1992). Silicon chemistry in the outer envelope of IRC +10216: the detailed distribution of SiC2. Publ. Astron. Soc. Japan 44, 469–480.
Thaddeus, P., Cummins, S. E., and Linke, R. A. (1984). Identification of the SiCC radical toward IRC +10216: the first molecular ring in an astronomical source. Astrophys. J. 283, L45–L48. doi:10.1086/184330
Van de Sande, M., and Millar, T. J. (2022). The impact of stellar companion UV photons on the chemistry of the circumstellar environments of AGB stars. Mon. Notices Royal Astron. Soc. 510, 1204–1222. doi:10.1093/mnras/stab3282
Velilla-Prieto, L., Cernicharo, J., Agúndez, M., Fonfría, J. P., Castro-Carrizo, A., Quintana-Lacaci, G., et al. (2018). Circumstellar chemistry of Si-C bearing molecules in the C-rich AGB star IRC +10216. Proceedings of the International Astronomical Union 14, 535–537. doi:10.1017/s1743921318005410
Wang, K., Zhang, Q., Testi, L., van der Tak, F., Wu, Y., Zhang, H., et al. (2014). Hierarchical fragmentation and differential star formation in the galactic 'snake': infrared dark cloud g11.11-0.12. Mon. Notices Royal Astron. Soc. 439, 3275–3293. doi:10.1093/mnras/stu127
Willacy, K., and Cherchneff, I. (1998). Silicon and sulphur chemistry in the inner wind of IRC +10216. Astron. Astrophys. 330, 676–684.
Woods, P., Schöier, F. a., Nyman, L.-Å., and Olofsson, H. (2003). Molecular abundances in carbon-rich circumstellar envelopes. Astron. Astrophys. 402, 617–634. doi:10.1051/0004-6361:20030190
Yang, T., Bertels, L., Dangi, B. B., Li, X., Head-Gordon, M., and Kaiser, R. I. (2019). Gas phase formation of c-SiC3 molecules in the circumstellar envelope of carbon stars. Proceedings of the National Academy of Science 116, 14471–14478. doi:10.1073/pnas.1810370116
Keywords: asymptotic giant branch stars, mass loss, circumstellar envelope, C-rich, SiC2, AI Vol, II Lup, RAFGL 4211
Citation: Feng Y, Li X, Millar TJ, Szczerba R, Wang K, Quan D, Qin S, Fang X, Tuo J, Miao Z, Ma R, Xu F, Sun J, Jiang B, Chang Q, Yang J, Hou G-L, Li F and Zhang Y (2023) Photochemical origin of SiC2 in the circumstellar envelope of carbon-rich AGB stars revealed by ALMA. Front. Astron. Space Sci. 10:1215642. doi: 10.3389/fspas.2023.1215642
Received: 02 May 2023; Accepted: 20 July 2023;
Published: 14 August 2023.
Edited by:
Malgorzata Biczysko, Shanghai University, ChinaReviewed by:
Claudio Codella, Osservatorio Astrofisico di Arcetri (INAF), ItalyDipen Sahu, Physical Research Laboratory, India
Copyright © 2023 Feng, Li, Millar, Szczerba, Wang, Quan, Qin, Fang, Tuo, Miao, Ma, Xu, Sun, Jiang, Chang, Yang, Hou, Li and Zhang. This is an open-access article distributed under the terms of the Creative Commons Attribution License (CC BY). The use, distribution or reproduction in other forums is permitted, provided the original author(s) and the copyright owner(s) are credited and that the original publication in this journal is cited, in accordance with accepted academic practice. No use, distribution or reproduction is permitted which does not comply with these terms.
*Correspondence: Xiaohu Li, eGlhb2h1LmxpQHhhby5hYy5jbg==