- 1Physics Department, University of Texas at Arlington, Arlington, TX, United States
- 2NASA Goddard Spaceflight Center, Greenbelt, MD, United States
Magnetopause location is an important prediction of numerical simulations of the magnetosphere, yet the models can err, either under-predicting or over-predicting the motion of the boundary. This study compares results from two of the most widely used magnetohydrodynamic (MHD) models, the Lyon–Fedder–Mobarry (LFM) model and the Space Weather Modeling Framework (SWMF), to data from the GOES 13 and 15 satellites during the geomagnetic storm on 22 June 2015, and to THEMIS A, D, and E during a quiet period on 31 January 2013. The models not only reproduce the magnetopause crossings of the spacecraft during the storm, but they also predict spurious magnetopause motion after the crossings seen in the GOES data. We investigate the possible causes of the over-predictions during the storm and find the following. First, using different ionospheric conductance models does not significantly alter predictions of the magnetopause location. Second, coupling the Rice Convection Model (RCM) to the MHD codes improves the SWMF magnetopause predictions more than it does for the LFM predictions. Third, the SWMF produces a stronger ring current than LFM, both with and without the RCM and regardless of the LFM spatial resolution. During the non-storm event, LFM predicts the THEMIS magnetopause crossings due to the southward interplanetary magnetic field better than the SWMF. Additionally, increasing the LFM spatial grid resolution improves the THEMIS predictions, while increasing the SWMF grid resolutions does not.
1 Introduction
The magnetopause is the boundary between the magnetosphere and the shocked solar wind in the magnetosheath. The location of the magnetopause is, to first order, determined by the balance of pressures between the magnetosphere and the magnetosheath; the former is dominated by magnetic pressure from Earth’s magnetic field, which is much stronger than the turbulent interplanetary magnetic field (IMF) in the sheath, and the latter by pressure from the shocked solar wind plasma (Martyn, 1951). Since the position of the boundary depends on these pressures, it varies with solar wind conditions. As the IMF and the plasma parameters change, so does the overall pressure from the magnetosheath.
Under the southward IMF, the magnetopause moves inward toward Earth in a process known as magnetopause erosion (Aubry et al., 1970). In the magnetosphere, large-scale currents can create fringe magnetic fields opposite to the terrestrial magnetic field, reducing the outward magnetic pressure and allowing the magnetopause to retreat Earthward. These currents include the Region 1 Birkeland or field-aligned currents (FACs) and the cross-tail current, which increase with large negative IMF Bz (Maltsev and Lyatsky, 1975; Sibeck et al., 1991; Maltsev et al., 1996; Wiltberger et al., 2003). The conductance of the polar ionosphere varies spatially and temporally with the number of charge carriers available, i.e., ionospheric plasma, and plays a major role in determining the strength of the Birkeland currents.
The ring current can also play a part in the location of the magnetopause during geomagnetic storms. As the plasma densities in the inner magnetosphere increase with ring current strength, they push the magnetopause outward, especially in the post-noon sector with the partial ring current. The toroidal geometry of the ring current creates a weak magnetic field outside itself in the direction of the terrestrial magnetic field, which strengthens the outward magnetic pressure on the magnetopause. The partial ring current is created as particles are lost when the drift paths of ions in the inner magnetosphere intersect at the magnetopause, which happens during the main phase of the storm due to the strong convection electric field (Daglis, 2006) and closes into the ionosphere with the Region 2 Birkeland currents. The asymmetry due to the partial ring current causes the post-noon magnetopause to be pushed out farther than the pre-noon magnetopause (Dmitriev et al., 2011). SYM-H is an index that measures the deviation of the magnetic field at Earth’s surface from its quiet-time value, due in large part to the increased strength of the ring current during geomagnetic storms, using magnetometer stations around the world.
Numerical simulations of various kinds are used to predict magnetopause location, with physics-based codes generally outperforming empirical models. For operators of satellites in an orbit that can be either inside or outside the magnetopause, depending on conditions, predictions of magnetopause motion represent an important space-weather product. Spacecraft attitude adjustment by means of magnetic torque, for example, must take into account the differences in the magnetic field inside the magnetosphere and outside in the magnetosheath (Sibeck, 1995). Additionally, the ability of a model to accurately predict the location and shape of the magnetopause indicates, on some level, the extent to which the physics of the solar wind–magnetosphere interaction is represented in the code. An awareness of the strengths and weaknesses of the different codes is, therefore, vital to understanding the appropriateness of each model under various solar wind conditions. Previous work by Dredger et al. (2023) found that, in general, magnetohydrodynamic (MHD) models tended to predict the position of the magnetopause better when the main driver of its motion was density increase, while a southward IMF turning, unaccompanied by stronger solar wind plasma pressure, often resulted in an overprediction of magnetopause erosion, at least during geomagnetic storms. The same study also saw an overall improvement in the prediction of magnetopause location with the coupling of an inner magnetosphere model that adds ring current physics to the simulation.
This study builds on the work of Dredger et al. (2023) by further investigating one of the four storms considered in that paper, the storm of 22–23 June 2015, with two different MHD models. We study the effects of changing the ionospheric conductance model on the prediction of Birkeland current magnitude and magnetopause location. We also consider in detail the results of coupling an inner magnetosphere model to both of the MHD codes during the June 2015 storm. Finally, as a counterexample to the investigation of the storm event, we compare the ability of the two models to predict the location of the magnetopause during a period of quiet solar wind and weak IMF. For both storms, we investigate the effect of changing the spatial grids of the MHD models on the predictions along the satellite tracks.
2 Methodology
The spacecraft providing the data for this study are the geosynchronously orbiting GOES 15, operated by the National Oceanic and Atmospheric Administration (NOAA), and three THEMIS satellites, A, D, and E. GOES 15 orbits the Earth at 135° west. Each set of GOES magnetometer data is given in a cylindrical coordinate system in which the Z-component, labeled HP, roughly corresponds with the Z-component in geocentric solar ecliptic (GSE) coordinates. The quantity plotted in all the figures containing GOES data in this study is HP1, that is, the data from one of two identical magnetometers on the spacecraft. GSE is a right-handed coordinate system in which positive X points sunward along the Earth–Sun line; positive Z points northward, perpendicular to the ecliptic; and positive Y points towards dusk. The units of GSE coordinates are Earth radii or RE. THEMIS (Time History of Events and Macroscale Interactions during Substorms) is a constellation of five spacecraft, two of which, B and C, have been moved to the lunar orbit and comprise the THEMIS–ARTEMIS mission. The three spacecraft used in this study orbit the Earth in an elliptical orbit that precesses from the dayside to the magnetotail and back again (Angelopoulos, 2008). THEMIS data are given in GSE coordinates.
Here, we only show the GOES magnetometer data, while for THEMIS, we also show the corresponding particle data. Although GOES has energetic particle data, when the magnetopause moves so far inward as to move past GOES, many particles are lost due to magnetopause shadowing; thus, these data cannot show the reentry of the spacecraft into the magnetosphere.
We identify a magnetopause encounter in the satellite data as the moment when the magnetometer measures Bz = 0 nT in the ambient magnetic field, as the spacecraft passes from positive, near-dipolar values inside the magnetosphere to the turbulent, negative IMF Bz in the magnetosheath. This method, of course, only works for southward IMF conditions, like those during a geomagnetic storm. While it is possible that solar wind density alone can push the magnetopause past geosynchronous orbit under northward IMF Bz, the density was so strong that such a situation only occurred twice in the entire decade of 2010–2020 for a total of 30 min (Collado-Vega et al., 2023). In this paper, we directly compare the observational satellite data with the model predictions along the satellite track, so the exact timing of the magnetopause crossings is less important.
The solar wind data used to drive the MHD simulations were obtained from OMNI, a dataset that takes measurements from several solar wind monitors and propagates them to a nominal bow shock position. During both events considered here, Wind provided the observations to OMNI; Wind orbits the first Lagrangian point, about 200 RE upstream of the Earth. OMNI data are available as 1- and 5-min averages, and the 1-min averaged data were used in the model runs. Another dataset from the Active Magnetosphere and Planetary Electrodynamics Response Experiment (AMPERE) provides the Birkeland current measurements in this study. AMPERE uses the engineering magnetometer data from the Iridium satellite constellations to derive FACs (Anderson et al., 2002; Anderson et al., 2014).
The two MHD models employed in this study are the Lyon–Fedder–Mobarry (LFM) model and the Space Weather Modeling Framework (SWMF) from the University of Michigan, both very successful codes with a long history. All simulation runs were conducted at NASA’s Community Coordinated Modeling Center (CCMC).
The LFM model solves the semiconservative MHD equations on a stretched spherical grid (Lyon et al., 2004). The single-fluid version implemented at the CCMC offers three different levels of resolution (r × theta × phi): 53 × 48 × 64, 106 × 48 × 64, or 106 × 96 × 128 cells. Unless otherwise specified, all LFM runs in this study have the lowest resolution, known as “double” resolution ( Pham et al., 2016; Hogan et al., 2020; Pham et al., 2021). The ionospheric electrostatic potential is calculated by the built-in Magnetosphere–Ionosphere Coupler/Solver (MIX), a 2D shell around the Earth at the MHD inner boundary (Merkin and Lyon, 2010). There are various options for conductance models, including constant Pedersen and Hall conductances and a semi-empirical auroral conductance (Wiltberger et al., 2009). MIX can also couple the LFM model to the Thermosphere–Ionosphere-Electrodynamic General Circulation Model (TIEGCM), a first-principles model of the ionosphere–thermosphere system (Dickinson et al., 1981; Roble et al., 1988; Qian et al., 2014). LFM-MIX, together with TIEGCM, is called the Coupled Magnetosphere–Ionosphere–Thermosphere model, or CMIT (Wang et al., 2004; Wiltberger et al., 2004; Liu et al., 2021).
The SWMF executes and couples a set of models in different space physics domains (Tóth et al., 2005; Tóth et al., 2012). The MHD code employed in the SWMF is the Block-Adaptive-Tree-Solarwind-Roe-Upwind-Scheme (BATS-R-US), which solves the conservative MHD equations on an adaptive 3D grid to simulate the global magnetosphere (Powell et al., 1999). The ionospheric electrodynamics is calculated by the Ridley Ionosphere Model (RIM) at about 110 km in altitude (Ridley et al., 2001; Ridley and Liemohn, 2002; Ridley et al., 2004). At the CCMC, there are several options given for the conductance model, which are similar to those available for LFM: constant conductance and semi-empirical auroral conductance (Ridley et al., 2004). The grid used for most of the runs in this study is the overview grid with 1,007,616 cells, abbreviated as “1M” as follows, which is similar to the lower resolution of the two used in the version of the code at NOAA’s Space Weather Prediction Center (SWPC). For the analysis of the non-storm event, we ran the SWMF with a high-resolution grid of 9,623,552 cells, abbreviated as “9M” (See Section 4 for a discussion of the resolutions of the various runs analyzed here).
The Rice Convection Model (RCM) is a bounce-averaged drift kinetic model developed at Rice University and is widely used to simulate the inner magnetosphere, both as a standalone model and coupled to magnetosphere models to add the effect of the ring current (Wolf et al., 1982; Toffoletto et al., 2003). LFM can be coupled to the RCM (Pembroke et al., 2012), although the version of LFM currently implemented at the CCMC does not allow the MHD code to be coupled to both the RCM and TIE-GCM at the same time. The SWMF has also incorporated the RCM into its Inner Magnetosphere (IM) module (Zeeuw et al., 2004; Tóth et al., 2005; Tóth et al., 2012).
3 Results
3.1 Description of the 22 June 2015 storm and GOES magnetopause crossings
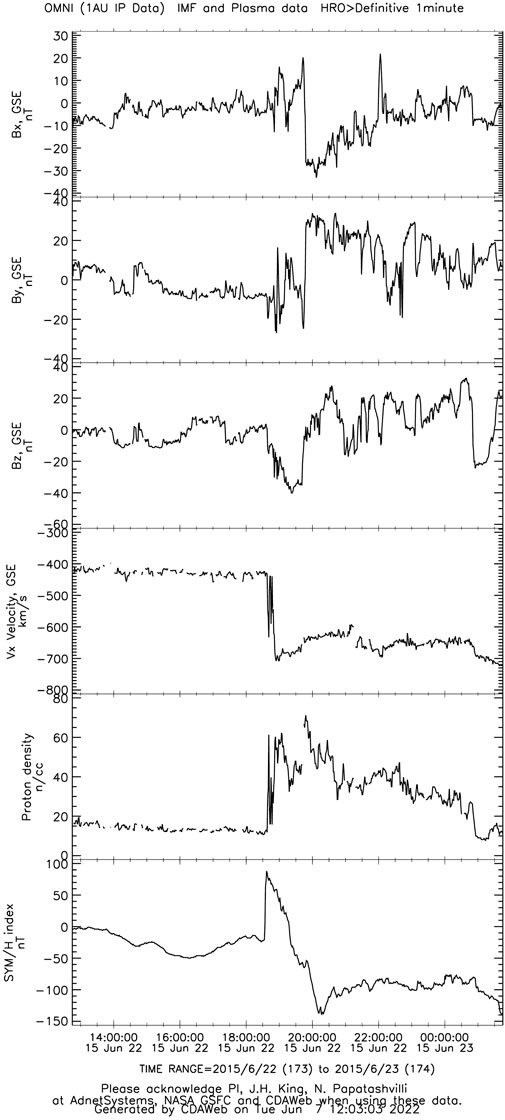
On 22 June 2015, around 18:30 UT, the proton density measured at L1 suddenly increased from about 10 cm−3 to more than 60 cm−3, accompanied by a steep increase in solar wind speed and intense IMF values. Bz remained strongly southward for almost an hour and a half and then went northward until around 21:00 UT, when it turned southward again. As Bz became positive, By exceeded 30 nT and stayed strongly positive for more than 2 h. This was a moderate geomagnetic storm; SYM/H reached nearly −150 nT after the storm’s sudden commencement and did not recover until after the period under consideration in this study (see Figure 1). The density increase pushed the magnetopause toward Earth and over GOES 15, which was on the dayside at the time in the morning sector. Although proton densities remained high in the morning of June 23, the later southward turning of Bz did not cause any more magnetopause crossings at the geosynchronous orbit, although both LFM and the SWMF predicted false crossings at GOES 15 in response. By 21:00 UT, GOES 15 was near noon (see Figure 2).
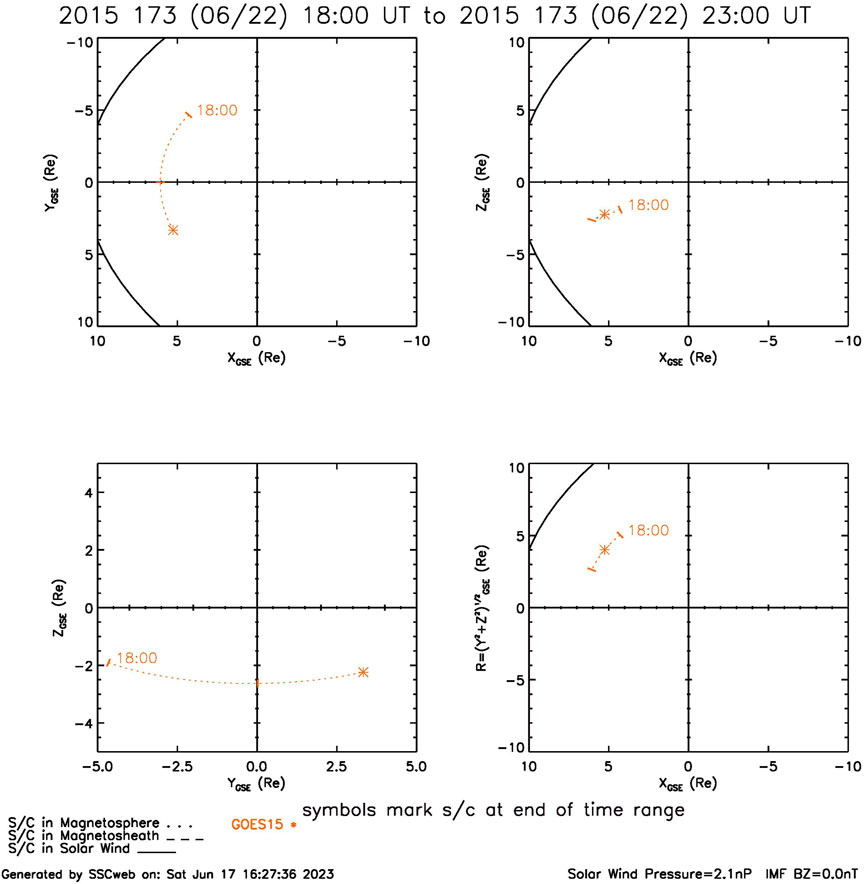
FIGURE 2. GOES 15 orbit during the period of interest in this study in GSE coordinates (plot from CDAWeb).
3.2 The effect of ionospheric conductance models
The “original” runs by both MHD models use the semi-empirical auroral conductance option to calculate ionospheric conductances during the event. To investigate the cause of the spurious magnetopause crossings, the models were rerun using different conductance models.
Figure 3 shows the total Birkeland currents in the northern and southern hemispheres for the auroral conductance run, runs with constant Pedersen conductance of 5 and 10 S and Hall conductance set to 0, and LFM coupled to TIEGCM, all compared with the total currents from the AMPERE dataset. All of the runs fall short of the real current values, especially in the south, and all predict an increase after 21:00 UT, which does not exist in the AMPERE data. The predicted currents do differ in magnitude in the north, with the auroral conductance calculation being the highest and TIEGCM close behind. All the runs completely fail to capture the peak of the current in the southern hemisphere. It is possible that this peak is due to the strong IMF Bx during this period. It is common in MHD modeling to set IMF Bx to 0 to avoid issues that arise from the need to keep
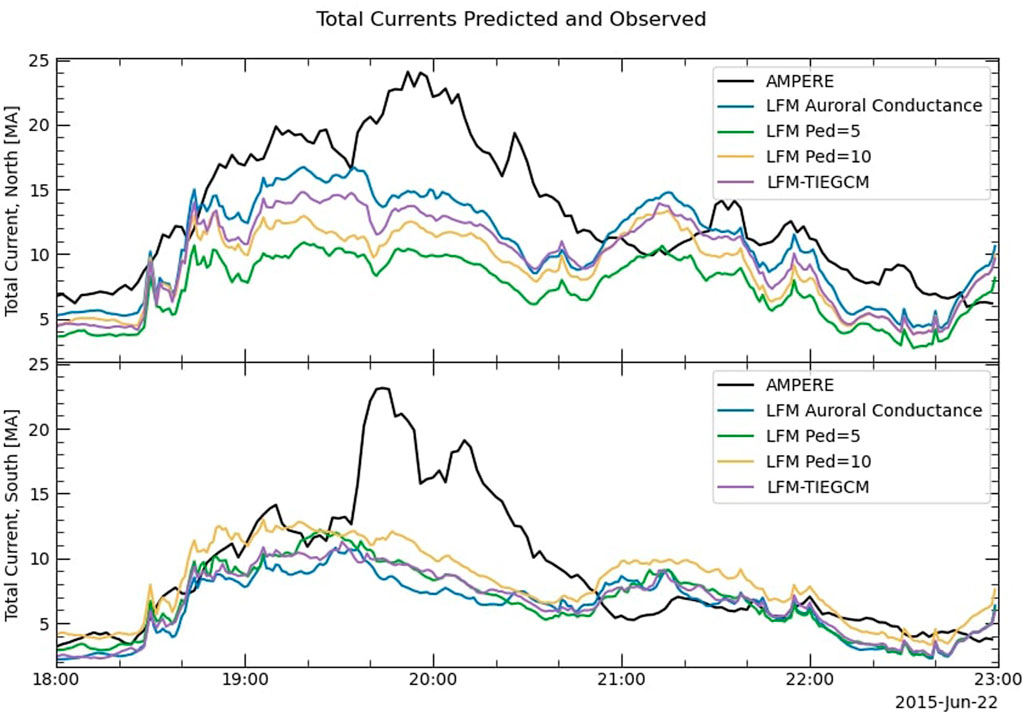
FIGURE 3. Total FACs in the northern and southern hemispheres, as predicted by LFM using several different ionospheric conductance models, compared with AMPERE. The predicted currents differ somewhat in magnitude, but not in their temporal trends, including their prediction of an increase after 21:00 UT, which was not reflected in the AMPERE currents.
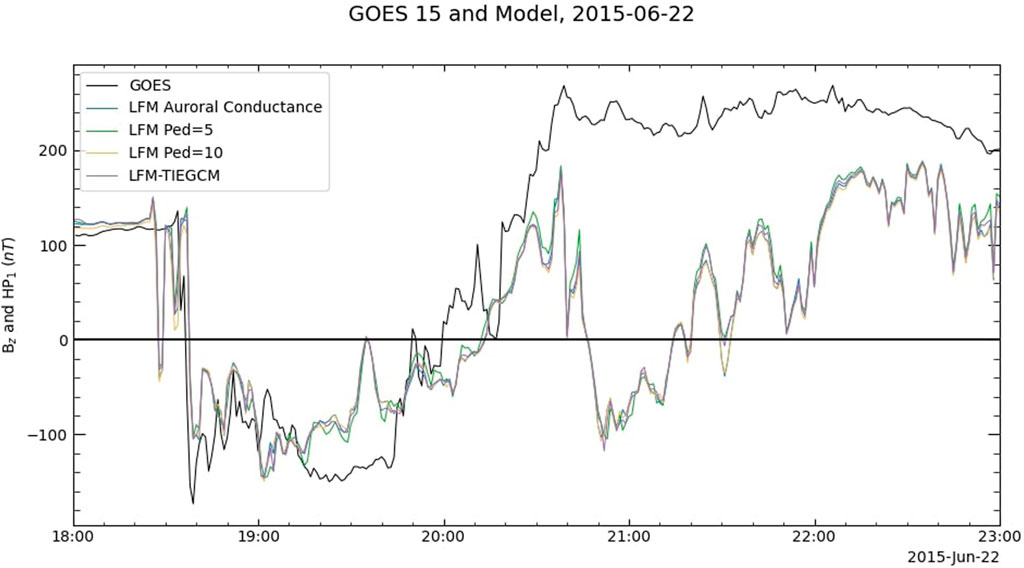
FIGURE 4. GOES 15 data and predictions by LFM using several different conductance models. The predictions are virtually identical among the four runs.
Although the SWMF does not predict spurious magnetopause crossings, in the simulated GOES 15 data (i.e., the simulation output along the satellite track), there are two decreases in Bz around 21:00 UT and 22:00 UT that are not reflected in the real data, indicating that the magnetopause approaches the modeled satellite too closely at those times. Repeating the conductance experiment with the SWMF gives results similar to those of LFM. Figures 5, 6 show the total FAC and GOES 15 predictions from the SWMF with auroral conductances and with three values of Pedersen conductance, 2, 5, and 10 S. Like the corresponding LFM predictions, the currents vary in magnitude, but changing the conductance model does not change the overall shape of the lines in Figure 5. The four runs have virtually the same predictions at the location of GOES 15, even for the very low constant conductance run. Changing the conductance model in both LFM and the SWMF has almost no effect on the predictions of magnetopause motion.
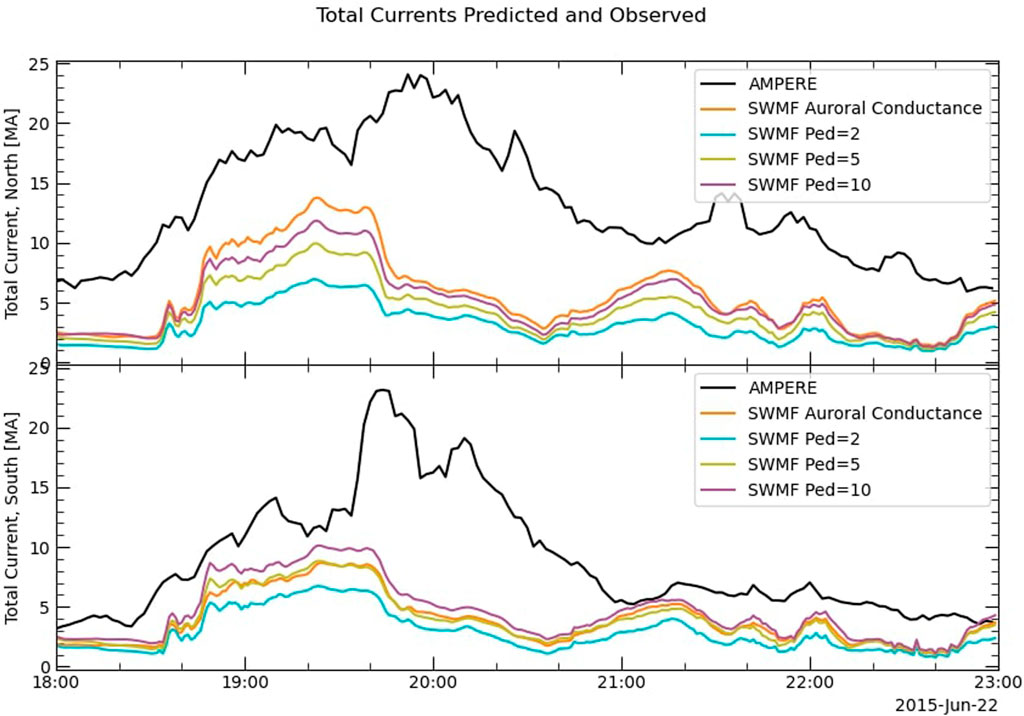
FIGURE 5. Total FACs in the northern and southern hemispheres, as predicted by the SWMF using several different ionospheric conductance models, compared with AMPERE. Similar to the currents in the LFM runs shown in Figure 3, the predicted currents differ somewhat in magnitude but not in their temporal trends, including their prediction of an increase after 21:00 UT, which is not reflected in the AMPERE currents.
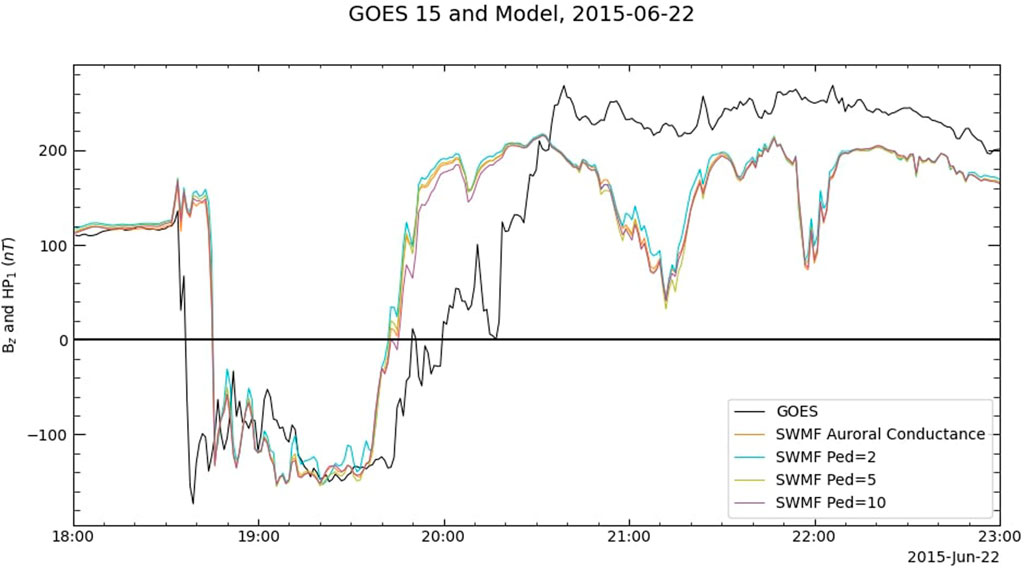
FIGURE 6. GOES 15 data and predictions by the SWMF using three different conductance models. Once again, the predictions are virtually identical among the three runs.
3.3 Results of including the RCM
Because the 22 June 2015 magnetopause crossings took place under storm-time conditions, it is reasonable to include an inner magnetosphere model such as the RCM in order to better represent the effect of the ring current. Dredger et al. (2023) present the results of doing so on the Birkeland currents and GOES 13 predictions in Figure 14 of their paper. Here, we summarize those results for convenience. The study found that, for LFM with the RCM, the magnitude of the total FAC is improved, although the model still underpredicts the peak in the southern current, while the simulated GOES 13 no longer crosses the magnetopause. The addition of the RCM does not, however, remove the spurious peak in the current at 21:00 UT, and GOES 13 still approaches the magnetopause too closely. For the SWMF with the RCM, the FAC magnitudes are improved but still fall short of the AMPERE currents. In the southern hemisphere, especially, the 21:00 UT false current increase is still prominent. Neither SWMF runs predicted any spurious crossing of the magnetopause at GOES 13 (Dredger et al., 2023).
Figure 7 shows the predictions of LFM and LFM with the RCM at the GOES 15 location compared with the real GOES data. Including the RCM improves the predictions slightly but does not remove the spurious crossing at 21:00 UT. The SWMF with the RCM also improves the GOES 15 predictions, as seen in Figure 8. The original SWMF run did not predict any spurious magnetopause crossings at GOES 15, but it did predict two magnetopause approaches, as shown by the two decreases in Bz predicted at 21:00 and 22:00 UT. Those two false dips in Bz are removed in the RCM run.
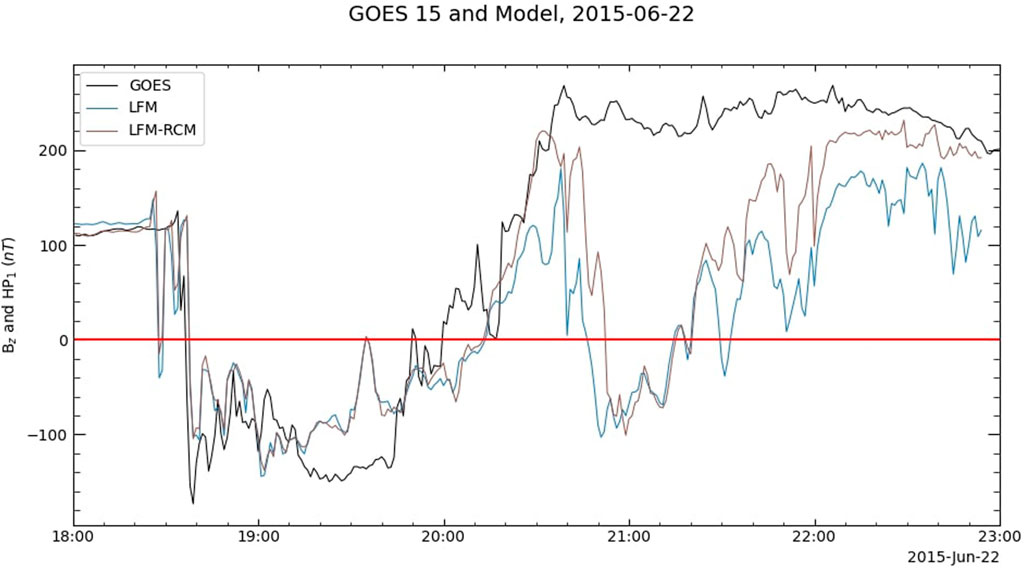
FIGURE 7. GOES 15 data and predictions by LFM both with and without the RCM. The inclusion of the RCM improves the predictions somewhat during the spurious crossings but still leaves significant differences between the real data and the predicted data.
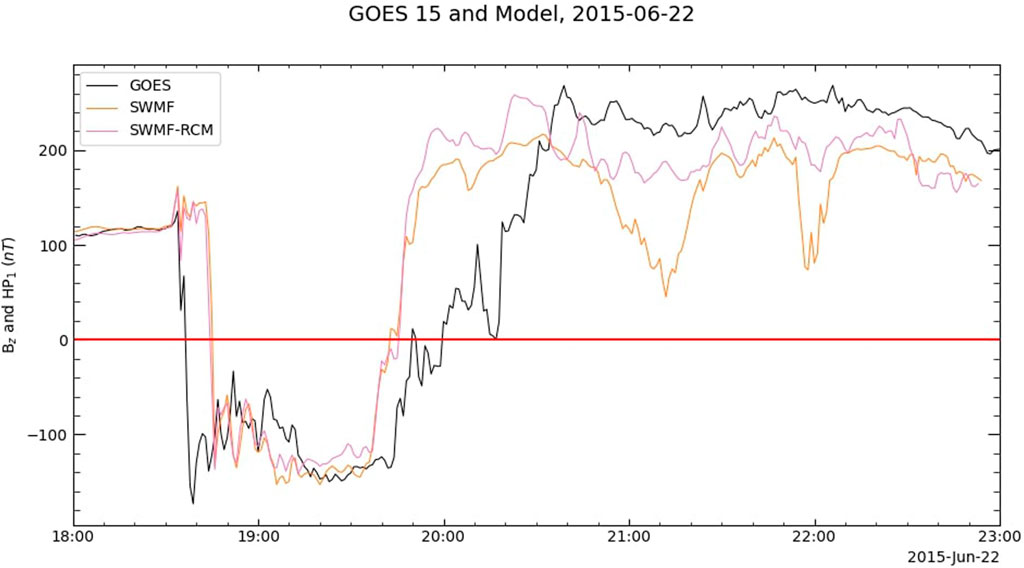
FIGURE 8. GOES 15 data and predictions by the SWMF both with and without the RCM. The inclusion of the RCM removes the two false dips in Bz at 21:00 and 22:00 UT.
The addition of the RCM coupling increased the total FACs for both models (see Figure 9), but the percent change for the SWMF run was much more significant than for the LFM run. Figure 10 shows the percent change in total FACs in both the northern and southern hemispheres for the two models. LFM–RCM reaches a 50% increase at times throughout the run, while the SWMF with the RCM shows increases of more than 200% from the basic MHD run. The SWMF FAC increase is most prominent in the southern hemisphere.
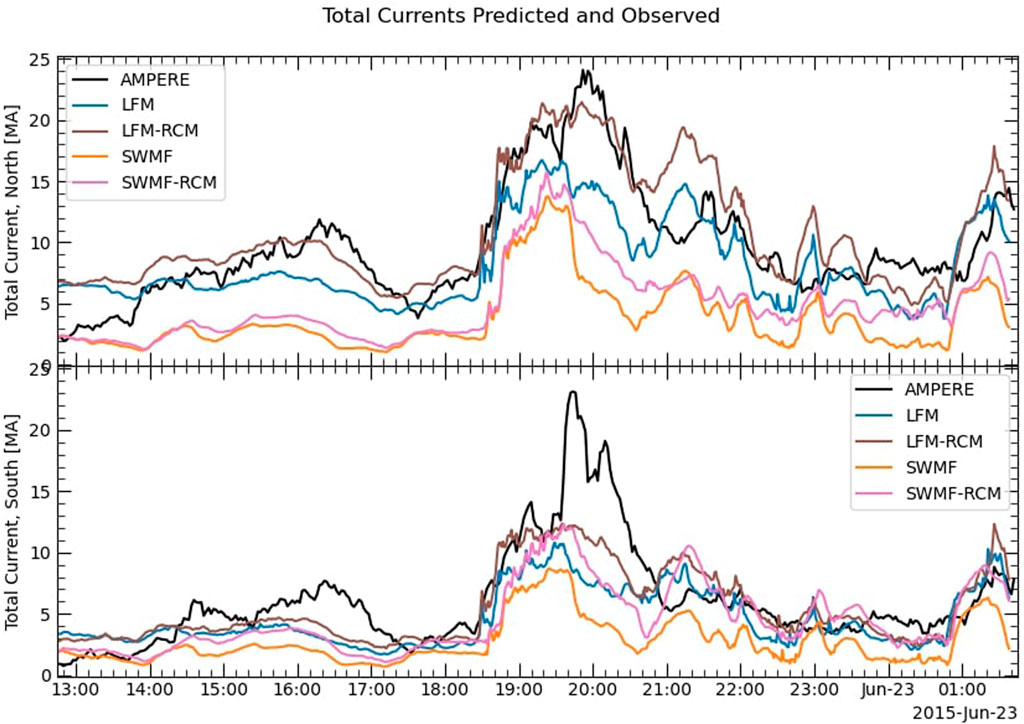
FIGURE 9. Total field-aligned currents for the basic MHD runs and the runs with the RCM coupling, for both LFM and the SWMF, in the northern and southern hemispheres.
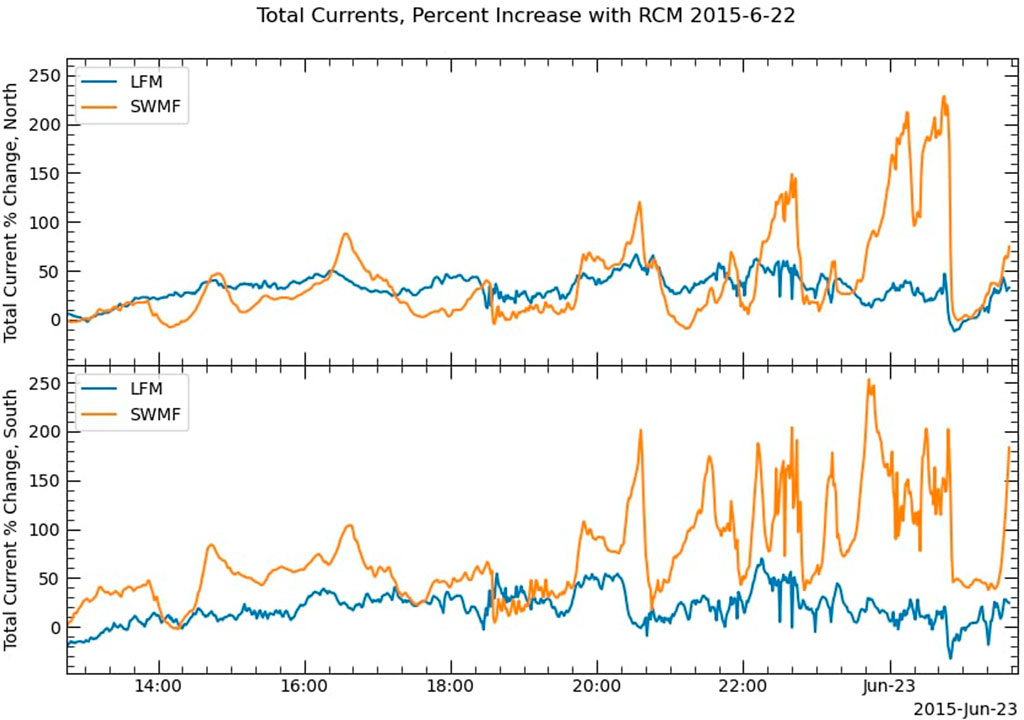
FIGURE 10. Percent change in total field-aligned currents between the basic MHD run and the run with the RCM coupling, for both LFM and the SWMF, in the northern and southern hemispheres.
The best way to compare the strength of the ring current calculated by LFM and the SWMF with the RCM would be to compare a predicted SYM-H index from both models; LFM, however, does not include this as an output at the CCMC. Therefore, for comparison, we take the strength of Bz at X = 3.5 RE and Y = Z = 0 RE, a value which scales with ring current strength since the Earth’s magnetic field points northward at that location. The results are shown in Figure 11. The decrease in Bz starting around 18:30 UT corresponds to the intense IMF that reached the magnetosphere at the same time. We can see that the SWMF responds more quickly to the change in solar wind conditions than LFM, while also predicting a bigger decrease in Bz. The difference between the two MHD runs and their corresponding RCM runs is much greater for the SWMF than for LFM, especially during the big Bz dip.
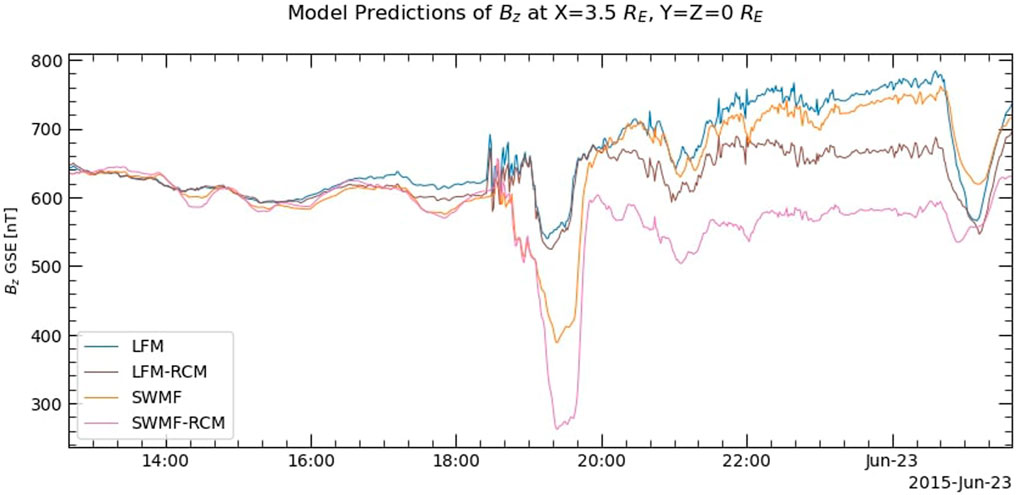
FIGURE 11. Bz at X = 3.5 RE along the Earth–Sun line for LFM and the SWMF, both with and without the RCM, providing a comparison of ring current strength among the various simulation runs. Both the SWMF runs calculate a stronger ring current than LFM runs; the difference between LFM and LFM with the RCM is much less than the difference between the SWMF with and without the RCM.
The spatial resolution of the simulation grid for the LFM runs shown in Figure 11 is significantly lower than that of the SWMF runs to which they are compared. The size of LFM cells near the geosynchronous orbit for the double-resolution runs is about 0.4 RE in each direction, while that of the corresponding SWMF cells for the 1M resolution run is 0.25 RE. The larger LFM grid cells could be causing the model to calculate weaker pressure gradients in the inner magnetosphere, and thus a weaker ring current. To investigate this possibility, the LFM runs were repeated at the two higher resolutions available at the CCMC, and those results were compared with those of the original LFM-RCM and corresponding SWMF runs. Figure 12 shows that even as the LFM resolution is increased, there is slight change in the calculated strength of Bz at X = 3.5 RE. When the RCM is included in the SWMF, the predicted ring current is much stronger than it is for LFM coupled to the RCM.
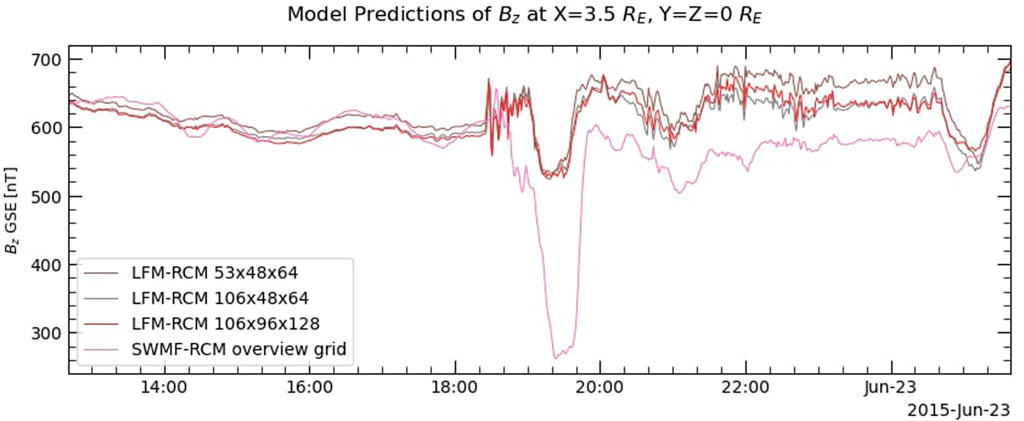
FIGURE 12. Bz at X = 3.5 RE along the Earth–Sun line for LFM–RCM at three different resolutions and the SWMF with the RCM, providing a comparison of ring current strength among the various simulation runs. Even as the spatial resolution of the LFM grid approaches that of the SWMF run, the LFM predictions of Bz do not change much and remain much higher than the SWMF predictions.
Increasing the spatial resolution of the LFM grid also has very little effect on the predictions of Bz at the GOES 15 location. Figure 13 shows the data and predictions from the three LFM–RCM runs along the GOES 15 track. There are no significant differences between the three runs: GOES 15 still crosses the magnetopause shortly before 21:00 UT, when the real satellite was far from the boundary.
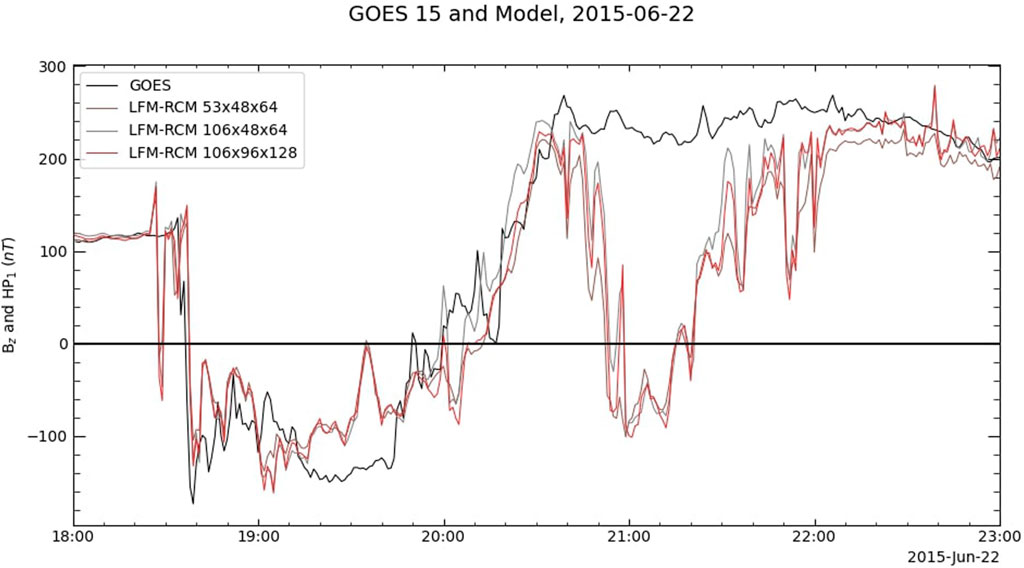
FIGURE 13. GOES 15 data and predictions from LFM-RCM at three different resolutions. Increasing the spatial resolution of the LFM grid does not substantially change the predictions along the GOES 15 track for this event.
3.4 Comparing LFM and the SWMF during quiet time
The investigation of the 22 June 2015 event raises issues regarding the models’ prediction abilities during storms, but conclusions drawn from an analysis of a storm do not necessarily apply to non-storm events, due to the significant differences between the state of the magnetosphere during storm time and during quiet time. It is, therefore, instructive to compare the LFM and SWMF predictions for 31 January 2013, a period of weak IMF and slow solar wind. Since the magnetopause only moves as far inward as the geosynchronous orbit during intense geomagnetic conditions, we use THEMIS A, D, and E, whose orbits allow them to encounter the magnetopause much farther sunward of Earth than GOES can. During the second half of January 31, all three spacecraft crossed the magnetopause more than once, although at different times. The THEMIS D and E crossings are not considered here because they occurred during a period of northward IMF Bz, so the modeled crossing times are difficult to determine. We, therefore, restrict this discussion to the THEMIS A crossing.
The IMF Bz turned southward at around 20:55 UT and remained southward for over an hour. The solar wind proton densities were moderate, remaining between 9 and 10 cm−3 during the same hour without any significant sudden increases (see Figure 14). In response to the southward turning of the IMF, even though Bz was weak, the magnetopause moved inward near the location of THEMIS A, resulting in several magnetopause crossings by the spacecraft between 21:15 and 22:05 UT. Figure 14 shows the THEMIS A observations of Bz and proton density from 20:30 to 22:30 UT with the predictions by LFM and the SWMF, at two different resolutions for each model. Comparing the lower-resolution runs of the two models, we see that LFM predicts an earlier encounter with the magnetopause, at about 21:40 UT, than the SWMF does at 22:05 UT.
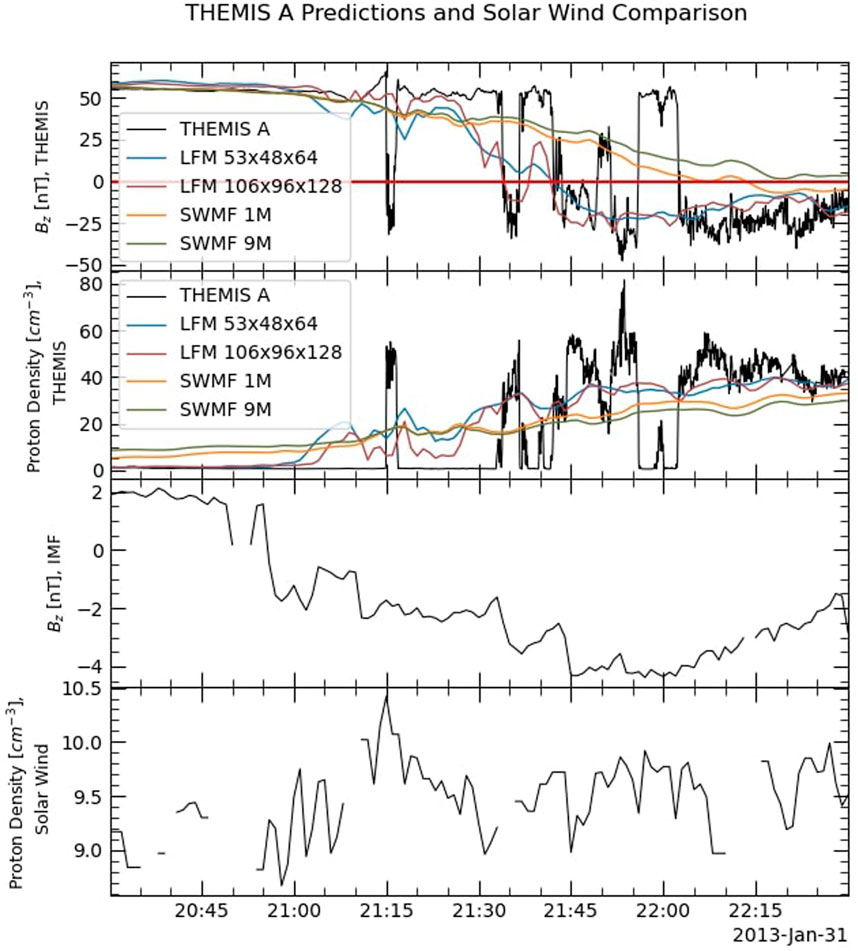
FIGURE 14. THEMIS A observations and predictions with contemporary solar wind conditions. From the top to bottom: THEMIS A Bz and proton densities, as observed by the spacecraft and predicted by LFM and the SWMF at two different resolutions each; IMF Bz and solar wind proton density during the THEMIS A magnetopause crossings.
The total FACs are plotted in Figure 15 for two resolutions of LFM and of the SWMF, with the AMPERE data for reference. The integrated FACs from AMPERE are less than 1 MA throughout the event, apart from brief increases like the one in the northern hemisphere at 17:00 UT. Neither LFM nor the SWMF reproduces those increases. The LFM FACs are consistently stronger than those from the SWMF for all resolutions. In response to the southward turning of the IMF after 20:55 UT, the total FACs in both hemispheres increase as IMF Bz remains negative, when the magnetopause moved inward over the position of THEMIS A.
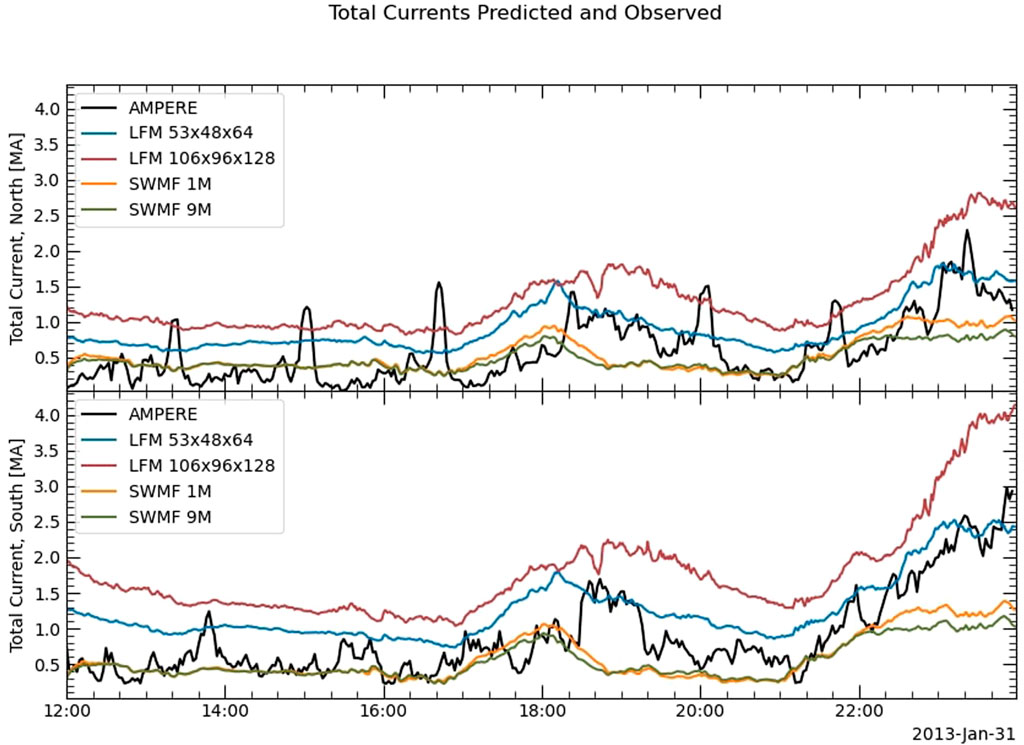
FIGURE 15. AMPERE integrated field-aligned currents for the northern and southern hemispheres, with the predictions from LFM and the SWMF at two different resolutions. The LFM currents for both runs are significantly higher than those from the SWMF.
Although increasing the spatial resolution of the MHD grid did not affect the GOES 15 LFM predictions for the 22 June 2015 event, changing the LFM grid from double (53 × 48 × 64) resolution to quad (106 × 96 × 128) resolution improves the THEMIS A predictions. In the quad-resolution run, the model captures the crossings around 21:35 UT that it had previously missed. The total FACs predicted by LFM at quad resolution are stronger than those predicted by the double-resolution run and also stronger than the AMPERE FACs. On the other hand, an increase from 1M to 9M cells does not significantly change the SWMF predictions for either the THEMIS A location or the integrated FACs.
4 Discussion
For the storm on 22 June 2015, LFM predicts a false magnetopause crossing by GOES 15, and the SWMF predicts two close magnetopause approaches that are not reflected in the real observations. LFM and the SWMF were run with several different ionospheric conductance models, including auroral conductances and several different values of constant conductance. However, changing the method by which the conductance is calculated does not seem to significantly affect the predictions along the GOES 15 track, although it does have a small effect on the magnitude of the integrated Birkeland currents. Of more interest are the improvements to the predictions when the MHD models are coupled to the RCM. LFM shows small improvements in the GOES 15 predictions but is overall not strongly affected by the RCM coupling. The GOES 15 predictions from the SWMF, on the other hand, show significant improvement since the magnetopause approaches around 21:00 and 22:00 UT are essentially removed. In the ionosphere, the integrated FACs from the SWMF have a greater percent increase than those from LFM, although the LFM currents have a greater overall magnitude [see Figure 9 of Dredger et al. (2023)].
The discrepancy between the responses of the two sets of predictions can be explained by the findings shown in Figure 11. The strength of the ring current calculated by the SWMF with the RCM is much greater than that of LFM–RCM. The ring current’s connection with the Region 2 FACs means that the SWMF with the RCM sees a greater fractional increase in the total FACs than LFM does. The stronger ring current pushes the magnetopause outward and leaves GOES 15 inside the magnetosphere, where it was observed to be. For this storm, at least, the SWMF better predicts the location of the magnetopause than does LFM, most likely because of the difference in the intensity of the calculated ring current between the two models.
During the THEMIS A magnetopause crossings on 31 January 2013, the LFM predictions along the THEMIS A track more closely match the observations than the SWMF predictions do. Considering for a moment only the lower-resolution runs of both models, we see that LFM predicts a magnetosheath entry a few minutes before 21:45 UT, which corresponds to a real boundary crossing, while the SWMF does not predict that THEMIS encounters the magnetopause until 22:05 UT. The integrated Birkeland currents predicted by LFM are stronger than those predicted by the SWMF, which seems to have resulted in more dayside magnetopause erosion in the LFM results. The primary driver of magnetopause motion during this period was the IMF Bz since the solar wind density was not changing significantly. The SWMF also predicts lower FAC values than LFM does during the 22 June 2015 storm (see Figures 3, 5), although the analysis of the predicted FACs for that event is complicated by the effects of the ring current on the Region 2 FACs.
Unlike the storm event, increasing the spatial resolution of the LFM grid for the simulation of the 31 January 2013 event makes a significant difference in the predictions along the spacecraft track. The quad-resolution run predicts the inward and then outward motion of the magnetopause over the THEMIS A position at 21:35 UT, improving over the double-resolution predictions at that time, although still missing several other brief crossings. The predicted total FACs also increase in magnitude. The SWMF predictions, however, hardly differ at all between the 1M run and the 9M run, both at THEMIS and for the total FACs. A primary reason for the change in the LFM THEMIS predictions but not in the SWMF predictions is most likely the difference in grid structure for the two models. When LFM resolution is increased, the spatial resolution changes globally, affecting all cells on the grid; at THEMIS A, the cell size ranges from 0.3 RE × 0.57 RE × 0.5 RE (approximately) at double resolution to 0.1 RE × 0.4 RE × 0.35 RE at quad resolution. For the SWMF, on the other hand, the MHD grid is block-adaptive, so naïvely changing the resolution of the grid does not always result in a different cell size in the region of interest. In this case, the cell size at THEMIS A is 0.5 RE × 0.5 RE × 0.5 RE for both the 1M cell run and the 9M cell run, although the cell size changes in other regions of the magnetosphere. Users of the SWMF who may not be familiar with the grid structure should be aware of this when conducting research with the CCMC’s Runs-on-Request tool.
The discrepancy between the effect of increasing LFM grid resolution during the June 2015 storm and the January 2013 event may stem from the fact that the solar wind conditions for the two events differ greatly in intensity. If solar wind densities are so strong that the real magnetopause is pushed in all the way past geosynchronous orbit, a somewhat uncommon situation, the MHD models will almost certainly predict that the magnetopause moves very far inward toward Earth. The THEMIS crossings considered here, on the other hand, take place during weak solar wind and IMF conditions, and the boundary is not being driven in suddenly by high densities. Rather, the magnetopause remains within a handful of RE of the spacecraft for at least an hour, so any small motions back and forth are observed by THEMIS. Under such circumstances, a smaller cell size becomes more essential for capturing magnetopause motion than during one great push of the boundary across the position of the spacecraft. It, thus, seems likely that higher LFM grid resolution is more important, at least from the point of view of predicting magnetopause motion, for studying events with weak or moderate conditions than for intense storms, especially those with high solar wind densities.
5 Conclusion
In this study, we have investigated the performance of two MHD models, LFM and the SWMF, and their ability to predict magnetopause motion by comparing simulation results along a satellite track to the observations of a real satellite that crossed the magnetopause. We considered two events, a storm on 22 June 2015 and a quiet period on 31 January 2013. During the 2015 storm, GOES 15 crossed the magnetopause, and both LFM and the SWMF predicted spurious magnetopause approaches to the GOES 15 position. Coupling an inner magnetosphere model, RCM, to the MHD models improves the GOES track predictions more noticeably for the SWMF than for LFM, while changing the ionospheric conductance model hardly affected the GOES predictions for either model. The SWMF calculates a stronger ring current than LFM does, both with and without the RCM coupling, and including the RCM gives the SWMF a greater fractional increase in the total field-aligned currents than LFM. During the non-storm event, LFM better captures the observed magnetopause motion at the location of THEMIS A and calculates stronger total FACs than the SWMF does. Increasing the spatial resolution of the LFM grid has little effect on the GOES predictions during the storm but noticeably improves the predictions along the THEMIS A track. The increase in resolution for the SWMF during the quiet time event has no effect because the grid size at the THEMIS A location does not change between runs. Overall, with respect to prediction of magnetopause motion, LFM outperforms the SWMF during the quiet-time event, while the SWMF is more accurate during the intense geomagnetic storm.
Data availability statement
The original contributions presented in the study are included in the article/Supplementary Material; further inquiries can be directed to the corresponding author.
Author contributions
All authors contributed to the analysis of the events studied. PD is the principal author of the text of the paper; the other authors edited and contributed to the text. All authors contributed to the article and approved the submitted version.
Funding
We acknowledge the support of the US National Science Foundation (NSF) under grant no. 1916604. We also acknowledge the support of the National Aeronautics and Space Administration (NASA) under grant nos 80NSSC19K1670 and 80NSSC20K0606 [The Center for the Unified Study of Interhemispheric Asymmetries (CUSIA)].
Acknowledgments
Simulation results have been provided by the Community Coordinated Modeling Center at the Goddard Space Flight Center through their public Runs-on-Request system (http://ccmc.gsfc.nasa.gov). The LFM model was developed by John Lyon et al. at Dartmouth College/NCAR-HAO/JHU-APL/CISM. This work was carried out using the SWMF and BATS-R-US tools developed at the University of Michigan’s Center for Space Environment Modeling (CSEM). The modeling tools described in this publication are available online through the University of Michigan for download and are available for use at the Community Coordinated Modeling Center (CCMC).
Conflict of interest
The authors declare that the research was conducted in the absence of any commercial or financial relationships that could be construed as a potential conflict of interest.
Publisher’s note
All claims expressed in this article are solely those of the authors and do not necessarily represent those of their affiliated organizations, or those of the publisher, the editors, and the reviewers. Any product that may be evaluated in this article, or claim that may be made by its manufacturer, is not guaranteed or endorsed by the publisher.
References
Anderson, B. J., Korth, H., Waters, C. L., Green, D. L., Merkin, V. G., Barnes, R. J., et al. (2014). Development of large-scale birkeland currents determined from the active magnetosphere and planetary electrodynamics response experiment. Geophys. Res. Lett. 41, 3017–3025. doi:10.1002/2014GL-059941
Anderson, B. J., Takahashi, K., Kamei, T., Waters, C. L., and Toth, B. A. (2002). Birkeland current system key parameters derived from iridium observations: Method and initial validation results. J. Geophys. Res. Space Phys. 107, SMP 11–1–SMP 11–13. doi:10.1029/2001JA000080
Angelopoulos, V. (2008). The THEMIS mission. Space Sci. Rev. 141, 5–34. doi:10.1007/s11214-008-9336-1
Aubry, M. P., Russell, C. T., and Kivelson, M. G. (1970). Inward motion of the magnetopause before a substorm. J. Geophys. Res. 75, 7018–7031. doi:10.1029/JA075i034p07018
Collado-Vega, Y. M., Dredger, P. M., Lopez, R. E., Khurana, S., Rastaetter, L. M., Sibeck, D., et al. (2023). Magnetopause standoff position changes and geosynchronous orbit crossings: Models and observations. Space weather. 21. doi:10.1029/2022SW003212
Daglis, I. A. (2006). Ring current dynamics. Space Sci. Rev. 124, 183–202. doi:10.1007/s11214-006-9104-z
Dickinson, R. E., Ridley, E. C., and Roble, R. G. (1981). A three-dimensional general circulation model of the thermosphere. J. Geophys. Res. Space Phys. 86, 1499–1512. doi:10.1029/JA086iA03p01499
Dmitriev, A., Suvorova, A., and Chao, J. (2011). A predictive model of geosynchronous magnetopause crossings. J. Geophys. Res. Space Phys. 116. doi:10.1029/2010JA016208
Dredger, P. M., Lopez, R. E., Collado-Vega, Y. M., Khurana, S., and Rastaetter, L. M. (2023). Investigating potential causes for the prediction of spurious magnetopause crossings at geosynchronous orbit in MHD simulations. Space weather. 21. doi:10.1029/2022SW003266
Hogan, B., Lotko, W., and Pham, K. (2020). Alfvénic thermospheric upwelling in a global geospace model. J. Geophys. Res. Space Phys. 125, e2020JA028059. doi:10.1029/2020ja028059
Liu, J., Wang, W., Qian, L., Lotko, W., Burns, A. G., Pham, K., et al. (2021). Solar flare effects in the Earth’s magnetosphere. Nat. Phys. 17, 807–812. doi:10.1038/s41567-021-01203-5
Lyon, J., Fedder, J., and Mobarry, C. (2004). The Lyon–Fedder–Mobarry (LFM) global MHD magnetospheric simulation code. J. Atmos. Solar-Terrestrial Phys. 66, 1333–1350. doi:10.1016/j.jastp.2004.03.020
Maltsev, Y. P., Arykov, A. A., Belova, E. G., Gvozdevsky, B. B., and Safargaleev, V. V. (1996). Magnetic flux redistribution in the storm time magnetosphere. J. Geophys. Res. Space Phys. 101, 7697–7704. doi:10.1029/95JA03709
Maltsev, Y. P., and Lyatsky, W. B. (1975). Field-aligned currents and erosion of the dayside magnetosphere. Planet. Space Sci. 23, 1257–1260. doi:10.1016/0032-0633(75)90149-x
Martyn, D. F. (1951). The theory of magnetic storms and auroras. Nature 167, 984–985. doi:10.1038/167984b0
Merkin, V. G., and Lyon, J. G. (2010). Effects of the low-latitude ionospheric boundary condition on the global magnetosphere. J. Geophys. Res. Space Phys. 115. doi:10.1029/2010JA015461
NASA CDAWeb Development Team (2019). CDAWeb: Coordinated data analysis web. Astrophysics Source Code Library.
Pembroke, A., Toffoletto, F., Sazykin, S., Wiltberger, M., Lyon, J., Merkin, V., et al. (2012). Initial results from a dynamic coupled magnetosphere-ionosphere-ring current model. J. Geophys. Res. Space Phys. 117. doi:10.1029/2011JA016979
Pham, K. H., Lopez, R. E., and Bruntz, R. (2016). The effect of a brief northward turning in IMF Bz on solar wind-magnetosphere coupling in a global MHD simulation. J. Geophys. Res. Space Phys. 121, 4291–4299. doi:10.1002/2015JA021982
Pham, K. H., Lotko, W., Varney, R. H., Zhang, B., and Liu, J. (2021). Thermospheric impact on the magnetosphere through ionospheric outflow. J. Geophys. Res. Space Phys. 126, e2020JA028656. doi:10.1029/2020ja028656
Powell, K. G., Roe, P. L., Linde, T. J., Gombosi, T. I., and De Zeeuw, D. L. (1999). A solution-adaptive upwind scheme for ideal magnetohydrodynamics. J. Comput. Phys. 154, 284–309. doi:10.1006/jcph.1999.6299
Qian, L., Burns, A. G., Emery, B. A., Foster, B., Lu, G., Maute, A., et al. (2014). The NCAR TIE-GCM. chap 7, 73–83. doi:10.1002/9781118704417.ch7
Ridley, A., Gombosi, T., and Dezeeuw, D. (2004). Ionospheric control of the magnetosphere: Conductance. Ann. Geophys. 22, 567–584. doi:10.5194/angeo-22-567-2004
Ridley, A. J., De Zeeuw, D. L., Gombosi, T. I., and Powell, K. G. (2001). Using steady state mhd results to predict the global state of the magnetosphere-ionosphere system. J. Geophys. Res. Space Phys. 106, 30067–30076. doi:10.1029/2000JA002233
Ridley, A. J., and Liemohn, M. W. (2002). A model-derived storm time asymmetric ring current driven electric field description. J. Geophys. Res. Space Phys. 107, SMP 2–1–SMP 2–12. doi:10.1029/2001JA000051
Roble, R. G., Ridley, E. C., Richmond, A. D., and Dickinson, R. E. (1988). A coupled thermosphere/ionosphere general circulation model. Geophys. Res. Lett. 15, 1325–1328. doi:10.1029/GL015i012p01325
Sibeck, D. G. (1995). Demarcating the magnetopause boundary. Rev. Geophys. 33, 651–655. doi:10.1029/95rg00285
Sibeck, D. G., Lopez, R. E., and Roelof, E. C. (1991). Solar wind control of the magnetopause shape, location, and motion. J. Geophys. Res. 96, 5489–5495. doi:10.1029/90JA02464
Toffoletto, F., Sazykin, S., Spiro, R., and Wolf, R. (2003). Inner magnetospheric modeling with the Rice convection model. Space Sci. Rev. 107, 175–196. doi:10.1023/A:1025532008047
Tóth, G., Sokolov, I. V., Gombosi, T. I., Chesney, D. R., Clauer, C. R., De Zeeuw, D. L., et al. (2005). Space weather modeling framework: A new tool for the space science community. J. Geophys. Res. Space Phys. 110, A12226. doi:10.1029/2005JA011126
Tóth, G., van der Holst, B., Sokolov, I. V., De Zeeuw, D. L., Gombosi, T. I., Fang, F., et al. (2012). Adaptive numerical algorithms in space weather modeling. J. Comput. Phys. 231, 870–903. doi:10.1016/j.jcp.2011.02.006
Wang, W., Wiltberger, M., Burns, A., Solomon, S., Killeen, T., Maruyama, N., et al. (2004). Initial results from the coupled magnetosphere–ionosphere–thermosphere model: Thermosphere–ionosphere responses. J. Atmos. Solar-Terrestrial Phys. 66, 1425–1441. doi:10.1016/j.jastp.2004.04.008
Wiltberger, M., Lopez, R., and Lyon, J. (2003). Magnetopause erosion: A global view from mhd simulation. J. Geophys. Res. Space Phys. 108, 1235. doi:10.1029/2002ja009564
Wiltberger, M., Wang, W., Burns, A., Solomon, S., Lyon, J., and Goodrich, C. (2004). Initial results from the coupled magnetosphere ionosphere thermosphere model: Magnetospheric and ionospheric responses. J. Atmos. Solar-Terrestrial Phys. 66, 1411–1423. doi:10.1016/j.jastp.2004.03.026
Wiltberger, M., Weigel, R. S., Lotko, W., and Fedder, J. A. (2009). Modeling seasonal variations of auroral particle precipitation in a global-scale magnetosphere-ionosphere simulation. J. Geophys. Res. Space Phys. 114. doi:10.1029/2008JA-013108
Wolf, R. A., Harel, M., Spiro, R. W., Voigt, G.-H., Reiff, P. H., and Chen, C.-K. (1982). Computer simulation of inner magnetospheric dynamics for the magnetic storm of july 29, 1977. J. Geophys. Res. Space Phys. 87, 5949–5962. doi:10.1029/JA087iA08p-05949
Keywords: magnetohydrodynamics, ring current, modeling, magnetopause, field-aligned currents
Citation: Dredger PM, Lopez RE and Collado-Vega YM (2023) Comparing magnetopause predictions from two MHD models during a geomagnetic storm and a quiet period. Front. Astron. Space Sci. 10:1213331. doi: 10.3389/fspas.2023.1213331
Received: 27 April 2023; Accepted: 13 July 2023;
Published: 02 August 2023.
Edited by:
Joseph Huba, Syntek Technologies, United StatesReviewed by:
John Lyon, Dartmouth College, United StatesOctav Marghitu, Space Science Institute, Romania
Copyright © 2023 Dredger, Lopez and Collado-Vega. This is an open-access article distributed under the terms of the Creative Commons Attribution License (CC BY). The use, distribution or reproduction in other forums is permitted, provided the original author(s) and the copyright owner(s) are credited and that the original publication in this journal is cited, in accordance with accepted academic practice. No use, distribution or reproduction is permitted which does not comply with these terms.
*Correspondence: Pauline M. Dredger, cGF1bGluZS5kcmVkZ2VyQG1hdnMudXRhLmVkdQ==
 Pauline M. Dredger
 Ramon E. Lopez
 Yaireska M. Collado-Vega2