- 1Deep Space Exploration Laboratory, Hefei, China
- 2Center for Excellence in Comparative Planetology, Chinese Academy of Sciences (CAS), Hefei, China
- 3Center for Lunar and Planetary Sciences, Institute of Geochemistry CAS, Guiyang, China
- 4Key Laboratory of Computational Geodynamics, College of Earth and Planetary Sciences, University of Chinese Academy of Sciences, Beijing, China
The internal heat flow related to the Moon’s composition, interior structure, and evolution history is not well-constrained and understood on a global scale. Up to now, only two in situ heat flow experiments, Apollo 15 and 17 were deployed nearly 50 years ago. The measured high values of heat flow might be influenced by lateral heat at highland/mare boundaries and enhanced by heat production from radioactive elements enriched unit, and may also be disturbed by astronauts’ activities. In this study, we proposed a new method to retrieve heat flows at two permanently shadowed craters, Haworth and Shoemaker of the Moon’s south pole, from Chang’E-2 microwave radiometer data and Diviner observations. Our results show that the average heat flow is 4.9 ± 0.2 mW/m2. This provides a constraint for the bulk concentration of Thorium within the lunar south polar crust 656 ± 54 ppb, which helps us understand the Moon’s thermal evolution and differentiation.
1 Introduction
The interior heat flow provides a direct method for constraining the bulk abundance of radiogenic elements (e.g., U, Th, and K) which helps us to understand the differentiation and thermal history of the Moon (Langseth et al., 1976; Warren and Rasmussen, 1987; Wieczorek and Phillips, 2000; Siegler and Smrekar, 2014). The accurate interpretation of internal heat flow is also important to understand the volcanic history of the Moon such as the occurrence of moderately fresh “Irregular Mare Patches” (Qiao et al., 2021). Nearly 50 years ago, only two in situ heat flow experiments (HFEs) at the Hadley Rille and Taurus-Littrow during Apollo 15 and 17 missions obtained values of 21 ± 3 and 14 ± 2 mW/m2, respectively (Langseth et al., 1976). However, the radiogenic elements enriched unit, Procellarum potassium, rare earth element, and phosphorus (KREEP) Terrane (PKT) (Jolliff et al., 2000), which extends to Apollo 15 landing site that likely contributes 5 ± 2 mW/m2 to the heat flow value (Wieczorek and Phillips, 2000) and even might affect Apollo 17 heat flow measurement (Siegler and Smrekar, 2014). In addition, the two landing sites located at the boundary between the highlands and maria could also cause an additional 15%–20% heat flow (Warren and Rasmussen, 1987) and the uncertainty of the regolith thermal conductivity (Grott et al., 2010). It is worth noting that astronaut-induced surface regolith disturbance may also lead to an increase in its temperature due to the darkened surface in addition to altering the regolith texture and surface photometric properties (Nagihara et al., 2018). This might need 5–7 years to reach the equilibrium state (Langseth et al., 1976).
Langseth et al. (1976) estimated the global average heat flow value as 18 ± 2 mW/m2 based on Th concentration, but they still cautioned that further data should be obtained to estimate the global average value. Warren and Rasmussen (1987) considered the effects of insulation of mega regolith on lunar thermal evolution and revised the global average value to 12 ± 2 mW/m2. Nevertheless, some researchers proposed that the measured Apollo heat flows might not be representative which overestimates the global average heat flow by up to a factor of 3 due to thermal pathways and heat-producing material of the top ∼100 km of the Moon (Warren and Rasmussen, 1987; Wieczorek and Phillips, 2000; Hagermann and Tanaka, 2006; Saito, 2008). Therefore, it has been concluded that the current heat flow data is not enough to constrain the thermal state of the Moon with a 100% confidence (Hagermann and Tanaka, 2006), and the limited location of Apollo HFEs emphasizes the importance of additional, geophysical different observations to better constrain the Moon’s heat flow, which has been recognized as a high priority lunar science objective (Kiefer, 2012).
After Apollo, planetary heat flow mapping was focused on the potential of orbiting microwave radiometer experiments (Keihm and Langseth, 1975; Schloerb et al., 1976; Keihm, 1984; Siegler and Smrekar, 2014). Some efforts of spectral gradients and regolith physical properties are combined to interpret ground-based microwave observations for deriving heat flow (Keihm and Langseth, 1975), which unfortunately, no orbital exploration mission has been reported as of yet. Since the long-term subsurface temperature drift of Apollo HFEs was thought to stem from the astronaut activity (Langseth et al., 1976), the regolith-uninterrupted orbital microwave observations have the advantage and capability to extend the HFE to a global scale remotely. Because the temperature in the upper 1.5 m of the sunlit regolith is strongly affected by the diurnal or annual thermal waves (Kiefer, 2012), permanently shadowed regions (PSRs) of lunar poles are supposed to be ideal places to map lunar heat flow from orbit (Paige et al., 2010; Paige and Siegler, 2016). Since there is no direct solar heat perturbation within PSRs (but could be warmed up by reflected sunlight and thermal infrared radiation from surrounding crater walls), the heat flow plays an important role in the near-surface temperature (Paige et al., 2010; Paige and Siegler, 2016). This can be sensed by microwave observations which help us to characterize the lunar near-surface thermal environment and retrieve interior heat flow. Additionally, because of the large penetration depth of microwaves, the plausible buried water ice at PSRs could also be revealed by subsurface thermal regime measurements (Meng et al., 2010), which provides landing site selection for future polar missions (e.g., De Rosa et al., 2012; Wei et al., 2023).
In this study, we propose a new method to combine the Diviner and Chang’E-2 (CE-2) microwave data to retrieve heat flow at PSRs of the Moon’s south pole. In Section 2, we first use nearly 10 years (from 5 July 2009, to 17 Feb 2019) of the Diviner measurements (Paige et al., 2010; Elder et al., 2019) as surface temperature constraints to improve the thermal model. Then we model microwave emission with different heat flows to match CE-2’s Microwave Radiometer (MRM) observations (Zheng et al., 2019). Lastly, we can search for the best heat flow value from different MRM channels’ data. In Section 3, we present the retrieved heat flow at two permanently shadowed craters. A detailed discussion of possible factors that influence our inversion results is presented in Section 4 and a conclusion is followed in Section 5.
2 Dataset and methodology
2.1 Chang’E-2 microwave radiometer data
Microwave Radiometer onboard CE-2 measured lunar surface with four channels
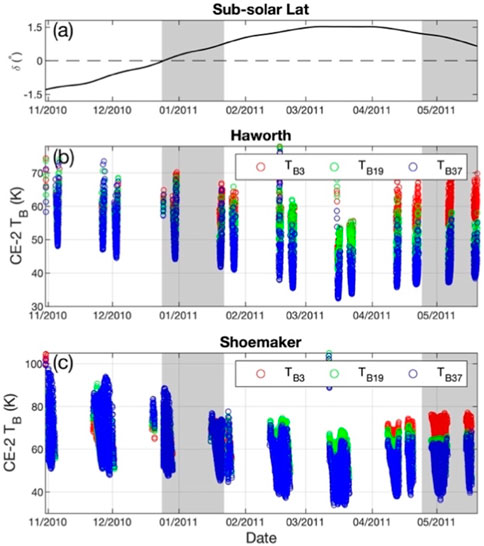
FIGURE 1. Seasonal variations of CE-2 observations at permanently shadowed craters of the Moon’s south pole. (A) is the variation of the sub-solar latitude during the CE-2 mission. The dashed line denotes the equator. (B) and (C) are variations of TB3, TB19 and TB37 near the bottom of Haworth and Shoemaker, respectively. The time span covered by gray areas indicates the observations used in this study.
Considering the relatively small seasonal effect and more MRM data coverage during southern winter, both Diviner and MRM data obtained within this season are selected. Although the MRM observations present an apparent seasonal variation, the potential calibration issues due to CE-2 reorientation on the cold horn (a set of calibration antennas pointing to cold space for reference) for terminator orbits (Feng et al., 2020) between 22 Jan 2011, and 24 April 2011, were excluded. Thus, the data points near the bottom of Haworth and Shoemaker during southern winter are selected which are shown in the gray areas of Figure 1.
2.2 Diviner data
The Diviner Lunar Radiometer (Diviner (Paige et al., 2010)) onboard the Lunar Reconnaissance Orbiter systematically maps lunar surface thermal environment for more than 10 years since July 2009 (Williams et al., 2019). Diviner including 9 channels was designed to measure reflected solar radiation (each of the first two channels 0.35–2.8 μm) and infrared emission (other seven channels range from 7.55 to 400 μm) with a spatial resolution of ∼200 m globally (Paige et al., 2010). Recently, the bolometric brightness temperature (Tbol) covering polar regions generated from nearly 10 years of Diviner measurements have been compiled into diurnal temperatures at southern summer/winter according to the variation of sub-solar latitudes (Williams et al., 2019). In our study, the Tbol data within southern winter corresponding to CE-2 observations were used as surface thermal constraints for the thermal model. And the southern summer Tbol data were used to investigate the maximum seasonal effect on the thermal stability of water ice in the lunar south polar region.
2.3 Improved thermal model
We use the one-dimensional thermal model to calculate the lunar polar subsurface temperatures (Vasavada, 1999; Paige et al., 2010; Vasavada et al., 2012; Hayne et al., 2017).
where T is the temperature, z is the depth,
In order to solve the thermal model, we also need to input the surface temperature and interior heat flow. The thermal environment in polar regions is complex due to the complex illuminating conditions (Bussey et al., 2010; Mazarico et al., 2011; Gläser et al., 2014). Paige et al. (2010) modeled the Sun, the Earth, and the Moon as triangular meshes and used the ray tracing method to calculate lunar polar surface/subsurface temperatures at 500 m resolution. However, the simulation still presented about 15 K lower within PSRs than that of Diviner measurements during the daytime. The discrepancy is supposed to be caused by a directionally anisotropic thermal emission (Paige et al., 2010). In this study, we use diurnal variations of Tbol as input to constrain surface temperature instead of theoretical calculating to derive the subsurface temperatures (Wei et al., 2019; Schorghofer and Williams, 2020).
2.4 Scheme of heat flow inversion
The upper limit heat flow at “Region 5,” an unnamed 3 km diameter and extremely cold crater (87.0°S, 15.3°E) which is located to the east of Haworth crater (see Figure 3) was retrieved from Diviner data (Paige and Siegler, 2016). In order to calculate the heat flow-dependent (lower boundary of Eq. 1) subsurface temperature with an unknown heat flow value, we set the upper limit heat flow as 24 mW/m2 based on the maximum value of Apollo 15 HFE instead of Region 5’s 6 mW/m2. Thus, the heat flow can be inverted in the following steps. 1) Computing annual averaged (southern winter) subsurface temperatures with heat flows from 0 to 24 mW/m2. 2) Modeling TB based on the above temperature profiles (Wei et al., 2019; Feng et al., 2020; Siegler et al., 2020). 3) Match the modeled TB and CE-2 observations and search for the best-fit heat flow value. Noting that although both the MRM observations and Diviner constrained simulations cover the same study area, they have different spatial resolutions and observation time ranges. Therefore, it could cause uncertainty by matching the modeled TB and CE-2 observations directly. Here, we propose the following equation (Eq. 2) to minimize the discrepancy of TB matching
where the TB-dependent ratio (
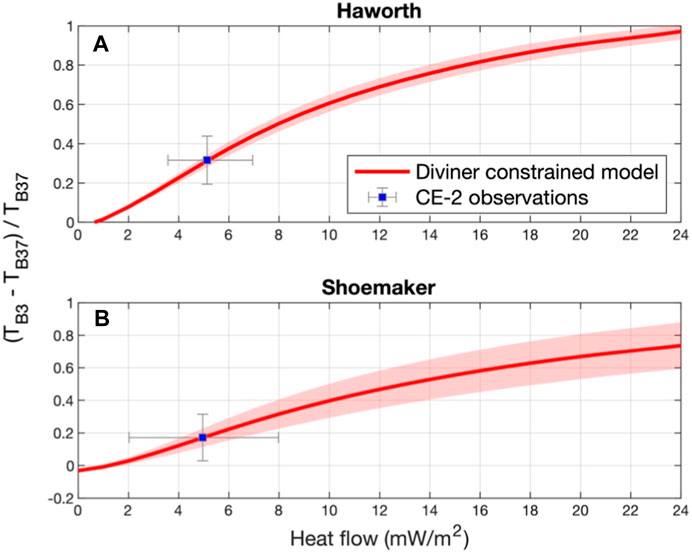
FIGURE 2. Comparison of
Note that the interior heat flow plays a part in near-surface temperature at PSRs and can be recorded by infrared measurements and microwave observations. However, compared to Diviner’s infrared measurements at PSRs (Paige and Siegler, 2016), the longer wavelength of the microwave radiometer can sense greater depths for interior heat flow. Additionally, the discrepancy of spatial resolution between 3 GHz (25 km) and 19.35 GHz or 37 GHz (17.5 km) channels can be neglected because 1) the thermal environment including heat flow is supposed to be homogeneous for each MRM’s field of view, and 2) the diurnal averaged TB including all the data points covering the study area were derived for calculating
3 Results
3.1 Lunar polar heat flow
To minimize the scattering effect, we select the data points near the bottom of each crater after filtering the southern winter data set. Figure 3 shows the modeled annually averaged Sun illumination of the lunar south polar region. The study area of the Haworth crater is 15–5°W, 87–88°S, and the Shoemaker’s is 20–50°E, 87.3–88.6°S. It can be seen that the study areas enclosed by trapezoids at Haworth and Shoemaker present an extremely low illumination rate. Which indicates ideal places for heat flow inversion. The location of “Region 5” investigated by Paige and Siegler (2016) is also labeled in Figure 3 (white circle) which is near both of our study areas.
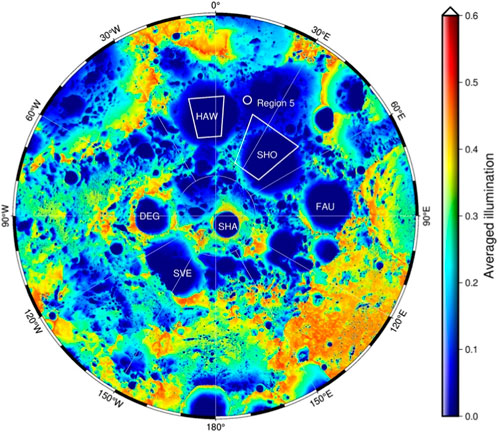
FIGURE 3. Annually averaged Sun illumination of the Moon’s south pole (>85°S). The white trapezoids indicate study areas. HAW and SHO denote Haworth and Shoemaker, respectively. Other listed permanently shadowed craters are Shackleton (SHA), Faustini (FAU), De Gerlache (DEG), and Sverdrup (SVE). The white circle indicates “Region 5” which is supposed to have an upper limit heat flow value of 6 mW/m2 (Paige and Siegler, 2016). The spatial resolution of the illumination map is 60 m/pixel, which is available at http://imbrium.mit.edu/.
Based on Eq. 2, ratios of
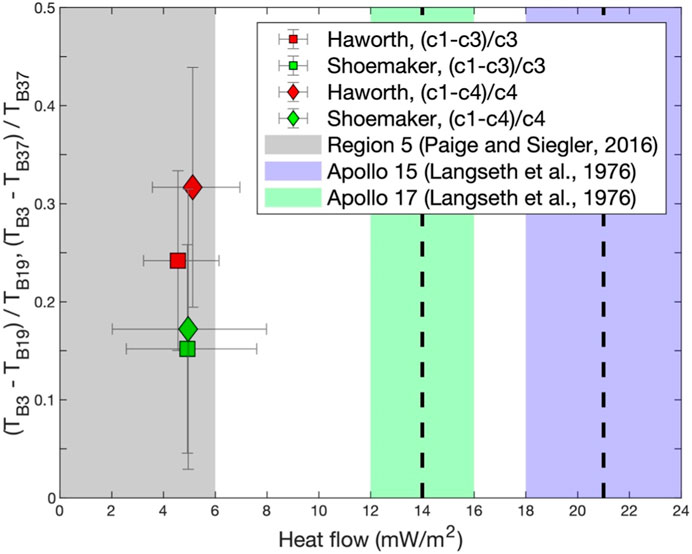
FIGURE 4. Retrieved heat flow at Haworth and Shoemaker. Other heat flow values at Region 5, Apollo 15, and 17 are presented in gray, green, and purple shades for comparison, respectively. The dashed line denotes the mean value. The vertical bar is the standard deviation of
Although the two study areas present apparently different
Figure 5 shows the locations of Apollo 15 and 17 in situ heat flow experiments and our study areas on the Lunar Prospector gamma-ray spectrometer derived Th map (in a unit of ppm). The typical landing sites indicate that the measured heat flows might be greatly altered by deep subsurface radiogenic elements (Laneuville et al., 2013; Siegler and Smrekar, 2014) and lateral heat flow through highland/mare boundaries (Warren and Rasmussen, 1987). The study areas of PSRs are far from the PKT and highland/mare boundaries that will not enhance the sub-crust heat production and interior heat flow. In addition, the low content of surface Th at the south pole corresponds to low heat flow values while the larger Apollo 15 and 17 heat flow values correspond to highly concentrated Th. NASA’s Gravity Recovery and Interior Laboratory observations show that the south pole has a roughly 40-km crustal thickness with feldspathic highland terrane associated with the low crustal thickness of the south pole Aitken basin (Wieczorek et al., 2013). The Urey ratio (the ratio between total internal heat production and total heat loss through the surface) assumed to be 0.5 is a good and representative of terrestrial planets and the Moon (Spohn and Breuer, 2002). Here, assuming the Th/U = 3.7 and K/U = 2,500 (Warren and Wasson, 1979), crustal density 2,550 kg/m3 (Wieczorek et al., 2013), the Th bulk abundance of the lunar polar crust is constrained by 656 ± 54 ppb based on our retrieved mean heat flow (Haenel et al., 1988).
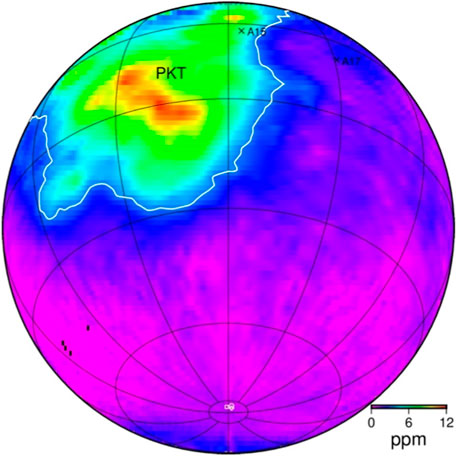
FIGURE 5. Locations of heat flow measurements on the Th map in a unit of ppm (Prettyman et al., 2006). The map is in orthographic projection centered at 0°E, 35°S. The crosses labeled A15 and A17 denote the Apollo 15 and 17 landing sites, respectively. The PKT area enclosed by the white line is constrained by the 3.5 ppm Th contour (Prettyman et al., 2006). The square, diamond, and circle denote the study areas of Haworth, Shoemaker, and Region 5 of the Moon’s south pole, respectively.
3.2 Water ice effect on heat flow retrieval
Water ice is probably one of the most interesting and important elements in PSRs. The Lunar Crater Observation and Sensing Satellite (LCROSS) impact experiment confirmed that there is 5.6 ± 2.9wt% water ice at the impact site (Colaprete et al., 2010), and radar detections indicate that this water ice might present as small (<10 cm) and discrete pieces mixed with regolith rather than thick deposits of nearly pure water ice within a few meters of lunar surface (Neish et al., 2011). Furthermore, the regolith-ice mixture can behave differently with “dry” regolith in thermal emissions. Although water ice has been detected in PSRs and could be cold-trapped for billions of years (Siegler et al., 2016; Li et al., 2018), we still know less about the exact amount of water ice that appears in PSRs and the vertical distribution in the subsurface. This might lead to heat flow estimation uncertainty if water ice can influence the near-surface thermal regime obviously.
Assuming a mean regolith density of 1700 kg/m3 with porosity 0.45 and ice density of 1,100 kg/m3, the volumetric fraction of water ice (i.e., pore filling fraction,

FIGURE 6. Profile of dry regolith porosity and ice-filling model. (A) is the porosity profile of dry lunar soil. (B) is the diagram of inhomogeneous dry soil from surface to a greater depth. (C) is the diagram with water ice that has been diffused to a certain depth of Zice.
Figure 7 shows the comparison of the TB3/TB37 ratio between dry regolith (black line) and ice-bearing regolith with different diffusion depths (color-coded lines). It can be seen that the greater depths of water ice diffuse the less sensitive the TB3/TB37 ratio is to the heat flow. This is mainly caused by increased lossy ice within 3 GHz sensed depths. For shallowly diffused depths,
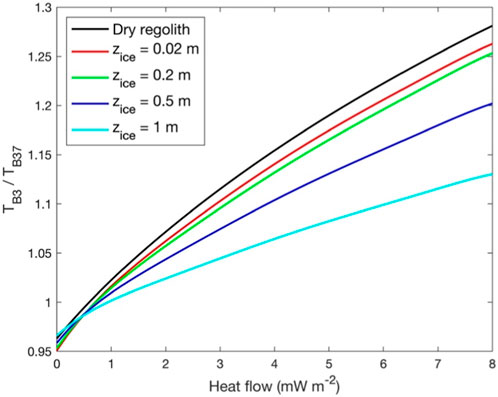
FIGURE 7. Variation of TB3/TB37 ratio under different ice diffusion depths and interior heat flow at the Cabeus crater. The water ice pore filling fraction (
4 Discussion
4.1 Heat flow retrieved from icy regolith
Since it is unable to determine the exact amount of water ice that mixes with regolith and distributes in PSRs in what form, the de facto thermal emission might be more complex than we can model here. However, recent studies of near-infrared observations (Li et al., 2018) showed that only ∼3.5% of cold traps of the south-polar region contained exposed water ice patches. It can be inferred that not the whole area of the study area can trap water ice and diffuse downward to a certain depth. A detailed water ice investigation in the future lunar mission such as China’s unmanned Chang’E-7 lunar south polar exploration mission can help us to improve our thermal and microwave model, which could reveal more details of the subsurface thermal state.
Here, we use the scheme described in Section 2.4 to retrieve heat flow with scenarios of different ice diffusion depths that are discussed in Section 4.2. As shown in Table 1, compared to the “dry” regolith, the retrieved heat flow presents different ranges when ice diffused to the depth of 0.02, 0.2, 0.5, and 1 m at a constant pore filling fraction. The lower limit of heat flow (i.e., 0.6 mW/m2) with different ice diffusion depths agrees well with the “dry” regolith except for the greater diffusion depth (

TABLE 1. Comparison of retrieved heat flows with different water ice diffusion depths at Cabeus crater. Water ice diffuses downward with a constant pore-filling fraction,
4.2 Rock effect
Radar observations at lunar polar regions suggested that the enhanced circular polarization ratio values might be caused by rocks rather than water ice deposits (Fa and Cai, 2013). Similar to the water ice effect, the perched and/or buried rocks can cause TB anomaly due to their higher lossy property. The global average rock abundance (RA) within 60°N/S latitudes retrieved from Diviner measurements is 0.4% (Bandfield et al., 2011). The rock abundance referenced here is the area percentage within each pixel, and the diameter of the rock is larger than ∼1 m. Since there is no quantity investigation of rock abundance at PSRs, we suppose that the polar region has a global averaged RA value. Following Bandfield et al.’s model that the regolith-rock mixture can be simplified as columns of regolith and rock within each pixel, we assume that both regolith and rocks observed by Diviner behave the same surface temperature within each bin (200 m × 200 m). Thus, we modeled the regolith-rock mixture TB by weighting the RA value (0.4%) within each pixel. We found that the modeled
4.3 Application for constraining water ice loss rate
Lunar polar volatiles, including water, are important for understanding the depletion, delivery, weathering, and orbital evolution of the Moon (Paige et al., 2010; Siegler et al., 2016). The water ice distribution is also crucial for in situ resource utilization of future lunar exploration (Cannon and Britt, 2020). Here, we discuss the thermal stability of water ice in polar regions which is controlled by the near-surface thermal environment rather than the accumulation from water-bearing meteoroids and/or the punctuation by impacts (Cannon et al., 2020). Note that the southern summer Diviner data are used here to calculate the maximum subsurface temperature and constrain the maximum sublimation rate of water ice. Neglecting the influence of water ice in regolith thermal property, we can derive subsurface temperatures using Diviner measurements and our retrieved heat flow as boundary inputs (Eq. 1). Following the work of Paige et al. (2010), Schorghofer and Taylor (2007), we calculate the loss rate of water ice at different depths and search a certain depth at which the sublimation rate equals 1 kg/(m2
Figure 8 shows the distribution of water ice at different depths with a constant sublimation rate. It can be seen apparently that water ice distributes from small to large depressions/craters. And most water ice is cold trapped in shallow depths (<10 cm) or even exposes on the surface, for example, the LCROSS impact site (Figure 8 black circle). Compared to Paige et al.'s model which has not considered specific constraints from seasonal variation of surface Tbol and retrieved interior heat flow, our result provides an additional thermal constraint for the thermal stability of water ice at cold traps. For example, our model suggests that the partially sunlit Amundsen crater floor (84.5°S, 82.8°E) may harbor water ice with a loss rate of 1 mm/Ga at greater depths (>1 m) while Paige et al.’s model indicates <0.5 m depth. Thus, accurate constraints of subsurface temperatures can help us to evaluate water ice thermal stability, which is significant for investigating the depletion history of volatiles and even landing site selection for mining water ice in the future lunar exploration (Cannon and Britt, 2020).
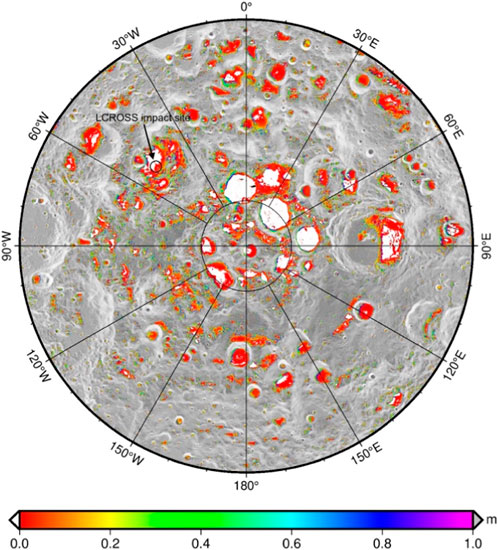
FIGURE 8. Diffusion depths of water ice with sublimation rate 1 kg/(m2
5 Conclusion
In this study, we retrieved interior heat flow at Haworth and Shoemaker from ∼10 years of Diviner measurements and CE-2 observations. The retrieved heat flows at the two craters have excellent consistency, which also agrees well with Diviner-derived Region 5 (Paige and Siegler, 2016). The average value is 4.9 ± 0.2 mW/m2 which suggests a homogeneous interior heat flux. Assuming a uniform heat flow at the lunar south pole, the bulk content of Th of the lunar polar crust is constrained by 656 ± 54 ppb based on the Urey ratio of the Moon. In addition, we also estimated the thermal stability of water ice which is constrained by Diviner observations and retrieved heat flow. We found that water ice with a constant loss rate of 1 kg/(m2·Ga) can be cold-trapped from the surface to shallow depths (<0.1 m) within most parts of the PSRs of the Moon. Finally, our study provides a new method to constrain the lunar subsurface thermal state at the non-PKT area by reconciling the unprecedented MRM data and longevous Diviner observations. The retrieved heat flow helps us to understand the subsurface thermal state and thermal history of the Moon.
Data availability statement
The Diviner Tbol data set was obtained from the NASA Planetary Data System Geosciences Node, available at http://pds-geosciences.wustl.edu/missions/lro/diviner.htm. CE-2 Microwave Radiometer data were provided by the Ground Research and Application System of the Chinese Lunar Exploration Program and can be downloaded from https://doi.org/10.5281/zenodo.5164204.
Author contributions
GW conceptualized this study and processed the data. XL, HG, and YS provided data interpretations. GW prepared figures and tables and wrote the draft. HG discussed the results and revised the manuscript. All authors contributed to the article and approved the submitted version.
Funding
GW was supported by the National Key Research and Development Program of China (2022YFF0711400), the B-type Strategic Priority Program of the Chinese Academy of Sciences (XDB 41000000), the National Natural Science Foundation of China (42241154), and Science and Technology Program of Guizhou Province [QKHJC-ZK(2023)-476]. HG was supported by the National Natural Science Foundation of China (41903058), Frontier Science Research Program of Deep Space Exploration Laboratory (2022-QYKYJH-HXYF023), and Science and Technology Program of Guizhou Province [QKHJC-ZK(2023)-131].
Acknowledgments
We thank Stephen J. Keihm for his constructive comments and discussion of the early version of the manuscript. We also thank Jean-Pierre Williams for the helpful discussion about using Diviner Tbol data.
Conflict of interest
The authors declare that the research was conducted in the absence of any commercial or financial relationships that could be construed as a potential conflict of interest.
Publisher’s note
All claims expressed in this article are solely those of the authors and do not necessarily represent those of their affiliated organizations, or those of the publisher, the editors and the reviewers. Any product that may be evaluated in this article, or claim that may be made by its manufacturer, is not guaranteed or endorsed by the publisher.
References
Bandfield, J. L., Ghent, R. R., Vasavada, A. R., Paige, D. A., Lawrence, S. J., and Robinson, M. S. (2011). Lunar surface rock abundance and regolith fines temperatures derived from LRO Diviner Radiometer data. J. Geophys. Res. 116, E00H02. doi:10.1029/2011JE003866
Bergman, D. J. (1978). The dielectric constant of a composite material—a problem in classical physics. Phys. Rep. 43, 377–407. doi:10.1016/0370-1573(78)90009-1
Bussey, D. B. J., McGovern, J. A., Spudis, P. D., Neish, C. D., Noda, H., Ishihara, Y., et al. (2010). Illumination conditions of the south pole of the Moon derived using Kaguya topography. Icarus 208, 558–564. doi:10.1016/j.icarus.2010.03.028
Cannon, K. M., and Britt, D. T. (2020). A geologic model for lunar ice deposits at mining scales. Icarus 347, 113778. doi:10.1016/j.icarus.2020.113778
Cannon, K. M., Deutsch, A. N., Head, J. W., and Britt, D. T. (2020). Stratigraphy of ice and ejecta deposits at the lunar Poles. Geophys. Res. Lett. 47. doi:10.1029/2020GL088920
Colaprete, A., Schultz, P., Heldmann, J., Wooden, D., Shirley, M., Ennico, K., et al. (2010). Detection of water in the LCROSS ejecta plume. Science 330, 463–468. doi:10.1126/science.1186986
De Rosa, D., Bussey, B., Cahill, J. T., Lutz, T., Crawford, I. A., Hackwill, T., et al. (2012). Characterisation of potential landing sites for the European Space Agency’s Lunar Lander project. Planet. Space Sci. 74, 224–246. doi:10.1016/j.pss.2012.08.002
Elder, C. M., Douglass, B., Ghent, R. R., Hayne, P. O., Williams, J. -P., Bandfield, J. L., et al. (2019). The subsurface coherent rock content of the moon as revealed by cold-spot craters. J. Geophys. Res. Planets 124, 3373–3384. doi:10.1029/2019JE006128
Fa, W., and Cai, Y. (2013). Circular polarization ratio characteristics of impact craters from mini-RF observations and implications for ice detection at the polar regions of the moon: Lunar cpr properties for ice detection. J. Geophys. Res. Planets 118, 1582–1608. doi:10.1002/jgre.20110
Feng, J., Siegler, M. A., and Hayne, P. O. (2020). New constraints on thermal and dielectric properties of lunar regolith from LRO diviner and CE-2 microwave radiometer. J. Geophys. Res. Planets 125. doi:10.1029/2019JE006130
Gläser, P., Scholten, F., De Rosa, D., Marco Figuera, R., Oberst, J., Mazarico, E., et al. (2014). Illumination conditions at the lunar south pole using high resolution Digital Terrain Models from LOLA. Icarus 243, 78–90. doi:10.1016/j.icarus.2014.08.013
Grott, M., Knollenberg, J., and Krause, C. (2010). Apollo lunar heat flow experiment revisited: A critical reassessment of the in situ thermal conductivity determination. J. Geophys. Res. 115, E11005. doi:10.1029/2010JE003612
Haenel, R., Rybach, L., and Stegena, L. (1988). Handbook of terrestrial heat-flow density determination. Springer.Berlin, Germany.
Hagermann, A., and Tanaka, S. (2006). Ejecta deposit thickness, heat flow, and a critical ambiguity on the Moon. Geophys. Res. Lett. 33, L19203. doi:10.1029/2006GL027030
Hayne, P. O., Bandfield, J. L., Siegler, M. A., Vasavada, A. R., Ghent, R. R., Williams, J.-P., et al. (2017). Global regolith thermophysical properties of the moon from the diviner lunar radiometer experiment: Lunar regolith thermophysical properties. J. Geophys. Res. Planets 122, 2371–2400. doi:10.1002/2017JE005387
Jolliff, B. L., Gillis, J. J., Haskin, L. A., Korotev, R. L., and Wieczorek, M. A. (2000). Major lunar crustal terranes: Surface expressions and crust-mantle origins. J. Geophys. Res. 105, 4197–4216. doi:10.1029/1999JE001103
Keihm, S. J. (1984). Interpretation of the lunar microwave brightness temperature spectrum: Feasibility of orbital heat flow mapping. Icarus 60, 568–589. doi:10.1016/0019-1035(84)90165-9
Keihm, S. J., and Langseth, M. G. (1975). Lunar microwave brightness temperature observations reevaluated in the light of Apollo program findings. Icarus 24, 211–230. doi:10.1016/0019-1035(75)90100-1
Kiefer, W. S. (2012). Lunar heat flow experiments: Science objectives and a strategy for minimizing the effects of lander-induced perturbations. Planet. Space Sci. 60, 155–165. doi:10.1016/j.pss.2011.07.016
Laneuville, M., Wieczorek, M. A., Breuer, D., and Tosi, N. (2013). Asymmetric thermal evolution of the moon: Lunar evolution. J. Geophys. Res. Planets 118, 1435–1452. doi:10.1002/jgre.20103
Langseth, M. G., Keihm, S. J., and Peters, K. (1976). Revised lunar heat-flow values. Present. A. T. Proc. Lunar Sci. Conf. 7th, 3143–3171.
Li, S., Lucey, P. G., Milliken, R. E., Hayne, P. O., Fisher, E., Williams, J.-P., et al. (2018). Direct evidence of surface exposed water ice in the lunar polar regions. Proc. Natl. Acad. Sci. U. S. A. 115, 8907–8912. doi:10.1073/pnas.1802345115
Mazarico, E., Neumann, G. A., Smith, D. E., Zuber, M. T., and Torrence, M. H. (2011). Illumination conditions of the lunar polar regions using LOLA topography. Icarus 211, 1066–1081. doi:10.1016/j.icarus.2010.10.030
Meng, Z., Chen, S., Osei, E. M., Wang, Z., and Cui, T. (2010). Research on water ice content in Cabeus crater using the data from the microwave radiometer onboard Chang’e-1 satellite. Sci. China Phys. Mech. Astron. 53, 2172–2178. doi:10.1007/s11433-010-4159-y
Nagihara, S., Kiefer, W. S., Taylor, P. T., Williams, D. R., and Nakamura, Y. (2018). Examination of the long-term subsurface warming observed at the Apollo 15 and 17 sites utilizing the newly restored heat flow experiment data from 1975 to 1977. J. Geophys. Res. Planets 123, 1125–1139. doi:10.1029/2018JE005579
Neish, C. D., Bussey, D. B. J., Spudis, P., Marshall, W., Thomson, B. J., Patterson, G. W., et al. (2011). The nature of lunar volatiles as revealed by Mini-RF observations of the LCROSS impact site. J. Geophys. Res. 116, E01005. doi:10.1029/2010JE003647
Paige, D. A., and Siegler, M. A. 2016“New constraints on lunar heat flow rates from LRO diviner lunar radiometer experiment polar observations,” in Proceedings of the 47th Lunar and Planetary Science Conference. Presented at the 47th Lunar and Planetary Science Conference, Houston, TX, USA, January 2016, 2753.
Paige, D. A., Siegler, M. A., Zhang, J. A., Hayne, P. O., Foote, E. J., Bennett, K. A., et al. (2010). Diviner lunar radiometer observations of cold traps in the moon’s south polar region. Science 330, 479–482. doi:10.1126/science.1187726
Prettyman, T. H., Hagerty, J. J., Elphic, R. C., Feldman, W. C., Lawrence, D. J., McKinney, G. W., et al. (2006). Elemental composition of the lunar surface: Analysis of gamma ray spectroscopy data from lunar prospector: Lunar elemental composition. J. Geophys. Res. 111.2656 doi:10.1029/2005je002656
Qiao, L., Head, J. W., Wilson, L., and Ling, Z. (2021). Ina lunar irregular mare patch mission concepts: Distinguishing between ancient and modern volcanism models. Planet. Sci. J. 2, 66. doi:10.3847/PSJ/abeaa0
Saito, Y. 2008“The long term temperature variation in the lunar subsurface,” in Proceedings of the Presented at the Lunar and Planetary Science Conference 39th (2008), Houston, TX, USA, March 2008, 1663.
Schloerb, F. P., Muhleman, D. O., and Berge, G. L. (1976). Lunar heat flow and regolith structure inferred from interferometric observations at a wavelength of 49.3 cm. Icarus 29, 329–341. doi:10.1016/0019-1035(76)90137-8
Schorghofer, N., and Taylor, G. J. (2007). Subsurface migration of H 2 O at lunar cold traps. J. Geophys. Res. 112, E02010. doi:10.1029/2006JE002779
Schorghofer, N., and Williams, J.-P. (2020). Mapping of ice storage processes on the moon with time-dependent temperatures. Planet. Sci. J. 1, 54. doi:10.3847/PSJ/abb6ff
Siegler, M. A., Feng, J., Lucey, P. G., Ghent, R. R., Hayne, P. O., and White, M. N. (2020). Lunar titanium and frequency-dependent microwave loss tangent as constrained by the Chang’E-2 MRM and LRO diviner lunar radiometers. J. Geophys. Res. Planets 125. doi:10.1029/2020JE006405
Siegler, M., Aharonson, O., Carey, E., Choukroun, M., Hudson, T., Schorghofer, N., et al. (2012). Measurements of thermal properties of icy mars regolith analogs: Thermal properties OF ICY mars regolith. J. Geophys. Res. 117. doi:10.1029/2011je003938
Siegler, M. A., Miller, R. S., Keane, J. T., Laneuville, M., Paige, D. A., Matsuyama, I., et al. (2016). Lunar true polar wander inferred from polar hydrogen. Nature 531, 480–484. doi:10.1038/nature17166
Siegler, M. A., and Smrekar, S. E. (2014). Lunar heat flow: Regional prospective of the Apollo landing sites: Regional lunar heat flow. J. Geophys. Res. Planets 119, 47–63. doi:10.1002/2013JE004453
Spohn, T., and Breuer, D. 2002“Surface heat flow, radiogenic heating, and the evolution of the moon,” in Proceedings of the EGS 27th General Assembly, Nice, France, April 2002, 6000.
Vasavada, A. (1999). Near-surface temperatures on mercury and the moon and the stability of polar ice deposits. Icarus 141, 179–193. doi:10.1006/icar.1999.6175
Vasavada, A. R., Bandfield, J. L., Greenhagen, B. T., Hayne, P. O., Siegler, M. A., Williams, J.-P., et al. (2012). Lunar equatorial surface temperatures and regolith properties from the diviner lunar radiometer experiment: Lunar equatorial regolith properties. J. Geophys. Res. 117.3987 doi:10.1029/2011JE003987
Warren, P. H., and Rasmussen, K. L. (1987). Megaregolith insulation, internal temperatures, and bulk uranium content of the moon. J. Geophys. Res. 92, 3453. doi:10.1029/JB092iB05p03453
Warren, P. H., and Wasson, J. T. (1979). The origin of KREEP. Rev. Geophys. 17, 73. doi:10.1029/RG017i001p00073
Wei, G., Li, X., Gan, H., Blewett, D. T., Neish, C. D., and Greenhagen, B. T. (2019). A new method for simulation of lunar microwave brightness temperatures and evaluation of Chang’E-2 MRM data using thermal constraints from diviner. J. Geophys. Res. Planets.29 5858, doi:10.1029/2018JE005858
Wei, G., Li, X., Zhang, W., Tian, Y., Jiang, S., Wang, C., et al. (2023). Illumination conditions near the Moon’s south pole: Implication for a concept design of China’s Chang’E−7 lunar polar exploration. Acta Astronaut. 208, 74–81. doi:10.1016/j.actaastro.2023.03.022
Wieczorek, M. A., Neumann, G. A., Nimmo, F., Kiefer, W. S., Taylor, G. J., Melosh, H. J., et al. (2013). The crust of the moon as seen by GRAIL. Science 339, 671–675. doi:10.1126/science.1231530
Wieczorek, M. A., and Phillips, R. J. (2000). The “Procellarum KREEP Terrane”: Implications for mare volcanism and lunar evolution. J. Geophys. Res. 105, 20417–20430. doi:10.1029/1999JE001092
Williams, J. -P., Greenhagen, B. T., Paige, D. A., Schorghofer, N., Sefton-Nash, E., Hayne, P. O., et al. (2019). Seasonal polar temperatures on the moon. J. Geophys. Res. Planets 124, 2505–2521. doi:10.1029/2019JE006028
Woods-Robinson, R., Siegler, M. A., and Paige, D. A. (2019). A model for the thermophysical properties of lunar regolith at low temperatures. J. Geophys. Res. Planets 124, 1989–2011. doi:10.1029/2019JE005955
Keywords: Chang’E-2, microwave radiometer, Diviner, Moon, pole, heat flow, thermal model
Citation: Wei G, Li X, Gan H and Shi Y (2023) Retrieval of lunar polar heat flow from Chang’E-2 microwave radiometer and Diviner observations. Front. Astron. Space Sci. 10:1179558. doi: 10.3389/fspas.2023.1179558
Received: 04 March 2023; Accepted: 12 May 2023;
Published: 25 May 2023.
Edited by:
Josep M. Trigo-Rodríguez, Spanish National Research Council (CSIC), SpainReviewed by:
Akos Kereszturi, Hungarian Academy of Sciences (MTA), HungaryJianguo Yan, Wuhan University, China
Copyright © 2023 Wei, Li, Gan and Shi. This is an open-access article distributed under the terms of the Creative Commons Attribution License (CC BY). The use, distribution or reproduction in other forums is permitted, provided the original author(s) and the copyright owner(s) are credited and that the original publication in this journal is cited, in accordance with accepted academic practice. No use, distribution or reproduction is permitted which does not comply with these terms.
*Correspondence: Guangfei Wei, Z2Z3ZWkwNTU0QGdtYWlsLmNvbQ==; Hong Gan, Z2FuaG9uZzA2QGdtYWlsLmNvbQ==
 Guangfei Wei
 Xiongyao Li
 Hong Gan
 Yaolin Shi4