
95% of researchers rate our articles as excellent or good
Learn more about the work of our research integrity team to safeguard the quality of each article we publish.
Find out more
ORIGINAL RESEARCH article
Front. Astron. Space Sci. , 02 June 2023
Sec. Fundamental Astronomy - Archive
Volume 10 - 2023 | https://doi.org/10.3389/fspas.2023.1146603
This article is part of the Research Topic Astrometry with the Chinese Space Station Telescope View all 8 articles
 Zhen-Sen Fu1,2
 Zhao-Xiang Qi1,2*
 Shi-Long Liao1,2*
 Xi-Yan Peng1
 Yong Yu1,2
 Qi-Qi Wu1,2
 Li Shao3
 You-Hua Xu3
Introduction: The China Space Station Telescope (CSST) will enter a low Earth orbit around 2024 and operate for 10 years, with seven of those years devoted to surveying the area of the median-to-high Galactic latitude and median-to-high Ecliptic latitude of the sky. To maximize the scientific output of CSST, it is important to optimize the survey schedule. We aim to evaluate the astrometric capability of CSST for a given survey schedule and to provide independent suggestions for the optimization of the survey strategy.
Methods: We first construct the astrometric model and then conduct simulated observations based on the given survey schedule. The astrometric solution is obtained by analyzing the simulated observation data. And then we evaluate the astrometric capability of CSST by analyzing the properties of the astrometric solution.
Results: The accuracy of parallax and proper motion of CSST is better than 1 mas (⋅ yr−1) for the sources of 18–22 mag in g band, and about 1∼10 mas (⋅ yr−1) for the sources of 22–26 mag in g band, respectively. The results from real survey could be worse since the assumptions are optimistic and simple.
Discussion: Optimizing the survey schedule can improve the astrometric accuracy of CSST. In the future, we will improve the astrometric capability of CSST by continuously iterating and optimizing the survey schedule.
The China Space Station Telescope (CSST), the major science project of the China Manned Space Program, is a space telescope in the same orbit as the China Manned Space Station, which is about 400 km height (Su and Cui, 2014; Gong et al., 2019). It can dock with the space station for maintenance and upgrade. The basic information of CSST is shown in Tables 1, 2, respectively. With its wavelength coverage, high angular resolution, and large sky area coverage, CSST offers scientific opportunities and a great legacy value that complement other forthcoming space-based and ground-based surveys (Cao et al., 2018; Zhan, 2018). CSST is very suitable for astrometry studies of objects fainter than 20th magnitude. The CSST survey observations include multicolor imaging observations and seamless spectral observations. As suggested by the CSST Scientific Committee, CSST will focus on the following seven research directions: cosmology, galaxies and active galactic nucleus, the Milky Way and neighboring galaxies, stellar science, exoplanets and solar system objects, astrometry, transient sources and variable sources (Zhan, 2021). Among them, astrometry, as a basic branch of astronomy, its main purpose is to provide necessary data for astronomy studies by measuring the position and motion of the celestial bodies, including planets and other solar system objects, stars in the Milky Way, galaxies and galaxy clusters in the universe. The astrometric results of CSST combine with its photometric information can provide the basic and reliable data for solving multiple core problems in the astronomical fields such as dark matter, dark energy, black holes, the Milky Way, and the solar system (Zhan, 2011; Gong et al., 2019; Cao et al., 2022). Meanwhile, the CSST’s astrometric observation data will complement Gaia’s data, extending Gaia’s tomographic mapping of the Milky Way to much fainter magnitudes, adding positions, parallaxes, distance estimates, color-magnitude-based stellar parameter estimates, and extinction estimates, which will bring great scientific opportunities and scientific wealth to CSST astronomical research. Furthermore, it will enable to reduce the Gaia precision degradation on positions and increase the number of available reference sources in the extragalactic regions (about 40% of the sky) (Gai et al., 2022).
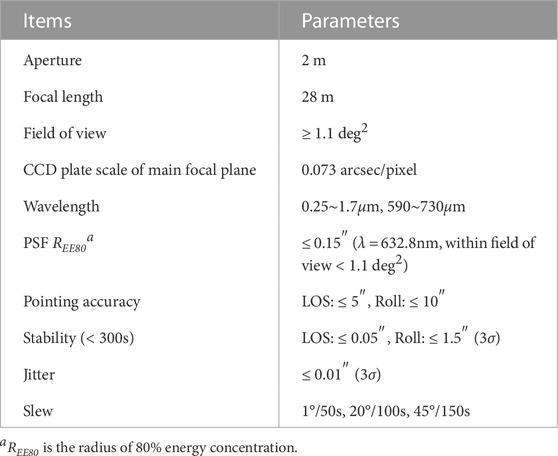
TABLE 1. Key specifications of CSST. Table from Zhan (2021).

TABLE 2. Magnitude limit for multicolor imaging survey. Table from Zhan (2021).
From Hipparcos (Perryman, 1997) to Gaia (Prusti et al., 2016), the accuracy of position and parallax achieved a leap from 1 milli-arcsecond (mas) to a few tens of micro-arcseconds (μas) (Michalik et al., 2014). For CSST, the solution accuracy of the five astrometric parameters (position, parallax, and proper motion) will be directly affected by the survey schedule, as will the output of other science applications that depend on observation cadence, directly or indirectly. A suitable survey strategy could be able to bring more observation samples and higher-precision observation data. The number and the distribution of the astrometric epoch data are the keys to obtaining the high-quality astrometric parameters of the celestial bodies. Therefore, how to effectively organize the survey schedule is very important to get the repeated observation data of the celestial bodies. At present, the scientific research team is designing a survey schedule plan that can meet the needs of multi-party observations. From the perspective of astrometry, the effectiveness of a survey strategy can be evaluated and optimized by analyzing the astrometric capability of CSST, and conversely, optimizing the survey strategy can also improve the astrometric capability of CSST. Improving the effectiveness of CSST’s survey schedule is critical to improve CSST’s scientific output.
The CSST’s astrometric capability simulation experiment is based on a self-designed astrometric solution software. Through simulation, we estimate the accuracy of the five astrometric parameters of stars at different magnitudes and different sky positions. The present paper gives a recipe for the practical realization of simulation evaluation of the astrometric capability of CSST. In Section 2, we briefly describe the survey schedule used in this paper. In Section 3, we establish the astrometric model based on the single-star kinematic model and the least-squares method to derive the astrometric parameters from simulated observation data. In Section 4, we describe the steps for simulating observations based on a given survey schedule, which involves processing simulated observations using the astrometric model to obtain the astrometric solution for the observed celestial bodies. In Section 5, we evaluate the astrometric capability of CSST by analyzing these astrometric solution. In Section 6, we discuss the possibilities for improving the astrometric capability of CSST. Finally, we conclude this paper in Section 7.
The survey strategy is mainly based on operational scheduling constraints and observation requirements. The operational scheduling constraints include solar avoidance angle, lunar avoidance angle, Earth avoidance angle, field-of-view collocation, regular resupply, regular maintenance, regular orbit control, telescope maneuvering time and stabilization time, and so on. The observation requirements come from different scientific goals of CSST, for example, cosmological studies require CSST to observe in the median-to-high Galactic latitude and median-to-high Ecliptic latitude of the sky where the stellar density and zodiacal light background are low, and thus obtain a large sample of extragalactic objects (Zhan, 2021).
The CSST will allocate 70% of its 10 years of operation time to image roughly 17500 square degrees of the sky. During the first year of the operation time, the image area will cover about 12000 square degrees of the sky1, and images of NUV, u, g, r, i, z, and y bands (details can be found in Table 2) will be supplemented in each direction during the subsequent operation time (Zhan, 2021). The observation pointing center distribution of the survey strategy2 used in this paper is shown in Figure 1. For a given survey schedule, the heterogeneity and concentration in the observation time directly affect the astrometric solution. Therefore, it is necessary to evaluate the CSST’s astrometric capability based on the given survey schedule and give independent suggestions for the optimization of the given survey schedule.
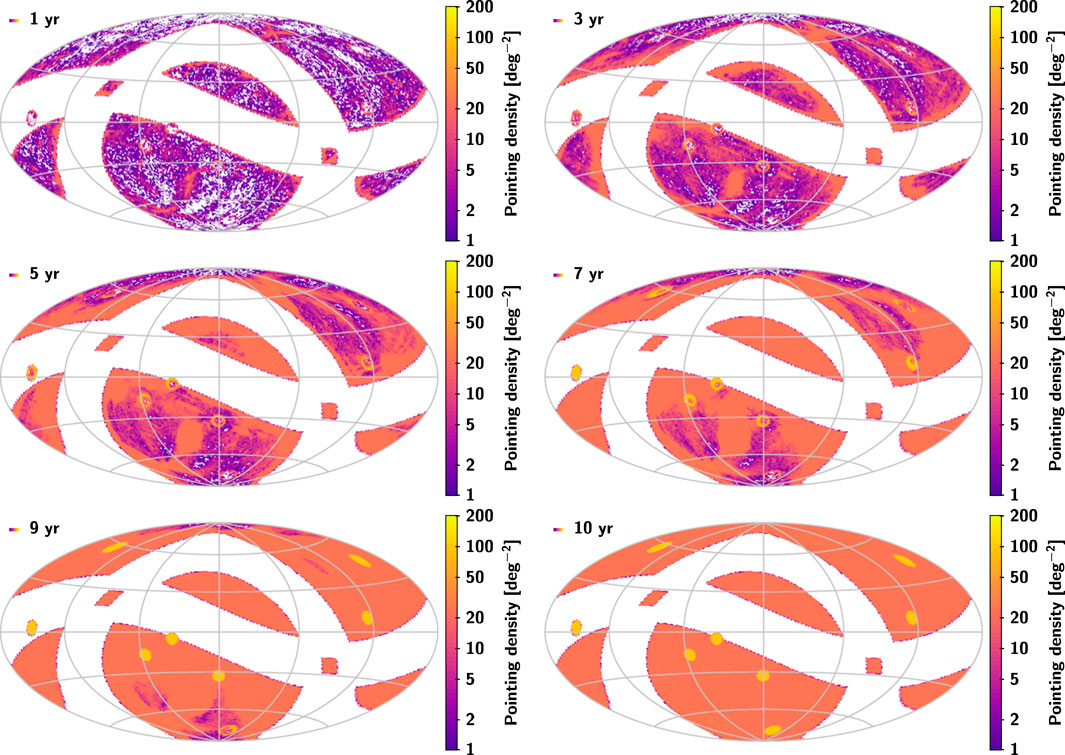
FIGURE 1. Distribution of the observation pointing centers of the survey for 1, 3, 5, 7, 9 and 10 years, respectively. The yellow circles in the bottom right figure are the selected deep fields. All maps use an Aitoff projection in equatorial coordinates, with origin α = δ = 0 at the centre and α increasing from right to left. Mean densities are shown for the observation pointing centers in cells of about 0.84 deg2.
In this section, we will first introduce the single-star kinematic model, which is the basis for establishing the astrometric model and for simulating data on the variation of the object’s position at different observation times. Then, we will introduce the astrometric model.
Assume that the target celestial bodies we deal with are all single stars and such celestial bodies move linearly and uniformly relative to the solar system barycentre (SSB). For a single star whose proper motion in right ascension is μα*, proper motion in declination is μδ, and parallax is π, its motion (we ignore the radial motion) can be described by the following formula (Perryman, 1997, Vol. 1, Sect. 1.2.8):
where ti is the time of observation; tep is the reference epoch; bO (ti) is the barycentric position of CSST at the time of observation; Au is the astronomical unit; u (ti) is the unit vector of the coordinate direction of the star observed by CSST:
α(ti) and δ(ti) are the observed values of the right ascension and declination of the star, respectively; rep is the unit vector along the line between the star and SSB at the reference epoch; pep and qep are the unit vectors in the directions of increasing αep and δep at rep, respectively:
αep and δep are the right ascension and declination of the star at the reference epoch, respectively; ⟨⟩ denotes vector normalisation:
To facilitate the astrometric solution of the single star, we use the Local Plane Coordinate (LPC) to describe the motion of the single star. The base vectors for the LPC are rep, pep and qep. At the time ti, the position component of the single star in the LPC along the base vectors pep and qep directions are ξ and η, respectively (Perryman, 1997, Vol. 1, Sect. 1.2.9):
where the prime (′) denotes scalar product; Δα* = Δα cos δep and Δδ are the offsets at the reference epoch in αep and δep, respectively.
We refer to Eqs. 4, 5 as the single observation equations. In the equations, the unknown parameters are Δα*, Δδ, π,
As described by Michalik et al. (2014), the simulations are carried out in the following 3 steps: 1) Create a catalogue of all the stars used to generate CSST observations, namely the input catalogue. The input catalogue is also used to evaluate the solvability of the astrometric parameters. 2) Simulate the observations of the stars based on the given survey schedule (see Figure 1) and the magnitude dependence of the astrometric uncertainty. 3) Analysis the solvability of the astrometric parameters and generate the final catalogue.
Through the statistical analysis of the astrometric solution in the final catalogue, the astrometric capability of CSST can be evaluated. In this section, we only cover the process of simulating the observation and processing the observation data, while the detailed evaluation of the astrometric capability of CSST is described in Section 5.
To make the celestial bodies in the input catalogue as realistic as possible, we randomly extract about 1.2 million celestial bodies from the Gaia DR3 (Brown et al., 2021; Lindegren et al., 2021; Vallenari et al., 2022)3 and assign a random magnitude between 18 and 26 mag to each target but keep the astrometric parameters from Gaia. The magnitudes are assigned with reference to the distribution of the number of sources in different magnitude intervals4 in the Gaia DR3, and by extrapolating this distribution we obtain a distribution of the number of sources in the magnitude interval 18–26 mag5. The input catalogue contains information about the “true” position, proper motion, parallax and magnitude of these celestial bodies. The density of the sources and distribution of the magnitudes of the sources in the input catalogue are shown in Figure 2 and Figure 3, respectively.
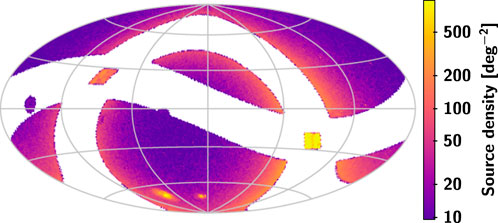
FIGURE 2. Distribution of the sources in the input catalogue, about 1256640 sources. The map uses an Aitoff projection in equatorial coordinates, with origin α = δ = 0 at the centre and α increasing from right to left. Mean density is shown for the sources in cells of about 0.84 deg2.
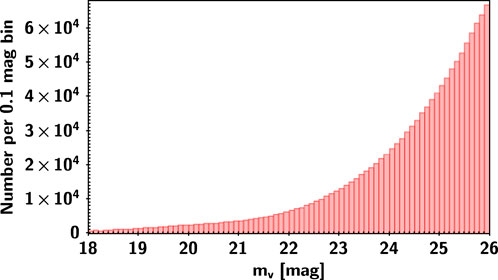
FIGURE 3. Distribution of the magnitudes for the input catalogue shown as histograms with bins of 0.1 mag in width.
Simulated observations are produced by combining the input catalogue with the survey schedule with the following two main steps:
1. The information of the survey schedule includes: all observed times, the barycentre coordinates of CSST and the directions of the observation pointing centers at the time of observation. The celestial bodies from the input catalogue observed at each observed times are calculated. For these observed celestial bodies, the corresponding positions of the coordinate directions at each observed times can be solved by Eq. 1.
2. The observation errors are simulated as Gaussian noise based on the magnitude dependence of the astrometric uncertainty provided by the CSST astrometry team. The magnitude distribution of the astrometric uncertainty is shown in Figure 4. The astrometric uncertainty takes into account various physical and instrumental effects, such as cosmic ray, non-linearity, distortion, sky background, dark current, bias, flat field, charge diffusion effect, CCD saturation overflow, failed image elements/columns, instrument platform jitter, gain, readout noise, etc. The difference between the astrometric uncertainty of CSST and the theoretical reference lower bound σlb is because the former takes into account many errors, especially instrumental effects, such as distortion, etc. To simulate the observed star positions more realistically, we use the magnitude dependence of the astrometric uncertainty. For the observations of a celestial body at magnitude g, the observation errors at the right ascension and declination can be treated as Gaussian noise with the normal distribution
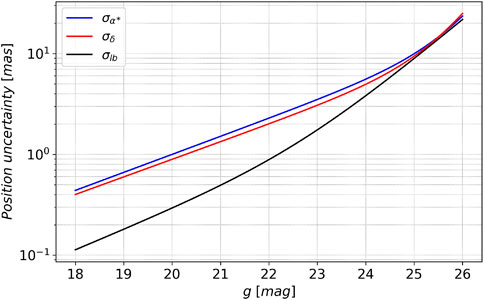
FIGURE 4. Magnitude dependence of the astrometric uncertainty in α and δ. The blue solid line is the standard uncertainty of the right ascension, the red solid line is the standard uncertainty of the declination, and the black solid line is the theoretical reference lower bound of the positional precision σlb for a diffraction-limited image (see Supplementary Appendix B).
The astrometric model in Section 3.2 is used to process simulated observation data. Then we compare the solutions with the “true” parameter values in the input catalogue. The selected astrometric parameters compatible with the true values within three times the respective uncertainty are considered as effective parameters, also known as solvable parameters. The relevant information (solved value, standard uncertainty, correlation coefficient, residual, and so on) of the effective parameters is used to form the final catalogue.
The final catalogue contains the astrometric solution for 1211330 sources (96.39% of the total number of sources in the input catalogue), among which the 5-parameter solvable sources accounted for 97.18% (1177160 sources) of the total number of sources in the final catalogue, and the 4-parameter (position offsets and proper motion) solvable sources accounted for 98.57% (1194059 sources) (details can be found in Table 3). The distribution of the difference between the solutions and their respective true values can be found in Figure 5. The corresponding standard deviations of the best-fit Gaussian distributions for parallax and proper motion are 1.073, 1.061 and 1.014, respectively.
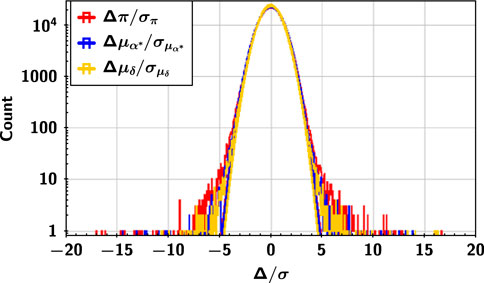
FIGURE 5. Distribution of the difference (Δ in the figure) between the solutions and the true values for the parallax and proper motion. The three curves show the corresponding best-fit Gaussian distributions.
Next, we will evaluate the astrometric capability of CSST by analyzing the following information from the final catalogue:
• the standard uncertainties of the astrometric parameters:
• the ten correlation coefficients among the five parameters:
• the signal-to-noise ratio of parallax:
• the median epoch of celestial observation time series: median epoch6;
• the mean epoch of celestial observation time series: mean epoch;
• the standard deviation of celestial observation time series (which describes the dispersion of observation series of each source): σt; and the mean of σt of each source: σmean.
Table 4 and Figure 6 summarize the results of standard uncertainties (subdivided by magnitude) for the astrometric parameters in the final catalogue. According to the overall calculation of the astrometric parameters, the accuracy of parallax and proper motion of CSST is about 0.1–1.0 mas (⋅ yr−1) for the sources of 18–22 mag, and 1 to 10 mas (⋅ yr−1) for the sources of 22–26 mag, respectively. Figure 7 shows the distribution of standard uncertainties and correlation coefficients of the astrometric parameters in the final catalogue. The correlations between the astrometric parameters are pretty strong (up to ±1) in the areas where the observation times are too concentrated. Similar situations can be found for the uncertainties of the parameters. This is predictable and reflects the inadequacy of current sky survey strategies.
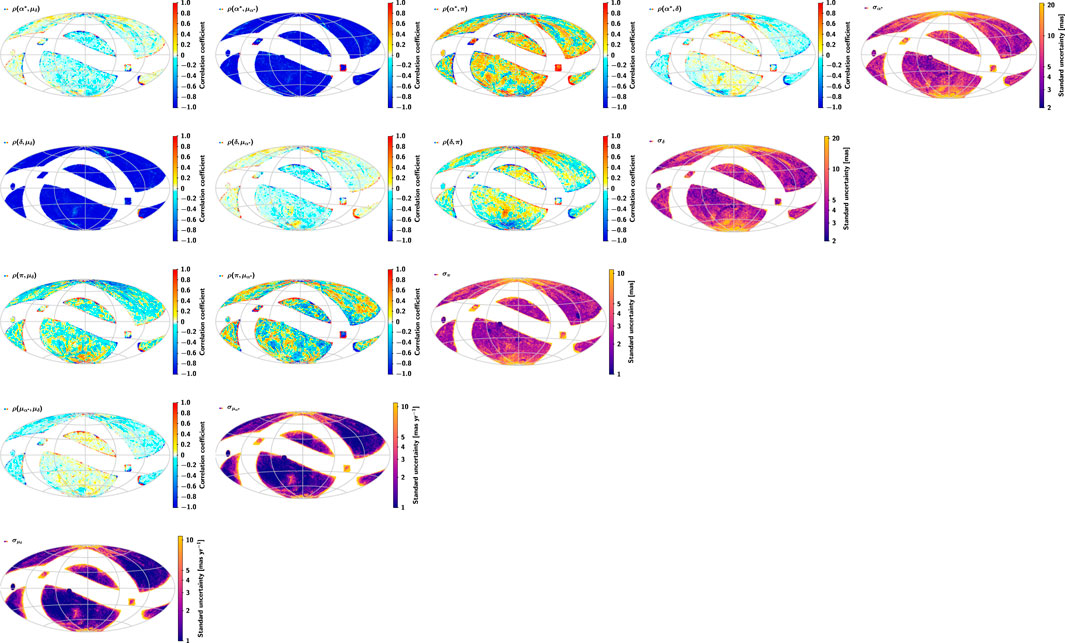
FIGURE 7. Summary statistics for all sources in the final catalogue. The five maps along the main diagonal show, from top-right to bottom-left, the standard uncertainties in α*, δ, π,
In this section, we evaluate the effectiveness of the survey strategy used during the simulation by analyzing the astrometric capability of CSST and give preliminary suggestions for optimizing the survey strategy from an astrometric perspective.
The number and the distribution of the astrometric epoch data are the keys to obtaining high-quality astrometric parameters of the sources. The statistical information of the sources with σt > σmean (σmean = 349 days) and σt < σmean are shown in Table 5 and Table 6, respectively. Figure 8 shows the distributions of σt, median and mean epoch of the observation time intervals. A small σt suggests that the observation time is too concentrated, which will lead to an unfavorable solution of the astronomical parameters, as shown in Figure 9. The distribution of the sources with σt < σmean is mainly near the edge of the galactic equator and the intersection of the galactic equator and the ecliptic, and some of them are located in the high declination region and the edge of the ecliptic. These regions are corresponding to the regions with large uncertainty in proper motion in Figure 7. By comparing the results of Table 4, Table 5, and Table 6, it can be found that optimizing the survey schedule in these regions may improve the quality and quantity of parameter solutions of the corresponding celestial bodies, thereby enhancing the astrometric capability of CSST. We suggest that these regions be scheduled for more even observations in the future during the optimization of the survey strategy.
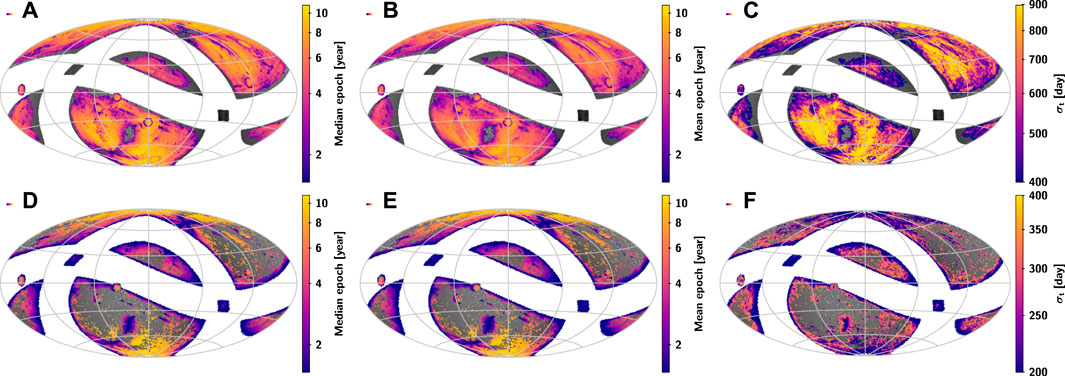
FIGURE 8. Distributions of the observation time intervals: (A) median epoch of the sources with σt > σmean; (B) mean epoch of the sources with σt > σmean;
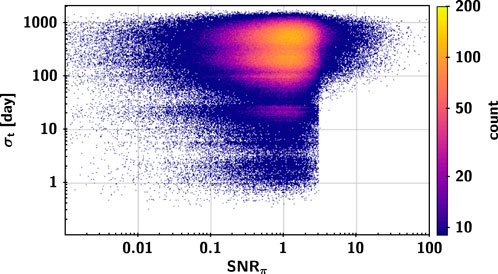
FIGURE 9. Relationship between the dispersion of observation series and signal-to-noise ratio of parallax for the parallax solvable sources in the final catalogue.
Figure 10 shows more directly the observational effects of the survey schedule used in the simulation, where there are a large number of sources with σt ≪ σmean in the first year, and optimizing their observational schedule can add more sources with high-precision astrometric parameters to the CSST observational sample. Combining the simulation of CSST astrometric capability with the optimization of the survey schedule can lead to a more efficient survey schedule and provide a more high-precision data sample for CSST science.
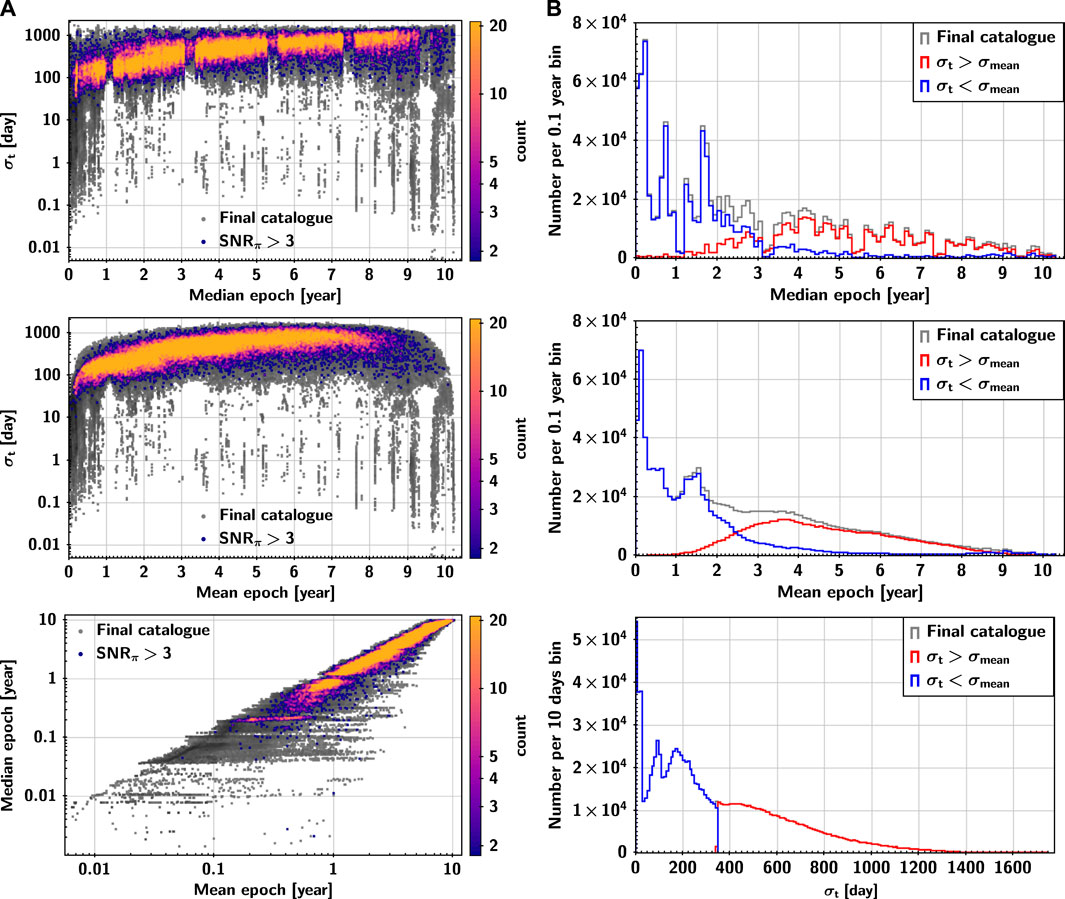
FIGURE 10. Summary statistics of the celestial observation time series. Left figures: The color dots represent the sources with SNRπ > 3. The grey dots represent all the sources in the final catalogue and are used as reference background stars. Right figures: The grey steps are all the sources in the final catalogue. The red and blue steps are the sources with σt > σmean and σt < σmean, respectively.
We develop an astrometric model to analyze the simulation astrometric epoch data and evaluate the astrometric capability of CSST under a specific survey schedule. The simulated observations are implemented based on a specific survey schedule, in which we simulate the observation errors as Gaussian noise based on the magnitude dependence of astrometric uncertainty.
In the final catalogue, 97.18% of the sources have 5-parameter solutions, and 98.57% of the sources have 4-parameter solutions. The accuracy of parallax and proper motion of CSST is about the order of 0.1–1.0 mas (⋅ yr−1) for the sources of 18–22 mag in g band, and 1 to 10 mas (⋅ yr−1) for the sources of 22–26 mag in g band, respectively. The accuracy of the proper motion of CSST is significantly better for the sources with σt > σmean compared to the sources with σt < σmean. The assumptions used in this paper are very optimistic and simple, it is foreseen that the results from the real survey could be worse. We will study these issues in detail in the future.
Through the analysis of the astrometric capability of CSST, we pointed out aspects of the specific survey schedule that can be optimized. The quality and quantity of CSST observations can be further improved by optimizing the observation arrangements in the sky areas where the observations do not meet the requirements. In the future, we will iterate with the survey schedule mutually to provide independent evaluation opinions for CSST’s survey strategic arrangement.
The original contributions presented in the study are included in the article/Supplementary Material, further inquiries can be directed to the corresponding authors.
S-LL and Z-XQ are responsible for supervising the model construction and astrometric epoch data simulation. Z-SF simulates the CSST data and solves the observations equation with meticulous efforts and wrote the manuscript with help mainly from S-LL. Besides, X-YP, Y-Y, and Q-QW contributed to the physical interpretation and discussion. LS and Y-HX contributed to the formation of CSST survey schedule.
This work has been supported by the Youth Innovation Promotion Association CAS with Certificate Number 2022259, the grants from the Natural Science Foundation of Shanghai through grant 21ZR1474100, and National Natural Science Foundation of China (NSFC) through grants 12173069, and 11703065. We acknowledge the science research grants from the China Manned Space Project with NO.CMS-CSST-2021-A12, NO.CMS-CSST-2021-B10 and NO.CMS-CSST-2021-B04.
This work has made use of data from the European Space Agency (ESA) mission Gaia (https://www.cosmos.esa.int/gaia), processed by the Gaia Data Processing and Analysis Consortium (DPAC, https://www.cosmos.esa.int/web/gaia/dpac/consortium). Funding for the DPAC has been provided by national institutions, in particular the institutions participating in the Gaia Multilateral Agreement. We are also very grateful to the developers of the TOPCAT (Taylor, 2005) software.
The authors declare that the research was conducted in the absence of any commercial or financial relationships that could be construed as a potential conflict of interest.
The Reviewer ZW declared a shared affiliation with the authors at the time of the review.
The Reviewer ZLY declared a shared INSTITUTION with the authors at the time of the review.
All claims expressed in this article are solely those of the authors and do not necessarily represent those of their affiliated organizations, or those of the publisher, the editors and the reviewers. Any product that may be evaluated in this article, or claim that may be made by its manufacturer, is not guaranteed or endorsed by the publisher.
The Supplementary Material for this article can be found online at: https://www.frontiersin.org/articles/10.3389/fspas.2023.1146603/full#supplementary-material
1The area of 12000 square degrees is not covered by the entire band but by any band once.
2This is not the ultimate survey strategy, but only a typical case in the current study. The optimization of the survey strategy is still on going.
3The Gaia DR3 catalogue is the outcome of analyzing raw data from the first 34 months of the Gaia mission. Description at https://cosmos.esa.int/web/gaia/dr3; data available on https://gea.esac.esa.int/archive/.
4Data available on https://gea.esac.esa.int/archive/visualization/.
5CSST plans to survey the sky in NUV, u, g, r, i, z and y bands, however, for simplicity in this simulation, we concentrate in g band, which has a magnitude limit from around 18 to 26 mag.
6We mark the beginning time as zero, the end time is the 10 Th year.
Brown, A. G., Vallenari, A., Prusti, T., De Bruijne, J., Babusiaux, C., Biermann, M., et al. (2021). Gaia early data release 3. Astronomy Astrophysics 649, A1. doi:10.1051/0004-6361/202141135
Cao, Y., Gong, Y., Liu, D., Cooray, A., Feng, C., and Chen, X. (2022). Anisotropies of cosmic optical and near-ir background from the China space station telescope (csst). Mon. Notices R. Astronomical Soc. 511, 1830–1840. doi:10.1093/mnras/stac151
Cao, Y., Gong, Y., Meng, X.-M., Xu, C. K., Chen, X., Guo, Q., et al. (2018). Testing photometric redshift measurements with filter definition of the Chinese space station optical survey (css-os). Mon. Notices R. Astronomical Soc. 480, 2178–2190. doi:10.1093/mnras/sty1980
Gai, M., Vecchiato, A., Busonero, D., Riva, A., Cancelliere, R., Lattanzi, M., et al. (2022). Consolidation of the gaia catalogue with Chinese space station telescope astrometry. Front. Astronomy Space Sci. 9, 1002876. doi:10.3389/fspas.2022.1002876
Gong, Y., Liu, X., Cao, Y., Chen, X., Fan, Z., Li, R., et al. (2019). Cosmology from the Chinese space station optical survey (css-os). Astrophysical J. 883, 203. doi:10.3847/1538-4357/ab391e
Lindegren, L. (2013). “High-accuracy positioning: Astrometry,” in Observing photons in space: A guide to experimental space astronomy, 299–311.
Lindegren, L., Klioner, S., Hernández, J., Bombrun, A., Ramos-Lerate, M., Steidelmüller, H., et al. (2021). GaiaEarly Data Release 3: Parallax bias versus magnitude, colour, and position. Astronomy Astrophysics 649, A2–A4. doi:10.1051/0004-6361/202039653
Lindegren, L. (1978). “Photoelectric astrometry-a comparison of methods for precise image location,” in IAU colloq. 48: Modern astrometry, 197.
Michalik, D., Lindegren, L., Hobbs, D., and Lammers, U. (2014). Joint astrometric solution of hipparcos andGaia: A recipe for the hundred thousand proper motions project ⋆. Astronomy Astrophysics 571, A85. doi:10.1051/0004-6361/201424606
Prusti, T., De Bruijne, J., Brown, A. G., Vallenari, A., Babusiaux, C., Bailer-Jones, C., et al. (2016). The gaia mission. Astronomy astrophysics 595, A1.
Su, D.-Q., and Cui, X.-Q. (2014). Two suggested configurations for the Chinese space telescope. Res. Astronomy Astrophysics 14, 1055–1060. doi:10.1088/1674-4527/14/9/001
Taylor, M. B. (2005). “Topcat & stil: Starlink table/votable processing software,” in Astronomical data analysis software and systems XIV, 347, 29.
Vallenari, A., Brown, A., and Prusti, T. (2022). Gaia data release 3. summary of the content and survey properties. Astronomy Astrophysics. doi:10.1051/0004-6361/202243940
Van Altena, W. F. (2013). Astrometry for astrophysics: Methods, models, and applications. Cambridge University Press.
Zhan, H. (2018). “An overview of the Chinese space station optical survey,” in 42nd COSPAR scientific assembly, 42, E1–E16.
Zhan, H. (2011). Consideration for a large-scale multi-color imaging and slitless spectroscopy survey on the Chinese space station and its application in dark energy research. Sci. Sinica Phys. Mech. Astronomica 41, 1441–1447. doi:10.1360/132011-961
Keywords: astrometry, data analysis, proper motion, parallax, simulations
Citation: Fu Z-S, Qi Z-X, Liao S-L, Peng X-Y, Yu Y, Wu Q-Q, Shao L and Xu Y-H (2023) Simulation of CSST’s astrometric capability. Front. Astron. Space Sci. 10:1146603. doi: 10.3389/fspas.2023.1146603
Received: 17 January 2023; Accepted: 03 April 2023;
Published: 02 June 2023.
Edited by:
Zhoujian Cao, Beijing Normal University, ChinaReviewed by:
Niu Liu, Nanjing University, ChinaCopyright © 2023 Fu, Qi, Liao, Peng, Yu, Wu, Shao and Xu. This is an open-access article distributed under the terms of the Creative Commons Attribution License (CC BY). The use, distribution or reproduction in other forums is permitted, provided the original author(s) and the copyright owner(s) are credited and that the original publication in this journal is cited, in accordance with accepted academic practice. No use, distribution or reproduction is permitted which does not comply with these terms.
*Correspondence: Zhao-Xiang Qi, enhxaUBzaGFvLmFjLmNu; Shi-Long Liao, c2hpbG9uZ2xpYW9Ac2hhby5hYy5jbg==
Disclaimer: All claims expressed in this article are solely those of the authors and do not necessarily represent those of their affiliated organizations, or those of the publisher, the editors and the reviewers. Any product that may be evaluated in this article or claim that may be made by its manufacturer is not guaranteed or endorsed by the publisher.
Research integrity at Frontiers

Learn more about the work of our research integrity team to safeguard the quality of each article we publish.