 Lijuan Liu1,2,3*
- 1Planetary Environmental and Astrobiological Research Laboratory (PEARL), School of Atmospheric Sciences, Sun Yat-sen University, Zhuhai, China
- 2CAS Center for Excellence in Comparative Planetology, China
- 3Key Laboratory of Tropical Atmosphere-Ocean System, Sun Yat-sen University, Ministry of Education, Zhuhai, China
Solar active regions are the main sources of large solar flares and coronal mass ejections. It is found that the active regions producing large eruptions usually show compact, highly sheared polarity inversion lines. A scenario named “collisional shearing” is proposed to explain the formation of this type of polarity inversion lines and the subsequent eruptions, which stresses the role of collision and shearing induced by relative motions of different bipoles in their emergence. However, in observations, if not considering the evolution stage of the active regions, about one-third of the active regions that produce large solar eruptions govern a spot–spot-type configuration. In this work, we studied the full evolution of an emerging AR, which showed a spot–spot-type configuration when producing a major eruption, to explore the possible evolution gap between the “collisional shearing” process in flux emergence and the formation of the spot–spot-type, eruption-producing AR. We tracked the AR from the very beginning of its emergence until it produced the first major eruption. It was found that the AR was formed through three bipoles emerging sequentially. The bipoles were arranged in parallel on the photosphere, shown as two clusters of sunspots with opposite-sign polarities, so that the AR exhibited an overall large bipole configuration. In the fast emergence phase of the AR, the shearing gradually occurred due to the proper motions of the polarities, but no significant collision occurred due to the parallel arrangement of the bipoles nor did the large eruption occur. After the fast emergence phase, one large positive polarity started to show signs of decay. Its dispersion led to the collision to a negative polarity which belonged to another bipole. A huge hot channel spanning the entire AR was formed through precursor flarings around the collision region. The hot channel erupted later, accompanied by an M7.3-class flare. The results suggest that in the spot–spot-type AR, along with the shearing induced by the proper motions of the polarities, a decay process may lead to the collision of the polarities, driving the subsequent eruptions.
1 Introduction
Solar flares and coronal mass ejections (CMEs) are the most violent phenomena in the solar atmosphere. They both have the capacity to cause hazardous space weather in the near-earth environment. Therefore, studying their origin is of fundamental importance in space weather forecasting. Except the ones associated with quiescent filament eruptions, most of the flares and CMEs originate from solar active regions (ARs). ARs appear as strong magnetic flux concentrations on the photosphere, which are believed to be formed through the magnetic flux emergence from the solar interior. The emergence of a flux tube may form the simplest bipolar region (Schmieder et al., 2014). The strong magnetic flux concentrations are manifested as regions containing dark sunspots in white-light emission. The ability of the ARs to produce large eruptions varies greatly as suggested by the observations (Chen et al., 2011; Wang et al., 2011). To distinguish the productive and inert ARs, great efforts have been carried out in characterizing the magnetic properties of the ARs from the routine observations of the photospheric magnetic field, since the direct measurement of coronal magnetic field is not available until now (Falconer et al., 2002; Leka and Barnes, 2003; Falconer et al., 2006; Georgoulis and Rust, 2007; Leka and Barnes, 2007; Falconer et al., 2008; Bobra and Couvidat, 2015). It is found that the ARs capable of producing large eruptions usually hold a more complex configuration (Toriumi et al., 2016, and references therein), such as the δ sunspot, where two umbrae of opposite-sign polarities share a common penumbra (Künzel, 1960). This kind of complex configuration indicates a higher degree of non-potentiality; therefore, the parameters characterizing the non-potentiality of the regions, such as magnetic shear, electric current density, and current helicity, tend to be higher in the region (Sun et al., 2015; Liu et al., 2016). It should be noted that the higher degree of non-potentiality, i.e., enough magnetic free energy, is only a necessary condition to power large eruptions. The exact triggering of the eruptions might involve a more specific mechanism such as magnetohydrodynamics (MHD) instabilities (Török et al., 2004; Kliem and Török, 2006) or magnetic reconnection (Antiochos et al., 1999; Moore et al., 2001).
When looking into the eruption-producing ARs, the strong-field, high-gradient sheared polarity inversion line (PIL), which is formed between opposite-sign polarities that are located in close proximity, is found to be a common source of large eruptions (Schrijver, 2007; Schrijver, 2009). Shearing motion, sunspot rotation, and converging motions are frequently observed near the sheared PIL (Zhang et al., 2007; Li and Zhang, 2009; Green et al., 2011; Yan et al., 2015). The former two are thought to be able to shear and twist the field lines, injecting magnetic free energy and magnetic helicity to the coronal field. The latter is believed to be able to bring the opposite-sign magnetic field together, leading to flux cancellation (mild magnetic reconnection near the photosphere) which may form the magnetic flux rope and drive the subsequent eruptions as suggested by the flux cancellation model (van Ballegooijen and Martens, 1989).
Considering the entire evolution of an AR from its emergence to decay, the eruptions may occur at any stage (van Driel-Gesztelyi and Green, 2015, and references therein). Nevertheless, observations suggest that compared to the ARs entering the decaying phase, the ARs which are still emerging and evolving tend to produce more violent eruptions (Schrijver, 2009).
In general, it is suggested by the observations that the sheared PIL accompanied by the shearing motion and flux cancellation in emerging ARs is a place prone to major solar eruptions. The physics behind the phenomena is not entirely clear. Recently, a scenario named “collisional shearing,” is proposed to explain the origin of large solar eruptions from emerging ARs (Chintzoglou et al., 2019). Through studying the evolution of two well-observed highly productive ARs, the authors suggest that these are the relative motions between non-conjugated opposite-sign polarities leading to the formation of the sheared PIL and continuous shearing and flux cancellation around the PIL which are responsible for the series of eruptions. The relative motion between non-conjugated polarities resulted from the proper separation of conjugated polarities when a flux tube emerges from the dense interior of the Sun into the tenuous corona. Moreover, a statistical research study on 19 ARs which emerged and produced at least one major eruption on the visible solar disk also suggests that the collisional shearing between non-conjugated polarities may be a common process at the source locations of large eruptions in emerging ARs (Liu et al., 2021). Those works stressed the role of interaction between non-conjugated polarities of different bipoles in driving eruptions in emerging ARs.
In observations, the emerging ARs evolve rapidly, so the original conjugation of polarities may be blurred by multiple episodes of flux cancellation and magnetic reconnection later. Therefore, the most reliable way to determine the conjugation of polarities is to track the AR from the very beginning of its emergence to inspect the typical features between emerging conjugated polarities such as small moving dipoles on the photosphere (Strous and Zwaan, 1999) and arch filaments in chromospheric observation. However, the limited observations of a photospheric magnetic field, which are mainly for the visible solar disk at present, restrict larger statistical research on the “collisional shearing” process. On the other hand, Toriumi et al. (2016) performed a statistical research study on 29 ARs that produced 51 flares larger than GOES M5.0 class in solar cycle 24, mainly focusing on the pre-flare magnetic properties of the ARs rather than their evolution. In addition to the classification of magnetic patterns of δ sunspots proposed by Zirin and Margaret (1987), the authors classified the productive ARs into four groups, including the “spot-spot” group, “spot-satellite” group, “quadrupole” group, and the “inter-AR” group. For the latter three groups, different bipoles are involved in forming the sheared PIL where the eruptions occur, so that the bipole–bipole interaction plays a role in driving the eruption. For the former group which accounts for about one-third of the sample, the sheared PIL is formed between two major polarities or two groups of opposite-sign sunspots; it is not clear if the bipole–bipole interaction and thus “collisional shearing” exist and play a role in driving eruptions. Further study is needed.
In this work, we searched the sample in Toriumi et al. (2016) and found an AR (NOAA AR 12036) of spot–spot configuration which emerged and produced an M7.3-class eruptive flare on the visible solar disk. We tracked the evolution of the AR to see what caused it to produce the large eruption.
2 Data analysis
We used the photospheric vector magnetograms provided by the Helioseismic and Magnetic Imager (HMI, Scherrer et al. (2012)) onboard the Solar Dynamics Observatory [SDO, Pesnell et al. (2012)] to investigate the evolution of the magnetic properties of the AR. The data have a plate scale of 0.′′5 and a temporal cadence of 720 s. Here, a data segment which is de-projected from the native helioprojective Cartesian coordinate to a cylindrical equal area (CEA) coordinate is used (Bobra et al., 2014). HMI also provides the photospheric continuum intensity maps, which is used here to examine the evolution of the sunspots in the AR.
We used the ultraviolet (UV) and extreme ultraviolet (EUV) images provided by the Atmospheric Imaging Assembly [AIA, Lemen et al. (2012)] onboard the SDO to examine the coronal evolution of the AR and the eruption details of the M7.3-class flare. The data have a plate scale of 0.′′6 and a temporal cadence of up to 12 s.
To determine the connectivity between conjugated polarities in the early emergence phase more accurately, we performed a potential field extrapolation (Alissandrakis, 1981) to the normal component of the photospheric magnetic field (Bz) and analyzed the extrapolated field lines.
We analyzed the motions and flows in the ARs in two ways. The first way is to track the macroscopic motion of the large polarities which formed the main PIL where the eruption occurred. The second way is to analyze the microscopic flow fields of the region. For the first way, we first detected the local peaks in each polarity on each magnetogram of Bz, and then, for each polarity, we calculated a flux-weighted centroid in a circle which took the detected peak as the center and a radius of 5 mm (Chintzoglou et al., 2019; Liu et al., 2021). For the second way, we used a Fourier-based local correlation tracking (FLCT) method (Welsch et al., 2004) to calculate the horizontal velocity field of the intensity features on the Bz magnetograms. The velocity field is suggested to be able to affect the photospheric footpoints of the coronal field.
We extracted the source PIL of the eruption by drawing a contour line of Bz = 0 on the smoothed Bz magnetograms. To further assess the degree of collision along the PIL, we calculated the gradient of Bz across the PIL through
3 Results
3.1 Evolution of the AR
The AR (NOAA AR 12036) started to emerge from around 2014-04-12 03:22 UT in the southern hemisphere. Except for a series of small flarings, it produced no major eruption (flares larger than M-class or CMEs) until 18 April. The first major eruption from the AR is an M7.3-class flare (SOL 2014-04-18T12:31, Figure 1D). The AR held an overall bipolar configuration, i.e., a spot–spot configuration prior to the flare, consisting of two groups of sunspots of the opposite-sign flux (Figures 1A, B). The flare originated from the main PIL formed between the two groups of polarities as suggested by the flare ribbons along the PIL (Figure 1C).
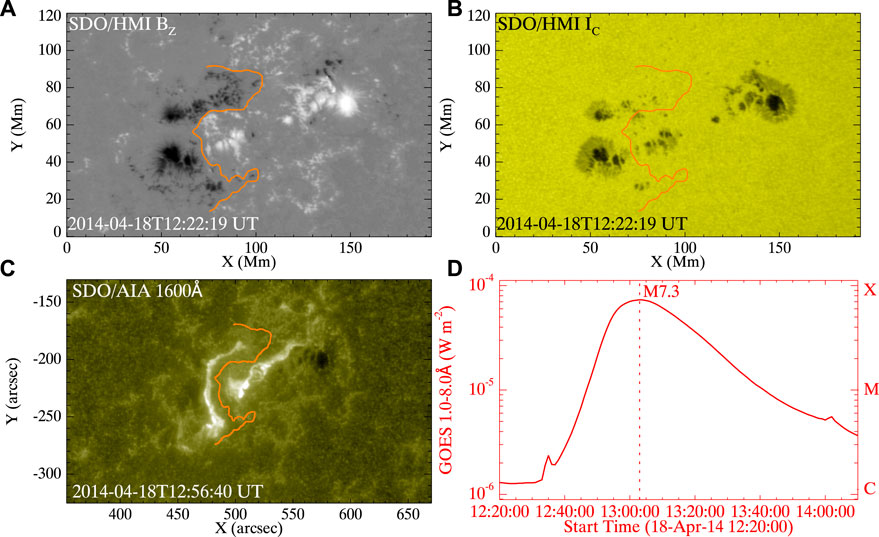
FIGURE 1. Overview of NOAA AR 12036 and its first major eruption, an M7.3-class flare (SOL 2014-04-18T12:31). (A) Photospheric Bz map prior to the flare, in which Bz saturates at ± 2000 G. (B) Photospheric continuum intensity at the same time as panel (A). (C) SDO/AIA 1600-Å images taken during the flare. The orange curves in the three panels are the PILs where the eruption occurs. (D) Light curve of the GOES 1-8 Å flux during the M7.3-class flare. The vertical line indicates the peak time of the flare.
We first examined the unsigned magnetic flux (Φ) of the entire AR. In general, Φ increased fast before around 2014-04-15 09:10 UT, reaching 1.55 × 10²² Mx with a mean emergence rate of 1.98 × 10²⁰ Mx per hour. The increase then slowed down, as the Φ reached 2.11 × 10²² Mx before the flare with a mean emergence rate of 7.50 × 10¹⁹ Mx per hour. By observing the photospheric magnetograms, we found that the AR was roughly formed by three bipoles which emerged sequentially. The first bipole (polarities P1 and N1 in Figure 2), the appearance of which made the AR appear, started to emerge from around 2014-04-12 03:22 UT. It emerged in the northern region of the AR if we took the pre-flare configuration of the AR (Figure 1A) as the reference. The second bipole (polarities P2 and N2 in Figure 2) started to emerge from around 2014-04-13 18:10 UT in the southern region of the AR. The two bipoles were located in parallel, i.e., the axis connecting the two main conjugated polarities of each bipole was parallel to each other. From around 2014-04-14 09:10 UT, a positive polarity (marked as P3 in Figure 2) started to emerge in between the two polarities of the second bipole. The negative flux connected to P3 was part of the polarity N2 and therefore cannot be separated from N2. The connectivity between the conjugated polarities of each bipole in their early emergence was confirmed by the potential field extrapolation (colored lines in Figures 2B–D). Although the three bipoles started to emerge before 2014-04-15 09:10 UT, i.e., in the overall fast emergence phase we described previously, the appearance of each bipole affected the emergence rate differently. Before the second bipole appeared, the magnetic flux increased slowly with a mean emergence rate of around 6.18 × 10¹⁹ Mx per hour. After the appearance of the second bipole, Φ increased faster with a mean emergence rate of around 2.60 × 10²⁰ Mx per hour. After the third bipole appeared, Φ increased even faster with a mean emergence rate of around 3.82 × 10²⁰ Mx per hour until 2014-04-15 09:10 UT, after which the flux emergence slowed down.
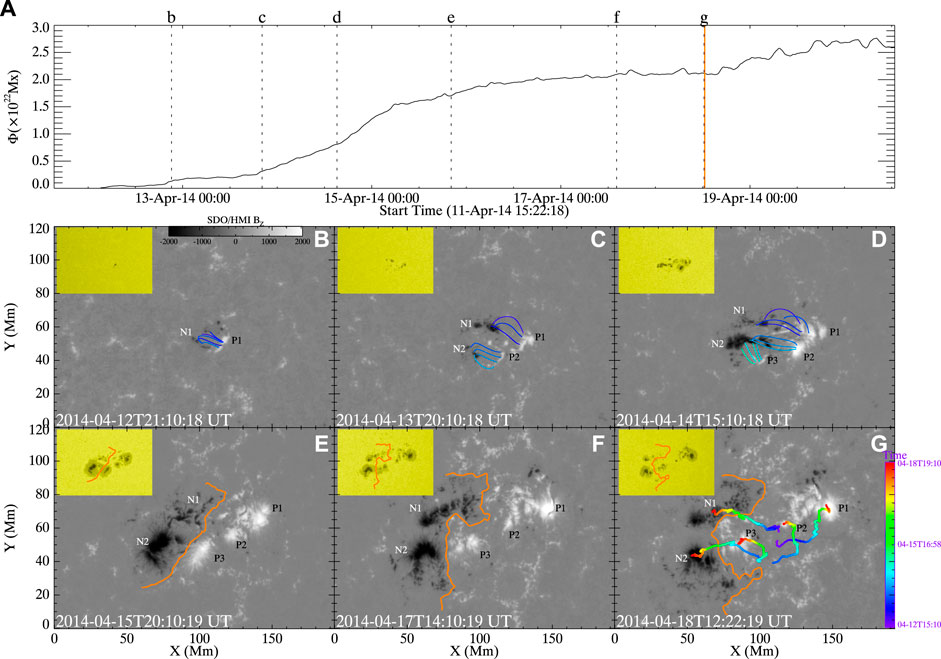
FIGURE 2. Overall evolution of the AR. (A) Unsigned magnetic flux Φ of the AR. The vertical-dashed lines indicate the times of panels. (B–G) The orange vertical line marks the start time of the M7.3-class flare. Snapshots of the photospheric Bz showing the evolution of the AR. The insets in each panel show the photospheric continuum intensity at the same time as Bz maps. The labels “P1,” “N1,” “P2,” “N2,” and “P3” mark different polarities. The colored lines in panels (B–G) are the coronal field lines extracted from the potential field extrapolation, showing the connectivity of different polarities in their early emergence phase. The colored curves in panel (G) show the trajectories of the centroids of each polarity, of which the color is coded by the elapsed time. The orange curves in (E–G) are the source PIL extracted on magnetograms at different times. An associated animation (Supplementary Video S1) is available online.
The trajectories of the polarities (colored lines in Figure 2G) showed the separation between conjugated polarities and an overall northward motion of all polarities. As emergence went on, all of the positive polarities were located on one side and all of the negative polarities were located on the other side, so a single PIL can be drawn between them (orange curves in Figures 2E–G). The PIL obtained before the flare (Figure 2G) was more sheared than that obtained earlier (Figure 2E). This may be because the proper motions of different polarities were different in magnitudes and directions, so the PIL may be sheared gradually. For example, for the polarities P3 and N1, although both polarities showed northeastward motion, N1 passed through a longer trajectory than P3 in the same period (Figure 2G), therefore resulting in a shear motion of N1 relative to P3. The M7.3-class flare occurred above the sheared PIL eventually.
3.2 Evolution of the polarity P3
Before the flare, the middle part of the PIL was formed between the non-conjugated P3 and N1 (Figure 2G), showing a sign of collision, i.e., the two polarities were located very close to each other. Through tracking the two polarities, we found that the collision was mainly resulted from the evolution of the polarity P3. The results are shown in Figures 3–5.
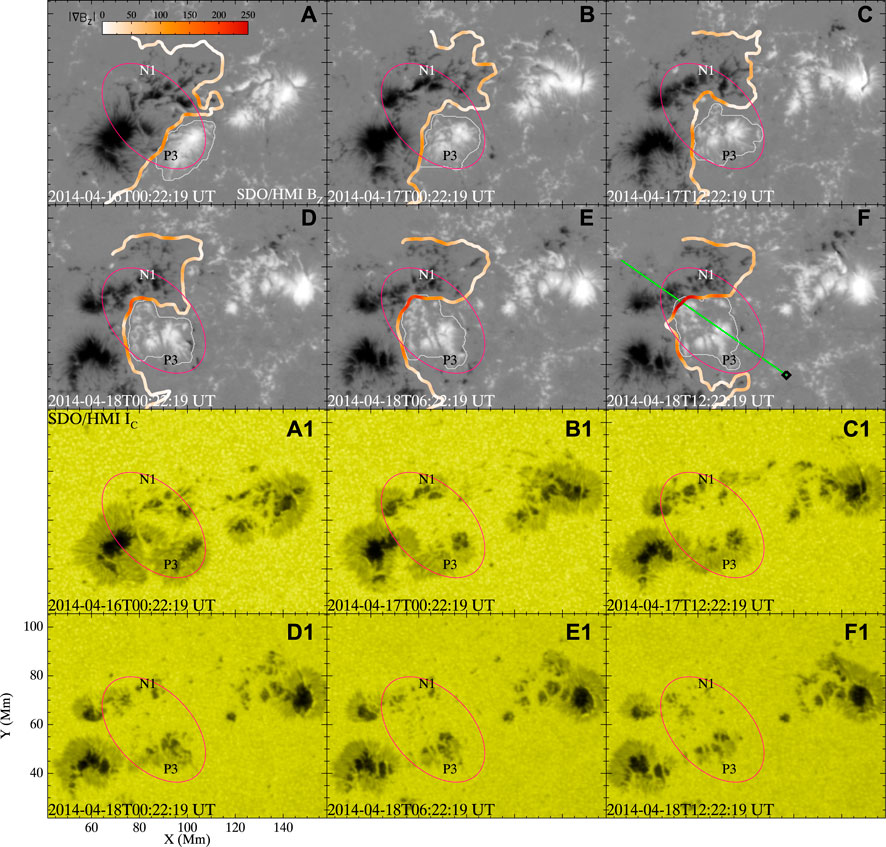
FIGURE 3. Evolution of the positive polarity P3. (A–F) Snapshots of the Bz magnetograms zoomed on the polarities P3 and N1. The white contours outline the boundary of P3, within which the magnetic flux of P3 is calculated. The green line in panel (F) indicates the slice (taking the black diamond symbol as the start point) used to generate the time–distance plot of Bz in Figure 4A. (A1–F1) Continuum intensity images corresponding to the Bz maps. The magenta ellipse in each panel marks the interface region of the polarities P3 and N1. The colored curves are the PILs at each moment, the color of which is coded by the gradient of Bz (▿Bz, in unit of G Mm−1) across the PIL. An associated animation (Supplementary Video S2) is available online.
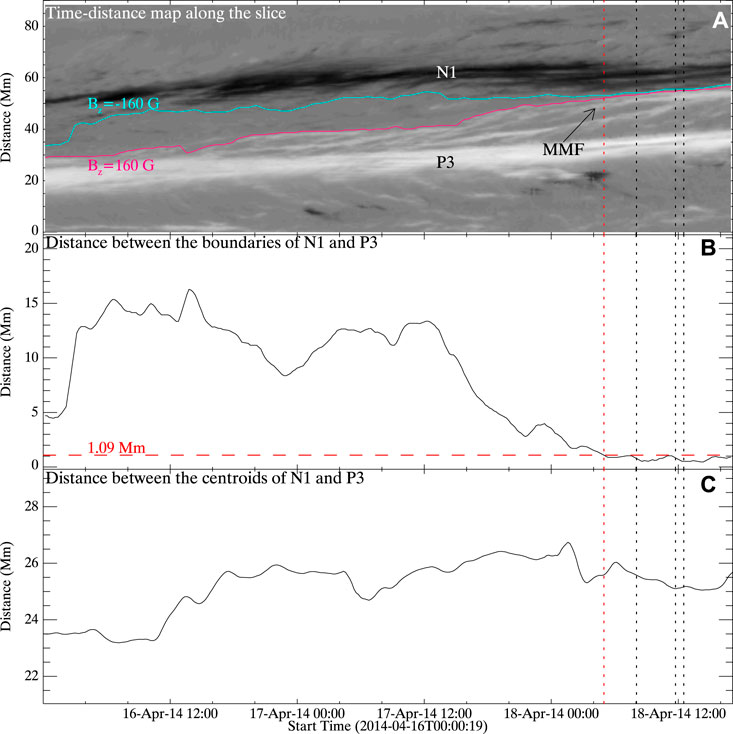
FIGURE 4. (A) Time–distance map of Bz along the slice (shown as a green line Figure 3F). The cyan and magenta curves are the contour lines of −160 G and 160 G drawn from the map, respectively, outlining the inner boundaries of the polarities N1 and P3. The black arrow indicates the moving magnetic features streaming away from P3. The red vertical line marks the time when the distance between the inner boundaries of polarities P3 and N1 drops below the width of three pixels (1.09 Mm). The three black vertical lines indicate the start timings of the first precursor flaring, the second precursor flaring, and the M7.3-class flare, respectively. (B) Distance between the inner boundaries of the polarities P3 and N1. The red horizontal line indicates the distance value of 1.09 Mm. (C) Distance between the flux-weighted centroids of the polarities P3 and N1. The vertical lines in panels (B) and (C) have the same meanings as those in panel (A).
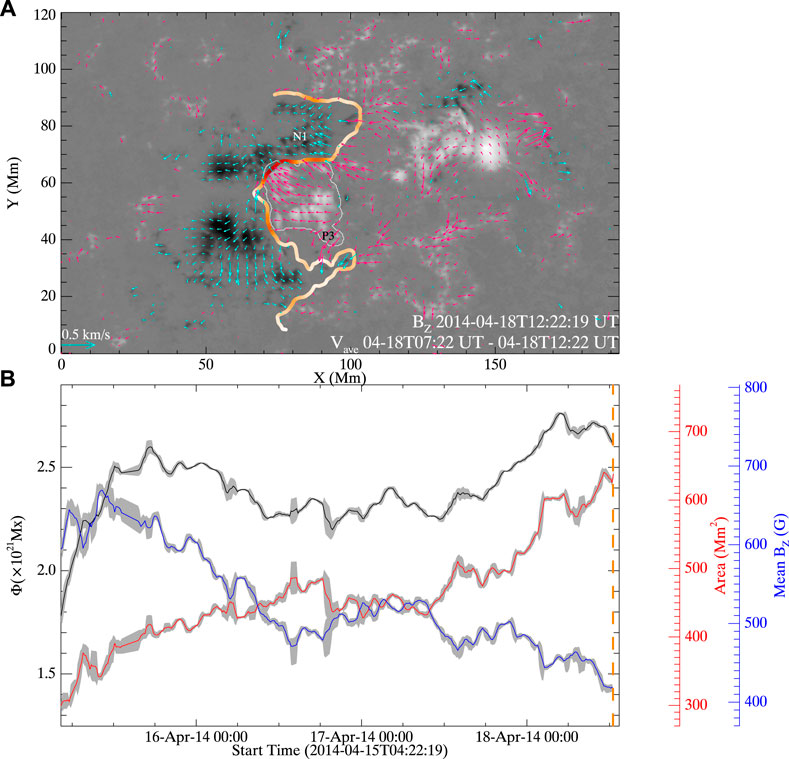
FIGURE 5. (A) Horizontal velocity field (Vave) averaged in 5 hours prior to the M7.3-class flare. The magenta arrows are for the positive flux, while the cyan arrows are for the negative flux. The PIL and boundary of polarity P3 have the same meaning as the ones in Figure 3. (B) Unsigned magnetic flux, area, and mean Bz of polarity P3. The gray regions mark the uncertainties of the parameters. The orange vertical line marks the start time of the M7.3-class flare.
In the early phase of the emergence, the polarities P3 and N1 were not that close to each other, as indicated by the relatively low gradient of Bz (▿Bz) across the PIL (colored curves in Figures 3A, B). Later, although the flux emergence of the entire AR continued, the polarity P3 showed a sign of decay; its area became larger and the sunspot in it lost the coherence gradually and became a set of pores; small magnetic features were found streaming away from the polarity P3, moving to N1 (Figures 3C–F and Figures 3C1–F1). They are usually called moving magnetic features [MMFs, van Driel-Gesztelyi and Green (2015)]. As the MMFs approached the boundary of N1, the collision gradually occurred at the interface between P3 and N1. This was supported by the growing ▿Bz in the PIL part between the polarities P3 and N1 (darker color of PILs in Figures 3D–F).
The aforementioned process was further examined in detail through analyzing the time–distance map of Bz in a slice (green line in Figure 3F) across the interface between the polarities P3 and N1 (Figure 4). The inner boundaries of P3 and N1, i.e., the boundary parts next to the PIL, were extracted from the time–distance map with the thresholds of −160 G and 160 G, respectively (cyan and magenta lines in Figure 4A). By measuring the distance between the boundaries of the two polarities, we found that the distance first increased from around 4.70 Mm–16.28 Mm in the early emergence phase and then varied between 13.36 Mm and 16.28 Mm until 2012-04-17 12:10 UT (Figure 4B). It then decreased fast, dropping below 1.09 Mm from around 2014-04-18 04:58 UT and varied between 0.48 Mm and 1.09 Mm until the M7.3-class flare. The value of 1.09 Mm is the width of three pixels on the magnetograms. When taking this value as the threshold of collision, one can conclude that the collision occurred from around 2014-04-18 04:58 UT. The fast approaching interface between P3 and N1 mainly resulted from the MMFs (indicated by the black arrow in Figure 4A). We also checked the distance between the flux-weighted centroids of the two polarities (Figure 4C). It is seen that this distance did not change much. It first increased from 23.50 Mm to 26.74 Mm and then slightly decreased to 25.15 Mm prior to the M7.3-class flare. The results suggest that the collision mainly resulted from the MMFs streaming away from P3 rather than the overall large-scale motions of the polarities. The flows described previously were also observed through the flow field in the polarity P3: the velocities averaged in 5 h before the flares confirmed a northeastward flow heading to the polarity N1 (Figure 5A).
We further analyzed the evolution of the polarity P3 quantitatively. The boundary of the polarity P3 on each magnetogram was determined through a series of morphological operations, including the morphological open, morphological close, and the region that is growing, which were performed on the strong field kernels selected by a threshold of 160 G. The slight discrepancy between the boundary of P3 and the PIL was because the former was extracted from the original magnetogram, while the latter was extracted from the smoothed magnetogram. The unsigned magnetic flux Φ, area, and mean Bz of the polarity P3 were then calculated (Figure 5B). It is found that the unsigned magnetic flux of the polarity (black curve in Figure 5B) increased fast before around 2013-04-15 17:22 UT to around 2.60 × 10²¹ Mx. After the fast emergence phase, Φ varied slowly between 2.25 × 10²¹ and 2.60 × 10²¹ Mx until 2013-04-17 18:10 UT. A slow emergence phase occurred later, within which Φ increased to around 2.70 × 10²¹ Mx before the flare. The area of the polarity (red curve in Figure 5B) kept increasing, reaching around 638 Mm2 before the flare. The mean Bz of the region (blue curve in Figure 5B) increased to 670 G in the fast emergence phase before around 2013-04-15 12:10 UT and then kept decreasing to 420 G before the flare. The evolution of the three parameters suggested that after the fast emergence phase, although the slow flux emergence still continued, the polarity P3 underwent a significant dispersion as suggested by the increasing area and decreasing mean Bz in it. Combined with the MMFs and the decaying sunspot in P3 observed in the magnetograms and continuum intensity images (Figure 3), it was concluded that the polarity P3 underwent a decaying process in general.
3.3 Precursor flarings and the M7.3-class flare
The aforementioned results suggested that the decay of polarity P3 after the fast emergence phase resulted in the collision to polarity N1, creating a location favorable for flux cancellation and reconnection. We further checked the evolution of the AR in the EUV observations, and it was found that before the flare, a hot channel which is deemed as the proxy of a flux rope was formed through small-scale flarings ignited near the interface between P3 and N1. The eruption of the hot channel was responsible for the M7.3-class flare and an accompanied CME (not shown here). The results are shown in Figures 6, 7.
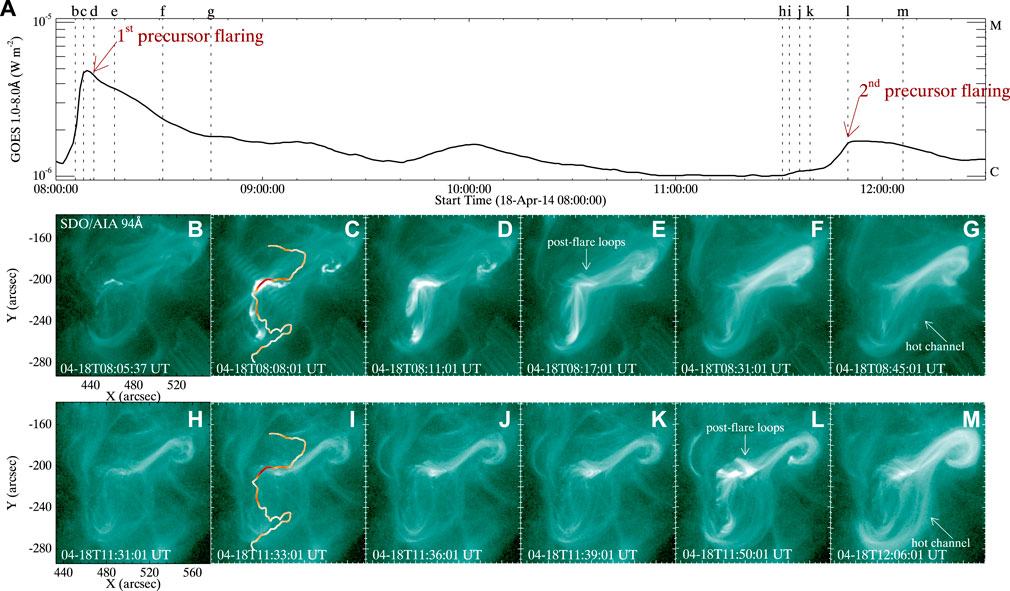
FIGURE 6. Two precursor small flarings prior to the M7.3-class flare. (A) Light curve of the GOES 1-8 Å flux during the two precursor flarings. Vertical-dashed lines mark the time of the EUV images shown. (B–G) SDO/AIA 94-Å images capturing the first precursor flaring. (H–M) SDO/AIA 94-Å images for the second precursor flaring. The colored curves in (C) and (I) are PILs, the color of which has the same meaning as those in Figure 3. An associated animation (Supplementary Video S3) is available online.
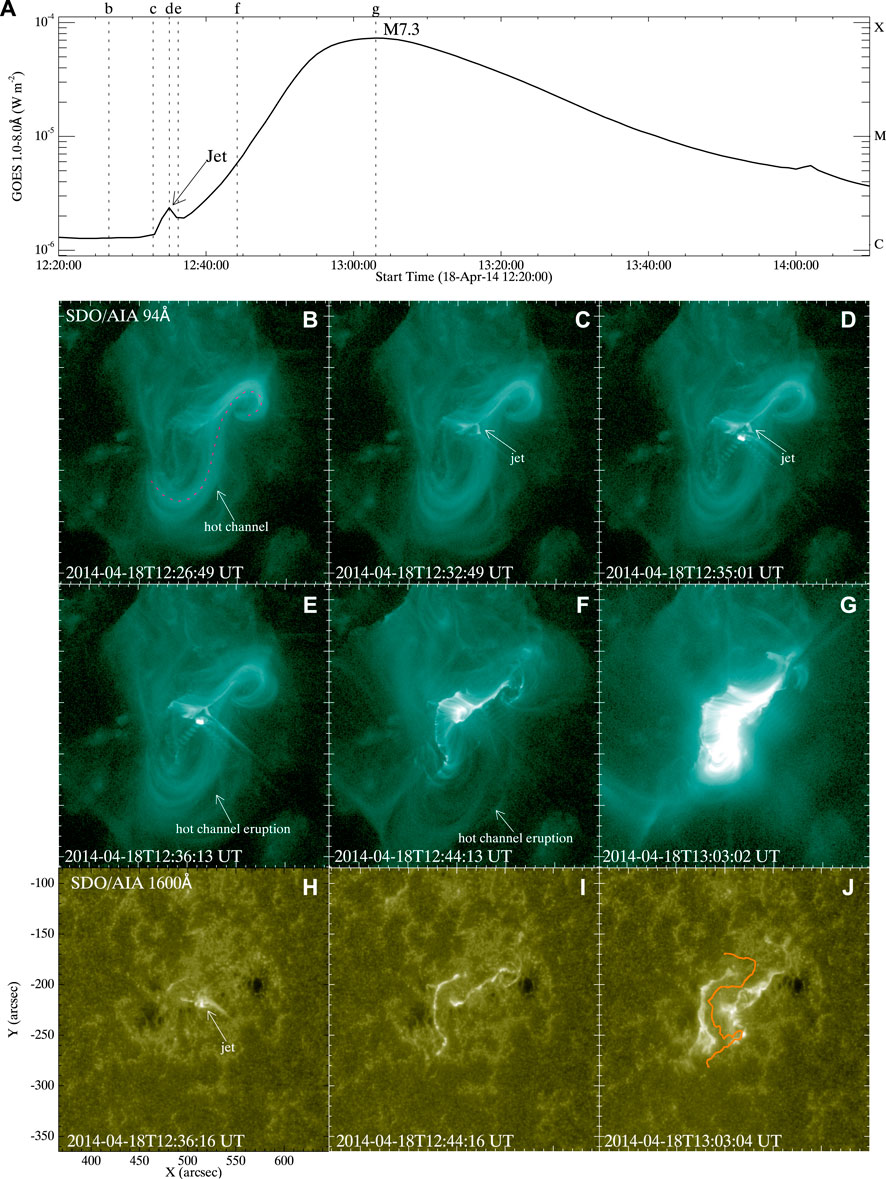
FIGURE 7. Eruption details of the M7.3-class flare. (A) Light curve of the GOES 1-8 Å flux during the flare. (B–G) Snapshots of SDO/AIA 94-Å images during the flare. (H–J) Snapshots of SDO/AIA 1600-Å images during the flare. The orange curve outlines the source PIL of the eruption. An associated animation (Supplementary Video S4) is available online.
Around 5 h before the major flare, two main precursor flarings occurred. The first one is recorded as a C4.8-class flare (SOL 2014-04-18T08:03). In this precursor, the flaring ignited from the high-gradient part of the PIL, i.e., the collisional interface between P3 and N1 (Figures 6B–G). As the flaring went on, small sets of post-flare loops appeared above the high-gradient part of the PIL, accompanied by the appearance of a hot channel in the SDO/AIA 94 Å images. These suggested that there was a tether-cutting type reconnection occurring around the interface region between the polarities P3 and N1, i.e., in between the sheared loops connecting P3 and N2 and those connecting P1 and N1, forming the nearly potential post-flare loops below and the continuous hot channel above. The second precursor flaring (which started from around 2014-04-18 11:44 UT) was similar to the first one. It was manifested as a mild bump in the GOES soft X-ray flux and therefore was not being classified as a GOES flare. However, the SDO/AIA 94 Å images suggested that the flaring also ignited from the interface between polarities P3 and N1, after which the post-flare loops appeared above the collisional PIL part, accompanied by the appearance of a continuous S-shaped hot channel spanning the entire PIL (Figures 6H–M).
After the second precursor, the hot channel was visible in the 94-Å passbands (Figure 7B) until the M7.3-class flare started. In the very early phase of the flare, another small-scale flaring occurred, manifested as a small peak in the GOES 1-8 Å flux (indicated by an arrow in Figure 7A). The small flaring was a jet process occurring at a possible null point as suggested by the cusp-shaped structure and mass flow in the 94-Å passband images (Figures 7B–D). The jet mass flow was even visible in the AIA 1600-Å passband. After the small flaring, the hot channel started to rise and finally erupted out (Figures 7E–G). From the EUV image (Figure 7C), we can estimate that when the jet occurred, the distance between the two footpoints of the cusp-shaped structure was around 7 Mm, while the distance between the two sets of footpoints of the post-flare loops formed in precursor flarings was around 18 Mm. When taking the distances as rough indicators to the heights of the coronal structures, the results suggested that the jet was more likely to occur lower than the loops, i.e., lower than the hot channel formed above the loops during the precursor flarings. In general, the jet process seemed to serve as a trigger of the hot channel eruption rather than a process forming or enhancing the channel (Liu et al., 2018).
4 Summary and conclusion
In this work, we tracked the evolution of the NOAA AR 12036 which emerged and produced an M7.3-class flare on the visible solar disk. It held a spot–spot-type configuration before the flare, i.e., a monolithic PIL was formed between the group of positive polarities and the group of negative polarities, from which the M7.3-class flare occurred. The observations suggested that the AR was formed by three bipoles that emerged sequentially. The two bipoles emerging earlier were located parallel. The third bipole emerged in between the two polarities of the second bipole. Its negative polarity was mixed with the negative polarity of the second bipole. In the early phase when the flux emergence was fast, the Bz gradient across the PIL remained small, and no collision or large eruption occurred.
Later, although the slow flux emergence of the entire AR continued, the positive polarity P3 of the third bipole started to show signs of decay; the sunspot in P3 lost its coherence gradually; and small magnetic features were found stripped away from the polarity, heading toward the negative polarity N1 of the bipole emerging first. The increasing area and decreasing mean Bz of the polarity P3 further supported that P3 was undergoing a decaying process. The small moving magnetic features brought the polarities P3 and N1 into contact about 7.5 h prior to the flare, i.e., the collision occurred between the polarities since then. The Bz gradient at the interface between P3 and N1 increased with the converging and collision processes.
Accompanied by the collision between P3 and N1, two precursor flarings occurred in 5 h before the flare, both of which ignited from around the interface region between P3 and N1. They all formed post-flare loops above the interface region and ignited a continuous S-shaped hot channel above the loops. In the very early phase of the M7.3-class flare, another small-scale flaring occurred. It was a jet process occurring at a possible null point located lower than the hot channel and may disturb the hot channel to erupt later. The hot channel eruption induced the main phase flaring of the flare and a CME.
Combining the aforementioned results, we found that it was the collision between the non-conjugated polarities in the decay phase of one polarity which created a location favorable of cancellation and flaring. The collision brought the footpoints of different sets of sheared loops belonging to different bipoles into close proximity, enabling the tether-cutting-type reconnection to occur between them. The resultant pre-flare flarings and possible cancellation helped to form and enhance the flux rope which was manifested as an S-shaped hot channel. The eruption of the hot channel was directly triggered by a low-lying jet process, which is similar to the case reported by Liu et al. (2015), which showed a jet process triggering a CME. It is important to note that accompanied by the collision, the shearing process is also needed to create the helical field lines of the flux rope. Similar to the rapidly emerging non-bipolar ARs (Chintzoglou et al., 2019), the shearing process in the spot–spot-type AR here was also induced by the proper motions between non-conjugated polarities. The proper motions of the two non-conjugated polarities before the collision had similar direction but different magnitudes, so the shearing gradually occurred between them.
The “collisional shearing” reported by Chintzoglou et al. (2019) and Liu et al. (2021) mainly occurred between the non-conjugated polarities in emerging non-bipolar ARs and resulted from the relative motions of non-conjugated polarities. Those motions were indeed caused by the proper separation of conjugated polarities. In the NOAA AR 12036 studied here, the arrangement of the bipoles, which was an overall bipolar configuration, did not create a condition favorable for contact and collision between non-conjugated polarities in the fast emergence phase; therefore, no large eruption occurred in this phase. Later on, although slow flux emergence continued, one of the main positive polarities started to decay, leading to collision between the non-conjugated polarities eventually. The two precursor flarings which helped to form the hot channel that erupted later were the result of collision.
Although the photospheric collision plays an important role in most ARs which produce the large solar eruption, it is not an absolute necessary condition for eruption. In a few events like the “inter-AR”-type cases by Toriumi et al. (2016), who account about 7% of all their samples, the eruption occurred above a PIL without close contact or strong collision between opposite-sign polarities. They may result from the process occurring in the corona, the details behind which need further study.
The results in this work may explain why there is no single bipolar AR in the statistical research of “collisional shearing” (Liu et al., 2021), though one should still be aware that their sample size is limited. For the AR holding a non-bipolar configuration, it contains more than one bipole when emerging. The arrangement of the bipoles may tend toward collisional shearing occurring between non-conjugated opposite-sign polarities. The flux emergence drives the collisional shearing to continue, eventually leading to eruptions. For the “spot–spot”-type AR we studied here, the bipoles were roughly parallel to each other in the fast emergence phase, the arrangement of which did not create a condition favorable for collision. Although the shearing gradually occurred between the non-conjugated polarities due to their proper motions, no large eruption occurred until the collision occurred as a result of the polarity decay. It is important to note that we have only one case here; it is possible that in some other “spot–spot”-type ARs, the “collisional shearing” process may not even occur. The rotation and shearing of the sunspots driven by another process may play a major role in producing large eruptions in those ARs as suggested by the previous research (Yan and Qu, 2007; Zhang et al., 2007; Yan et al., 2008; Li and Zhang, 2009; Yan et al., 2009). Statistical research is needed to check if “collisional shearing” is common in the “spot–spot”-type ARs. On the other hand, even in the “spot–spot”-type AR here, the collision occurred between non-conjugated polarities at the source PIL of the eruption and not at the self PIL between conjugated polarities. Statistical research considering the different evolution stages of the ARs is also needed to check whether this is common.
Data availability statement
The original contributions presented in the study are included in the article/Supplementary Material; further inquiries can be directed to the corresponding author.
Author contributions
LL conducted the analysis of the data and drafted and completed the manuscript.
Funding
LL acknowledges the support received from the National Natural Science Foundation of China (NSFC grant no. 12273123) and from the Guangdong Basic and Applied Basic Research Foundation (2022A1515011548, 2023A1515030185).
Acknowledgments
The authors would like to acknowledge the SDO and GOES missions for providing quality observations.
Conflict of interest
The author declares that the research was conducted in the absence of any commercial or financial relationships that could be construed as a potential conflict of interest.
Publisher’s note
All claims expressed in this article are solely those of the authors and do not necessarily represent those of their affiliated organizations, or those of the publisher, the editors, and the reviewers. Any product that may be evaluated in this article, or claim that may be made by its manufacturer, is not guaranteed or endorsed by the publisher.
Supplementary material
The Supplementary Material for this article can be found online at: https://www.frontiersin.org/articles/10.3389/fspas.2023.1135256/full#supplementary-material
SUPPLEMENTARY VIDEO S1Online movie 1, generated from a sequence of images similar as in Figure 2.
SUPPLEMENTARY VIDEO S2Online movie 2, generated from a sequence of images similar as in Figure 3.
SUPPLEMENTARY VIDEO S3Online movie 3, generated from a sequence of images similar as in Figure 6.
SUPPLEMENTARY VIDEO S4Online movie 4, generated from a sequence of images similar as in Figure 7.
References
Alissandrakis, C. E. (1981). On the computation of constant α force-free magnetic field. Astronomy Astrophysics 100, 197–200.
Antiochos, S. K., DeVore, C. R., and Klimchuk, J. A. (1999). A model for solar coronal mass ejections. Astrophysical J. 510, 485–493. doi:10.1086/306563
Bobra, M. G., and Couvidat, S. (2015). Solar flare prediction using SDO/HMI vector magnetic field data with a machine-learning algorithm. Astrophysical J. 798, 135. doi:10.1088/0004-637X/798/2/135
Bobra, M. G., Sun, X., Hoeksema, J. T., Turmon, M., Liu, Y., Hayashi, K., et al. (2014). The helioseismic and magnetic imager (HMI) vector magnetic field pipeline: SHARPs – space-weather HMI active region patches. Sol. Phys. 289, 3549–3578. doi:10.1007/s11207-014-0529-3
Chen, C., Wang, Y., Shen, C., Ye, P., Zhang, J., and Wang, S. (2011). Statistical study of coronal mass ejection source locations: 2. Role of active regions in CME production. J. Geophys. Res. Space Phys. 116, A12108. doi:10.1029/2011JA016844
Chintzoglou, G., Zhang, J., Cheung, M. C. M., and Kazachenko, M. (2019). The origin of major solar activity: Collisional shearing between nonconjugated polarities of multiple bipoles emerging within active regions. Astrophysical J. 871, 67. doi:10.3847/1538-4357/aaef30
Falconer, D. A., Moore, R. L., and Gary, G. A. (2002). Correlation of the coronal mass ejection productivity of solar active regions with measures of their global nonpotentiality from vector magnetograms: Baseline results. Astrophysical J. 569, 1016–1025. doi:10.1086/339161
Falconer, D. A., Moore, R. L., and Gary, G. A. (2006). Magnetic causes of solar coronal mass ejections: Dominance of the free magnetic energy over the magnetic twist alone. Astrophysical J. 644, 1258–1272. doi:10.1086/503699
Falconer, D. A., Moore, R. L., and Gary, G. A. (2008). Magnetogram measures of total nonpotentiality for prediction of solar coronal mass ejections from active regions of any degree of magnetic complexity. Astrophysical J. 689, 1433–1442. doi:10.1086/591045
Georgoulis, M. K., and Rust, D. M. (2007). Quantitative forecasting of major solar flares. Astrophysical J. 661, L109–L112. doi:10.1086/518718
Green, L. M., Kliem, B., and Wallace, A. J. (2011). Photospheric flux cancellation and associated flux rope formation and eruption. Astronomy Astrophysics 526, A2. doi:10.1051/0004-6361/201015146
Kliem, B., and Török, T. (2006). Torus instability. Phys. Rev. Lett. 96, 255002. doi:10.1103/PhysRevLett.96.255002
Künzel, H. (1960). Die Flare-Häufigkeit in Fleckengruppen unterschiedlicher Klasse und magnetischer Struktur. Astron. Nachrichten 285, 271–273. doi:10.1002/asna.19592850516
Leka, K. D., and Barnes, G. (2003). Photospheric magnetic field properties of flaring versus flare-quiet active regions. I. Data, general approach, and sample results. Astrophysical J. 595, 1277–1295. doi:10.1086/377511
Leka, K. D., and Barnes, G. (2007). Photospheric magnetic field properties of flaring versus flare-quiet active regions. IV. A statistically significant sample. Astrophysical J. 656, 1173–1186. doi:10.1086/510282
Lemen, J. R., Title, A. M., Akin, D. J., Boerner, P. F., Chou, C., Drake, J. F., et al. (2012). The atmospheric imaging assembly (AIA) on the solar Dynamics observatory (SDO). SoPh 275, 17–40. doi:10.1007/s11207-011-9776-8
Li, L., and Zhang, J. (2009). Statistics of flares sweeping across sunspots. Astrophysical J. 706, 17–21. doi:10.1088/0004-637X/706/1/L17
Liu, J., Wang, Y., Shen, C., Liu, K., Pan, Z., and Wang, S. (2015). A solar coronal jet event triggers A coronal mass ejection. Astrophysical J. 813, 115. doi:10.1088/0004-637X/813/2/115
Liu, L., Cheng, X., Wang, Y., Zhou, Z., Guo, Y., and Cui, J. (2018). Rapid buildup of a magnetic flux rope during a confined X2.2 class flare in NOAA AR 12673. Astrophysical J. 867, L5. doi:10.3847/2041-8213/aae826
Liu, L., Wang, Y., Wang, J., Shen, C., Ye, P., Liu, R., et al. (2016). Why is A flare-rich active region cme-poor? Astrophysical J. 826, 119. doi:10.3847/0004-637X/826/2/119
Liu, L., Wang, Y., Zhou, Z., and Cui, J. (2021). The source locations of major flares and CMEs in emerging active regions. Astrophysical J. 909, 142. doi:10.3847/1538-4357/abde37
Moore, R. L., Sterling, A. C., Hudson, H. S., and Lemen, J. R. (2001). Onset of the magnetic explosion in solar flares and coronal mass ejections. Astrophysical J. 552, 833–848. doi:10.1086/320559
Pesnell, W. D., Thompson, B. J., and Chamberlin, P. C. (2012). The solar Dynamics observatory (SDO). Sol. Phys. 275, 3–15. doi:10.1007/s11207-011-9841-3
Scherrer, P. H., Schou, J., Bush, R. I., Kosovichev, A. G., Bogart, R. S., Hoeksema, J. T., et al. (2012). The helioseismic and magnetic imager (HMI) investigation for the solar Dynamics observatory (SDO). Sol. Phys. 275, 207–227. doi:10.1007/s11207-011-9834-2
Schmieder, B., Archontis, V., and Pariat, E. (2014). Magnetic flux emergence along the solar cycle. Space Sci. Rev. 186, 227–250. doi:10.1007/s11214-014-0088-9
Schrijver, C. J. (2007). A characteristic magnetic field pattern associated with all major solar flares and its use in flare forecasting. Astrophysical J. 655, L117–L120. doi:10.1086/511857
Schrijver, C. J. (2009). Driving major solar flares and eruptions: A review. Adv. Space Res. 43, 739–755. doi:10.1016/j.asr.2008.11.004
Strous, L. H., and Zwaan, C. (1999). Phenomena in an emerging active region. II. Properties of the dynamic small-scale structure. Astrophysical J. 527, 435–444. doi:10.1086/308071
Sun, X., Bobra, M. G., Hoeksema, J. T., Liu, Y., Li, Y., Shen, C., et al. (2015). Why is the great solar active region 12192 flare-rich but cme-poor? Astrophysical J. 804, L28. doi:10.1088/2041-8205/804/2/L28
Toriumi, S., Schrijver, C. J., Harra, L. K., Hudson, H., and Nagashima, K. (2016). Magnetic properties of solar active regions that govern large solar flares and eruptions. Astrophysical J. 834, 56. doi:10.3847/1538-4357/834/1/56
Török, T., Kliem, B., and Titov, V. S. (2004). Ideal kink instability of a magnetic loop equilibrium. Astronomy Astrophysics 413, L27–L30. doi:10.1051/0004-6361:20031691
van Ballegooijen, A. A., and Martens, P. C. H. (1989). Formation and eruption of solar prominences. Astrophysical J. 343, 971. doi:10.1086/167766
van Driel-Gesztelyi, L., and Green, L. M. (2015). Evolution of active regions. Living Rev. Sol. Phys. 12, 1. doi:10.1007/lrsp-2015-1
Wang, Y., Chen, C., Gui, B., Shen, C., Ye, P., and Wang, S. (2011). Statistical study of coronal mass ejection source locations: Understanding CMEs viewed in coronagraphs. J. Geophys. Res. Space Phys. 116, A04104. doi:10.1029/2010JA016101
Welsch, B. T., Fisher, G. H., Abbett, W. P., and Regnier, S. (2004). Ilct: Recovering photospheric velocities from magnetograms by combining the induction equation with local correlation tracking. Astrophysical J. 610, 1148–1156. doi:10.1086/421767
Yan, X.-L., Qu, Z.-Q., Xu, C.-L., Xue, Z.-K., and Kong, D.-F. (2009). The causality between the rapid rotation of a sunspot and an X3.4 flare. Res. Astronomy Astrophysics 9, 596–602. doi:10.1088/1674-4527/9/5/010
Yan, X. L., Qu, Z. Q., and Kong, D. F. (2008). Relationship between rotating sunspots and flare productivity. Mon. Notices R. Astronomical Soc. 391, 1887–1892. doi:10.1111/j.1365-2966.2008.14002.x
Yan, X. L., and Qu, Z. Q. (2007). Rapid rotation of a sunspot associated with flares. Astronomy Astrophysics 468, 1083–1088. doi:10.1051/0004-6361:20077064
Yan, X. L., Xue, Z. K., Pan, G. M., Wang, J. C., Xiang, Y. Y., Kong, D. F., et al. (2015). The Formation and magnetic structures of active-region filaments observed by nvst, sdo, and hinode. Astrophysical J. Suppl. Ser. 219, 17. doi:10.1088/0067-0049/219/2/17
Zhang, J., Li, L., and Song, Q. (2007). Interaction between A fast rotating sunspot and ephemeral regions as the origin of the major solar event on 2006 december 13. Astrophysical J. 662, 35–38. doi:10.1086/519280
Keywords: solar active regions, solar magnetic fields, solar active region magnetic fields, solar activity, solar flares
Citation: Liu L (2023) The evolution of a spot–spot-type solar active region which produced a major solar eruption. Front. Astron. Space Sci. 10:1135256. doi: 10.3389/fspas.2023.1135256
Received: 31 December 2022; Accepted: 28 February 2023;
Published: 20 March 2023.
Edited by:
Xiaoli Yan, National Astronomical Observatories (CAS), ChinaReviewed by:
Leping Li, National Astronomical Observatories (CAS), ChinaZhike Xue, National Astronomical Observatories (CAS), China
Copyright © 2023 Liu. This is an open-access article distributed under the terms of the Creative Commons Attribution License (CC BY). The use, distribution or reproduction in other forums is permitted, provided the original author(s) and the copyright owner(s) are credited and that the original publication in this journal is cited, in accordance with accepted academic practice. No use, distribution or reproduction is permitted which does not comply with these terms.
*Correspondence: Lijuan Liu, bGl1bGo4QG1haWwuc3lzdS5lZHUuY24=