 Ojochenemi Ikani
 Francisca Nneka Okeke1
 Kingsley Chukwudi Okpala
 Daniel Okoh
 Babatunde Rabiu
95% of researchers rate our articles as excellent or good
Learn more about the work of our research integrity team to safeguard the quality of each article we publish.
Find out more
ORIGINAL RESEARCH article
Front. Astron. Space Sci. , 13 July 2023
Sec. Fundamental Astronomy - Archive
Volume 10 - 2023 | https://doi.org/10.3389/fspas.2023.1125950
This article is part of the Research Topic Vertical Coupling in the Atmosphere-Ionosphere-Magnetosphere System View all 21 articles
We investigate the occurrence of ionospheric irregularities in Nigeria during 2014, using the Global Navigation Satellite System (GNSS) total electron content (TEC) rate of change index (ROTI). We categorized days with |Dst| < 30 nT as quiet days and days with |Dst| ≥ 50 nT as disturbed days, during both the daytime and nighttime periods. Our results reveal significant latitudinal differences in both quiet and disturbed conditions. The quiet-time observations indicate that irregularities were consistent across all the stations. The occurrence was strong and consistent at CLBR station in Calabar, Nigeria, which is located further away from the geomagnetic equator (and closer to the southern anomaly crest) than the other receivers. TEC variability is greatly influenced by the geographical location of the Earth’s magnetic field, while its spatial patterns of variability are modulated by the Earth’s diurnal rotation. Near the September equinox, the occurrence of irregularities was inhibited during disturbed periods, but an opposite pattern was observed during the March equinox across all stations. Two peaks of occurrence were observed: one in March and the other in September respectively. The strength of irregularities was generally greater in March equinox compared to September equinox, and they were more pronounced during pre-midnight hours. This pattern could be attributed to the suppressing role of the dynamo electric field, requiring further investigation.
Trans-ionospheric electromagnetic Global Navigation Satellite System (GNSS) signals may experience fluctuation in amplitude and phase due to irregularities in the plasma density of the Earth’s ionosphere. These fluctuations are referred to as ionospheric scintillation and are primarily generated by ionospheric plasma bubbles, which are also known as small-scale ionospheric depletions (Kintner et al., 2007).
The sudden change in amplitude and phase of the radio signal has consequent impacts on the overall performance of practical applications using trans-ionospheric electromagnetic signals. (Kintner et al., 2007; Oladipo and Schϋler, 2013a). The coupling processes in theupper atmosphere involve several factors that influence the uplift of the F-layer and the occurrence of ionospheric irregularities around the magnetic equator. The eastward electric field, also known as the pre-reversal enhancement (PRE), causes uplift of the F-layer after sunset, creating favorable conditions for Rayleigh-Taylor instabilities. This process is influenced by several factors, such as Sq circuit, equatorial electrojet (EEJ), and penetration electric fields. At the equator, the uplift caused by PRE can lead to the formation of plasma bubbles. (Abdu et al., 1983; Kil et al., 2009).
Furthermore, several studies have shown that ionospheric irregularities typically occur around the magnetic equator and are usually observed shortly after sunset (Oladipo and Schϋler, 2013b; Sharma et al., 2018; Bolaji et al., 2019; Bolaji et al., 2020). The occurrence of ionospheric irregularities at the equatorial region has been linked to the enhancement of the eastward electric fields that is usually observed around the post-sunset hours (Rastogi, 1980; Abdu et al., 1983; Fejer et al., 1999). The R-T instability occurs in the ionosphere when tenuous plasma (due to plasma depletion associated with the absence of solar radiation at that period) at the bottom of the F2-layer is accelerated into dense plasma. The R-T instability is triggered by post-sunset enhancement of eastward electric field (EEF) (De Rezende et al., 2007). This is referred to as a plasma bubble.
Several studies on the ionospheric irregularities and occurrence frequency of plasma bubble at different sectors and the seasonal, local time, longitude, latitude, solar and magnetic activities dependence have been undertaken by different authors (e.g., Sobral et al., 2002; Chu et al., 2005; Muella et al., 2008; Seemala and Valladares, 2011; Oladipo and Schϋler, 2013a; Oladipo and Schϋler, 2013b; Ngwira et al., 2013; Mungufeni et al., 2016; Okoh et al., 2017; Amaechi et al., 2018a; Amaechi et al., 2018b; Bolaji et al., 2019; Dugassa et al., 2019).
In the American sector, Chu et al. (2005) studied ionospheric irregularities and ionospheric plasma bubbles over Brazil. Their results showed that ionospheric irregularities and ionospheric plasma bubbles are more pronounced between 20:00 and 01:00 LST in October to March. The results of Sobral et al. (2002) also reported similar trend of occurrence to those of Chu et al. (2005). The results showed that scintillation occurs consistently from September to March. Similarly, the study of Kintner et al. (2007) over the Brazilian sector, showed that irregularities exhibit seasonal dependency with a maximum in December to January and a minimum near May to June.
Oladipo and Schuler (2013a) conducted a study on large-scale ionospheric irregularities in Franceville, Gabon, an equatorial station in the African sector, during the last high solar activity. The study showed seasonal dependence of the occurrence of ionospheric irregularities. Irregularities occurred from March to November with a minimum around June. Oladipo et al. (2014) used ROTIAVE obtained from 30 s RINEX data to study the occurrence of large-scale ionospheric irregularities at Ilorin, Nigeria. The study showed that irregularities occur at Ilorin between March and November, with most occurrences between 1900 LST and 2400 LST.
Mungufeni et al. (2016) investigated the solar activity pattern of irregularities using four different stations spanning from east to west in the African region, employing TEC index derived from GNSS data. The study reported an asymmetry in the occurrence of irregularities during the two equinoxes over East Africa and an opposite trend over West Africa. Okoh et al. (2017) studied the occurrence frequency of equatorial plasma bubbles over West Africa using data from an all-sky airglow imager and GNSS receivers. The study found that most post-midnight plasma bubbles were observed around the months of December to March and that most plasma bubble occurrences were found during equinoxes and least during solstices.
Bolaji et al. (2020) used GPS data to investigate the latitudinal distribution of irregularities in the African region during quiet and storm periods. The study found that irregularities are mostly observed between 19:00 LST and 00:00 LST during quiet conditions regardless of the hemisphere. In contrast to quiet-time observations, irregularities were absent in all latitudes during the considered storm days.
It could be seen that most of these studies involving ionospheric irregularities in the African region largely consider data only during the geomagnetic storms and specific solar activity conditions within limited coverage in terms of geography or time in a particular month. It also appears that most studies have been carried out using a single station or few to investigate the several aspects of its variation. Furthermore, studies to characterize the ionospheric irregularities in the African equatorial region is yet to be exhaustive despite the growing need for the specification of their effect on critical GNSS technologies. The aim of this study is to investigate the occurrence characteristics of the irregularities in Nigeria, Africa. We employ data from ground-based GPS receivers at different longitudes under similar condition. This strategy can improve our current understanding on the physical mechanisms responsible for the development and evolution of ionospheric irregularities in the sector. The strategy of utilizing data from multiple ground-based GPS receivers situated at different longitudes under similar conditions can improve the existing understanding of ionospheric irregularities in several ways. Firstly, it can provide a more comprehensive picture of the spatial and temporal variations in ionospheric irregularities. Secondly, it can help identify and differentiate between the various physical mechanisms responsible for the development of ionospheric irregularities. Lastly, this strategy can improve the accuracy of models used for GNSS positioning and navigation by providing a more precise characterization of ionospheric irregularities.
Different fluctuation indices have been adopted by different researchers to study ionospheric irregularities. For example, Mendillo et al. (2000) and Lee et al. (2009) employed FP index, Li et al. (2007) used power spectral index (n) while Pi et al. (1997); Oladipo and Schuler 2013a; Oladipo and Schϋler, 2013b), Li et al. (2010) and Deng et al. (2014) used the derived TEC fluctuations, commonly referred to as ionospheric irregularities—and—which is utilized by Rate of TEC (ROT) indices. In this study, we used GPS-TEC derived indices to detect ionospheric irregularities. The Rate of change of TEC index (ROTI) was employed. The observations of ground-based GPS receivers located in Nigeria are described in Section 2. The occurrence distributions of ionospheric irregularities detected by GPS over the region are presented and discussed in Sections 3 and 4 respectively. Finally, we offer concluding remarks in Section 5.
We use GNSS data in Receiver Independent Exchange (RINEX) format obtained from the Nigerian GNSS Reference Network (NIGNET) server (http://www.nignet.net/data/). At the time of writing of this paper, the website was down. Figure 1 shows the geographical distribution of the GNSS receivers utilized in this research across Nigeria. The station names, codes, and the geodetic and geomagnetic information of the stations used are presented in Table 1. The GPS-TEC analysis software developed by Gopi Seemala of the Indian Institute of Geomagnetism was used to estimate the value of TEC from the GPS RINEX files. To eliminate any multipath effects an elevation cut-off mask of 45° is used. Different geomagnetic day conditions were considered using Disturbance storm time (Dst) index. The Dst index data were obtained from NASA’s OMNIweb Service (https://omniweb.gsfc.nasa.gov). The monthly average value of TEC for each hour is calculated from the diurnal values of TEC for all the days in a month. Further, the means of the daily ROTI profiles for all of the quiet (or disturbed) days in the month were computed. The quiet days are days in which the absolute values of the |Dst| indices are consistently less than 30 nT (|Dst| < 30 nT) for all hours in the day, while disturbed days are days in which one or more hours in the day have absolute |Dst| indices greater than or equal to 50 nT (|Dst| ≥ 50 nT) for the year 2014 for both the daytime and nighttime period.
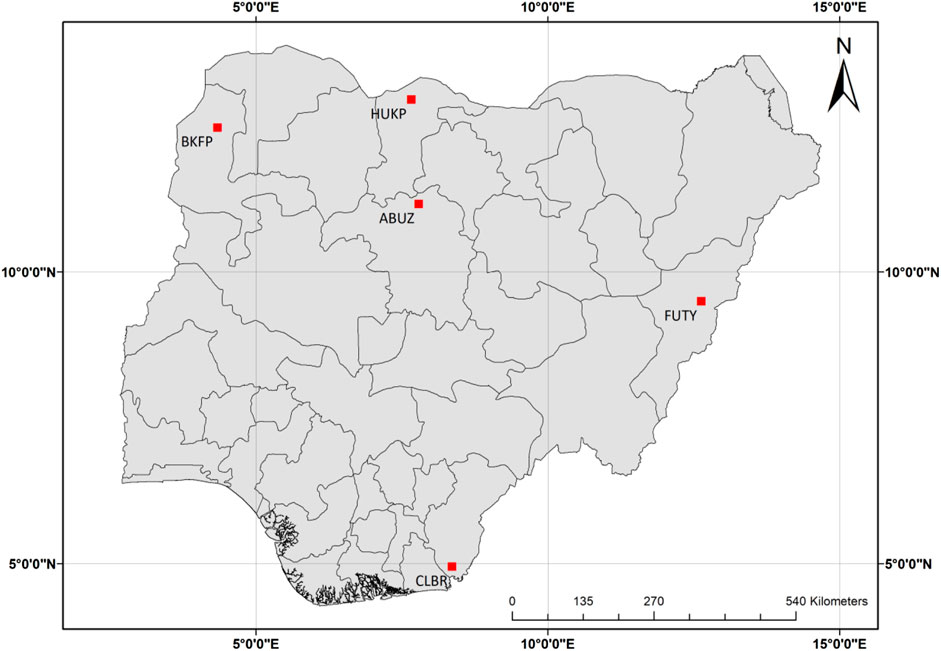
FIGURE 1. Locations of the GNSS receivers used in this study.
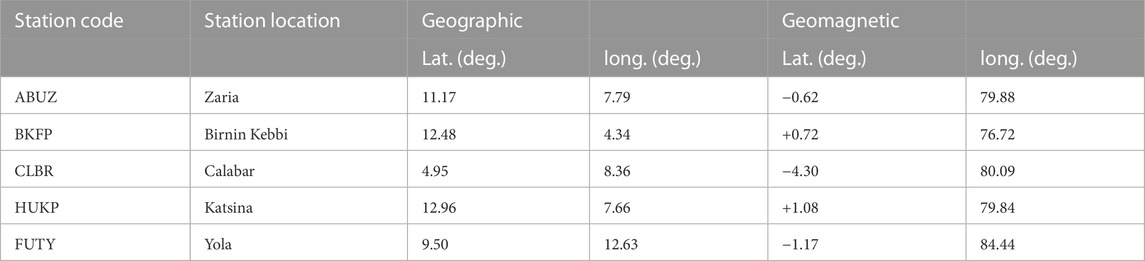
TABLE 1. GNSS receivers used in this study.
The months in the year were further grouped into four, namely, i) February, March and April to represent the March equinox (MEQU), ii) May, June and July as June solstice (JSOL), iii) August, September and October as September equinox (SEQU), and iv) November, December and January as December solstice (DSOL) for the seasonal study.
ROTI is a parameter derived from time variation of TEC [i.e., 30-s rate of change of TEC (ROT) given by Eq. 2.1].
The computation of ROT was performed using Eq. 2.2.
In this equation, “t” represents the instantaneous time, while ∆t denotes the sampling interval, which was set at 30 s in our study. The inclusion of the term cos θ (t) in the formula aimed to compensate for the variations in signal path length caused by the changing zenith angle. When radio signals travel from satellites at lower elevations (resulting in higher zenith angles), they traverse a more extensive portion of the ionosphere. By incorporating the cos θ (t) term, we were able to eliminate the influence of these longer signal path changes in the ionosphere.
Pi et al. (1997) introduced ROTI as the standard deviation of ROT over 5-min period, and it is given by the expression in Eq. 2.3.
Mendillo et al. (2000), using the expression in Eq. 2.3 computed the average ROTI (ROTIave) (ROTIave is a good proxy that indicate the 30-min phase fluctuation level over a location) as the average of ROTI over 30 min interval for a satellite and then the average over all satellites in view. This result gives the average level of irregularities (phase fluctuation) for half an hour over the station.
where n is the satellite number, h is hour (0, 0.5, 1 … 23.5 UT), i is the 5 min section within half an hour (i = 1, 2, 3, 4, 5, and 6), nSat (0.5 h) is the number of satellites observed within half an hour, and k is the number of ROTI values available within half an hour for a particular satellite. To detect the presence of irregularities, the classification by Oladipo and Schuler (2013a) was adopted in this study. In this classification, ROTIave < 0.4 TECU/min indicates the background irregularities (i.e., absence of irregularities), 0.4 < ROTIave < 0.8 indicates the presence of moderate irregularities, and ROTIave > 0.8 indicates the occurrence of severe irregularities. As stated earlier, the results and discussions of the study are presented in Section 3.
Figures 2–5 show the diurnal plots of the rate of total electron content index (ROTI) over all the stations for the representative months (March, June, September and December) of the year 2014. The vertical axis shows the ROTI while the horizontal axis shows the days of the month. The white spaces show periods of data unavailability. The figures show presence of ionospheric irregularities across the entire stations with severe occurrence experienced at CLBR.
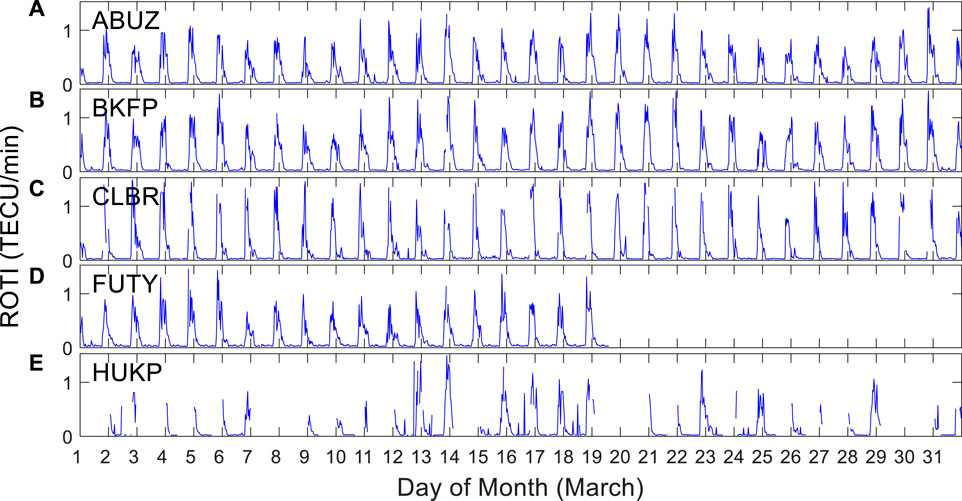
FIGURE 2. Diurnal plots of the rate of total electron content index (ROTI) for (A) ABUZ, (B) BKFP, (C) CLBR, (D) FUTY, and (E) HUKP, during March 2014.
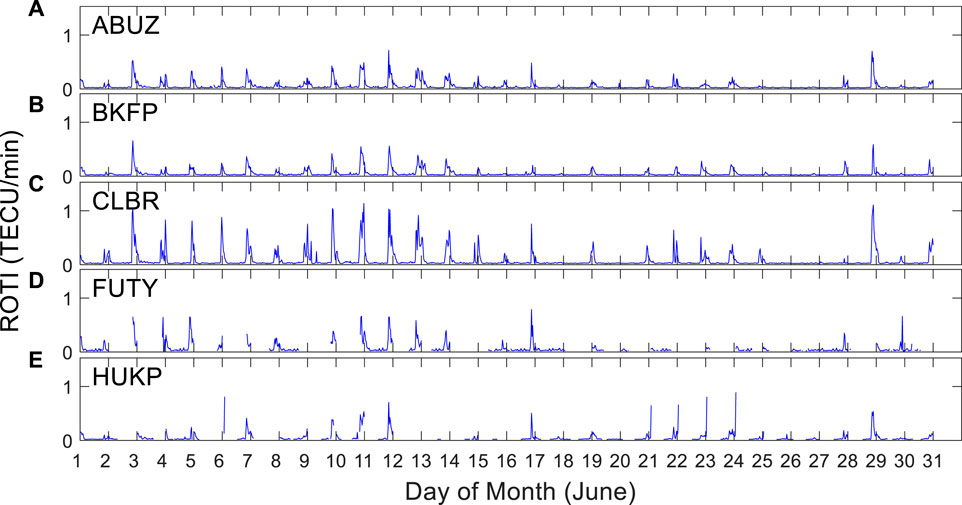
FIGURE 3. Diurnal plots of the rate of total electron content index (ROTI) for (A) ABUZ, (B) BKFP, (C) CLBR, (D) FUTY, and (E) HUKP, during June 2014.
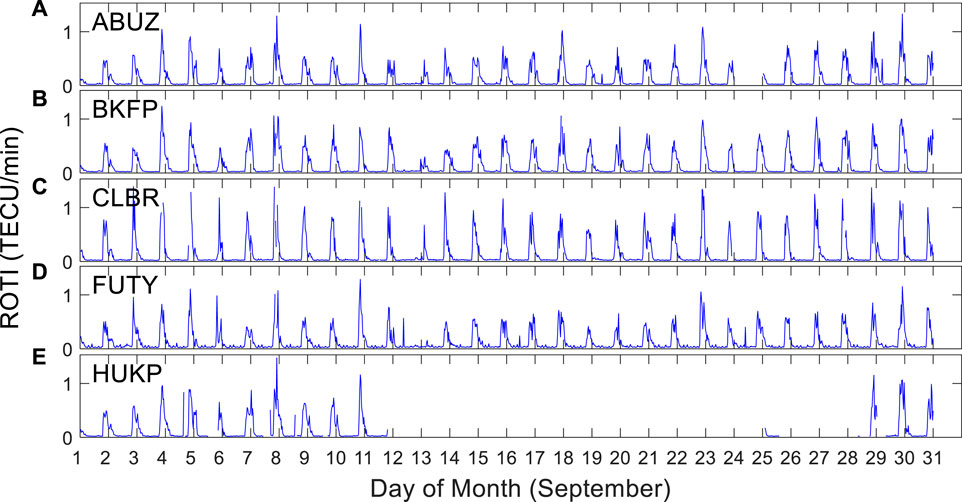
FIGURE 4. Diurnal plots of the rate of total electron content index (ROTI) for (A) ABUZ, (B) BKFP, (C) CLBR, (D) FUTY, and (E) HUKP, during September 2014.
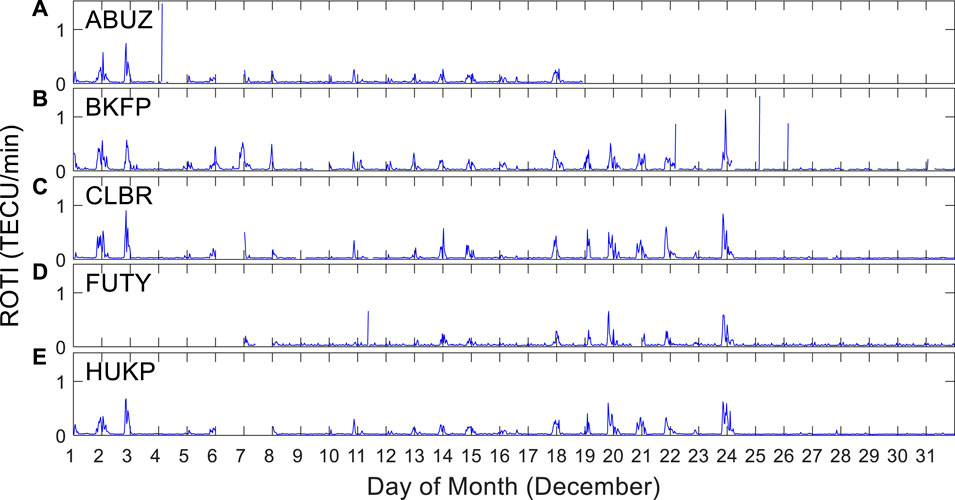
FIGURE 5. Diurnal plots of the rate of total electron content index (ROTI) for (A) ABUZ, (B) BKFP, (C) CLBR, (D) FUTY, and (E) HUKP, during December 2014.
Figures 2–5 illustrate diurnal plots of the Rate of Total Electron Content Index (ROTI) over a 5-min interval, which is a valuable metric for quantifying short-term variability of ionospheric electron density. The analysis of these figures provides important information regarding the short-term variability of ROTI, highlighting the occurrence of spikes and extreme values. This information is critical in understanding the dynamics of the ionosphere and its impact on radio wave propagation.
To quantify the long-term trend of ROTI variation, we calculated the ROTIave, which represents the Rate of Total Electron Content Index Average over a 30-min interval. Figure 6 illustrates the results of this analysis. The computation of the ROTIave allows us to examine the long-term trends of ROTI variation and identify any systematic changes that may occur over time.
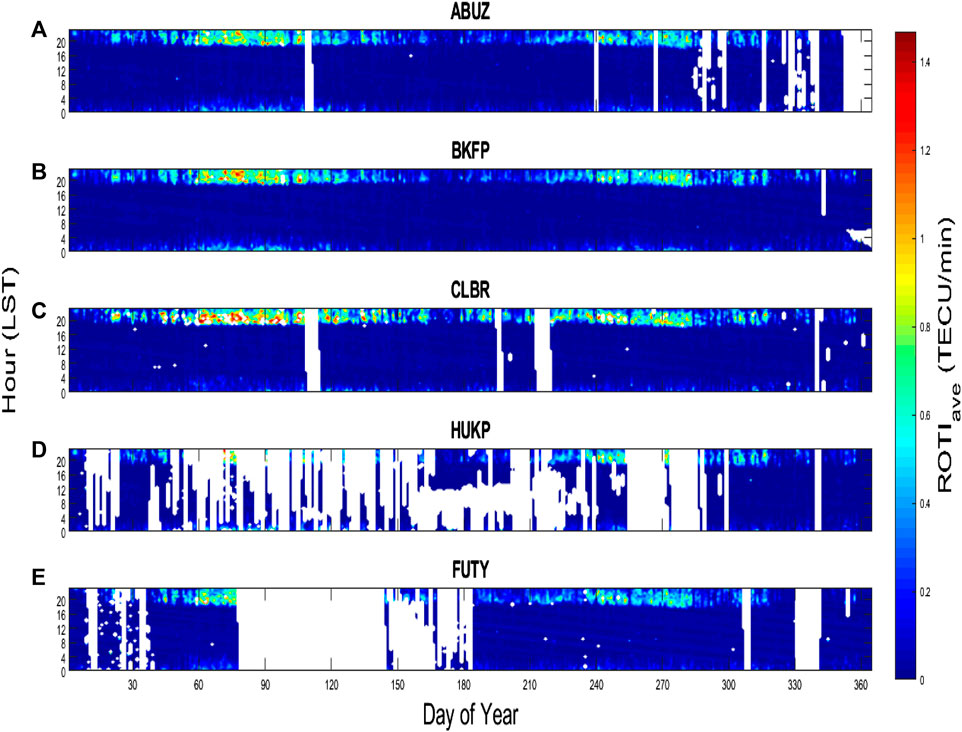
FIGURE 6. Contour plots showing the fluctuation occurrence over the entire stations, (A) ABUZ, (B) BKFP, (C) CLBR, (D) FUTY and (E) HUKP, during 2014, as a function of local solar time (LST) and day of the year 2014. The magnitude of the ROTIave values is indicated by the color bar in which the colors range from blue (indicating low values) to red (indicating high values). The white spaces indicate periods of data unavailability.
Figure 6 shows the annual contour plots of ROTIave over all the five stations investigated in this study for the year 2014. The color bars indicate magnitudes of the ROTIave, and white spaces represent times when there are no available data from the stations. A common reason for why there may not be available data is power outage. As shown in the figure, occurrence of ionospheric irregularities is conspicuously observed during the hours from around 19:00 to 05:00 LST. High value of ROTI is observed during this time interval.
To investigate the day-to-day peaks of ROTI, we obtained the maximum values of ROTIave occurring after local sunset (18:00 LST) for each day. Figure 7 presents results of the daily maximum ROTIave values. The results show that the highest values of ROTI are experienced at the CLBR station.
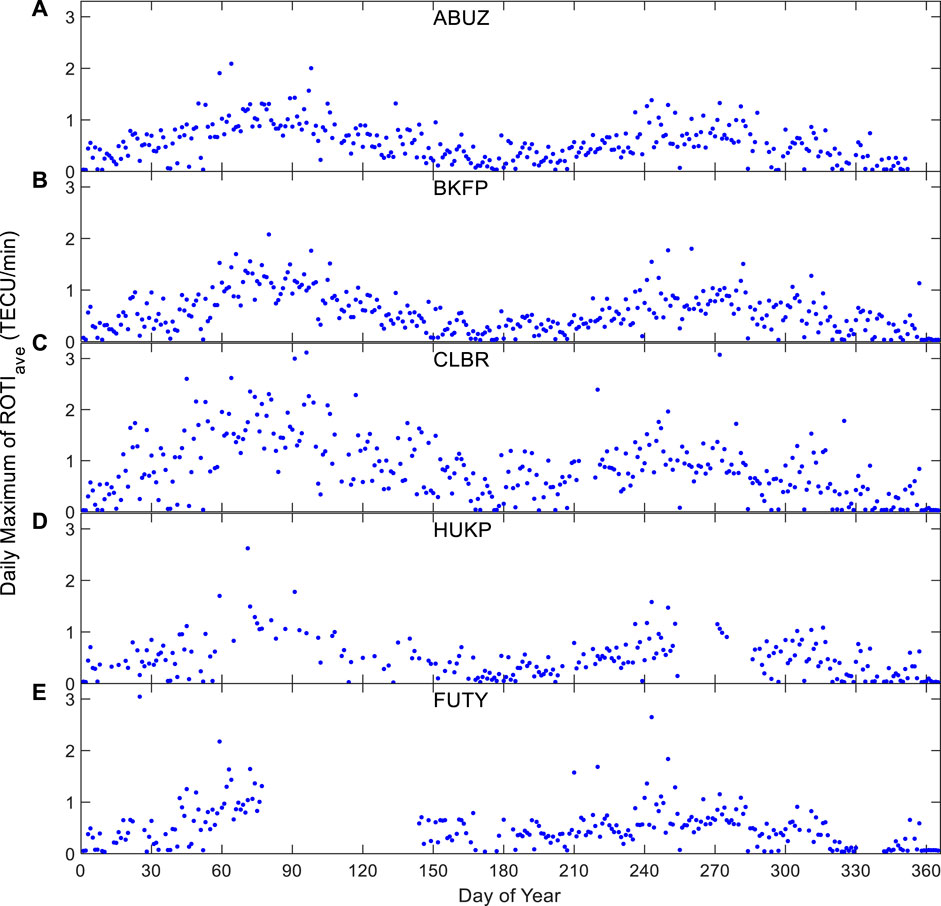
FIGURE 7. Daily maxima of ROTIave values for ABUZ, BKFP, CLBR, HUKP, and FUTY, during year 2014.
Figure 8 shows the monthly variation of ROTI during the quiet and disturbed days over the stations for March, September, and December respectively, during the year 2014. The vertical axis shows the ROTI values while the horizontal axis shows the LST(Hr). There was no data availability during June solstice and also during the disturbed days at both FUTY and HUKP respectively. High values of ROTI were recorded during March equinox than September equinox for both quiet and disturbed geomagnetic conditions. The Occurrence of irregularity was largely inhibited during the December solstice for both the quiet and disturbed geomagnetic conditions. This is opposite to the observations during the equinoxes.
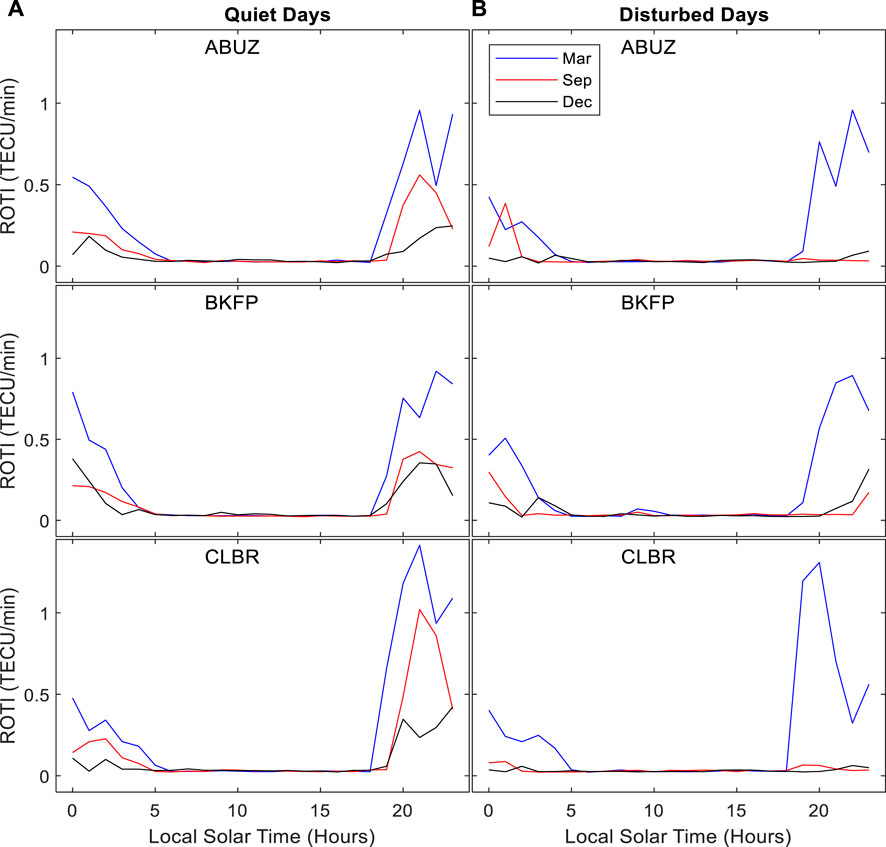
FIGURE 8. Monthly variation of ROTI during quiet and disturbed days (panel (A) quiet days and (B) for disturbed days) for ABUZ, BKFP, and CLBR, during March, September and December 2014.
In this present study, the occurrence of ionospheric irregularities in Nigeria during 2014 was investigated using the Global Navigation Satellite System (GNSS) total electron content (TEC) rate of change index (ROTI). The figures show that there is a presence of ionospheric irregularities across all the stations, with severe occurrence experienced at CLBR. The high values of ROTI recorded at CLBR may be attributed to the difference in the values of the geomagnetic latitude of the stations, as described in Table 1. All the five stations considered in this study are around the geomagnetic equator, but CLBR is farther away from the geomagnetic equator (and closer to the southern anomaly crest) than the other stations. Adeniyi et al. (2021) stated that the occurrence probability of severe ionospheric irregularities is less likely around the magnetic equator than on both sides of the equator, particularly around the crest region.
The occurrence of irregularities was observed to be higher in equinoxes than in solstices with peak values of occurrence experienced in March and September respectively. As an explanation to why greater ROTI magnitudes are observed during the equinoxes than during the solstices, Tsunoda (1985) showed that the occurrence of plasma bubbles was maximum when sunsets in the conjugate E-region is simultaneous. Simultaneous sunset is expected to intensify prereversal enhancement (Nishioka et al., 2008). The angle between the geomagnetic declination and sunset terminator line, α, was introduced as a proxy of the simultaneous sunset in the conjugate points (Burke et al., 2004). The sunset times at conjugate E regions, south and north of the magnetic equator and along the magnetic meridian of each of the stations becomes close in equinox seasons, leading to increased conductivity gradient (Mungufeni et al., 2016). This might account for the severe ionospheric irregularities observed across all the stations during the equinoctial months.
Figure 6 shows that the appearance of irregularities typically begins very weakly around 19:00 LST, then the peak of ROTI magnitude is attained around 21:00 LST, and thereafter begin to decrease in magnitude until the irregularity finally disappears around 05:00 LST by the latest. This result is in agreement with previous studies involving individual locations in the region (e.g., Mungufeni et al., 2016; Bolaji et al., 2020 etc).
The occurrence of severe ionospheric irregularities at CLBR and the asymmetry in their magnitude between the equinoxes and solstices were investigated using the average rate of change of TEC index (ROTIave), which is a good proxy for phase fluctuation level over a location. Figure 7 shows the maximum ROTIave values occurring after local sunset (18:00 LST) for each day. The strengths of ionospheric irregularities observed during the March equinox are greater than during the September equinox, and severe ionospheric irregularities are more pronounced during pre-midnight hours than during post-midnight hours, as seen in Figures 6, 7.
Moreover, ROTI magnitudes exhibit higher values during the equinoxes (March and September) compared to the solstices (June and December), a pattern observed in previous studies on ionospheric irregularities in the equatorial region of Africa by Olwendo et al. (2013); Amabayo et al. (2014), Mungufeni et al. (2016 ab), and Okoh et al. (2017). This similarity is despite the fact that these works were conducted using observations made at different points in time and space. For example, Okoh et al. (2017) conducted their study using observations obtained during years 2015–2017, which is the declining phase of solar cycle 24, while the present study used observations from 2014, which is the peak phase of the solar cycle.
According to Rastogi (1980), one of the conditions for starting spread F over the equator is the existence of strong plasma density gradients. The production of the ionosphere is mainly dependent on the intensity of the ionising radiation from the sun, which varies with the elevation of the sun (Hargreaves, 1992). During equinox months, the elevation of the sun is high over the equatorial region, leading to increased ionization and the creation of the required plasma gradient.
The observed severe ionospheric irregularities occurring mostly during 20:00–00:00 LST (pre-midnight hours) over the stations are in line with the existing theory of the generation of ionospheric irregularities. During the nighttime, the uplift of the F-layer after the sunset by the eastward electric field at the equatorial region, known as the pre-reversal enhancement (PRE), creates favorable conditions for Rayleigh-Taylor instability (Adeniyi et al., 2021), where the depleted plasma at the bottomside F-region due to absence of solar radiation around that time rises up to the topside F-layer in the form of ionospheric irregularities or plasma bubbles (Basu et al., 1999; Fejer et al., 1999; Cervera and Thomas, 2006; Li et al., 2008; Mungufeni et al., 2016).
Figure 8 displays the monthly variation of Rate of TEC index (ROTI) at different stations during quiet and disturbed days in March, September, and December. Peak ROTI values were recorded at CLBR during both quiet and disturbed geomagnetic Irregularity occurrence was largely inhibited during December solstice for both quiet and disturbed conditions, opposite to the observations during the equinoxes. Most stations showed variations in irregularity strength and occurrence time. During September equinox, irregularity occurrence was largely inhibited, while an opposite pattern was observed during the March equinox across all stations.
The inhibition of the irregularities during the September equinox may be attributed to storm-induced disturbance dynamo mechanism, which may inhibit the occurrence of ionospheric irregularities in the region due to the action of disturbance electric fields. In the postsunset period, the equatorial F region rises to higher altitudes, where ion-neutral collision frequency is quite small, thereby creating conditions favorable for Rayleigh-Taylor (R-T) instability (Aarons, 1991). However, during magnetically disturbed days, the sunset-postsunset height rise is inhibited (Martyn, 1959; Jayachandran et al., 1987). Thus, the conditions may not be conducive for irregularity generation/growth during these periods (Aarons, 1991). It is well known that the Rayleigh-Taylor (R-T) and plasma density instabilities that cause the development of irregularities in the ionosphere are affected by some external driving forces such as electric fields, the magnetic field and neutral wind (Li et al., 2011). Due to the uniqueness of the magnetic orientation at the equatorial region, the ionosphere at the equatorial region is sensitive to any change in electric field. During geomagnetic storms, strong electric field which originate from the magnetosphere can penetrate down to the low latitudes (Buonsanto, 1999; Bolaji et at., 2018). An eastward (or westward) electric field during the daytime may favor (or impede) the upward drift of plasma (Bolaji et at., 2018). The injection of the eastward electric field during the disturbed days may have intensified the normal upward plasma drift and may have favored the development of irregularities during the march equinox.
In this study, we investigated occurrence and distributions of ionospheric irregularities over Nigeria, an equatorial region, using TEC derived indices (ROTI and ROTIave) from ground-based GNSS stations in Nigeria. Our findings revealed significant latitudinal differences in both quiet and disturbed conditions. During quiet periods, we observed consistent irregularities across all stations, with particularly strong and consistent occurrences at the CLBR station in Calabar, Nigeria. This station, located farther from the geomagnetic equator and closer to the southern anomaly crest, exhibited a higher occurrence of irregularities. It became evident that TEC variability is greatly influenced by the geographical location of the Earth’s magnetic field, while the spatial patterns of variability are modulated by the Earth’s diurnal rotation.
Our results show a level of consistency with previous studies that have employed different indices and various methods to study the occurrence of ionospheric irregularities over the African equatorial region. However, some new findings related to the African equatorial region are presented below:
1) This study reveal difference in the strength of ionospheric irregularities over stations located within the same equatorial region in Nigeria. This was attributed to the difference in the geomagnetic latitudes of the stations.
2) The variability of TEC is greatly influenced by the geographical location of the Earth’s magnetic field, while its spatial patterns of variability are modulated by the Earth’s diurnal rotation (Calabia, A., & Jin, S. 2020). At equatorial stations located on the north side of the magnetic equator, there is a significant depletion of TEC. This variation affects the accuracy of satellite-based communication and navigation systems. (Shah et al., 2022).
3) Significant quiet time diurnal and seasonal equatorial TEC irregularities (as shown in high values of ROTI) were observed during 2014. The diurnal irregularity was most noticeable during the night period with a peak at 21:00 LST.
4) Seasonal quiet time irregularities exhibited a bimodal feature showing equinoctial peaks. Observed Equinoctial asymmetry in the strength of ionospheric TEC irregularities confirm observations from earlier studies in other (near) equatorial regions in Africa (e.g., Olwendo et al., 2013).
5) The seasonal TEC irregularities during disturbed times were characterized by stronger TEC irregularities in the March equinox as compared with the September equinox season. The reduction of the ROTI and ROT during the September equinox could be attributed to the suppressing role of the dynamo electric field. This requires further investigation.
To improve the analysis of irregularities in Nigeria’s statistics, a larger dataset from multiple years should be considered. Thus, it is suggested that future studies on this topic collect and analyze data from multiple years (if possible) to gain a more detailed insight into the matter and provide a basis for evidence-based policy decisions.
The raw data supporting the conclusion of this article will be made available by the authors, without undue reservation.
All authors listed have made a substantial, direct, and intellectual contribution to the work and approved it for publication.
The authors acknowledge the Nigerian GNSS Reference Network (NIGNET) (http://www.nignet.net/data/) for making the GPS data available to the public. The authors also thank Gopi Seemala of the Indian Institute of Geomagnetism, India, for providing the GPS TEC analysis software. The NASA-Space Physics Data Facility, Goddard Space Flight Center (https://omniweb.gsfc.nasa.gov/form/dx1.html) is acknowledged for the provision of the Dst|index. Ikani Ojochenemi would like to specially appreciate Center for Atmospheric Research’s Space Environment Research Laboratory (SERL), Abuja, for the opportunity to have access to the research facility at the laboratory during which this study was carried out. Sincere appreciation to Christoph Jacobi and the reviewers for helping to improve the manuscript.
The authors declare that the research was conducted in the absence of any commercial or financial relationships that could be construed as a potential conflict of interest.
All claims expressed in this article are solely those of the authors and do not necessarily represent those of their affiliated organizations, or those of the publisher, the editors and the reviewers. Any product that may be evaluated in this article, or claim that may be made by its manufacturer, is not guaranteed or endorsed by the publisher.
Aarons, J. (1991). The role of the ring current in the generation or inhibition of equatorial F-layer irregularities during magnetic storms. Radio Sci.26, 1131–1149. doi:10.1029/91rs00473
Abdu, M. A., Medeiros, R. T., Bittencourt, J. A., and Batista, I. S. (1983). Vertical ionization drift velocities and range type spread F in the evening equatorial ionosphere. J. Geophys. Res.88, 399–402. doi:10.1029/JA088iA01p00399
Adebiyi, S. J., Ikubanni, S. O., Bolaji, O. S., Fashae, J., Adebesin, B., Joshua, B., et al. (2021). Equatorial F-region irregularities at different seasons in Africa. Adv. Space Res.67 (3), 1850–1863. doi:10.1016/j.asr.2021.04.025
Amabayo, E. B., Edward, E., Cilliers, P. J., and Habarulema, J. B. (2014). Climatology of ionospheric scintillations and TEC trend over the Ugandan region. Adv. Space Res.53 (5), 734–743. doi:10.1016/j.asr.2013.12.015
Amaechi, P. O., Oyeyemi, E. O., and Akala, A. O. (2018a). Geomagnetic storm effects on the occurrences of ionospheric irregularities over the African equatorial/low-latitude region. Adv. Space Res.61 (8), 2074–2090. doi:10.1016/j.asr.2018.01.035
Amaechi, P. O., Oyeyemi, E. O., and Akala, A. O. (2018b). The response of African equatorial/low-latitude ionosphere to 2015 St. Patrick's Day geomagnetic storm. Space weather16, 601–618. doi:10.1029/2017sw001751
Basu, S., Groves, K. M., Quinn, J. M., and Doherty, P. (1999). A comparison of TEC fluctuations and scintillations at Ascension Island. J. Atmos. Solar-Terrestrial Phys.61 (15), 1219–1226. doi:10.1016/s1364-6826(99)00052-8
Bolaji, O. S., Adebiyi, S. J., and Fashae, J. B. (2019). Characterization of ionospheric irregularities at different longitudes during quiet and disturbed geomagnetic conditions. J. Atmos. Solar-Terrestrial Phys.182, 93–100. doi:10.1016/j.jastp.2018.11.007
Bolaji, O. S., Adebiyi, S. J., Fashae, J. B., Ikubanni, S. O., Adenle, H. A., and Owolabi, C. (2020). Pattern of latitudinal distribution of ionospheric irregularities in the African region and the effect of March 2015 St. Patrick’s Day storm. J. Geophys. Res. Space Phys.125, e2019JA027641. doi:10.1029/2019JA027641
Buonsanto, M. J. (1999). Ionospheric storm – a review. Space Sci. Rev.88, 563–601. doi:10.1023/a:1005107532631
Burke, W. J., Gentile, L. C., Huang, C. Y., Valladares, C. E., and Su, S. Y. (2004). Longitudinal variability of equatorial plasma bubbles observed by DMSP and ROCSAT-1. J. Geophys. Res. Space Phys.109, A12301. doi:10.1029/2004ja010583
Calabia, A., and Jin, S. (2020). New modes and mechanisms of long-termionospheric TEC variations from globalionosphere maps. J. Geophys. Res. Space Phys.125, e2019JA027703. doi:10.1029/2019JA027703
Cervera, M. A., and Thomas, R. M. (2006). Latitudinal and temporal variation of equatorial ionospheric irregularities determined from GPS scintillation observations. Ann. Geophys.24, 3329–3341. doi:10.5194/angeo-24-3329-2006
Chu, F. D., Liu, J. Y., Takahashi, H., Sobral, J. H. A., Taylor, M. J., and Medeiros, A. F. (2005). The climatology of ionospheric plasma bubbles and irregularities over Brazil. Ann. Geophys.23, 379–384. doi:10.5194/angeo-23-379-2005
De Rezende, L. F. C., De Paula, E. R., Batista, I. S., Kantor, I. J., and De Assis Honorato Muella, M. T. (2007). Study of ionospheric irregularities during intense magnetic storms. Braz. J. Geophys.25, 151–158. doi:10.1590/s0102-261x2007000600017
Deng, B., Huang, J., Kong, D., Xu, J., Wan, D., and Lin, G. (2014). Temporal and spatial distributions of TEC depletions with scintillations and ROTI over south China. Adv. Space Res.55 (1), 259–268. doi:10.1016/j.asr.2014.10.006
Dugassa, T., Habarulema, J. B., and Nigussie, M. (2019). Longitudinal variability of occurrence of ionospheric irregularities over the American, African and Indian regions during geomagnetic storms. Adv. Space Res.63 (11), 2609–2622. doi:10.1016/j.asr.2019.01.001
Fejer, B. G., Scherliess, L., and de Paula, E. R. (1999). Effects of the vertical plasma drift velocity on the generation and evolution of equatorial spread F. J. Geophys. Res.104, 19859–19869. doi:10.1029/1999ja900271
Hargreaves, J. K. (1992). The solar-terrestrial environment. The Pitt building, Trumpington Street, Cambridge: Cambridge University Press. doi:10.1017/CBO9780511564570
Jayachandran, B., Balan, N., Nampoothiri, S. P., and Rao, P. B. (1987). HF Doppler observations of vertical plasma drifts in the evening F region at the equator. J. Geophys. Res.92 (11), 11253. doi:10.1029/JA092iA10p11253
Kil, H., Heelis, R. A., Paxton, L. J., and Oh, S. J. (2009). Formation of a plasma depletion shell in the equatorial ionosphere. J. Geophys. Res. Space Phys.114 (A11), A11302. doi:10.1029/2009JA014369
Kintner, P. M., Ledvina, B. M., and de Paula, E. R. (2007). GPS and ionospheric scintillations. Space weather5, S09003. doi:10.1029/2006SW000260
Lee, C. C., Chu, F. D., Chen, W. S., Liu, J. Y., Su, S. Y., Liou, Y. A., et al. (2009). Spread F, GPS phase fluctuations, and plasma bubbles near the crest of equatorial ionization anomaly during solar maximum. J. Geophys. Res. Space Phys.114 (A8), A08307. doi:10.1029/2009ja014195
Li, G., Ning, B., Abdu, M. A., Yue, X., Liu, L., Wan, W., et al. (2011). On the occurrence of post-midnight equatorial F region irregularities during the June solstice. J. Geophys. Res.116 (A4), A04318. doi:10.1029/2010JA016056
Li, G., Ning, B., Hu, L., Liu, L., Yue, X., Wan, W., et al. (2010). Longitudinal development of low-latitude ionospheric irregularities during the geomagnetic storms of July 2004. J. Geophys. Res. Space Phys.115 (A4), 1978–2012. doi:10.1029/2009ja014830
Li, G., Ning, B., Liu, L., Ren, Z., Lei, J., and Su, S. Y. (2008). The correlation of longitudinal/seasonal variations of evening equatorial pre-reversal drift and of plasma bubbles. Ann. Geophys.25 (9), 2571–2578. doi:10.5194/angeo-25-2571-2007
Li, G., Ning, B., and Yuan, H. (2007). Analysis of ionospheric scintillation spectra and TEC in the Chinese low latitude region. Earth Planets Space59, 279–285. doi:10.1186/bf03353105
Martyn, D. F. (1959). The normal F region of the ionosphere. Proc. IRE47, 147–155. doi:10.1109/jrproc.1959.287259
Mendillo, M., Lin, B., and Aarons, J. (2000). The application of GPS observations to equatorial aeronomy. Radio Sci.35 (3), 885–904. doi:10.1029/1999rs002208
Muella, M. T. A. H., de Paula, E. R., Kantor, I. J., Batista, I. S., Sobral, J. H. A., Abdu, M. A., et al. (2008). GPS L-band scintillations and ionospheric irregularity zonal drifts inferred at equatorial and low-latitude regions. J. Atmos. Solar-Terrestrial Phys.70, 1261–1272. doi:10.1016/j.jastp.2008.03.013
Mungufeni, P., Habarulema, J. B., and Jurua, E. (2016). Trends of ionospheric irregularities over African low latitude region during quiet geomagnetic conditions. J. Atmos. Solar-Terrestrial Phys.138-139, 261–267. doi:10.1016/j.jastp.2016.01.015
Ngwira, C. M., Seemala, G. K., and Habarulema, J. B. (2013). Simultaneous observations of ionospheric irregularities in the African low-latitude region. J. Atmos. Solar-Terrestrial Phys.97, 50–57. doi:10.1016/j.jastp.2013.02.014
Nishioka, M., Saito, A., and Tsugawa, T. (2008). Occurrence characteristics of plasma bubble derived from global ground-based GPS receiver networks. J. Geophys. Res. Space Phys.113, A05301. doi:10.1029/2007JA012605
Okoh, D., Rabiu, B., Shiokawa, K., Otsuka, Y., Segun, B., Falayi, E., et al. (2017). First study on the occurrence frequency of equatorial plasma bubbles over West Africa using an all-sky airglow imager and GNSS receivers. J. Geophys. Res. Space Phys.122, 12,430–12,444. doi:10.1002/2017JA024602
Oladipo, O. A., and Schüler, T. (2013a). Equatorial ionospheric irregularities using GPS TEC derived index. J. Atmos. Solar-Terrestrial Phys.92, 78–82. doi:10.1016/j.jastp.2012.09.019
Oladipo, O. A., and Schüler, T. (2013b). Magnetic storm effect on the occurrence of ionospheric irregularities on an equatorial station in the African sector. Ann. Geophys.56 (5), A0565. doi:10.4401/ag-6397
Olwendo, O. J., Baluku, T., Baki, P., Cilliers, P. J., Mito, C., and Doherty, P. (2013). Lowlatitude ionospheric scintillation and zonal irregularity drifts observed with GPS-SCINDA system and closely spaced VHF receivers in Kenya. Adv. Space Res.51, 1715–1726. doi:10.1016/j.asr.2012.12.017
Pi, X., Mannucci, A. J., Lindqwister, U. J., and Ho, C. M. (1997). Monitoring of global ionospheric irregularities using the world-wide GPS network. Geophys. Res. Lett.24 (18), 2283–2286. doi:10.1029/97GL02273
Rastogi, R. G. (1980). Seasonal variation of equatorial spread F in the American and Indian zones. J. Geophys. Res. Space Phys.85 (A2), 722–726. doi:10.1029/JA085iA02p00722
Seemala, G., and Valladares, C. E. (2011). Statistics of total electron content depletions observed over the South American continent for the year 2008. Radio Sci.46, 1. doi:10.1029/2011RS004722
Shah, M., Abbas, A., Ehsan, M., Calabia, A., Adhikari, B., Tariq, M., et al. (2022). Ionospheric–thermospheric responses in south America to the August 2018 geomagnetic storm based on multiple observations. IEEE J. Sel. Top. Appl. Earth Observations Remote Sens.15, 261–269. doi:10.1109/JSTARS.2021.3134495
Sharma, A. K., Chavan, G. A., Gaikwad, H. P., Gurav, O. B., Nade, D. P., Nikte, S. S., et al. (2018). Study of ionospheric irregularities from Kolhapur (16.4°N, 74.2°E). J. Atmos. Solar-Terrestrial Phys.173, 16–22. doi:10.1016/j.jastp.2017.12.019
Sobral, J. H. A., Abdu, M. A., Takahashi, H., Taylor, M. J., de Paula, E. R., Zamlutti, C. J., et al. (2002). Ionospheric plasma bubble climatology over Brazil based on 22 years (1977–1998) of airglow observations. J. Atmos. Solar-Terrestrial Phys.64, 1517–1524. doi:10.1016/s1364-6826(02)00089-5
Keywords: equatorial ionosphere, ionospheric irregularities, TEC, Roti, fluctuation indices
Citation: Ikani O, Okeke FN, Okpala KC, Okoh D and Rabiu B (2023) Diurnal and seasonal variations of the occurrence of ionospheric irregularities over Nigeria from GNSS data. Front. Astron. Space Sci. 10:1125950. doi: 10.3389/fspas.2023.1125950
Received: 16 December 2022; Accepted: 21 June 2023;
Published: 13 July 2023.
Edited by:
Christoph Jacobi, Leipzig University, GermanyReviewed by:
Knut Jacobsen, Norwegian Mapping Authority, NorwayCopyright © 2023 Ikani, Okeke, Okpala, Okoh and Rabiu. This is an open-access article distributed under the terms of the Creative Commons Attribution License (CC BY). The use, distribution or reproduction in other forums is permitted, provided the original author(s) and the copyright owner(s) are credited and that the original publication in this journal is cited, in accordance with accepted academic practice. No use, distribution or reproduction is permitted which does not comply with these terms.
*Correspondence: Ojochenemi Ikani, b2pvY2hlbmVtaWlrYW5pQGdtYWlsLmNvbQ==
Disclaimer: All claims expressed in this article are solely those of the authors and do not necessarily represent those of their affiliated organizations, or those of the publisher, the editors and the reviewers. Any product that may be evaluated in this article or claim that may be made by its manufacturer is not guaranteed or endorsed by the publisher.
Research integrity at Frontiers
Learn more about the work of our research integrity team to safeguard the quality of each article we publish.