- 1Department of Physics, University of Texas at Arlington, Arlington, TX, United States
- 2Department of Physics, Umeå University, Umeå, Sweden
On the bow shock in front of Earth’s magnetosphere flows a current due to the curl of the interplanetary magnetic field across the shock. The closure of this current remains uncertain; it is unknown whether the bow shock current closes with the Chapman-Ferraro current system on the magnetopause, along magnetic field lines into the ionosphere, through the magnetosheath, or some combination thereof. We present simultaneous observations from Magnetosphere Multiscale (MMS), AMPERE, and Defense Meteorological Satellite Program (DMSP) during a period of strong By, weakly negative Bz, and very small Bx. This IMF orientation should lead to a bow shock current flowing mostly south to north on the shock. AMPERE shows a current poleward of the Region 1 and Region 2 Birkeland currents flowing into the northern polar cap and out of the south, the correct polarity for bow shock current to be closing along open field lines. A southern Defense Meteorological Satellite Program F18 flyover confirms that this current is poleward of the convection reversal boundary. Additionally, we investigate the bow shock current closure for the above-mentioned solar wind conditions using an MHD simulation of the event. We compare the magnitude of the modeled bow shock current due to the IMF By component to the magnitude of the modeled high-latitude current that corresponds to the real current observed in AMPERE and by Defense Meteorological Satellite Program. In the simulation, the current poleward of the Region 1 currents is about 37% as large as the bow shock Iz in the northern ionosphere and 60% in the south. We conclude that the evidence points to at least a partial closure of the bow shock current through the ionosphere.
1 Introduction
When the supersonic and super-Alfvénic solar wind encounters the Earth’s magnetic field, it abruptly slows and becomes subsonic, creating the bow shock. Both the solar wind plasma and the interplanetary magnetic field are compressed across the shock. This compression of the magnetic field is associated with a curl of
Because of the difference in density between the solar wind plasma and the plasma in the magnetosheath, a pressure gradient force points away from the bow shock back into the solar wind. This force does work on the incoming solar wind, converting flow energy into thermal energy. The current due to the compression of the IMF also plays a part in extracting energy from the solar wind flow. The bow shock is always a dynamo or generator, meaning that
The bow shock can also at times be the primary location in the system where force is exerted against the solar wind (Siscoe et al., 2002) and energy is extracted from the solar wind flow. As discussed by Lopez et al. (2010), when the magnetosonic Mach number is high, the pressure gradient force dominates and solar wind energy at the shock is primarily converted to thermal energy; on the other hand, when the Mach number is low, the
The location of the primary force on the solar wind has consequences for energy transfer throughout the geospace system. Magnetopause reconnection and other load processes require energy to proceed. Lopez et al. (2011) found that for conditions of low Mach number and strongly negative Bz the dynamo that can exist at high latitudes near the cusps disappears. Yet reconnection occurs at the magnetopause for strong southward IMF, which is a load. During low Mach number conditions, then, the bow shock is the main dynamo in the system and must be the energy source for magnetospheric processes (Siebert and Siscoe, 2002; Lopez and Gonzalez, 2017). This conclusion is supported by the work of Tang et al. (2012), who found that for strong IMF Bz the high latitude magnetopause current decreased while the bow shock current increased.
Poynting flux associated with the bow shock current carries energy away from the shock, so the closure of this current relates to the system of loads and generators in the magnetosphere (Lopez, 2018). The magnetopause is an obvious place for the bow shock current to close, but various studies have used global MHD simulations to investigate the question and found that the Chapman-Ferraro current is most likely not the only current in the system which can close bow shock current. Lopez et al. (2011) presented evidence that current in the magnetosheath with Region 1 polarity was connected to the bow shock, supporting the argument made by Siscoe et al. (2002) that the Region 1 field-aligned or Birkeland currents are partially closed by the bow shock current, which was first suggested by Fedder et al. (1997). A study by Guo et al. (2008) showed that under strong southward IMF a significant fraction of the Region 1 field-aligned currents (FACs) could originate from the bow shock. Tang et al. (2009) found that the bow shock current could also contribute to the cross-tail current and power nightside reconnection. In addition to these modeling studies, analysis of MMS (Magnetosphere Multiscale) bow shock crossings by Hamrin et al. (2018) presented observational evidence consistent with closure of the bow shock current across the magnetosheath.
Except for Hamrin et al. (2018), there remains a significant lack of observational studies relating to bow shock current closure. Modeling has suggested a connection between current at the bow shock and current in the ionosphere, but the nature of this possible closure path has been virtually unexplored using real data. This paper presents a set of observations consistent with closure of bow shock current into the ionosphere on open field lines, for a single event. MMS crossings of the bow shock provide direct measurement of the shock current itself during a time of strong negative By and weakly negative Bz. During this period, AMPERE data show unipolar field-aligned currents, of the right polarity to close the observed bow shock current, while supporting observations from a DMSP flyover in the south pole confirm the existence of Birkeland current poleward of the open-closed boundary. Results from a simulation of the event using the Lyon-Fedder-Mobarry (LFM) global MHD model (Lyon et al., 2004) tell the same story. In the simulation, the unipolar, high-latitude Birkeland current corresponding to the current seen in the AMPERE observations is 37%–60% as large as the current on the modeled bow shock. Taken together, these data and model results give evidence that the bow shock current could be closing through the magnetosheath and also in part through the polar ionosphere.
2 Materials and methods
2.1 Data
The following is a brief description of the datasets used in this study. Solar wind data was compiled from ACE and from THEMIS C (Angelopoulos, 2008). ACE (Advanced Composition Explorer) orbits the first Lagrange point and provides solar wind observations. The ACE IMF data are provided by the Magnetic Field Experiment (MAG), another pair of fluxgate magnetometers (Smith et al., 1998), and the plasma data are from the Solar Wind Electron, Proton, and Alpha Monitor (SWEPAM) (McComas et al., 1998), two electrostatic analyzers measuring ions and electrons separately. THEMIS C is one of the two spacecraft in the ARTEMIS mission and orbits the Moon; magnetic field data are taken by the Fluxgate Magnetometer (FGM) (Auster et al., 2008), while plasma data come from the Electrostatic Analyzer (ESA) instrument (McFadden et al., 2008). Wind is another upstream solar wind monitor and has orbited at the L1 point since 2004; magnetic field data come from the Magnetic Field Instrument (MFI), a pair of fluxgate magnetometers (Lepping et al., 1995), and plasma data from the Solar Wind Experiment (SWE) instrument, an electron ion spectrometer (Ogilvie et al., 1995). We considered the Wind data but did not use it, as described later.
The MMS (Magnetosphere Multiscale) mission is a constellation of four spacecraft on an elliptical orbit around Earth designed to study magnetic reconnection (Burch et al., 2016). MMS magnetic and electric field data were observed by the suite of instruments on the FIELDS investigation (Torbert et al., 2016) and ion moments are from the Fast Plasma Investigation (Pollock et al., 2016). Field-aligned currents are from AMPERE (Active Magnetosphere and Planetary Electrodynamics Response Experiment), a data product from Johns Hopkins University Applied Physics Laboratory that derives ionospheric currents using the magnetic perturbation data from the Iridium communications satellite constellations (Anderson et al., 2014). DMSP (Defense Meteorological Satellite Program) satellites fly on separate polar orbits and provide the Department of Defense with environmental information (Redmann, 1985). This study utilizes data from the plasma driftmeter to determine where the reversal of ionospheric convection from sunward to antisunward occurs, magnetometer data to indicate the location of Birkeland currents, and precipitating particle data from the SSJ/4 instrument to determine the location of the open-closed field line boundary. Detailed information about the spacecraft and instruments may be found at the websites for the missions listed in the Acknowledgements where the data sources are specified.
2.2 The Lyon-Fedder-Mobarry model
The MHD model used in this study was the Lyon-Fedder-Mobarry (LFM) global MHD model (Lyon et al., 2004), and the version of LFM used in this study was LFM-MIX (Magnetosphere-Ionosphere Coupler Solver) (Merkin and Lyon, 2010) coupled to the Thermosphere-Ionosphere-Electrodynamics General Circulation Model (TIEGCM). TIEGCM is a first-principles model of the ionosphere-thermosphere system (Dickinson et al., 1981; Roble et al., 1988; Qian et al., 2014). LFM solves the ideal MHD equations on a logically orthogonal, distorted spherical meshed grid. There is a higher density of grid points in areas of special interest, such as where the magnetopause and bow shock are typically located. The grid point separation in these areas is about 0.25 RE. In the areas of the distant magnetotail and upstream of the bow shock, where the solar wind enters the grid space, the grid separation is about 1.25 RE. The grid space extends from −30RE < X < 350RE (in GSE) and is cylindrically wrapped to Y, Z < 130RE. The run in this study had a spatial resolution of 106 × 96 × 128 cells, known as “quad” resolution (e.g., Liu et al., 2021). At the inner boundary, MIX calculates the field-aligned currents from the curl of B and maps them to ionospheric altitudes, where the height-integrated electrostatic equation is solved for the ionospheric potential. The ionospheric electric field is then mapped back to the MHD grid to provide a boundary condition for Faraday’s Law and for the perpendicular velocity. The MIX grid for this run is 1° × 1° in magnetic coordinates and the TIEGCM grid is 5° × 5° in latitude and longitude. The simulation run was completed at NASA’s Community Coordinated Modeling Center (CCMC).
3 Observations
3.1 Solar wind conditions during the event
The OMNI data in the period of interest, namely, 11:00 UT to 14:00 UT on 13 November 2015, was taken from Wind observations, but these data have significant gaps at important times. For this reason, we considered the event with reference to ACE observations, which were more complete except for a total lack of proton density measurements. ACE and Wind were around 80 RE apart in X, less than 40 RE apart in Y, and roughly 8 RE apart in Z. The exact location of ACE was (236.3, 35.3, 11.6) RE. THEMIS C was relatively close to the Earth-sun line during this period, at (56.6, 18.3, 4.6) RE. Based on a comparison between ACE and THEMIS magnetic field data, THEMIS C seemed to be seeing the same solar wind that ACE saw but approximately 48 min later. We determined that the delay was 48 min between the two sets of observations using the average solar wind velocity and the distance between the two spacecraft; we then confirmed that initial estimation by comparing plots of the two datasets. We were therefore able to replace the missing ACE densities (between 0950 UT and 1300 UT) with those observed by THEMIS C (time-shifted by 48 min), after which we propagated the combined dataset forward 62 min, to line up with available OMNI data. The resulting combined solar wind data time series is shown in Figure 1 and this solar wind time series, which was used to drive the LFM simulation at the CCMC, can be replicated using the information provided here and the archived ACE and THEMIS C data.
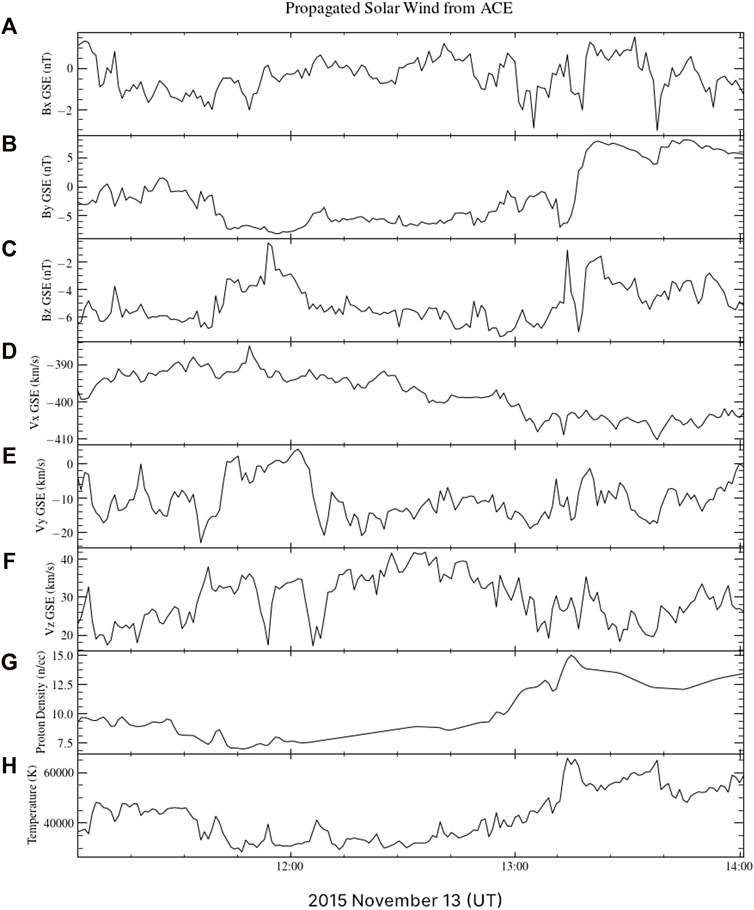
FIGURE 1. Combined ACE and THEMIS C data, propagated forward 62 min to the nominal bow shock. All data shown here are from ACE except the proton densities, which are from THEMIS C and have been time-shifted to correspond with the ACE data. The period of interest is from about 11:45 UT to shortly before 13:00. (A–C) show the X, Y, and Z components in GSE coordinates of the IMF. (D–F) show the X, Y, and Z components in GSE coordinates of the solar wind bulk velocity. (G) shows the solar wind proton density and (H) shows the solar wind ion temperature. (Data provided at https://cdaweb.gsfc.nasa.gov/).
The coordinates used in this paper for all the spacecraft, with the exception of DMSP-F18, are Geocentric Solar Ecliptic (GSE) coordinates, where the X-axis points from Earth to the Sun, the Y-axis is in the ecliptic plane, and the Z-axis is perpendicular to both, pointing northward. The solar wind conditions for the event are shown in Figure 1. Between 11:45 and 13:15 UT on 13 November 2015, IMF Bx was close to zero, while Bz was weakly negative. By was between −5 and −8 nT but was overall pretty steady during this period. Solar wind velocities were steady, as were the temperature and pressure. The fact that By dominated the IMF during the event means that the bow shock current should have been flowing mostly south to north, as determined by the curl of
3.2 MMS observations of the bow shock
Figure 2 shows MMS data from 12:53:00 to 12:55:30 UT, near the end of the period described above. Shortly before 12:51 UT (not shown), the MMS constellation crossed the bow shock into the magnetosheath, where it remained for roughly three and a half minutes before crossing back into the solar wind right after 12:54 UT, as shown. This encounter with the shock occurred at (X, Y, Z) = (9.7, 5.2, −0.9) RE, relatively close to the nose. The compression of the magnetic field (panels b, c, d), the decrease in the ion density (panel f), and the increase in the ion velocity (panel g) across the shock are consistent with the data from ACE at the observed magnetosonic Mach number (panel h). This agreement means that the solar wind data we infer from ACE and THEMIS C are indeed the real conditions directly upstream of the bow shock, a fact that becomes crucial when we simulate the event with an MHD model using these data as input. Panel e of Figure 2 shows the current density components integrated along the spacecraft path; the dominant component is Jz with some contribution from Jy. These currents were calculated using the curlometer; for more information on this technique, see Dunlop et al. (2021). Thus, MMS observed a tilted south to north current as the spacecraft crossed the bow shock.
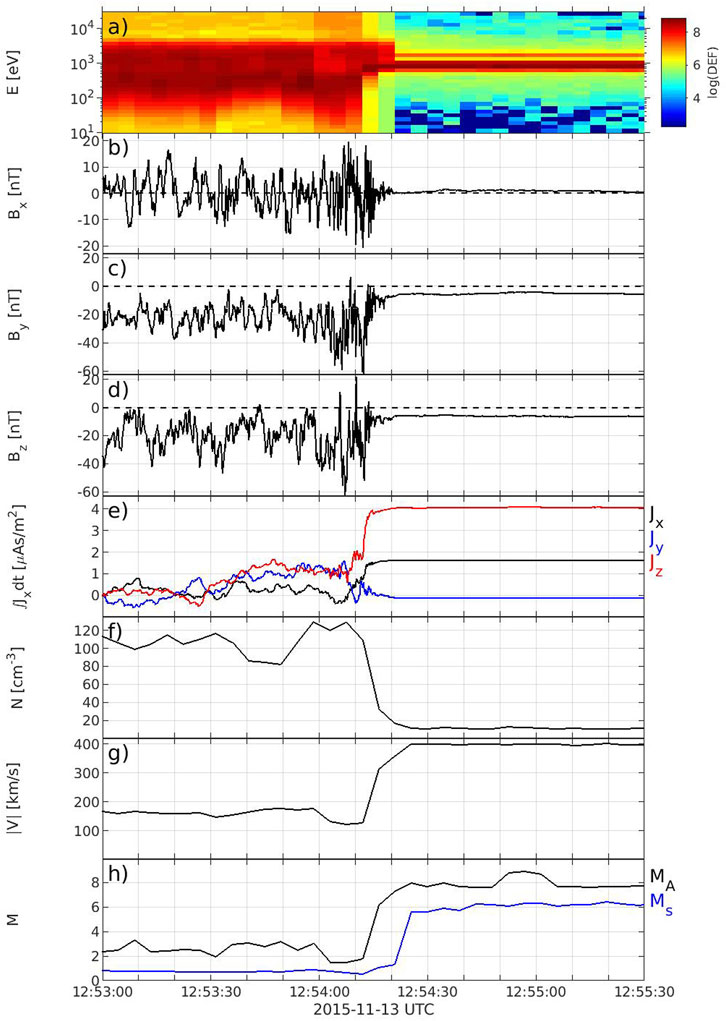
FIGURE 2. MMS observations of the bow shock. The spacecraft encountered the shock between 12:54:10 and 12:54:20 UT. (A) Ion energy-time spectrogram, (B–D) magnetic field components in GSE coordinates, (E) GSE components of J, each integrated with respect to time, (F) ion density, (G) the magnitude of the ion velocity, and (H) the Alvén (MA) and magnetosonic (Ms) Mach numbers.
3.3 AMPERE and DMSP observations of field-aligned currents
The AMPERE-derived Birkeland currents are shown in Figure 3; red indicates current coming out of the ionosphere (upward) and blue current is flowing into the ionosphere (downward). The projection is known as “glass-Earth,” so that the view in both cases is from the perspective of an observer above the north pole; the southern polar cap view is as if the observer were looking through a transparent Earth. In each view noon is at the top of the figure, dawn to the right, and dusk to the left. We can see the Region 1 current flowing into the ionosphere (blue) in the dawn sector and out (red) in the dusk sector, while at lower latitudes are the Region 2 currents, of opposite polarity to Region 1. The convection pattern is rotated towards the afternoon, consistent with the negative IMF By (Heppner and Maynard, 1987). At the time of MMS’s encounter with the bow shock, AMPERE data show a unipolar current region poleward of the Region 1 Birkeland current patterns in both northern and southern hemispheres, with the northern hemisphere current primarily in the postnoon sector and the southern hemisphere current in the prenoon sector, again consistent with the overall convection pattern for negative IMF By (Heppner and Maynard, 1987). This current flows into the northern polar cap and out of the south at high latitudes. These FACs are of the right polarity—downward (blue) in the north and upward (red) in the south—to close the south-north bow shock current observed by MMS, if those currents are on open field lines. It seems likely that if currents originating outside the magnetosphere, like the bow shock current, do connect to the Birkeland currents, they would close along open field lines, which reach out into the magnetosheath, rather than closed field lines. The critical point, then, is to find the position of these Birkeland currents relative to the open-closed field line boundary.
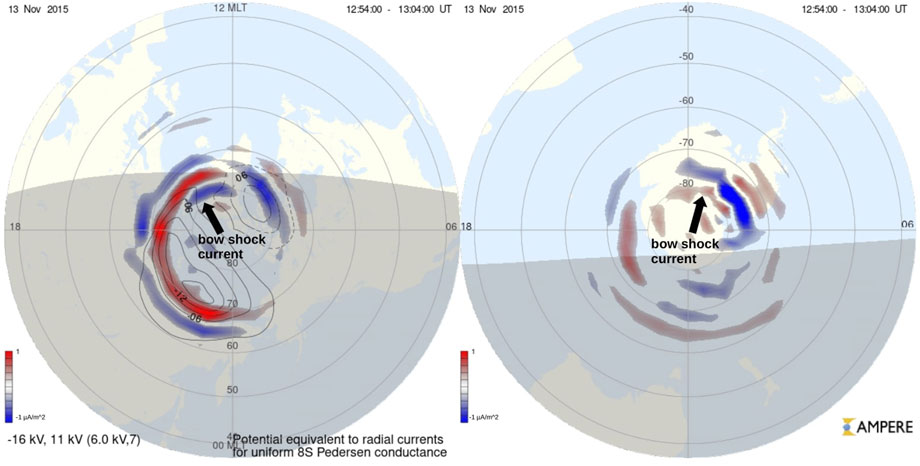
FIGURE 3. AMPERE derived Birkeland currents. The northern hemisphere is on the left and the southern hemisphere is on the right. In both hemispheres, red currents are coming out of the ionosphere and blue currents are going in. The southern hemisphere plot uses a “glass-Earth” projection. We see high latitude unipolar current (indicated) in the afternoon sector in the north and in the morning sector in the south, both with the right polarity to be bow shock current closing into the ionosphere. Potential contours are not available for the southern hemisphere on this day. (Plots from http://ampere.jhuapl.edu/).
For this event, we can determine the location of the open-closed boundary at least in one hemisphere by means of ion driftmeter data from DMSP. During the period in which MMS crossed the bow shock, F18 was making an overpass of the southern polar cap and flew right through the high latitude upward current seen by AMPERE and discussed above. The top panel of Figure 4 shows the difference between the observed magnetic field and the International Geomagnetic Reference Field (IGRF) model perpendicular to the flight track of F18, which gives an estimate of the magnetic perturbation resulting from Birkeland currents (Alken et al., 2021). The bottom panel is a plot of the horizontal ion drift velocities, from which we can determine the convection reversal boundary by noting where the plasma velocities turn negative. Negative velocities correspond to open field lines being dragged toward the nightside and the plasma flowing with them, whereas positive velocities are associated with closed field lines and plasma moving toward the dayside, as expected for the magnetospheric convection pattern. By this reasoning, we can say that F18 encountered the open-closed boundary a few seconds after 12:53, flying poleward. From the magnetic field perturbations observed after the satellite passes through the boundary, we infer that part of the upward current through which F18 flew was flowing on open field lines. The particle precipitation data in Figure 5 shows a clear auroral oval with an open polar cap, consistent with southward IMF. Just after 12:52 we see an intense downward flux of low energy electrons that corresponds to an upward Birkeland current. We identify this downward electron flux as an upward current because electrons are the main current carriers for Birkeland currents, since ions are much heavier and therefore slower to respond to electromagnetic forces. Additionally, the particle detectors on DMSP satellites only look upward, so they cannot measure any upward-moving ions that might contribute to a downward current. We do see some precipitating ions, but after F18 crosses the open-closed boundary at 12:53 the ions disappear. Only a distinct electron population remains; the spectrum of this population, shown in Figure 6, can be compared to the spectrum shown in Figure 1 in Newell et al. (1996), which is identified as an accelerated electron distribution. The spectrum shown here is not as sharply peaked as the spectrum in Newell et al. (1996), with much weaker acceleration and therefore much weaker field-aligned potential, but the two spectra have similar characteristics otherwise. This is therefore the signature of electrons carrying an upward current, with a field-aligned potential accelerating the electrons downward to the velocity required to carry the current, which in this case was on open field lines. In short, the DMSP observations confirm that in the southern hemisphere there was current at the location seen by AMPERE and of the same orientation, poleward of the convection reversal boundary and therefore on open field lines.
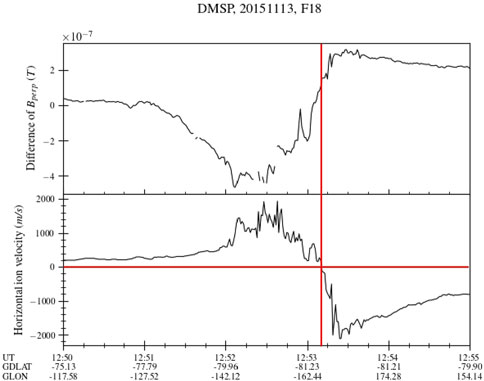
FIGURE 4. F18 observations: difference of Bperp and horizontal ion drift velocities. After the ion velocities turn negative shortly after 12:53 UT, marking the convection reversal boundary, we see some magnetic field perturbations, indicative of current flowing on open field lines. F18 is here moving poleward. (Data provided at http://cedar.openmadrigal.org/list/).
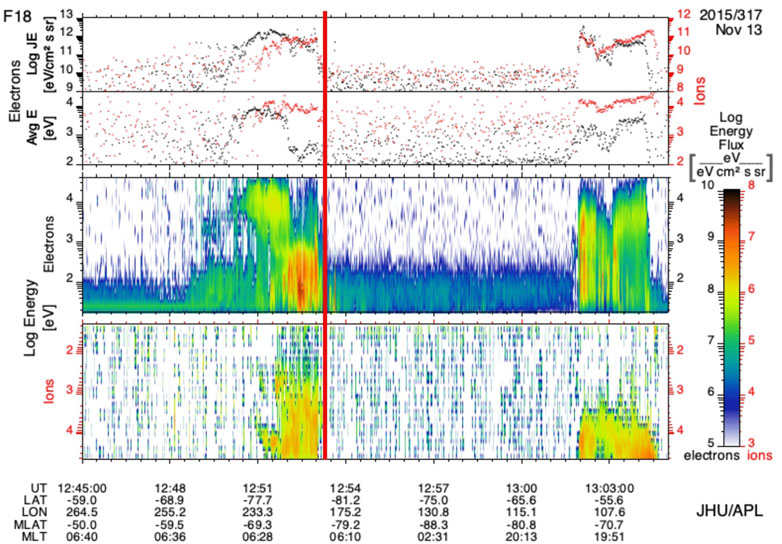
FIGURE 5. F18 particle precipitation data over the southern polar cap. The red line indicates when the spacecraft crossed the convection reversal boundary at 12:53 UT. (Plot from http://sd-www.jhuapl.edu/Aurora/spectrogram/).
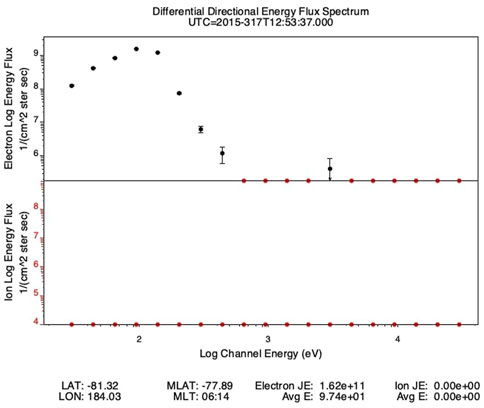
FIGURE 6. Spectrum of the particle precipitation seen at 12:53:37 in figure. The accelerated Maxwellian seen in the electron spectrum indicates electrons being pushed upward in a current. (Plot from http://sd-www.jhuapl.edu/Aurora/spectrogram/).
4 Results from the MHD simulation
As mentioned above, we are confident, because of the MMS observations right outside the bow shock, that the solar wind conditions seen by ACE/THEMIS C, propagated forward to a nominal shock position, accurately represent the real conditions at the bow shock during the event and thus are the correct input to the simulation for the event. We used the propagated ACE/THEMIS C dataset described in Section 3.1 to drive LFM at quad resolution. The model more or less correctly predicts the location of the bow shock at the time of the crossing by MMS, since the satellite’s location during real crossing at 12:54 UT was only about 0.1 RE from its location during the modeled crossing at 13:01 UT, less than the separation of the grid points in this region. Figure 7 shows the modeled conditions along the MMS1 track for the hour around the time of the event; the closeness of the MMS constellation, compared to the LFM spatial resolution in the magnetosheath, means that we can choose any of the four spacecraft to compare to the simulation. Although the model output in Figure 7 is of a lower temporal resolution than the actual data, i.e., every minute as opposed to seconds, we can see that the simulated bow shock passes over the satellite shortly after 13:00 UT; both magnetic field and plasma parameters change rapidly from magnetosheath values to values corresponding to the solar wind input conditions at the time. The predicted By and Bz approach the IMF values reported in the OMNI data at that time, while Vx decreases to −400 km/s and Vy, along with Vz, decreases to nearly zero. Correspondingly, the proton density decreases by more than half as the simulated MMS1 satellite encounters the bow shock. The modeled crossing is about 7 min after the real crossing. In addition, before the 12:54 UT crossing MMS encountered the bow shock a handful of times in quick succession, which are not predicted by the model. However, the simulated boundary is near the MMS position at the time of the crossing under consideration, since the modeled satellite measures very similar magnetosheath values to the real MMS observations, except for the current. Any minor discrepancies could be a result of local disturbances on the bow shock, the physics of which are not necessarily included in the MHD simulation. The discrepancies could also be a result of uncertainties in solar wind timing and the spatial resolution of LFM versus the actual thickness of the bow shock. In the magnetosphere domain the temporal resolution of LFM is on the order of a second, although the code typically writes the MHD variables to a data file with a 1-min cadence. The MMS data used for this study are fast survey mode data, and the resolutions are 16 s−1 (magnetic field) and 32 s−1 (electric field) (Torbert et al., 2016); ion data are taken at 4.5 s per sample (Pollock et al., 2016). Because of the high temporal resolution of the model, small discrepancies between the data and the model are better attributed to the spatial resolution of the MHD code than to the temporal resolution. Broadly speaking, however, the bow shock was in the right position at the right time in the simulation output.
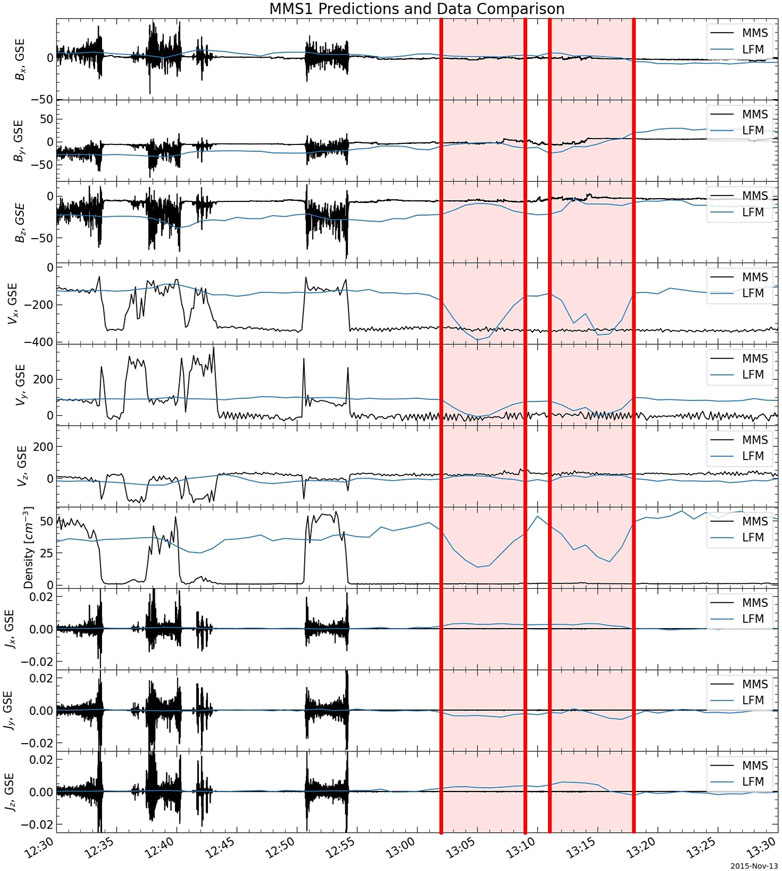
FIGURE 7. MMS1 data (black) and LFM output along the MMS1 track (blue) for the hour around the crossing time on 2015 November 13. Although the modeled satellite did not encounter the bow shock exactly at 12:54 UT or during the earlier crossings shown, the modeled bow shock was near the MMS position, as shown by several predicted encounters with the boundary (marked in red) around 13:05 and 13:15 UT. The periods spent out in the solar wind are shaded red. From the top, the plotted quantities are the magnetic field components Bx, By, Bz, proton bulk velocity components Vx, Vy, Vz, the proton number density, and the components of the current Jx, Jy, and Jz. Vector quantities are in GSE coordinates. The current from LFM is in
Although the directly measureable quantities such as
The simulated field-aligned currents from MIX are shown in Figure 8; red currents are upward and blue currents are downward (matching AMPERE). Like the AMPERE images, dawn is on the right in both hemispheres. The simulated FACs are generally similar to observations, including the tilt in the patterns due to IMF By; in particular, the model produces FACs at high latitude, resembling those seen by AMPERE in Figure 3, that are flowing along open field lines. The modeled currents are similar in magnitude, though a bit larger than the AMPERE-derived currents, but it is known that MIX tends to overestimate the cross polar cap potential, which would explain this discrepancy (Wiltberger et al., 2012). The scale sizes of some FAC features are much smaller than the MIX resolution, so the currents in the MIX plots appear smoother than those in the AMPERE plots.
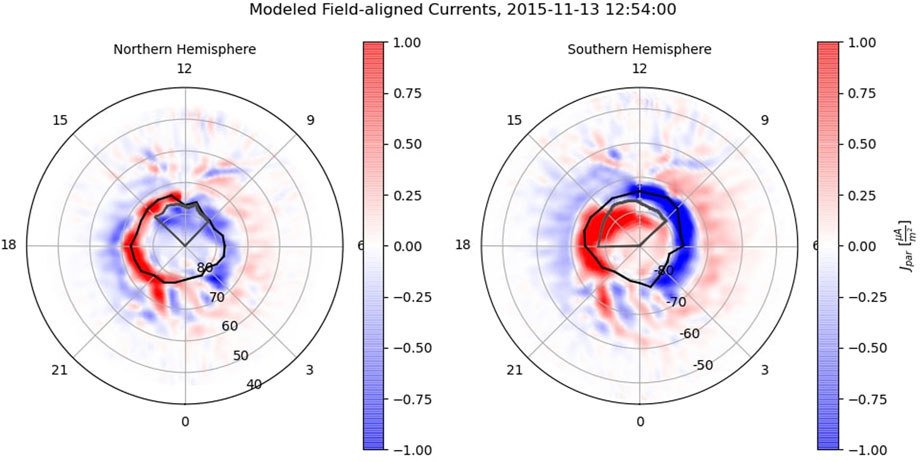
FIGURE 8. MIX currents for the time of the MMS crossing. Red current is flowing out of the ionosphere and blue is flowing in. The southern hemisphere is once again in a “glass-Earth” projection. The black tracings indicate the polar cap boundary and the regions circled in grey contain the currents possibly closing the bow shock. The model broadly reproduces the AMPERE-derived currents.
Figure 8 also shows the polar cap boundaries for both hemispheres as calculated by the model. The high latitude upward current in the southern hemisphere on the dawn side, indicated by the arrow in Figure 3, is flowing on open field lines, both in DMSP observations and in the simulation results. Moreover, the AMPERE plot for the northern hemisphere includes the potential contours from the MIX model, using real data and run separately from the MHD code; it can be seen that the northern counterpart of the southern hemisphere current discussed above was in a region of antisunward plasma flow, poleward of the convection reversal boundary. Therefore, the global simulation of the event and the observations are in agreement that the high latitude Birkeland current with polarity consistent with bow shock current closure was flowing on open field lines.
To more quantitatively compare the current on open field lines in the ionosphere and the south-north current flowing on the bow shock, we integrated the modeled currents in both locations. If the bow shock current is closing at least partially into the ionosphere, the integrated current on open field lines which we identify as possible bow shock current should be less than or equal to the integrated Z-component of the current density on the bow shock in the equatorial plane. Identifying the bow shock in the LFM output by eye in a plot of the equatorial plane (e.g., Figure 9), using the discontinuity in the solar wind density across the shock, we find that the dayside bow shock current flowing from south to north in the simulation is 2.3 ± 0.4 MA. This value was calculated by taking the value of the current per square meter in each grid cell identified as containing the bow shock, for X
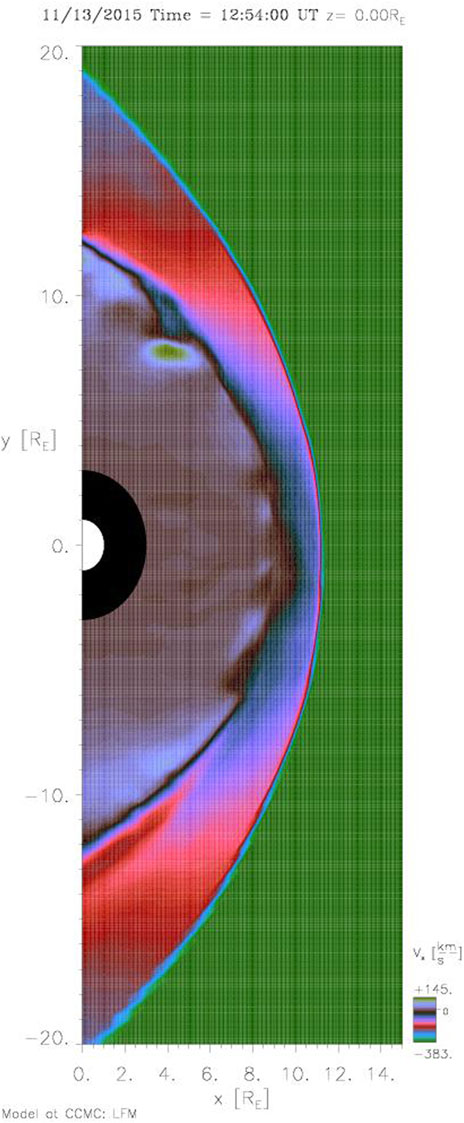
FIGURE 9. The equatorial plane in the LFM simulation at 12:54 UT, colored by the X component of the ion velocity. The bow shock was identified by eye using a plot like this for the integration of the Jz on the bow shock described in Section 4. (Plot generated by the CCMC).
5 Discussion and conclusion
In this paper, we have presented a set of coordinated observations of the bow shock and low altitude Birkeland currents on 13 November 2015, during a period when the IMF was dominated by the By component. The MMS data show the primarily south-to-north current at the bow shock, while DMSP and Ampere show upward Birkeland current in the southern hemisphere at high latitudes in the MMS local time sector. Moreover, the DMSP data show that some of the Birkeland current was flowing in the polar cap on open field lines, and as such would connect to currents in the magnetosheath. These observations are consistent with the hypothesis that, in this case, some of the bow shock current was closing across the magnetosheath into the ionosphere.
The event has been simulated with the LFM global magnetosphere model. The simulation puts the bow shock in the right place at essentially the right time. The Birkeland current pattern in the simulation is generally similar to the pattern derived by AMPERE, particularly with respect to the high latitude Birkeland current that is of the correct polarity to close part of the bow shock current. Moreover, the model results indicate that some of this Birkeland current is on open field lines, poleward of the Region 1 currents. Given observations of the predicted bow shock current, a Birkeland current on open field lines of the correct polarity and magnitude to close the bow shock current at least partially, and support from a global MHD simulation showing the same results, we believe that the evidence is strongly in favor of the closure through the polar cap ionosphere of at least part of the bow shock current.
Many questions remain about bow shock current closure. If the bow shock current is closing in part through the ionosphere with the Birkeland currents, where does it cross the magnetosheath? Does it flow back towards the nightside first, or does it begin to flow along open field lines on or close to the dayside? The relationship of the bow shock current with the Chapman-Ferraro current, and what role the magnetopause plays or does not play in bow shock current closure, should also be investigated. It is probable that the nature of this closure depends largely on prevailing conditions. The IMF clock angle dictates the direction of the bow shock current and thus clearly regulates its closure. The magnetosonic Mach number may be particularly important, since it affects the location of the primary force exerted on the solar wind and the main dynamo in the system. In addition, ionospheric conductance must influence the ability of the bow shock current to close into the polar cap. The fraction of the bow shock current that closes into the ionosphere could also vary, depending on the state of the magnetosphere. Further study is needed to examine the interconnected system of currents, conductance, and solar wind conditions.
Data availability statement
The datasets presented in this study can be found in online repositories. The names of the repository/repositories and accession number(s) can be found below: https://cdaweb.sci.gsfc.nasa.gov/index.html/, http://ampere.jhuapl.edu/, http://sd-www.jhuapl.edu/Aurora/spectrogram/, http://cedar.openmadrigal.org, https://ccmc.gsfc.nasa.gov/results/viewrun.php?domain=GM&runnumber=Pauline_Dredger_080522_4.
Author contributions
MH provided the MMS data and expertise. PD and RL compiled all other observational data and PD ran the MHD simulation. All authors contributed to the analysis of the event studied. PD is the principal author of the text of the paper; the other authors edited and contributed to the text.
Funding
We acknowledge the support of the US National Science Foundation (NSF) under grant 1916604. We also acknowledge the support of the National Aeronautics and Space Administration (NASA) under grants 80NSSC19K1670 and 80NSSC20K0606 [The Center for the Unified Study of Interhemispheric Asymmetries (CUSIA)]. MH was supported by the Swedish National Space Agency and the Swedish Research Council.
Acknowledgments
Simulation results have been provided by the Community Coordinated Modeling Center at Goddard Space Flight Center through their public Runs on Request system (http://ccmc.gsfc.nasa.gov). The LFM Model was developed by John Lyon et al. at Dartmouth College/NCAR-HAO/JHU-APL/CISM. We thank Patricia Doherty for conversations concerning the DMSP plasma drift and magnetometer data. We also thank Kevin Pham for assistance in running the LFM model.
Conflict of interest
The authors declare that the research was conducted in the absence of any commercial or financial relationships that could be construed as a potential conflict of interest.
Publisher’s note
All claims expressed in this article are solely those of the authors and do not necessarily represent those of their affiliated organizations, or those of the publisher, the editors and the reviewers. Any product that may be evaluated in this article, or claim that may be made by its manufacturer, is not guaranteed or endorsed by the publisher.
References
Alken, P., Thébault, E., Beggan, C. D., Amit, H., Aubert, J., Baerenzung, J., et al. (2021). International geomagnetic reference field: The thirteenth generation. Earth, Planets Space 73, 49. doi:10.1186/s40623-020-01288-x
Anderson, B. J., Korth, H., Waters, C. L., Green, D. L., Merkin, V. G., Barnes, R. J., et al. (2014). Development of large-scale birkeland currents determined from the active magnetosphere and planetary electrodynamics response experiment. Geophys. Res. Lett. 41, 3017–3025. doi:10.1002/2014GL059941
Angelopoulos, V. (2008). The themis mission. Space Sci. Rev. 141, 5–34. doi:10.1007/s11214-008-9336-1
Auster, H., Glassmeier, K., Magnes, W., Aydogar, O., Baumjohann, W., Constantinescu, O., et al. (2008). The themis fluxgate magnetometer. Space Sci. Rev. 141, 235–264. doi:10.1007/s11214-008-9365-9
Burch, J. L., Moore, T. E., Torbert, R. B., and Giles, B. L. (2016). Magnetospheric multiscale overview and science objectives. Space Sci. Rev. 199, 5–21. doi:10.1007/s11214-015-0164-9
Dickinson, R. E., Ridley, E. C., and Roble, R. G. (1981). A three-dimensional general circulation model of the thermosphere. J. Geophys. Res. Space Phys. 86, 1499–1512. doi:10.1029/JA086iA03p01499
Dunlop, M. W., Dong, X. C., Wang, T. Y., Eastwood, J. P., Robert, P., Haaland, S., et al. (2021). Curlometer technique and applications. J. Geophys. Res. Space Phys. 126, e2021JA029538. doi:10.1029/2021ja029538
Fedder, J. A., Slinker, S. P., Lyon, J. G., Russell, C. T., Fenrich, F. R., and Luhmann, J. G. (1997). A first comparison of polar magnetic field measurements and magnetohydrodynamic simulation results for field-aligned currents. Geophys. Res. Lett. 24, 2491–2494. doi:10.1029/97GL02608
Guo, X. C., Wang, C., Hu, Y. Q., and Kan, J. R. (2008). Bow shock contributions to region 1 field-aligned current: A new result from global mhd simulations. Geophys. Res. Lett. 35, L03108. doi:10.1029/2007GL032713
Hamrin, M., Gunell, H., Lindkvist, J., Lindqvist, P. A., Ergun, R. E., and Giles, B. L. (2018). Bow shock generator current systems: Mms observations of possible current closure. J. Geophys. Res. Space Phys. 123, 242–258. doi:10.1002/2017JA024826
Heppner, J., and Maynard, N. (1987). Empirical high-latitude electric field models. J. Geophys. Res. Space Phys. 92, 4467–4489. doi:10.1029/ja092ia05p04467
Lepping, R. P., Acũna, M. H., Burlaga, L. F., Farrell, W. M., Slavin, J. A., Schatten, K. H., et al. (1995). The wind magnetic field investigation. Space Sci. Rev. 71, 207–229. doi:10.1007/BF00751330
Liu, J., Wang, W., Qian, L., Lotko, W., Burns, A. G., Pham, K., et al. (2021). Solar flare effects in the Earth’s magnetosphere. Nat. Phys. 17, 807–812. doi:10.1038/s41567-021-01203-5
Lopez, R. E., Bruntz, R., Mitchell, E. J., Wiltberger, M., Lyon, J. G., and Merkin, V. G. (2010). Role of magnetosheath force balance in regulating the dayside reconnection potential. J. Geophys. Res. Space Phys. 115, 14597. doi:10.1029/2009JA014597
Lopez, R. E., and Gonzalez, W. D. (2017). Magnetospheric balance of solar wind dynamic pressure. Geophys. Res. Lett. 44, 2991–2999. doi:10.1002/2017GL072817
Lopez, R. E., Merkin, V. G., and Lyon, J. G. (2011). The role of the bow shock in solar wind-magnetosphere coupling. Ann. Geophys. 29, 1129–1135. doi:10.5194/angeo-29-1129-2011
Lyon, J., Fedder, J., and Mobarry, C. (2004). The Lyon–Fedder–Mobarry (LFM) global MHD magnetospheric simulation code. J. Atmos. Solar-Terrestrial Phys. 66, 1333–1350. doi:10.1016/j.jastp.2004.03.020
McComas, D. J., Bame, S. J., Barker, P., Feldman, W. C., Phillips, J. L., Riley, P., et al. (1998). Solar wind electron proton Alpha monitor (SWEPAM) for the advanced composition explorer. Space Sci. Rev. 86, 563–612. doi:10.1023/A:1005040232597
McFadden, J., Carlson, C., Larson, D., Ludlam, M., Abiad, R., Elliott, B., et al. (2008). The themis esa plasma instrument and in-flight calibration. Space Sci. Rev. 141, 277–302. doi:10.1007/s11214-008-9440-2
Merkin, V. G., and Lyon, J. G. (2010). Effects of the low-latitude ionospheric boundary condition on the global magnetosphere. J. Geophys. Res. Space Phys. 115, 15461. doi:10.1029/2010JA015461
Newell, P. T., Lyons, K. M., and Meng, C. I. (1996). A large survey of electron acceleration events. J. Geophys. Res. Space Phys. 101, 2599–2614. doi:10.1029/95JA03147
Ogilvie, K. W., Chornay, D. J., Fritzenreiter, R. J., Hunsaker, F., Keller, J., Lobell, J., et al. (1995). SWE, A comprehensive plasma instrument for the wind spacecraft. Space Sci. Rev. 71, 55–77. doi:10.1007/BF00751326
Pollock, C., Moore, T., Jacques, A., Burch, J., Gliese, U., Saito, Y., et al. (2016). Fast plasma investigation for magnetospheric multiscale. Space Sci. Rev. 199, 331–406. doi:10.1007/s11214-016-0245-4
Qian, L., Burns, A. G., Emery, B. A., Foster, B., Lu, G., Maute, A., et al. (2014). The NCAR TIE-GCM. Wiley. doi:10.1002/9781118704417.ch7
Redmann, J. (1985). “An overview of the mission sensor systems of the dmsp satellites,” in American institute of Aeronautics and astronautics, aerospace Sciences meeting (Reno, NV: ASM), 240.
Roble, R. G., Ridley, E. C., Richmond, A. D., and Dickinson, R. E. (1988). A coupled thermosphere/ionosphere general circulation model. Geophys. Res. Lett. 15, 1325–1328. doi:10.1029/GL015i012p01325
Siebert, K. D., and Siscoe, G. L. (2002). Dynamo circuits for magnetopause reconnection. J. Geophys. Res. Space Phys. 107, 1095. doi:10.1029/2001JA000237
Siscoe, G. L., Crooker, N. U., and Siebert, K. D. (2002). Transpolar potential saturation: Roles of region 1 current system and solar wind ram pressure. J. Geophys. Res. Space Phys. 107, 1321. doi:10.1029/2001JA009176
Smith, C. W., L’Heureux, J., Ness, N. F., Acuña, M. H., Burlaga, L. F., and Scheifele, J. (1998). The ACE magnetic fields experiment. Space Sci. Rev. 86, 613–632. doi:10.1023/A:1005092216668
Tang, B. B., Guo, X. C., Wang, C., Hu, Y. Q., and Kan, J. R. (2009). Bow shock and magnetopause contributions to the cross-tail current from global mhd simulations. J. Geophys. Res. Space Phys. 114, 14325. doi:10.1029/2009JA014325
Tang, B. B., Wang, C., and Guo, X. C. (2012). Bow shock and magnetopause contributions to the magnetospheric current system: Hints from the cluster observations. J. Geophys. Res. Space Phys. 117, 16681. doi:10.1029/2011JA016681
Torbert, R. B., Russell, C. T., Magnes, W., Ergun, R. E., Lindqvist, P. A., Le Contel, O., et al. (2016). The FIELDS instrument suite on MMS: Scientific objectives, measurements, and data products. Space Sci. Rev. 199, 105–135. doi:10.1007/s11214-014-0109-8
Keywords: bow shock current, closure, MMS, LFM, DMSP, FAC
Citation: Dredger PM, Lopez RE and Hamrin M (2023) A case study in support of closure of bow shock current through the ionosphere utilizing multi-point observations and simulation. Front. Astron. Space Sci. 10:1098388. doi: 10.3389/fspas.2023.1098388
Received: 14 November 2022; Accepted: 18 January 2023;
Published: 02 February 2023.
Edited by:
Simon Wing, Johns Hopkins University, United StatesReviewed by:
Katherine Garcia-Sage, Goddard Space Flight Center (NASA), United StatesAdam Michael, Applied Physics Laboratory, Johns Hopkins University, United States
Copyright © 2023 Dredger, Lopez and Hamrin. This is an open-access article distributed under the terms of the Creative Commons Attribution License (CC BY). The use, distribution or reproduction in other forums is permitted, provided the original author(s) and the copyright owner(s) are credited and that the original publication in this journal is cited, in accordance with accepted academic practice. No use, distribution or reproduction is permitted which does not comply with these terms.
*Correspondence: Pauline M. Dredger, cGF1bGluZS5kcmVkZ2VyQG1hdnMudXRhLmVkdQ==
 Pauline M. Dredger
 Ramon E. Lopez
 Maria Hamrin2