- 1Center for Astrophysics | Harvard & Smithsonian, Cambridge, MA, United States
- 2Bay Area Environmental Research Institute, NASA Research Park, Moffett Field, CA, United States
- 3Lockheed Martin Solar and Astrophysics Laboratory, Palo Alto, CA, United States
- 4Department of Physics, Oregon State University, Corvallis, OR, United States
- 5Center for Solar-Terrestrial Research, New Jersey Institute of Technology, University Heights, Newark, NJ, United States
Magnetic reconnection is the key mechanism for energy release in solar eruptions, where the high-temperature emission is the primary diagnostic for investigating the plasma properties during the reconnection process. Non-thermal broadening of high-temperature lines has been observed in both the reconnection current sheet (CS) and flare loop-top regions by UV spectrometers, but its origin remains unclear. In this work, we use a recently developed three-dimensional magnetohydrodynamic (MHD) simulation to model magnetic reconnection in the standard solar flare geometry and reveal highly dynamic plasma flows in the reconnection regions. We calculate the synthetic profiles of the Fe XXI 1354 Å line observed by the Interface Region Imaging Spectrograph (IRIS) spacecraft by using parameters of the MHD model, including plasma density, temperature, and velocity. Our model shows that the turbulent bulk plasma flows in the CS and flare loop-top regions are responsible for the non-thermal broadening of the Fe XXI emission line. The modeled non-thermal velocity ranges from tens of km s−1 to more than two hundred km s−1, which is consistent with the IRIS observations. Simulated 2D spectral line maps around the reconnection region also reveal highly dynamic downwflow structures where the high non-thermal velocity is large, which is consistent with the observations as well.
1 Introduction
Magnetic reconnection, or the breaking and rejoining of magnetic field lines in a highly conducting plasma, is commonly believed to be a fundamental process during solar eruptions, and it plays a key role in rapid magnetic energy release (e.g., Shibata and Magara, 2011). During a solar eruption, the magnetic energy can be quickly transported to kinetic and thermal energy in the reconnection diffusion and exhausting regions, and generate energetic particles. The spectroscopic investigations of ultraviolet (UV) emission lines serve as an important diagnostic tool because these diagnostics include physical information about the high-temperature plasma, such as the dynamic evolution properties and the heating and particle acceleration mechanisms. Various parameters, such as temperature, thickness, density, turbulent velocity, and reconnection rate are interpreted from the observations of the CS. One of the most interesting features is the broadening of high temperature emission lines formed during flares. The theoretical explanation for such broadening includes microscopic ion motions and macroscopic plasma motions of the emitting ion. Therefore, it is important to investigate the impacts and contribution of the turbulent flows on observable emission lines to understand the reconnection process during solar eruptions. Recently, high-temperature plasma due to magnetic reconnection has been widely observed in UV and Extreme-UV (EUV) emission lines, including observations of the entire reconnection site from the large scale-reconnection current sheet down to the flare loop-top region (e.g., Ciaravella et al., 2002; Warren et al., 2018).
In post coronal mass ejection (CME) plasma sheets, the spectroscopic observations from the Ultraviolet Coronagraph Spectrometer (UVCS) on the Solar and Heliospheric Observatory (SoHO) are well studied from large heights above the solar surface (e.g., reviewed in Lin et al., 2015). Among them, turbulent motions inside these hot plasma sheets have been reported by many authors based on the observations of UV/EUV spectral lines. For instance, Ciaravella et al. (2002) deduced that the turbulent motion had a speed less than 60 km s−1 in the CS; Ciaravella and Raymond (2008) reported large non-thermal [Fe XVIII] line width in the CS, which at the early stage of the CS is as high as 380 km s−1 and later ranges between 50 and 200 km s−1. The combination of bulk motions (e.g., the flow along a fan-shaped CS if the fan is seen edge-on) and turbulence (e.g., Lazarian and Vishniac, 1999) are suggested to be the main contributions to the line broadening. In a long duration, CS studied by Bemporad (2008), the derived non-thermal speeds in the Fe XVIII 974.8 Å spectral lines are of the order of ∼60 km s−1 a few hours after the CME and slowly decay down to about 30 km s−1 in the following 2 days.
At lower heights of CME/flare plasma sheets (up to about 1.15 Rsun from the center of Sun), the EUV Imaging Spectrometer (EIS) on Hinode (Kosugi et al., 2007) has reported a large amount of spectroscopic observations of the plasma sheet region. Warren et al. (2018) analyzed the EIS Fe XXIV lines and found that strong broadening of the 192.04 Å line occurs at the largest observed heights along the CS in a large X-class CME/flare eruption on 2017 September 10th. For instance, the measured non-thermal velocity rises from about 87 km s−1 to about 152 km s−1 over the observed length of the current sheet in a short time period (the 16:09 UT raster). Furthermore, the line broadening is strong very early in the flare and diminishes over time. Large non-thermal velocities up to 200 km s−1 in EIS Fe XXIV line are also analyzed by Li et al. (2018) during this eruption. In addition, the presence of non-Maxwellian electron distributions with enhanced high-energy tails has also been reported by Polito et al. (2018a) during the impulsive phase of this event. The observed line widths of the Fe XXIII and Fe XXIV EIS lines still imply considerable non-thermal broadening in excess of ∼200 km s−1 above the flare loop-top region.
The non-thermal features are also be found in other high-temperature Fe XXI lines (e.g., 11 MK). Using the Interface Region Imaging Spectrograph (IRIS De Pontieu et al., 2015), Tian et al. (2014) reported the red-shifted features of Fe XXI that coincided with an X-ray source as observed by RHESSI above flare loops. They obtained greatly redshifted velocities (∼125 km s−1 along the line of sight, LOS) on the Fe XXI 1354.08 Å emission line with large non-thermal widths (∼100 km s−1) at the reconnection region.
In recent flare fan observations (seen faceon), the non-thermal widths of the Fe XXI line observed by IRIS were also measured by Reeves et al. (2020). In this work, they found that the pixels at the fan top have broader non-thermal widths than the rest of the emission, especially for the later rasters. By comparing the spectral results of the IRIS and Hinode/EIS observations with the synthetic results of 2D MHD simulations; Cai et al. (2022) suggested that a compressed interface with apparent changes in intensity and Doppler velocities of the spectral lines exist above the flare loops, possibly related to termination shocks. The temporal variation of non-thermal velocity was also studied in flare fan regions; Cai et al. (2019) showed that the non-thermal velocity ranged from 19 to 64 km s−1 during a particular period (between 16:00 UT and 16:26 UT, on 2017 September 10th) by analyzing the IRIS Fe XXI 1354.08 Å spectral lines. It is worth mentioning that the observed line width in their work decreased with time as well, though the time period (∼ half an hour) was shorter than these studies in long durations post-CME current sheets (e.g., Bemporad, 2008). The spatial variation of non-thermal velocities is reported by Doschek et al. (2014) in which, they found that the non-thermal motions in the multimillion-degree regions increase with height above flare loops. The deduced non-thermal velocity ranges from 40 to 60 km s−1 in the EIS Fe XXIII and Fe XXIV lines spectra.
The broadening of spectral line profiles is commonly thought to be the result mainly due to turbulent and bulk flows in solar flares. In theory, the plasma sheet and flare loop-top regions (which are generally referenced as flare fans when viewed face-on) are predicted to contain substantial turbulence in a set of theoretical models. For example, the tearing current sheet and multiple plasma instabilities (e.g., the plasmoid instability) may cause a set of small-scale turbulent structures which has been widely found in recent numerical models (e.g., Huang and Bhattacharjee, 2016; Ye et al., 2020). Once the Alfvénic reconnection downflows have collided with the closed magnetic loops, the dramatic variation of plasma β also creates favorable environments for generating turbulent flows in these interface regions, where the β can change from high-beta values in the current sheet region to low-beta states in the potential flare loops (e.g., Shen et al., 2022). Bulk plasma flows may significantly contribute to line profiles as well (Ciaravella and Raymond, 2008). For instance, Guo et al. (2017) calculated synthetic spectral line profiles of the IRIS Fe XXI 1354 Å line at the reconnection site with the presence of termination shocks (TS) in an MHD model of a solar flare. The significant shifts of these synthetic IRIS spectral lines suggested that the synthetic line profile of Fe XXI and its time evolution may serve as a possible guide for observational signatures of a flare TS. Possible Doppler shift signatures of such termination shocks have been subsequently reported by Polito et al. (2018b) using IRIS Fe XXI observations. Further, in a comprehensive radiative 3D model of solar flare (Cheung et al., 2019), synthetic non-Gaussian (κ) distributions of EUV emission-line profiles result from temperature and velocity gradients along the line of sight.
In observations, various dynamic flows at multiple scales have also been found in a set of image observations above flare loops. For instance, McKenzie (2013) reported turbulent dynamic flows observed by the X-ray Telescope (XRT; Golub et al., 2007) on board Hinode and the Atmospheric Image Assembly (AIA; Lemen et al., 2012) on board the solar dynamic observatory (SDO; Pesnell et al., 2012). The flows were found above the post-eruption arcades and measured with local correlation tracking. These results also show significant shears in velocity, giving the appearance of vortices and stagnations. More plasma downflows, now referred to as supra-arcade downflows (SADs), have often been investigated in the flare fan regions above the post-flare loops (e.g., Xie et al., 2022). However, studies focusing on how these turbulent flows affect the EUV line profiles and the non-thermal broad features above the post-flare loops remain sparse.
In this study, we focus on the properties of Fe XXI lines in the plasma sheet and flare-loop top regions. The high-temperature plasma in flare cusp regions is well observed in the 2015–03-07 flare by IRIS, Hinode/XRT, and SDO/AIA. In Section 2, we will briefly review the main observational features and show the non-thermal broadening and Doppler velocity variations observed by the Fe XXI line. On the modeling side, in our recent state-of-the-art MHD model of solar flares Shen et al. (2022), a turbulent interface region below the flare termination shock is revealed in the classic solar flare geometry. The highly dynamic flows are also found in the CS regions. Therefore, we aim to investigate the emission lines based on this 3D model and discuss the origin of line broadening to be compared with observations. We describe the numerical models and the calculation method for simulating Fe XXI lines in Section 2, and show the synthetic spectral lines in Section 3. We then investigate the spatial and temporal distribution of the non-thermal spectral line broadening by combining 3D MHD modeling and IRIS spectral observations. Finally, discussions and conclusions are given in Section 4.
2 Materials and methods
2.1 Observations
The flare event under study is a long-duration M9.2 solar flare located at the east limb, that occurred on March 7, 2015. We mostly focus on observations from the IRIS satellite, which, since its launch in 2013, has been providing unprecedented high-resolution images and spectra of the lower atmosphere and corona (De Pontieu et al., 2014; 2021). IRIS consists of: (1) a Slit-Jaw Imager (SJI) channel, acquiring images in four different filters showing plasma at photospheric, chromospheric and transition region temperatures with a 0.167″ resolution; and (2) a spectrograph channel, observing emission lines and continua formed over a broad range of temperatures (from the photosphere to the flaring corona), at very high spatial (0.33–0.4″), temporal (down to ≈ 1s) and spectral (2.7 km s−1 pixels) resolution. The level 2 IRIS data used here are already calibrated and prepped, as described in the IRIS’ documentation and instrument papers (De Pontieu et al., 2014; Wülser et al., 2018).
The Hinode X-Ray Telescope (Golub et al., 2007; Kano et al., 2008) observed the flare with its flare response, using the Be-Thin and Be-Med filters and a resolution of 1.028″ per pixel. A two-filter observing program consisting of the Al-poly and Be-thin filters was taken before and after the flare response. The XRT data is calibrated and prepped using the xrt_prep routine, available in the SolarSoft suite of IDL programs (Freeland and Handy, 1998), which does the dark subtraction, and removes the pedestal and vignetting effects (Kobelski et al., 2014). The current version of xrt_prep also aligns the XRT images with AIA images by calibrating the time-dependent offsets between XRT and the Hinode Ultra Fine Sun Sensors (Yoshimura and McKenzie, 2015).
AIA (Lemen et al., 2012) provides full-Sun images with a resolution of ∼ 0.6″ per pixel and a cadence of 12 seconds for the EUV passbands. The AIA data are processed using the SolarSoft routine aia_prep, which de-rotates the images from the different AIA telescopes, aligns them, and gives them all the same plate scale.
Figure 1 shows an overview of the flare as observed by XRT in the Be-Thin filter (left columns), AIA in the 131Å filter (dominated by Fe XXI emission at ≈ 10MK, middle column) and in the IRIS SJI centered at 1330Å (right column). This SJI channel is dominated by emission from C II plasma at around 10–40kK, but it is also sensitive to hot plasma from Fe XXI during flares. The vertical lines in the XRT images indicate the location of the IRIS spectrograph slit during the observation. The white box in the middle images indicates the field of view of the IRIS SJI images on the right.
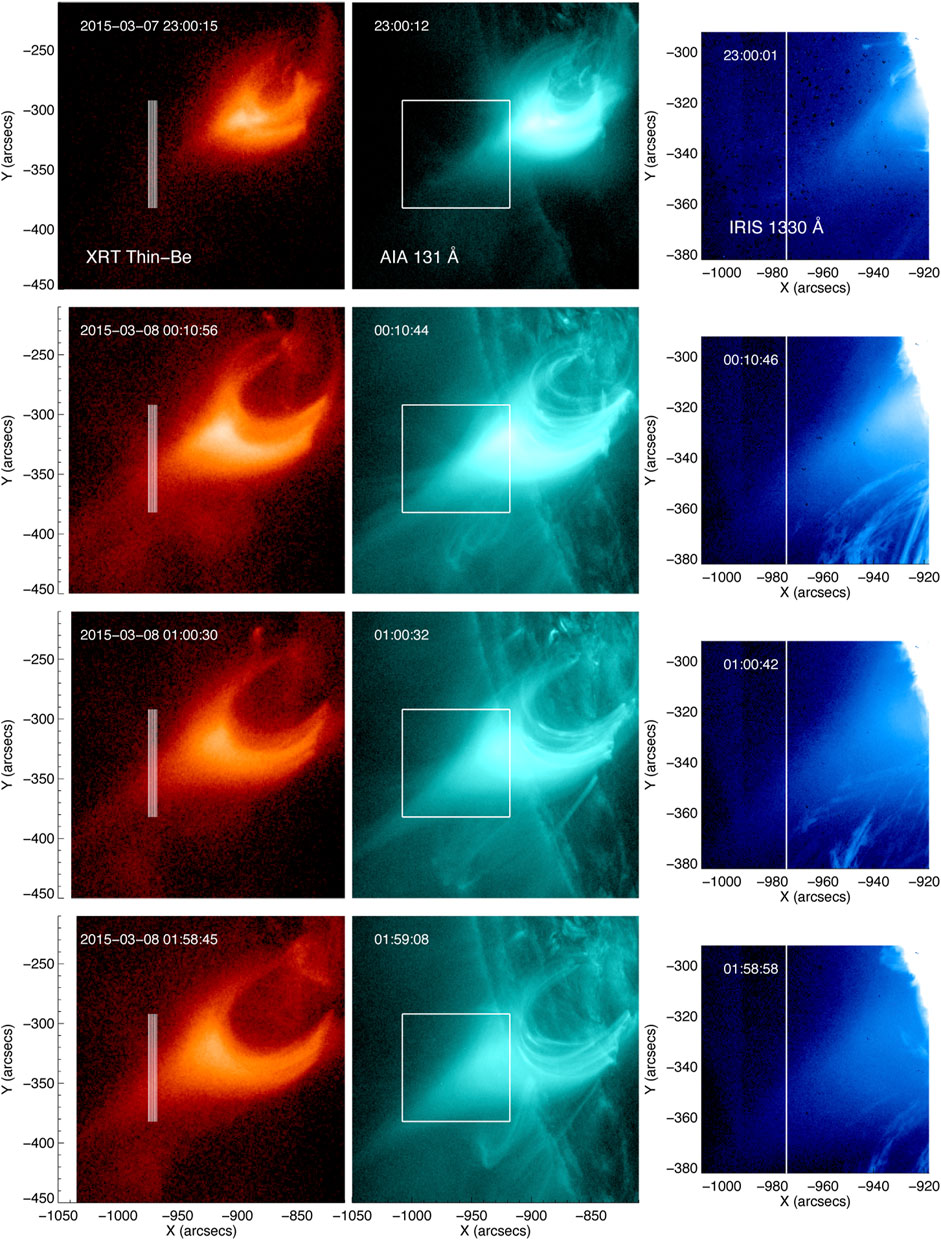
FIGURE 1. Overview of the 2015–03-07 flare between 23:00:15 UT to 01:58:45 UT on March 8th. The panels from left to right are observed images from Hinode/XRT, SDO/AIA 131Å, and IRIS 1330 Å SJI. The vertical white lines on XRT images indicate the slit position of IRIS Fe XXI spectra observations. The white box on AIA 131 maps shows the SJI FOV.
Figure 2 shows two images from the XRT flare response using the Al-Thick and Be-Thin filters. The right two panels of Figure 2 shows the temperature and emission measure, calculated from the filter ratio of the XRT two filters using the IDL routine xrt_teem_ch. We use coronal abundances to calculate the XRT temperature response functions because we are interested in the above-the-looptop plasma, which is likely directly heated, instead of resulting from chromospheric evaporation. Spectroscopic measurements in this region during another flare indicate that abundances are likely coronal (Warren et al., 2018).

FIGURE 2. Left two images: XRT Al-Thick and Be-Thin, respectively, at about 00:43 UT on March 8. Right two images: Temperature and emission measure, respectively, calculated from the Al-Thick/Be-Thin filter ratio.
In this work, we focus on the analysis of the Fe XXI observed by IRIS in high-temperature ≈10 MK plasma during flares. The IRIS observations during the flare event under study consist of an 8-step sparse raster (where the distance between consecutive slit positions is 1″), with a ≈30s exposure time, a raster cadence of ≈250s and a factor of two summing along the slit position. Figure 3 shows the intensity map of Fe XXI and spectra profiles at different times. For each slit position and time we averaged the Fe XXI spectra over 50 slit pixels to increase the signal-to-noise ratio. The centroid position (or Doppler velocity) of spectral lines and width (or FWHM) are obtained by using Gaussian fitting at each time. In fact, the line is very weak in the cusp/reconnection region, which is not surprising given the low density of the plasma there and the fact that the IRIS Fe XXI 1354.08Å line is a forbidden transition (e.g., Young et al., 2015). The non-thermal velocity was obtained by using the following formula:
where λ0 is 1354.08 Å, the rest wavelength of the line (e.g. Polito et al., 2015), c is 3 × 1010 cm s−1, FWHMinstr is the IRIS instrumental width (26 mÅ) and FWHMth is the thermal broadening of the line (≈0.43Å) assuming a formation temperature of logT [K] = 7.05.
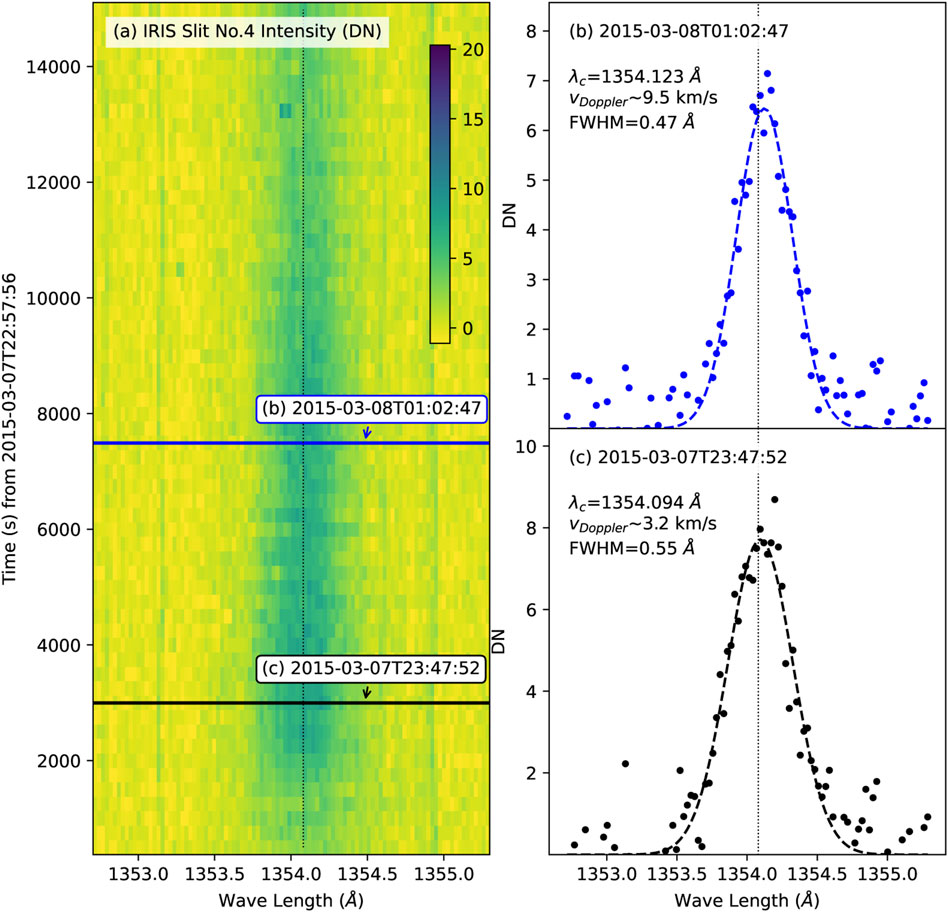
FIGURE 3. Fe XXI observations from IRIS during the 2015–03-07 flare. Panel (A) is the 2D spectral map as a function of time observed by IRIS slit No. 4. Panels (B–C) show Fe XXI spectral profiles at the chosen times indicated by blue and black lines in panel (A). The dashed curves show Gaussian fitting results with fit parameters (the central wavelength (λc) and FWHM). The vertical dotted lines indicate the position of λ0=1354.08 Å.
Figure 4A shows that the non-thermal velocity gradually decreases over time from more than 100 km s−1 to about 30 km s−1 in around 2 hours. Figure 4B shows that the Doppler shift velocity appears to be close to a mean value(∼4 km−1) for most of the time. The only exception is the first few minutes of the observation, where the Doppler velocity reaches larger values up to almost 40 km s−1. We note that there is a lot of scattering between the values obtained in different IRIS slits. The IRIS level 2 data used in this work are already corrected for both the orbital and absolute calibration of the wavelength array, with an accuracy that is estimated to be ≈1 km s−1 for most databases (Wülser et al., 2018). However, it is usually recommended to double-check the calibration manually using the centroids of strong neutral lines in case a small residual drift is still present. Such a sanity check cannot be performed in our data set because the raster is located off-limb and neutral lines are not observed.
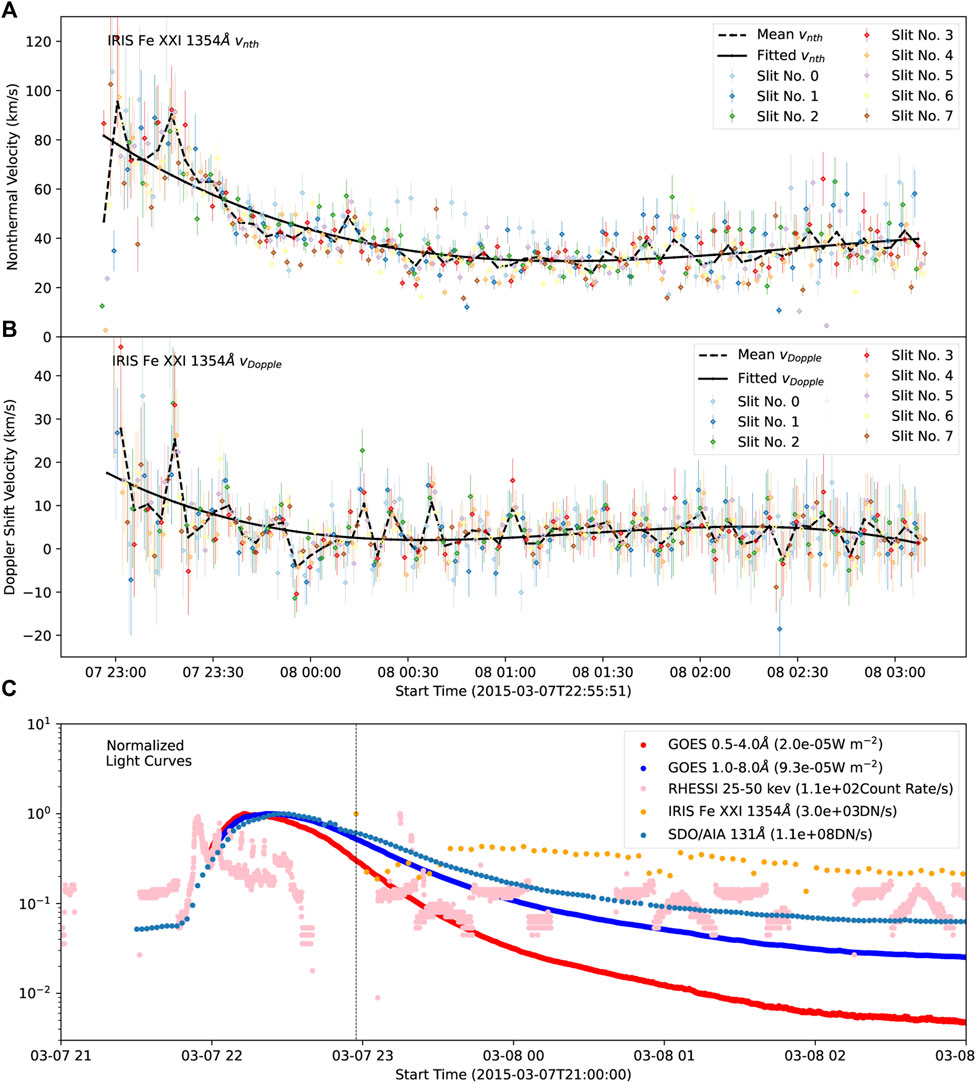
FIGURE 4. Panel (A): non-thermal velocity of the Fe XXI 1354 Å line observed by the eight IRIS raster slits over time during the 2015–03–07 flare. The error bar indicates measurement errors based on the statistical error estimation. The dashed black line is for the mean values over eight slits, and the solid black line shows the third-order polynomial fitting profile based on the mean values. Panel (B) is for the Doppler shifting velocity of Fe XXI 1354 Å line in the same event. Panel (C): normalized light curves of GOES and RHESSI, and the IRIS Fe XXI and SDO/AIA 131 flux in the chosen regions as shown in Figure 1. The dashed vertical line indicates the starting time for the following analysis on IRIS Fe XXI 1354 Å lines.
Further, we note that the peak time of the M class flare occurred at about 22:22UT, but IRIS did not detect sufficient signals in the Fe XXI line before ∼22:55UT shown by the dashed line in Figure 4C. As shown by the light curves of GOES X-ray, RHESSI, SDO/AIA 131Å and Fe XXI flux in this figure, the eruption starts from about 22:00UT and continues for more than 4 h. On the other hand, high temperature plasma is already observed before this time in the AIA 131 Å channel, showing plasma at ∼10 MK. This lack of emission in the IRIS Fe XXI line may be caused by the fact that this line is particularly faint, as mentioned above. This also suggests that the non-thermal velocity might have been higher during the early impulsive phase of the flare, before we can observe any Fe XXI emission in IRIS.
2.2 Model Setup
We use the same 3D solar flare model as shown in Shen et al. (2022), which follows the classic CHSKP configuration of two-ribbon flares. In this model, we solve the initial and boundary value problem governed by resistive MHD equations using the public code Athena (Stone et al., 2008). We use the non-dimensional form of MHD equations and set the primary characteristic parameters as follows: length L0 = 1.5 × 10⁸m, magnetic field strength B0 = 0.001T, density ρ0 = 2.5 × 10¹⁴m−3, temperature T0 = 1.13 × 10⁸K, velocity V0 = 1.366 × 10⁶ m s−1, and time t0 = 109.8s according to the general coronal environments. At the beginning of the MHD simulations, the magnetic field strength is uniform (
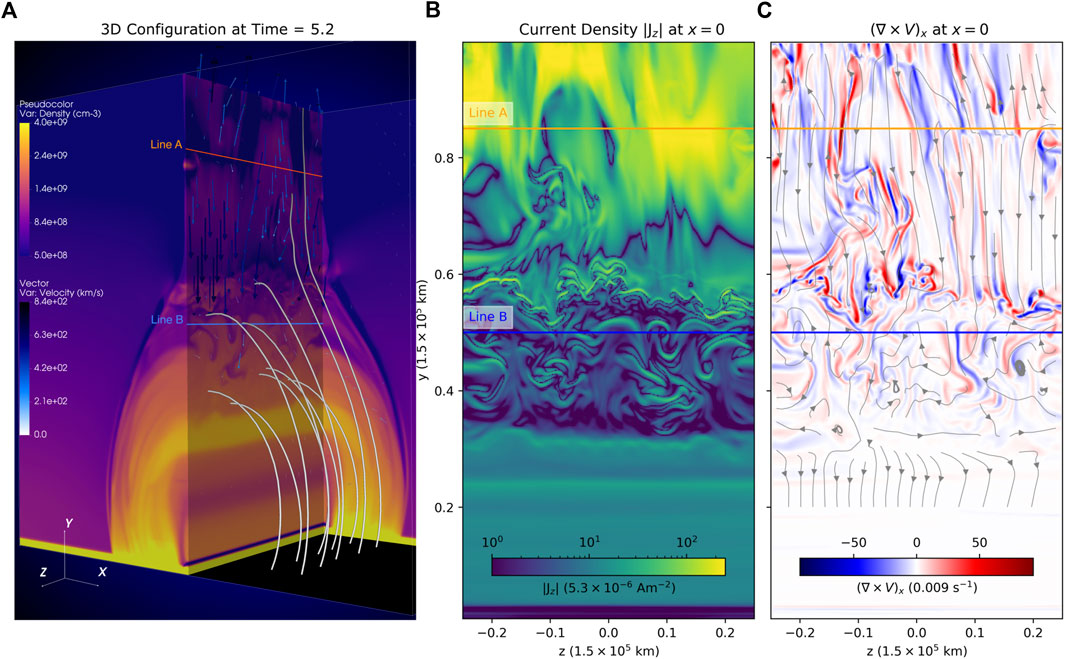
FIGURE 5. Distribution of primary variables in a 3D flare model at time =5.2t0. (A) Density and velocity distribution on the chosen planes in 3D. The gray tubes indicate magnetic field lines, and the black/blue arrows are for plasma flows. Along the LOS direction, two sampling lines A and B are chosen on the central plane (x =0). (B) Current density at the central plane. (C) Velocity vorticity component (∇× V)x on the central plane. The streamlines show velocity fields (Vy, Vz).
We perform combined 2D and 3D models in which the 2D simulation runs first to build the classic flare geometry and then the 3D model is started based on the resulting 2D configuration. In 2D cases, the system is initialized from a pre-existing vertical Harris-type CS along the y direction in mechanical and thermal equilibrium. Driven by the initial perturbation on magnetic fields (also see Shen et al., 2022), the CS becomes thinner due to the Lorentz-force attraction, and a pair of reconnection jets flow away from the reconnection X-point close to the initial perturbation center. The closed magnetic loops then appear as the reconnected magnetic flux accumulated at the bottom due to the line-tied boundary, in which the magnetic field lines are rooted at the boundary. Once the flare loops are well-formed after about t = 17.5t0, we start the 3D simulations by symmetrically extending all primary variables from the 2D domain to the third direction (z −). We then apply this time as the starting-point of evolution in the following analysis. The system then self-consistently evolves, and a set of reconnection-driven flare phenomena are seen, including Alfvénic bi-directional reconnection outflows, the termination shocks, and the turbulent interface region below the extended reconnection current sheet and above the flare loops (Figure 5A).
To compare our models with observations, we calculate synthetic Fe XXI 1354 Å line profiles that are observable by IRIS in high-temperature flare plasma (e.g., ∼11 MK). Once we compute the plasma properties (temperature, density, and velocity) on each cell from the 3D MHD simulation, the synthetic emission can be obtained along any chosen LOS (e.g., Lines A and B in Figure 5) by using the formula (e.g., Guo et al., 2017):
where ν indicates the frequency of emission lines, and l is the integration path. ne, nH ∼ 0.83ne are the electron and proton densities, which are obtained from MHD plasma density in the following calculations. g (Te) is the contribution function, which can be obtained from the CHIANTI database (Del Zanna et al., 2021) but needs account for proper element abundance (e.g., Feldman, 1992, in this paper). fν indicates the variation of velocity distribution function due to plasma flows along the LOS, given by
Here vl is the plasma flow speed along the LOS, c is the speed of light. ν0 is the rest frequency, and Δ = ν − ν0 means the offset frequency accordingly. The thermal broadening can be calculated by
where k is the Boltzmann constant, T is the temperature, m is the atomic mass of the chosen ion (e.g., Fe in this work).
3 Results
We calculate the synthetic emission line profiles of the Fe XXI 1354 Å line when the dynamic flows are well-developed in both the CS and flare cusp regions. It is noticed that Fe XXI 1354 Å is one of the strongest emission line from high-temperature plasma (e.g.,
3.1 Emission line profiles
We first analyze the spectral properties along the sampling Lines A and B. As shown in Figure 5, Line A is located at a relatively higher altitude along the CS, which is close to the primary reconnection X-points indicated by the strongest current density (Jz, in Figure 5B) and flow stagnation regions (Figure 5C). On the other hand, Line B is chosen to go through highly turbulent above loop-top regions, where the SADs-like tenuous down flow features are well-developed as reported by Shen et al. (2022). At this time (5.2t0), Line A shows slightly higher temperature and lower density than that of Line B overall (Figure 6). Along the LOS, we note that the plasma is appreciably cooler than the expected Fe XXI 1354 Å line temperature (e.g., Log T
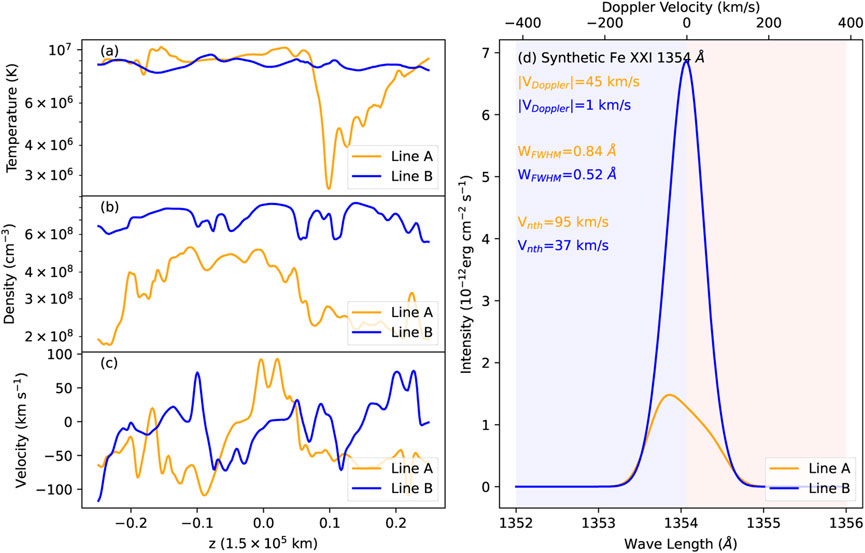
FIGURE 6. Synthetic Fe XXI 1354.08 Å emission along the sampling lines A and B shown in Figure 5. (A–C) Temperature, density, and velocity profiles along the two sampling lines. (D) Synthetic spectra for lines A and B vDoppler and vnth indicate the Doppler shift velocity and non-thermal velocity, respectively. WFWHM are the line broadenings of each spectral line obtained by measuring the full width at half maximum (FWHM).
Figure 6D shows the synthetic line profiles of the Fe XXI 1354 Å lines for the above two sampling lines. We assume that LOS is from z = −0.25L0 to z = +0.25L0 along each sampling line, and the Doppler shift velocity is then plotted based on this geometry accordingly. We note that the LOS direction may also be reversed in the observations, so the red and blue shifted Doppler velocity is a relative value in this plot. In this case, Line A shows a larger Doppler shift velocity (about 18 km s−1) than that of Line B because the Alfvénic downward reconnection outflows around Line A dominate the overall flow behavior. We measure the line broadening width using the full width at half maximum (FWHM) of the synthetic emission profiles. Then the non-thermal velocity (vnth) can be obtained according to the following equation:
where the λ0 is the central wavelength of Fe XXI 1354 Å line, logTeq = 7.05 K is the typical formation temperature of this line. In this particular position, the non-thermal velocity of Lines A (∼95 km s−1) and B (∼37 km s−1) are consistent with the deduced values in recent observations (e.g., Warren et al., 2018), but the line A value is slightly larger than those found by Doschek et al. (2014). However, the synthetic line profile strongly depends on the space and time evolution of the solar flare system, which will be addressed in the next section. In the current analysis in this paper, we only focus on non-thermal broadening features but leave the Doppler shifts for future works because the integration depth along the LOS is limited to the simulation box scale, which is surely shorter than the realistic CME/flare scale. Thus, the synthetic Doppler shift of Fe XXI 1354 Å line can be significantly affected by several locally large momentum components (e.g., the well-developed flux ropes), and the model-deduced Doppler velocity can largely depart from the common observational results by IRIS (Figure 4B). Therefore, large-scale solar eruption models are required to make a detailed comparison with the observable Doppler velocity in the future.
In general, the actual temperature on each pixel (or cell) along the LOS cannot always be exactly at the Teq, in either the observations and MHD models. Therefore, the deduced non-thermal velocity is unavoidably affected by the thermal broadening due to different temperatures, especially for high-temperature plasmas with logT > 7.05 K. In the following sections, we will follow this approach (where the equilibrium temperature is usually assumed when calculating the non-thermal broadening) to match the observational data analysis but give a more detailed discussion in Section 3.3.
We analyze the perturbation properties of primary variables along the LOS by using the Fourier transform method to investigate the nature of the broadening of spectral lines. In Figure 7, we perform the one-dimensional Fourier transform for density (ρ), velocity square (v2), and kinetic energy (Ek) along the Lines A and B. It is clear that these perturbations appear on all scales (or wave number (k) ranges), and the kinetic energy cascades from the large scale to the small scale as well. Furthermore, the spectrum matches the power-law tendency as the prediction in the classic turbulence theories, which could naturally result in the line broadening. Due to the limitation of the MHD grid sizes, we do not show here the spectrum distribution in high-k ranges where the possible inertial range is expected in turbulence theories. However, we can estimate the turbulence properties in the intermediate ranges quantitatively by fitting a power-law spectrum (∼ k−γ) in Figure 7C. We also check the temperature weighted Ek in according to the chosen temperature (logT ∼ 7.05 K) for the Fe XXI 1354 Å line. A similar power law distribution pattern can be seen clearly, as shown in Figure 7D. We notice that Line A with larger Fe XXI 1354 Å line broadening shows a higher index (γ ∼ 5.34) as compared with the shallower line B (γ ∼ 2). This result indicates that large bulk flows can significantly contribute to the line broadening as shown by the velocity spectrum of Line A, in which the more turbulent flows remain in the low-k (or large scale) ranges.

FIGURE 7. Fourier power spectrum along the sampling lines A and B for (A) density perturbations, (B) velocity power, (C) kinetic energy perturbations, and (D) temperature-weighted kinetic energy. The peak formation temperature T0 for Fe XXI lines is about 11.5 MK in panel (D). The horizontal axis is wave numbers, and the vertical axis is non-dimensional power. The γ indicates the power index by fitting the spectrum profiles with power-law functions (∼ k−γ).
3.2 Spatial and temporal evolution
In Figure 8, we plot the distribution and temporal evolution of synthetic Fe XXI 1354 Å emissions with a viewpoint such that the plasma sheet is viewed edge-on. At each MHD simulation cell on the x − y plane, we obtain the synthetic spectral lines assuming that the LOS is along the z − direction. The maximum intensity of the obtained Fe XXI 1354 Å spectra line at each MHD grid is shown in Figure 8A, in which the bright sheet structure and flare cusp regions can be clearly seen as predicted by the standard solar flare model. The non-thermal velocity is calculated and shown in Figure 8B.
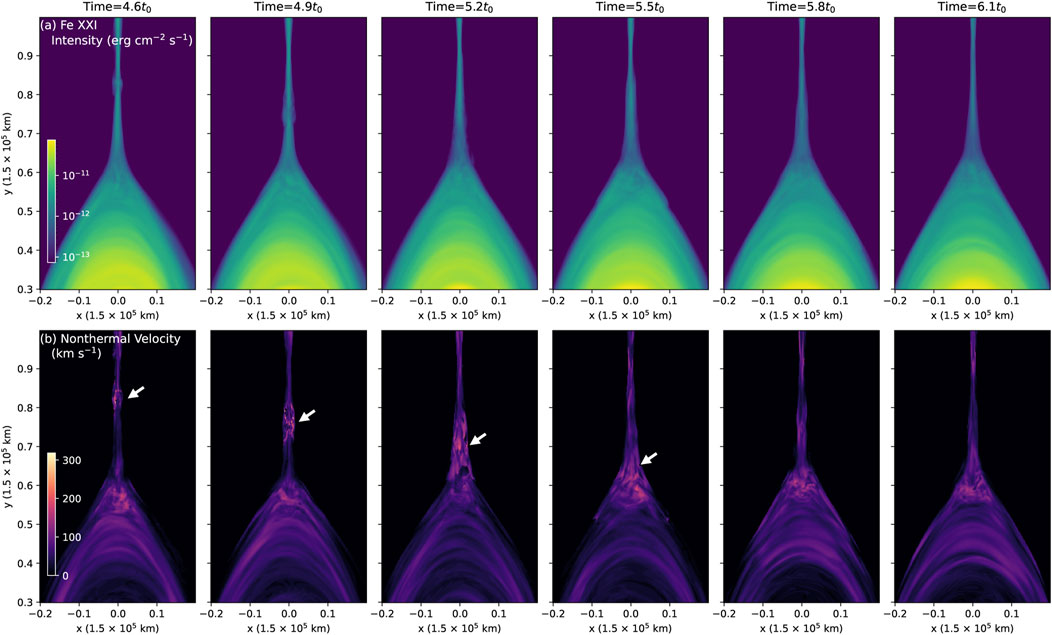
FIGURE 8. Synthetic Fe XXI 1354 Å emission maps at different times. (A) The peak intensity of 1354 Å spectra line during time t =4.6t0 to 6.1t0, (B) The deduced non-thermal velocity (vnth). The white arrows annotate the downward moving high vnth structures.
Figure 8 shows that the region where there is strong non-thermal line broadening (up to
In order to understand the magnetic field topology and plasma flow properties in these high-vnth regions, we plot out the horizontal momentum component (ρVz) and magnetic component (Bz) in Figure 9. Because the emission intensity of the Fe XXI line is proportional to ρ2 and is primarily affected by horizontal flow Vz, the plasma momentum (ρVz) should be a sensitive factor to distinguish the effects of different structures on emission line profiles and line broadening. As shown in Figure 9A, the dashed lines and arrows highlight the heights characterized by enhanced vnth, similarly to Figure 8B. It is clear that the position of the strong horizontal momentum component coincides with such heights. The strongest momentum regions are usually associated with well-developed magnetic flux-ropes. At time = 4.6t0, two of these flux-ropes are highlighted by plotting the chosen helical magnetic field lines where the strongest momentum component appears. At later times (4.9 ∼ 5.2t0), these two flux-ropes are associated with strong ρVz components that move downwards to lower heights. In fact, the strong momentum components (ρVz) are due to the appearance of a guide field Bz in such a turbulent reconnection current sheet. As shown in the second row of Figure 9, the guide field Bz widely appears with a very turbulent behavior inside the whole current sheet. The typical relative strength of Bz to the total background (B) ranges from ∼5%–10%, and can be larger than ∼30% at particular positions and times (indicated by the dark-blue color in Figure 9). It is then not surprising that the well-developed flux-ropes with strong momentum components (ρVz) are generally found in high Bz regions. In addition, other structures all have significant contributions to the momentum component ρVz, including the growing flux-ropes and very turbulent reconnection outflows with remarkable horizontal flow components along the z − direction. As shown in Figure 9, well-developed flux-ropes are relatively rare in the whole current sheet region. The fluctuations in ρVz can be commonly found around the growing flux-ropes and turbulent reconnection outflow patches as well. For example, a large number of growing flux-ropes appear at the center region at time = 5.2t0, which is consistent with the high vnth region above y = 0.7L0. Meanwhile, the nearby fully developed flux rope is located at a much lower altitude (y ∼ 0.65L0).
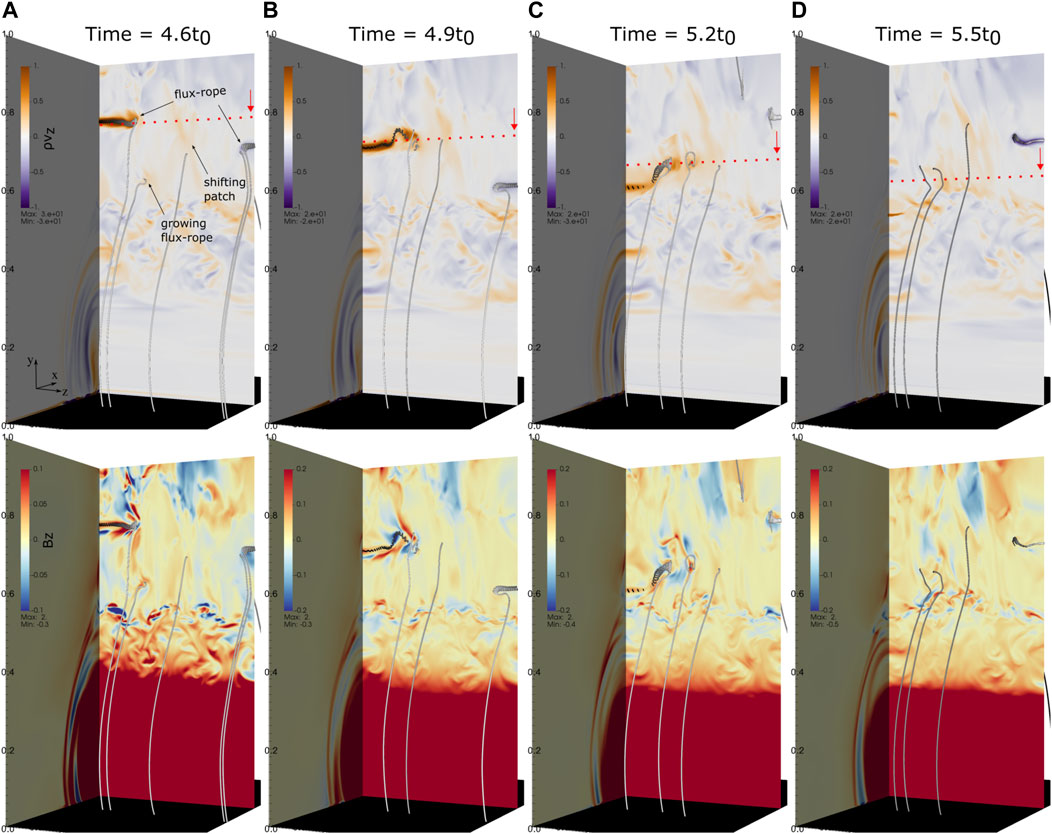
FIGURE 9. Distribution of momentum component (ρVz) and magnetic component Bz on the center plane (x =0) at different times. Panels (A–D) are for Time = 4.6, 4.9, 5.2, and 5.5 t0, respectively. The upper row is for (ρVz) in which the gray tubes show magnetic field lines around the well-developed magnetic flux-ropes, the growing magnetic flux-rope, and shift-moving reconnection outflow patches in z −direction. The red dotted lines and arrows indicate the same heights annotated in Figure 8. The low panels are for Bz with the same magnetic field lines.
The downward high-vnth features commonly exist for a longer duration in the reconnection process. Figure 10 displays the time–distance map (or “stack plot”), showing the distribution of the non-thermal velocity of Fe XXI 1354 Å line along at the CS center (x = 0) as a function of time. The high-vnth emission flows away from the primary X-point regions nearby y ∼ 0.9, as can be clearly seen in Figure 10B. These high-vnth patches are most like to originate from the reconnection X-point sites (around y ∼ 0.9L0), and spread with the reconnection outflows to the lower end of the CS. At different altitudes along the CS, there are two obvious regions of high non-thermal broadening: one is close to the primary reconnection X-point site and another is located above the flare loop-top. Above the flare loop-top region, the non-thermal velocity is strong but highly depends on the more complex plasma dynamics in this interface region. It could be roughly the same or decrease with height, as shown in Figure 10. We also notice that high non-thermal-broadenings also appear in upward flowing plasma near the upper boundary (y ∼ 1.0).
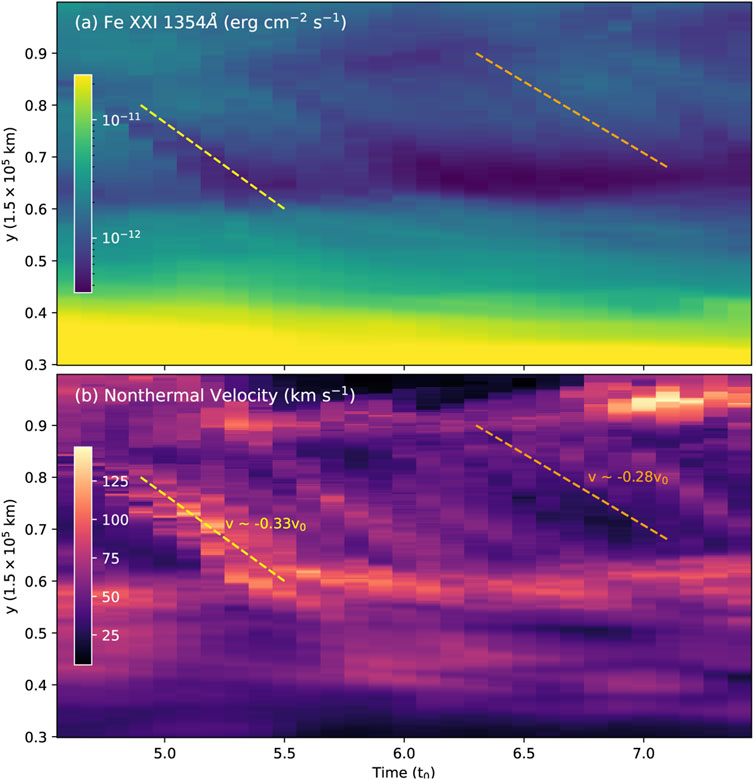
FIGURE 10. Time-distance maps along the CS direction at the system center (x =0). Panel (A) is for maximum Fe XXI 1354 Å intensity, (B) is for the non-thermal velocity (vnth) as functions of time. At each height, the median values over all non-zero values are shown here. The red and gray dashed lines indicate the downwards moving features with the speed of ∼0.33 and
3.3 Relations between vnth and plasma turbulence strength
In general, both plasma turbulence and bulk flows can contribute to the non-thermal widening (e.g., Ciaravella and Raymond, 2008), and it is hard to quantitatively explore the turbulent strength based on the observational line profiles due to complex plasma environments along the LOS direction. On the other hand, the numerical models allow us to obtain detailed information about the local plasma flows and integrated effects on spectral line profiles. Therefore, it is interesting to examine the correlation between the non-thermal velocity and plasma turbulence over a sample of locations in both the CS and flare loop-top regions during a relatively long period from 4.6 ∼ 7.4 t0 in this model. We introduce a non-dimensional parameter
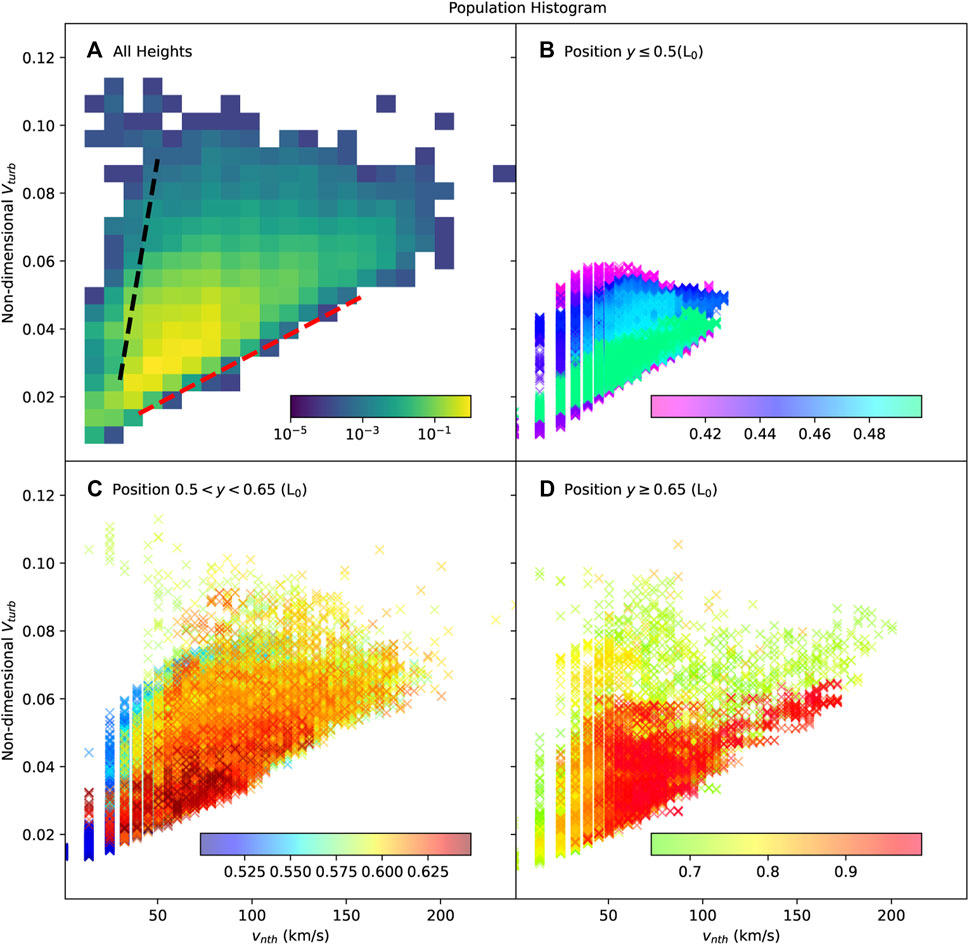
FIGURE 11. Distribution of plasma turbulence strength Vturb versus non-thermal velocity vnth. Panel (A) is the 2D histogram of vnth-Vturb map, which shows the population of samples in all heights from y ∼0.4L0 to y ∼1.0L0. The red and black dashed lines indicate two typical monotone correlations between vnth and Vturb. Panels (B) (C) (D) show each sample on the vnth-Vturb maps at different heights: near the flare loop-top region (y ≤0.5L0), the above-the-looptop region (0.5L0< y <0.65L0), and CS regions (y ≥0.65L0), respectively.
The deviation among the black and red dashed lines in Figure 11A could be due to the variation of plasma flows and turbulence properties at different heights, especially in the CS region and flare cusp regions where the plasma density and plasma β environments are largely different. Therefore, we display all samples on the vnth-Vturb map with their height information, in which colors indicate y − position of each sample in Figures 11B–D. We separate all samples into three groups (y ≤ 0.5L0, 0.5L0 < y < 0.65L0, and y ≥ 0.65L0) to make the difference more visible.
Figure 11B shows the first group of samples with the lowest heights below y ∼ 0.5L0, in which both the vnth and Vturb are small. Because this group of samples is close to the more dense flare loop-top regions, where the turbulent flows are expected to be relatively lower than those in the above-the-looptop regions, vnth is naturally small (e.g.,
Similar high-vnth and high-Vturb can be seen in the CS region as shown in Figure 11D as well. Samples in both the CS and the above loop-top regions tend to follow the growth direction marked by the red dashed line in Figure 11A, except small abnormal patches with low vnth and high Vturb that usually appear in the low end of the CS (y < ∼ 0.8L0) and upper the loop top region (y > ∼ 0.57L0). In fact, these abnormal samples that have departed from the red line direction may indicate strong bulk flows which will be discussed in the following section.
It is worth noticing that thermal broadening also contributes to the emission line broadening and has an impact on the corresponding vnth distribution, especially when the plasma is hotter than the equilibrium temperature of Fe XXI 1354 Å at logTeq ∼ 7.05 K. In the above investigations, there is a set of samples in our model that are slightly lower in temperature than the Fe XXI 1354 Å temperature (Teq) (e.g., see Figure 6A). Therefore, we investigate the vnth distribution in different temperature environments. We maintain the plasma density the same as in the above analysis but scale the temperature to match the observations (e.g., logT 7.0 ∼ 7.2 K shown in Figure 2). In the non-dimensional MHD models, the characteristic temperature can be expressed by
Figure 12A shows the population histogram of Vturb and vnth in the scaled temperature case. The red and black dashed lines are exactly the same as in Figure 11A as well. The distribution feature of vnth is consistent with the above results in the original MHD temperature case (TMHD), though the absolute values of vnth are slightly larger by about 10% ∼ 20%. These larger vnth are partially caused by the scaling process of MHD models, because the characteristic velocity increased by about
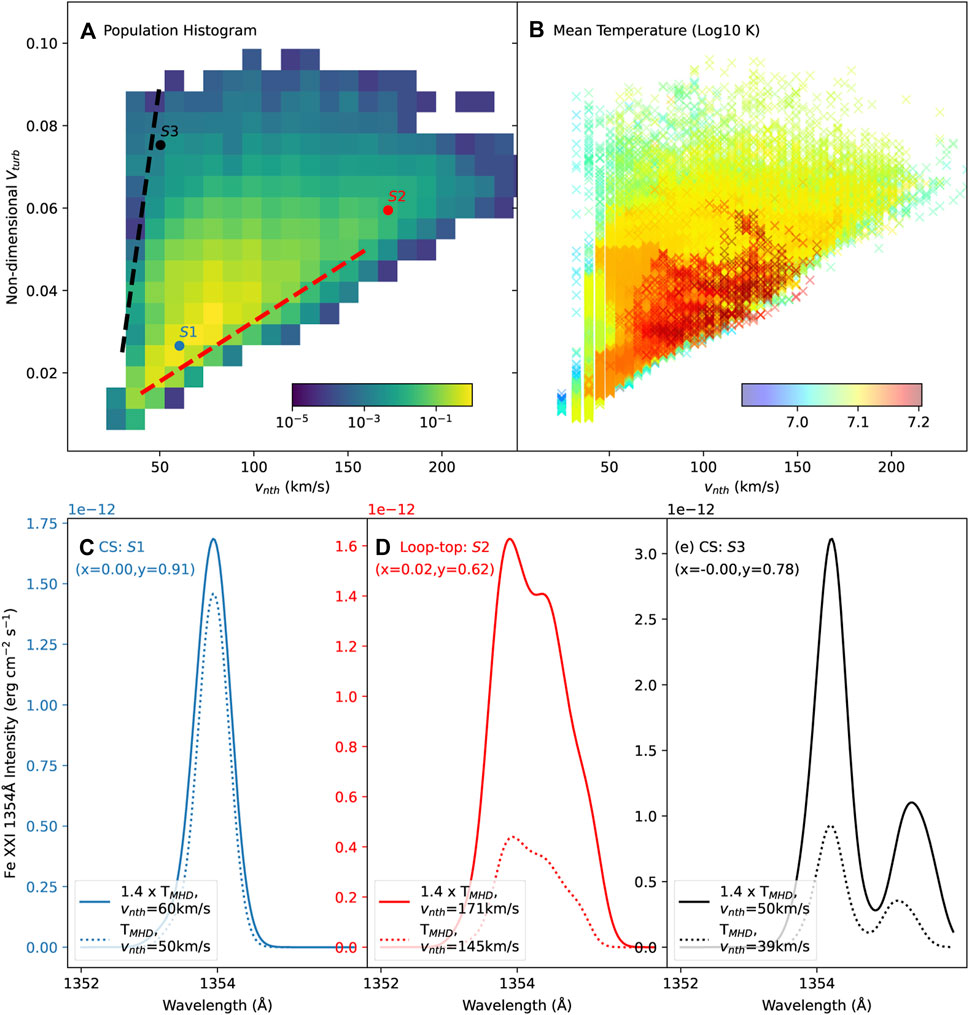
FIGURE 12. Distribution of the deduced non-thermal velocity vnth in the scaled temperature case. Panels (A) (B) show vnth-Vturb map in a 1.4× higher temperature situation compared with the original temperature (TMHD). The red and black dashed lines are the same as in Figure 11A. Panels (C–E) show synthetic Fe XXI 1354 Å line profiles at the marked sampling points in panel (A): S1 and S3 are located in the reconnection current sheet (CS) region, and S2 is above the flare loop-top region. Their projected position on the xoy plane are marked by (x, y) accordingly. The solid lines are for 1.4× scaled temperature cases and the dotted lines are for TMHD cases.
Figures 12C–E shows Fe XXI 1354 Å line profiles in two typical regions: CS region (S1, S3), and the above flare loop-top region (S2). Sample S1 represents the most dominant features with low turbulence strength and low non-thermal velocity. The line profile basically matches the Gaussian-type shape with minor line broadening due to the relatively weak turbulent flows. Sample S2 is at the high vnth end with strong Vturb, where the strong plasma perturbations contribute to a remarkable line-broadening in both the 1.4× higher and slightly lower TMHD cases. In addition, the plasma bulk flows also cause the second emission peak at
3.4 Non-thermal velocity across the CS
In this section, we investigate the averaged Fe XXI lines profiles across the CS and compare them to the IRIS observations during the 2015–03–07 flare. We set the position of the simulated IRIS slits above the flare loop top region in the MHD model as shown by Figure 13A. The synthetic SDO/AIA 131 image in this plot is obtained by assuming that the LOS is along the z − direction. The synthetic bright flare loops, cusp region, and extending CS regions all match well the SDO/AIA images of the solar flare under study (Figure 13A) well. It is clear that the IRIS slits are located just above the bright flare arches in AIA 131 during this eruption event (also see Figure 1). Therefore, we chose a height of y ∼ 0.62L0 in the MHD model to simulate the IRIS raster in the following analysis. As the reconnected magnetic flux is accumulated at the solar surface, the flare loop system gradually grows in both vertical and horizontal directions. Thus, the relative position of the IRIS slits to the flare cusp region gradually changes as a function of time. Because our MHD model is focused on the fast magnetic reconnection process in solar flares, it is reasonable to compare the predicted SDO/AIA emissions with the observed flare just after the impulsive phase when the post-flare loops are well-formed but the bursty magnetic energy release is still on-going. To simplify the analysis, we show a particular SDO/AIA observation at the starting time of IRIS observations (2015–03–07T23:00) in Figure 13B, and keep the simulated IRIS slits in the same position in this work.
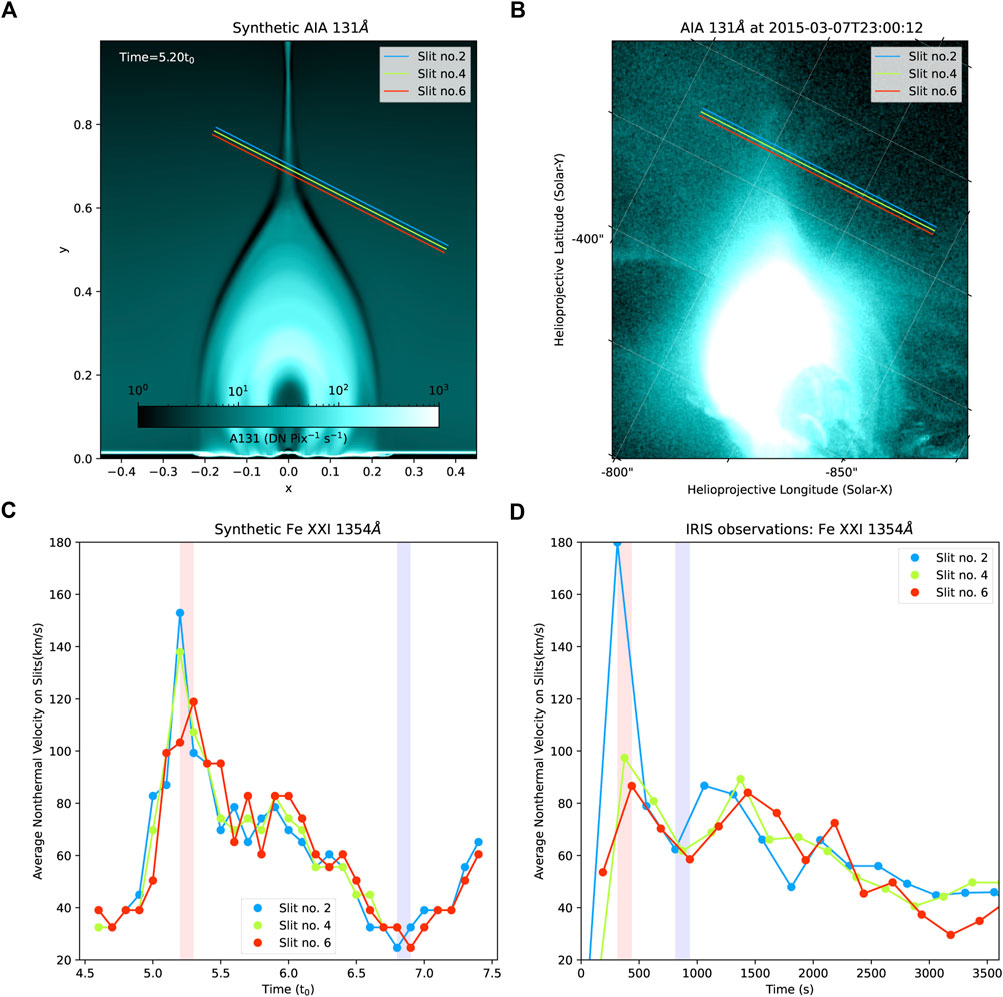
FIGURE 13. Modeled and observed non-thermal velocity of IRIS Fe XXI line. The left panels show: (A) the synthetic SDO/AIA 131 image, and (C) the non-thermal velocity calculated by using the averaged Fe XXI 1354 Å profiles along each IRIS slit. The colored solid lines in panels (A) and (C) indicate the IRIS slits with the length of
Along each slit in Figure 13A, we average the Fe XXI 1354 Å line profiles over all MHD cells with
In the ideal situation when the non-thermal velocity variation is due to the passing downward structures, the characteristic size of detectable downward patches can be estimated as follows:
Here δl is the length of moving patches, dslit is the interval of the IRIS slits, θ is the intersection angle between slits and the solar surface, vd is the moving speed of patches, and δt is the exposure time of each slit (or interval time between two slits). For instance, δt ∼ 30 s for the IRIS Fe XXI observations, dslit is about 726 km, and θ ∼ 30°. Assuming the downward moving structures are in sub-Alfvénic speed (e.g., 300 km/s), a moving enhanced vnth patch with the size of δl ≥∼ 8000 km should be well recognized. The above estimated δl equals
Similar to the synthetic results in MHD models, we also see very similar vnth evolution trends in the IRIS observations (Figure 13D). The red and blue shadowed regions show one example where the local maximum and minimum vnth has been recognized first on slit 2, then on the following slits 4, and 6. Remarkably, the evolution of vnth of the Fe XXI line is comparable between MHD model predictions and IRIS observations, which range from
Due to the similar variations in the MHD predictions and the IRIS observations described above, it is likely that the vnth variation on IRIS Fe XXI lines is due to intermittent downwards moving structures along with the reconnection outflows as shown in the above models. In fact, we find very similar intermittent downwards-moving signals on SDO/AIA 131Å images. Figure 14 shows the time-distance map of AIA 131Å intensity above the flare loop top regions. In this plot, we count all emissions over 16 pixels around the CS region (the bright plasma sheet on AIA 131Å maps) at each height to increase the signal-to-noise ratio. Two typical downward features are fitted by using red and yellow dashed lines. These downflow features range from ∼ 250 km/s to ∼ 100 km/s, which is consistent with the model-predicted moving speed of turbulent structures as shown in Figure 10. We also overlay the non-thermal velocity trends on the AIA 131Å stack map as shown by the solid-dots lines. There is no clear correlation between the brightest AIA features and the highest vnth because the AIA intensity is mainly dominated by plasma density in the CS region, while the vnth values are more affected by the turbulent plasma flows.
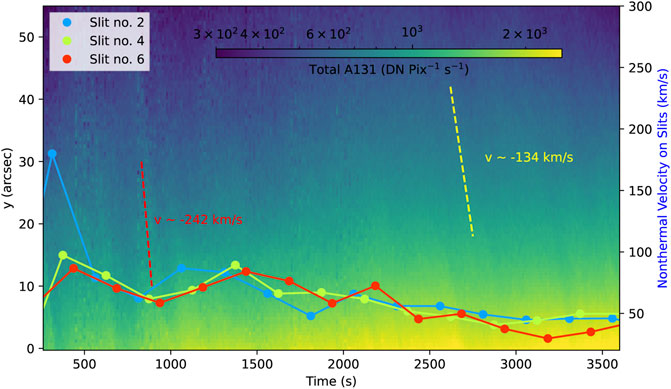
FIGURE 14. Time-distance map of SDO/AIA 131Å images in the reconnection region. The total AIA 131Å intensity is calculated by counting 16 pixels at each height around the brightest region above the flare loop top. The two dashed lines indicate the typical downwards-moving features with velocities of
We notice that the variation feature of non-thermal velocity above the flare loops (e.g., in Figures 11, 14) are consistent with the previous observational studies. The increasing behaviors on non-thermal velocity from the flare loops to higher altitudes have been reported in the past. For example, Doschek et al. (2014) found that the non-thermal velocity in the multimillion-degree regions increases with height above the bright coronal flare loops from Hinode/EIS observations. Our simulation results also match their explanation, in which the strong newly contracting hot and turbulent plasma mainly contributes to these high non-thermal motions.
4 Discussion and conclusion
Using our three-dimensional MHD model based on the classic solar flare configuration, we calculate the synthetic emission profiles of the Fe XXI 1354 Å line observed by the Interface Region Imaging Spectrograph (IRIS) spacecraft. The synthetic line broadening and non-thermal velocities (vnth) are obtained around the whole magnetic reconnection regions including the current sheet (CS) and flare loop-top regions. We compare the predicted non-thermal velocities due to the turbulent flows with the IRIS observations during the 2015–03–07 flare.
The main results are summarized as follows.
1. Our MHD model reveals highly turbulent plasma flows both in the CS where the magnetic reconnection sites are located, and in the flare loop top region, an interface region below the CS where the reconnection outflows mix into the flare arcade. Fourier transform analysis of plasma density, velocity, and kinetic energy show that the plasma perturbation spectrum along the LOS (z − direction in this model) follows the power-law tendency of the classic turbulence scenarios.
2. Using the modeled plasma density, temperature, and velocity distribution in 3D, we calculate the emission line profiles in CS and flare loop-top regions in an edge viewing. We found that the non-thermal broadening of Fe XXI 1354 Å is mainly due to the plasma bulk flows in high turbulence states. The dominant non-thermal velocity ranges from ∼20 km/s to ∼180 km/s, and could be up to ∼300 km/s in some particular position and times.
3. We obtain a two-dimensional synthetic non-thermal velocity (vnth) map and investigate the spatial and temporal evolution features. We find that vnth is dynamically evolving in both the CS and flare loop-top regions. The high vnth structures flow down with a typical speed of
4. We study synthetic vnth distribution versus plasma turbulence strength Vtrub during a relatively long period. The two-dimensional population histogram map shows that vnth is basically proportional to Vtrub, but with a set of abnormal points due to the large plasma bulk flows. This result indicates that the investigation of plasma turbulence properties based on the emission line broadening features must consider the different fine structures in the CS and flare loop-top regions.
5. We investigate the Fe XXI lines profiles across the CS and make a detailed comparison with the IRIS observations. The deduced vnth obtained by averaging the Fe XXI emission over the IRIS slit and exposure time ranges from ∼20 km/s to ∼160 km/s, which is consistent with the IRIS observations. Consistent vnth features on different IRIS slits were found in both the synthetic results and the IRIS observations. By comparing the down-flowing high vnth structures and SDO/AIA observations, our results suggest that these downwards-moving fine structures inside the CS could be identified by IRIS due to the variation of the line width of the high-temperature Fe XXI 1354 Å line.
It is worth mentioning that the magnetic configuration of our MHD model may be largely different from the 2015–03-07 flare event. Therefore, we can not exactly compare the model synthetic results with IRIS observations over a very long interval (e.g., ∼ 4 h observation as shown in Figure 4). However, the down-flowing high vnth structures can be expected to exist in the model commonly (also see Figure 10). Thus, it is reasonable that to choose one short period evolution from the model (4.6 ∼ 7.4 t0) during the magnetic reconnection process to compare with the IRIS observations. The speed of down-flowing high vnth structures are predicted to be less than one-third of the Afvénic speed in the reconnection region 10), which matches the downflow features observed by SDO/AIA if we assume that the local background Alfvén speed is reduced by a factor of two as compared with the characteristic speed in the model. Due to the lack of accurate magnetic field information around the CS, further accurate studies on vnth variation require more effort on both the MHD modeling and observational side. In particular, the Multi-Slit Explorer (MUSE), which will be launched in 2027, will be ideal for observing the current sheet and above the loop-top region given its multi-slit configuration and will provide groundbreaking observations of this region as a whole.
Data availability statement
The original contributions presented in the study are included in the article/supplementary material, further inquiries can be directed to the corresponding author.
Author contributions
CS performed the MHD simulations and visualized the results. VP and KR performed IRIS, XRT, and SDO/AIA data analysis. BC contributed to spectrum prediction for IRIS. SY and XX contributed to the synthetic SDO/AIA image modeling. All authors contributed to the model development, discussed the results, and commented on the manuscript.
Funding
This work was supported by NSF grants AGS1723313 and AST2108438 to the Smithsonian Astrophysical Observatory. CS acknowledges the support of NASA grants 80NSSC21K2044, 80NSSC19K0853, 80NSSC18K1129, and 80NSSC20K1318. VP acknowledges financial support from the NASA grants 80NSSC20K0716 and NNG09FA40C (IRIS). KR and XX are supported by NASA grant 80NSSC18K0732. SY and BC are supported by NSF grant AST-2108853 and NASA grants 80NSSC20K1318 and 80NSSC20K1283/SV0-09025 to NJIT.
Acknowledgments
The computations in this paper were conducted on the Smithsonian High-Performance Cluster, Smithsonian Institution (https://doi.org/10.25572/SIHPC). CHIANTI is a collaborative project involving George Mason University, the University of Michigan (United States), and the University of Cambridge (United Kingdom). AIA data are courtesy of NASA/SDO and the AIA science team. IRIS is a NASA small explorer mission developed and operated by LMSAL with mission operations executed at NASA Ames Research center and major contributions to downlink communications funded by ESA and the Norwegian Space Centre.
Conflict of interest
The authors declare that the research was conducted in the absence of any commercial or financial relationships that could be construed as a potential conflict of interest.
Publisher’s note
All claims expressed in this article are solely those of the authors and do not necessarily represent those of their affiliated organizations, or those of the publisher, the editors and the reviewers. Any product that may be evaluated in this article, or claim that may be made by its manufacturer, is not guaranteed or endorsed by the publisher.
References
Astropy Collaboration, Robitaille, T. P., Tollerud, E. J., Greenfield, P., Droettboom, M., Bray, E., et al. (2013). Astropy: A community Python package for astronomy. A&A 558, A33. doi:10.1051/0004-6361/201322068
Bemporad, A. (2008). Spectroscopic detection of turbulence in post-CME current sheets. Astrophysical J. 689, 572–584. doi:10.1086/592377
Cai, Q., Shen, C., Raymond, J. C., Mei, Z., Warmuth, A., Roussev, I. I., et al. (2019). Investigations of a supra-arcade fan and termination shock above the top of the flare-loop system of the 2017 September 10 event. MNRAS 489, 3183–3199. doi:10.1093/mnras/stz2167
Cai, Q., Ye, J., Feng, H., and Zhao, G. (2022). Variations of the plasma environment revealed by the evolution of the supra-arcade fan in the 2017 september 10 flare. ApJ 929, 99. doi:10.3847/1538-4357/ac5fa4
Cheung, M. C. M., Rempel, M., Chintzoglou, G., Chen, F., Testa, P., Martínez-Sykora, J., et al. (2019). A comprehensive three-dimensional radiative magnetohydrodynamic simulation of a solar flare. Nat. Astron. 3, 160–166. doi:10.1038/s41550-018-0629-3
Ciaravella, A., and Raymond, J. C. (2008). The current sheet associated with the 2003 november 4 coronal mass ejection: Density, temperature, thickness, and line width. Astrophysical J. 686, 1372–1382. doi:10.1086/590655
Ciaravella, A., Raymond, J. C., Li, J., Reiser, P., Gardner, L. D., Ko, Y. K., et al. (2002). Elemental abundances and post-coronal mass ejection current sheet in a very hot active region. Astrophysical J. 575, 1116–1130. doi:10.1086/341473
De Pontieu, B., Title, A. M., Lemen, J. R., Kushner, G. D., Akin, D. J., Allard, B., et al. (2014). The interface region imaging spectrograph (IRIS). Sol. Phys. 289, 2733–2779. doi:10.1007/s11207-014-0485-y
De Pontieu, B., Polito, V., Hansteen, V., Testa, P., Reeves, K. K., Antolin, P., et al. (2021). A new view of the solar interface region from the interface region imaging spectrograph (IRIS). Sol. Phys. 296, 84. doi:10.1007/s11207-021-01826-0
Del Zanna, G., Dere, K. P., Young, P. R., and Landi, E. (2021). CHIANTI—an atomic database for emission lines. XVI. Version 10, further extensions. ApJ 909, 38. doi:10.3847/1538-4357/abd8ce
Doschek, G. A., McKenzie, D. E., and Warren, H. P. (2014). Plasma dynamics above solar flare soft X-ray loop tops. ApJ 788, 26. doi:10.1088/0004-637x/788/1/26
Feldman, U. (1992). Elemental abundances in the upper solar atmosphere. Phys. Scr. 46, 202–220. doi:10.1088/0031-8949/46/3/002
Freeland, S. L., and Handy, B. N. (1998). Data analysis with the SolarSoft system. Sol. Phys. 182, 497–500. doi:10.1023/A:1005038224881
Golub, L., Deluca, E., Austin, G., Bookbinder, J., Caldwell, D., Cheimets, P., et al. (2007). The X-ray telescope (XRT) for the Hinode mission. Sol. Phys. 243, 63–86. doi:10.1007/s11207-007-0182-1
Guo, L., Li, G., Reeves, K., and Raymond, J. (2017). Solar flare termination shock and synthetic emission line profiles of the Fe xxi 1354.08 - line. Astrophysical J. 846, L12. doi:10.3847/2041-8213/aa866a
Huang, Y.-M., and Bhattacharjee, A. (2016). Turbulent magnetohydrodynamic reconnection mediated by the plasmoid instability. ApJ 818, 20. doi:10.3847/0004-637x/818/1/20
Kano, R., Sakao, T., Hara, H., Tsuneta, S., Matsuzaki, K., Kumagai, K., et al. (2008). The Hinode X-ray telescope (XRT): Camera design, performance and operations. Sol. Phys. 249, 263–279. doi:10.1007/s11207-007-9058-7
Kobelski, A. R., Saar, S. H., Weber, M. A., McKenzie, D. E., and Reeves, K. K. (2014). Calibrating data from the hinode/X-ray telescope and associated uncertainties. Sol. Phys. 289, 2781–2802. doi:10.1007/s11207-014-0487-9
Kosugi, T., Matsuzaki, K., Sakao, T., Shimizu, T., Sone, Y., Tachikawa, S., et al. (2007). The Hinode (solar-B) mission: An overview. Sol. Phys. 243, 3–17. doi:10.1007/s11207-007-9014-6
Lazarian, A., and Vishniac, E. T. (1999). Reconnection in a weakly stochastic field. Astrophysical J. 517, 700–718. doi:10.1086/307233
Lemen, J. R., Title, A. M., Akin, D. J., Boerner, P. F., Chou, C., Drake, J. F., et al. (2012). The atmospheric imaging assembly (AIA) on the solar dynamics observatory (SDO). Sol. Phys. 275, 17–40. doi:10.1007/s11207-011-9776-8
Li, Y., Ding, M. D., Qiu, J., and Cheng, J. X. (2015). Chromospheric evaporation in an X1.0 flare on 2014 March 29 observed with IRIS and EIS. Astrophysical J. 811, 7. doi:10.1088/0004-637x/811/1/7
Li, Y., Xue, J. C., Ding, M. D., Cheng, X., Su, Y., Feng, L., et al. (2018). Spectroscopic observations of a current sheet in a solar flare. Astrophysical J. 853, L15. doi:10.3847/2041-8213/aaa6c0
Lin, J., Murphy, N. A., Shen, C., Raymond, J. C., Reeves, K. K., Zhong, J., et al. (2015). Review on current sheets in CME development: Theories and observations. Space Sci. Rev. 194, 237–302. doi:10.1007/s11214-015-0209-0
McKenzie, D. E. (2013). Turbulent dynamics in solar flare sheet structures measured with local correlation tracking. Astrophysical J. 766, 39. doi:10.1088/0004-637x/766/1/39
Mumford, S. J., Freij, N., Christe, S., Ireland, J., Mayer, F., Stansby, D., et al. (2022). SunPy. Zenodo. doi:10.5281/zenodo.591887
Pesnell, W. D., Thompson, B. J., and Chamberlin, P. C. (2012). The solar dynamics observatory (SDO). Sol. Phys. 275, 3–15. doi:10.1007/s11207-011-9841-3
Polito, V., Reeves, K. K., Del Zanna, G., Golub, L., and Mason, H. E. (2015). Joint high temperature observation of a small C6.5 solar flare with Iris/Eis/Aia. ApJ 803, 84. doi:10.1088/0004-637X/803/2/84
Polito, V., Dudík, J., Kašparová, J., Dzifčáková, E., Reeves, K. K., Testa, P., et al. (2018a). Broad non-Gaussian Fe XXIV line profiles in the impulsive phase of the 2017 september 10 X8.3-class flare observed by Hinode/EIS. Astrophysical J. 864, 63. doi:10.3847/1538-4357/aad62d
Polito, V., Galan, G., Reeves, K. K., and Musset, S. (2018b). Possible signatures of a termination shock in the 2014 March 29 X-class flare observed by IRIS. ApJ 865, 161. doi:10.3847/1538-4357/aadada
Reeves, K. K., Polito, V., Chen, B., Galan, G., Yu, S., Liu, W., et al. (2020). Hot plasma flows and oscillations in the loop-top region during the 2017 september 10 X8.2 solar flare. Astrophysical J. 905, 165. doi:10.3847/1538-4357/abc4e0
Shen, C., Chen, B., Reeves, K. K., Yu, S., Polito, V., and Xie, X. (2022). The origin of underdense plasma downflows associated with magnetic reconnection in solar flares. Nat. Astron. 6, 317–324. doi:10.1038/s41550-021-01570-2
Shibata, K., and Magara, T. (2011). Solar flares: Magnetohydrodynamic processes. Living Rev. Sol. Phys. 8, 6. doi:10.12942/lrsp-2011-6
Stone, J. M., Gardiner, T. A., Teuben, P., Hawley, J. F., and Simon, J. B. (2008). Athena: A new code for astrophysical MHD. ApJS 178, 137–177. doi:10.1086/588755
Tian, H., Li, G., Reeves, K. K., Raymond, J. C., Guo, F., Liu, W., et al. (2014). Imaging and spectroscopic observations of magnetic reconnection and chromospheric evaporation in a solar flare. Astrophysical J. 797, L14. doi:10.1088/2041-8205/797/2/l14
Warren, H. P., Brooks, D. H., Ugarte-Urra, I., Reep, J. W., Crump, N. A., and Doschek, G. A. (2018). Spectroscopic observations of current sheet formation and evolution. Astrophysical J. 854, 122. doi:10.3847/1538-4357/aaa9b8
Wülser, J. P., Jaeggli, S., De Pontieu, B., Tarbell, T., Boerner, P., Freeland, S., et al. (2018). Instrument calibration of the interface region imaging spectrograph (IRIS) mission. Sol. Phys. 293, 149. doi:10.1007/s11207-018-1364-8
Xie, X., Reeves, K. K., Shen, C., and Ingram, J. D. (2022). Statistical study of the kinetic features of supra-arcade downflows detected from multiple solar flares. ApJ 933, 15. doi:10.3847/1538-4357/ac695d
Ye, J., Cai, Q., Shen, C., Raymond, J. C., Lin, J., Roussev, I. I., et al. (2020). The role of turbulence for heating plasmas in eruptive solar flares. ApJ 897, 64. doi:10.3847/1538-4357/ab93b5
Yoshimura, K., and McKenzie, D. E. (2015). Calibration of Hinode/XRT for coalignment. Sol. Phys. 290, 2355–2372. doi:10.1007/s11207-015-0746-4
Keywords: solar corona, spectroscopic, magnetohydrodynamical simulations, magnetic reconnection (MR), solar eruption
Citation: Shen C, Polito V, Reeves KK, Chen B, Yu S and Xie X (2023) Non-thermal broadening of IRIS Fe XXI line caused by turbulent plasma flows in the magnetic reconnection region during solar eruptions. Front. Astron. Space Sci. 10:1096133. doi: 10.3389/fspas.2023.1096133
Received: 11 November 2022; Accepted: 16 January 2023;
Published: 02 February 2023.
Edited by:
Mihalis Mathioudakis, Queen’s University Belfast, United KingdomReviewed by:
Damian Christian, California State University, Northridge, United StatesAlexey A. Kuznetsov, Institute of Solar-Terrestrial Physics (RAS), Russia
Copyright © 2023 Shen, Polito, Reeves, Chen, Yu and Xie. This is an open-access article distributed under the terms of the Creative Commons Attribution License (CC BY). The use, distribution or reproduction in other forums is permitted, provided the original author(s) and the copyright owner(s) are credited and that the original publication in this journal is cited, in accordance with accepted academic practice. No use, distribution or reproduction is permitted which does not comply with these terms.
*Correspondence: Chengcai Shen, Y2hlbmdjYWlzaGVuQGNmYS5oYXJ2YXJkLmVkdQ==
 Chengcai Shen
 Vanessa Polito
 Katharine K. Reeves
 Bin Chen
 Sijie Yu5