 Aqil Tariq
 Jianguo Yan
 Qingyun Deng
 Jean-Pierre Barriot
- 1State Key Laboratory of Information Engineering in Surveying, Mapping and Remote Sensing, Wuhan University, Wuhan, China
- 2Observatoire Géodésique de Tahiti, University of French Polynesia, Tahiti, French Polynesia
Maps of lunar wrinkle ridges (LWRs) were created from 70°N to 70°S and 140°E to 140°W (extracted and highlighted the major LWRs area) using automated LWRs detection process with Lunar Reconnaissance Orbiter Camera wide range angle camera and Lunar Orbiter Laser Altimeter data. Automatic detection of LWRs is challenging because the ridges are of irregular shapes and many ridges have been eroded and/or degraded over time. It’s a preliminary study of automated ridge detection from DEM data. Statistics and measurements of the extracted LWRs, including orientation, extent, length, height, and elevation offset, were performed based on the mapping of lunar ridges. The identified ridges were classified based on their orientation, distribution, direction, and each class were further divided over basalts, and nearby highlands. According to the findings, 3,375 segments with a total length of 26,455.01 km were identified, and the average elevation offset, width, and height of all the wrinkle ridges were 40.39 m, 3.47 km, and 0.29 km respectively after weighting by length. The LWRs were divided into three morphologies and distributions: parallel ridges, isolated ridges, and concentric ridges. The vast majority of LWRs were found in basalts area, with an extension into neighboring highland. The relations between the morphological parameters were further quantitatively analyzed, and a similar linear correlation between the width and height was found in each class of lunar ridges, implying that small and large ridges were formed as a continuum and that the three classes of ridges were probably formed by some common processes. Finally, the relations between the lunar wrinkle ridges and other geomorphic phenomena were analyzed, indicating that purely volcanic origin or buried premare structures are difficult to reconcile with the investigation. In addition, the consistency between the occurrence of the lunar wrinkle ridges and the thickness of lunar maria indicates that the formation of lunar wrinkle ridges is closely related to the lunar maria; nevertheless, the statistical NW direction of individual classes of LWRs also proposes the presence of an appropriate stress field during the process of their formation.
1 Introduction
One of the most prevalent types of topographic highs on the Moon are lunar wrinkle ridges (LWRs), which range in shape from linear to sinuous. “Watters (1988) and Walsh et al. (2013),” which are generally unconnected, uneven, and braid or reconnect along strike. In the early 1890s, G. K. Gilbert was the first person to make the discovery of LWRs using telescopes that were based on Earth (Watters and Johnson, 2010). Watters and Konopliv (2001) explained the majority of the radial or concentric to the midpoints of mare basins (Robinson et al., 2010; Yue et al., 2017). However, some uncommon ridges are found in neighboring highland (Peeples et al., 1978; Bilotti and Suppe, 1999). Typical LWRs have an arc that slopes gently downward and a ridge that is sharper but more erratic (Price, 1996; Mangold et al., 2000). Secondary ridges, typically smaller than primary ridges, can sometimes be spotted on or near primary ridges (Watters, 1991; Mueller and Golombek, 2004). An apparent shift in slope separates the broad arch from the surrounding mare, and the superposed ridge is normally situated in the broad arch’s central region (Li et al., 2018). The height of the basal arch and the superposed ridge might differ by up to 300 m. Typically, the basal arch is 500 m in height and the superposed ridge is 200 m (Head, 1981; Watters and Konopliv, 2001). According to the topography and Apollo sounder radar data, there is a difference in elevation of 50–250 m between the surface of the mare on one side of the LWRs and the other side (Watters and Konopliv, 2001; Walsh et al., 2013; Peng et al., 2019). This difference is considered as proof of an underground fault and is used to figure out that a fault caused one side of the LWRs to get shorter. Besides the Moon, wrinkle ridges also appear on other terrestrial planets, especially on the plains units of Mercury (Watters and Konopliv, 2001; Walsh et al., 2013; Peng et al., 2019), Venus (Harmon et al., 1986; Peng et al., 2019), and Mars (Chicarro et al., 1985; Plescia and Golombek, 1986; Thomson et al., 2009), and are interpreted to occur on Earth (Watters, 1988). Most wrinkle ridges on different planets have common characteristics (Mbge and Reidel, 2001), suggesting that LWRs probably had similar formation mechanisms in different environments (Watters and Konopliv, 2001; Mueller and Golombek, 2004). In addition, LWRs have been compared with one another to learn more about how they form (Plescia and Golombek, 1986; Mbge and Reidel, 2001; Walsh et al., 2013).
Previous research discussed the origins of LWRs, with proposed techniques/models representing tectonic, volcanic and mixture of tectonic and volcanic process as formation mechanisms (Bilotti and Suppe, 1999; Montési and Zuber, 2003; Peng et al., 2019). It is now believed, however, that tectonic processes were the original source of LWRs. Lunar Sounder Experiment data from the Apollo 17 Command/Service Module has provided strong confirmation of this finding (Peeples et al., 1978; Phillips and Pappalardo, 2014), the research of potential terrestrial analogs (Watters, 1988), and recently, the interpretation of data from the Kaguya spacecraft’s Lunar Radar Sounder Experiment have all supported this conclusion (Schultz et al., 2010). Most researchers concluded that LWRs are caused by perpendicular shortening (Plescia and Golombek, 1986; Bilotti and Suppe, 1999; Montési and Zuber, 2003; Robinson et al., 2010).
However, there are still some disagreements about the foundation of wrinkle ridges, including the number of faults and explanations of the geometry (Chicarro et al., 1985; Watters, 1988), the complexity of faulting, and whether LWRs are an appearance of thin or thick-skinned distortion (Montési and Zuber, 2003; Smith et al., 2010), the sequence and importance of folds and faults (Klimczak et al., 2018), and, most importantly, the stress fields accountable for thrust faulting (Thomson et al., 2009). Different types of wrinkle ridges can appear and develop due to localized variations in formation processes and lithologies (Chicarro et al., 1985; Watters and Konopliv, 2001; Montési and Zuber, 2003). For instance, on Venus and Mars, LWRs are more prevalent in mare basalt than in wrinkle ridges, and many LWRs partially correspond with buried craters, suggesting a strong relationship between the ridges and the basalts (Montési and Zuber, 2003). Some previous experts (Peeples et al., 1978; Chin et al., 2007) have previously indicated the influence of mare basalts on the genesis of LWRs should be studied. One of the conclusions of Plescia and Golombek (1986) was that the material on which a wrinkle ridge forms need only be cohesive, it need not be basalt (e.g., terrestrial analogs in Australia and Algeria (Maxwell et al., 1975).
One efficient technique for obtaining a thorough knowledge of the genesis of LWRs is to map them all and do a geometric study of their properties, like the analyses of ridges by Robinson et al. (2010) for Mars and Smith et al. (2010) for Venus. Peeples et al. (1978) studied LWRs in multiple mare plains using Lunar Orbiter Mission IV images; Bilotti and Suppe. (1999) summarized the findings of LWRs in Mare Serenitatis using pan photographs and principally Apollo metric; and Walsh et al. (2013) plotted concentric LWRs in four Maria (Tranquillitatis, Imbrium, Serenitatis, and Crisum). Plescia and Golombek (1986) created 29 topographic outlines through 9 ridges in Serenitatis, Procellarum, and Imbrium, using topographic data from stereoscopic Apollo photographs and demonstrated a universal relationship between relief and ridge width, implying a range in ridge foundation between large and small ridges (Yue et al., 2017). In recent studies, Thomson et al. (2009) assessed 150 LWRs with the accurate length and features in all the Moon’s main mare basins.
Through the automated analysis and mapping of LWRs data from 70°N to 70°S and 140°E to 140°W (based on the identification and extraction of major and minor LWRs), we hope to gain a better understanding of wrinkle ridges. Statistics and measurements of the extracted wrinkle ridges, including orientation (i.e., shifted from the north), extent (i.e., area that each segment covers), length (i.e., length of the segments as a whole), height (i.e., from the top to the bottom of an area), and elevation offset (i.e., height from the top to the bottom of the area), were performed based on the mapping of lunar ridges (Figure 1). Each group of ridges was then subdivided into local distributions based on their orientation, distribution, and direction. Probable relationships between the parameters were analyzed, and the relationships were examined between the other tectonics and lunar wrinkle ridges.
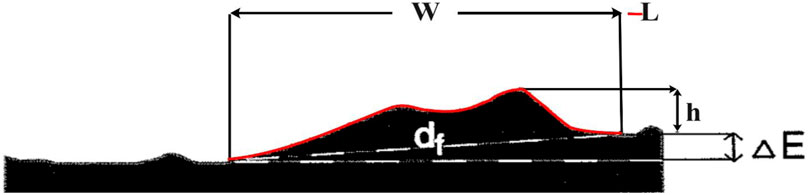
FIGURE 1. Schematic of a wrinkle ridge profile illustrating = W: width, L; Length, h; height, df; distance between the two endpoints of the ridge profile, ∆E: elevation offset.
2 Study area
In this study, we used area of lunar from 70°N–70°S and 140°E–140°W, because this area have many big and small types of isolated LWRs. According to Smith et al. (2010), LWRs (Figure 2) cover around 2.84% of the lunar surface area. Lunar wrinkle ridges, commonly observed in the lunar maria, serve as important indicators of the contraction and subsequent deformation of the mare infill. However, accurately determining the timing of wrinkle ridge formation poses a challenge. This is primarily due to their limited areal extent and the difficulty in discerning whether superposed craters were formed after ridge formation or uplifted by the deformation process (Plescia and Golombek, 1986). Despite these complexities, certain wrinkle ridges do provide valuable opportunities to establish a chronological framework. By carefully analyzing the characteristics of these specific ridges, researchers can gain insights into the sequence of events and contribute to our understanding of lunar geological processes.
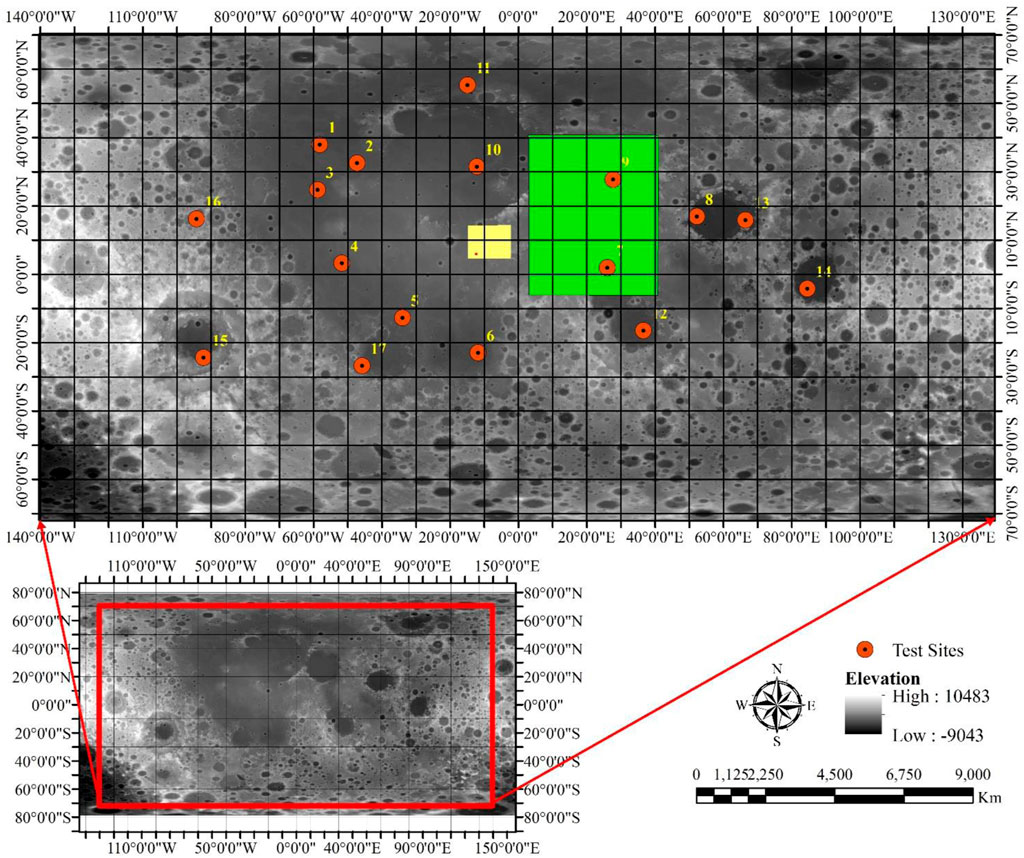
FIGURE 2. Location of the study area with seventeen test sites where background is a greyscale elevation map. There are three-color boxes in Figure 4. Yellow rectangular shape explains the area of Figure 5, green color of rectangular shape explains Figure 6 and purple rectangular box on yellow rectangular box explains the Figure 7.
3 Data sets
In this study, we used mosaic data of 100 m/pixel Wide range Angle Camera (WAC) and data of Lunar Orbiter Laser Altimeter (LOLA) from the LRO mission. In this study, LROC WAC and LOLA topographic mosaic images were obtained for the analysis. These mosaic images were used to identify positioning and mapping of LWRs, and the topographic data was utilized to determine the morphological properties of LWRs.
LRO is the first spacecraft in NASA’s Lunar Precursor Robotic Program launched on 18 June 2009 (Tran et al., 2010; Byrne et al., 2015). LROC was created with two measuring goals in mind: determining polar illumination and assessing landing sites in meters (Robinson et al., 2010). The three imaging subsystems on board LROC include a multispectral WAC, two narrow-angle cameras, and a wide-angle camera. In this study, LWRs were mapped using 100 m/pixel mosaic pictures compiled from more than 15,000 WAC images taken between 2009 and 2020. (https://astrogeology.usgs.gov/search/map/Moon/LRO/LROC_WAC/Lunar_LROC_WAC_GLD100_79s79n_118m_v1_1). The Integrated Software for Imagers and Spectrometers (ISIS) was used to convert the format. All these images were mosaic and extracted study area in ARC GIS 10.8. The high-resolution topography of the lunar surface may be accurately calculated using LOLA (Chin et al., 2007). The frequency of LOLA is 28 Hz, and its accuracy is 10 cm. A model of lunar orientation is used to identify the location of each laser point on the lunar surface after range calibration (Smith et al., 2010). One of the gridded data record products has a resolution of 1,024 pixels per degree, or about 30 m in diameter per degree of latitude at the equator, and is produced by further processing of the raw data: (http://geo.pds.nasa.gov/missions/lro/lola.htm). In this investigation, researchers downloaded global data from 126 files and imported it into ArcGIS following format conversion.
4 Preprocessing and methodology
First of all, we mosaicked all the data in the ENVI 5.4, LWRs were extracted using geographic segmentation method and then taken out from the LROC-WAC imagery. With the help of ArcGIS 10.8, we were able to automatically calculate morphological features such as the size, shape, elevation offset, and extracted ridge orientation of wrinkles.
4.1 Automated detection of lunar ridges
Slope can be used to automatically extract ridges because it reflects the gradient fluctuations of the LWRs and some ridges have low contrast, making them difficult to extract from photographs. This is a preliminary investigation on the use of DEM data for automated ridge detection. Generate a slope map, handle phase symmetry, perform a morphological operation, and filter out any background noise using the used systematic technique. First, the slope map is generated and converted to grayscale image for post processing. Slope quantifies the steepest possible rate of variation in pixel values relative to their neighbors (Figure 3).
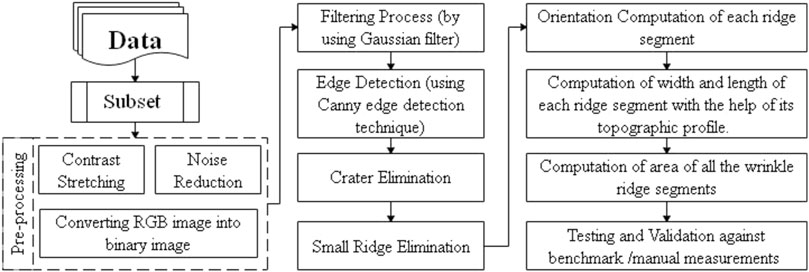
FIGURE 3. Methodology of the proposed automatic ridge detection and morphometric parameters evaluation in lunar images.
The sharpest slope away from a pixel is determined by finding the largest elevation difference between it and its nearest eight neighbors. Slope is calculated as the difference between the center pixel’s horizontal and vertical rate of change. The slope is calculated using Eq. 1:
While S is the degree of incline, p the horizontal rate of change in altitude, and q the vertical rate of change in altitude. The filter wavelength and filter scales parameters are then used to determine the phase symmetry of the slope map, which divides the space into symmetric areas. The potential ridges are then narrowed down by using a regional criterion. Those who score below the cutoff are deemed ineligible to continue. Additionally, the images go through a slew of morphological procedures including close, open, and edge connecting. After applying a threshold, the location of the major ridge can be established. We put our methodology to the test in 17 separate sections of this study. In Figure 2 we see the breakdown of the various testing locations. In Figure 4A, we see a mosaic image and digital elevation model (DEM) of one of the experimental sites. Using the geographic coordinates obtained from the DEM, the automatically detected region (red line) on the LROC-WAC image is displayed in Figure 4B. The sites of the tests are shown by the red dots. Most of the test sites belongs to the major LWRs and highlands area. Lunar maria, which are likely to have ridges, serve as the experimental DEM areas of choice. Automatic digitization of LROC-WAC and LOLA images provides the reference data needed to evaluate detection accuracy.
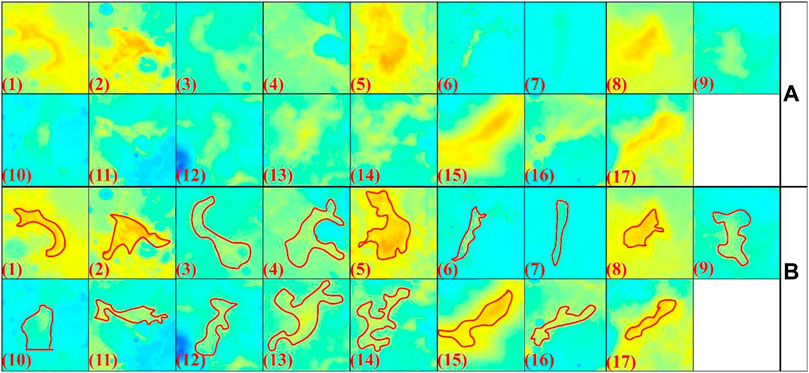
FIGURE 4. (A) The mosaic images of lunar ridges at test sites, (B) Ridge detection results at test sites.
4.2 Identification of wrinkle ridges
The physical properties of LWRs may be identified, particularly the evident shift in slope compared to the nearby mare and their asymmetric progressive relief (Mueller and Golombek, 2004). However, they must be distinguished from lunar lobate scarps (Bilotti and Suppe, 1999; Peng et al., 2019), which are comparatively basic structures with sharp scarp faces and slightly oblique rear scarps. Furthermore, the uneven morphologies of LWRs contribute to the difficulty of defining them. A schematic image was employed to characterize LWR segments in this study, requiring that individual segments have at least identical strike and breadth. Another essential requirement was that the inclusion of the accompanying LWRs be visible on the long side of a circle, with the strike being as consistent as possible along the ridge.
Figure 5A depicts a LWRs retrieved as 23 segments based on the above-mentioned principles (Figure 5B). Figure 5C is an expanded version of Figure 5B that depicts a single ridge separated into segments based on the width variation along its strike. Figure 5D depicts an alternative scenario in which the ridge’s strike abruptly changes, resulting in ridge segmentation.
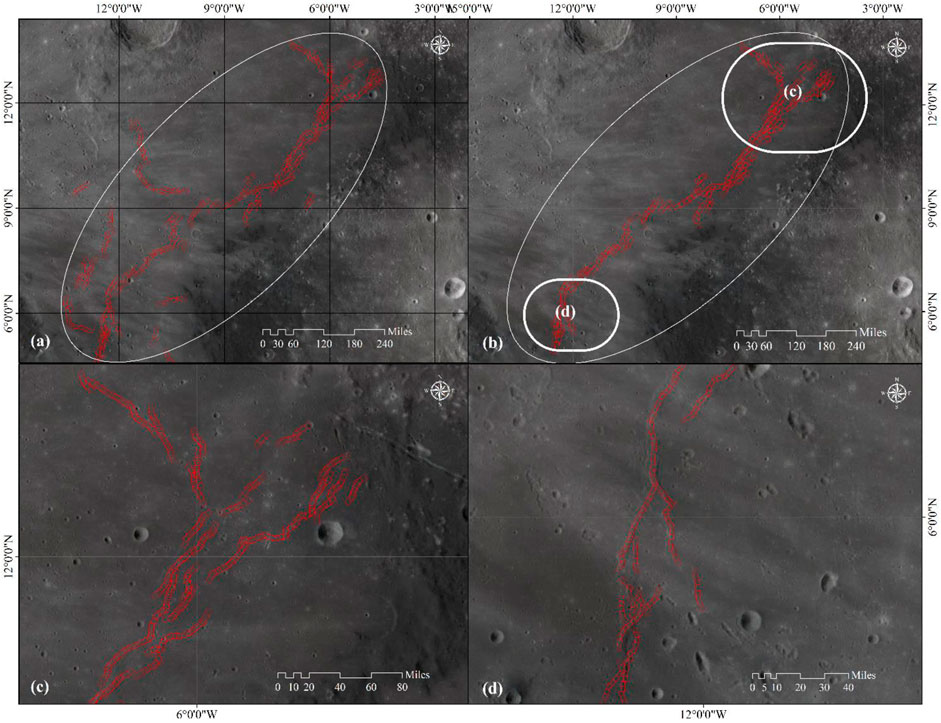
FIGURE 5. All images in the cylindrical projection of an extracted wrinkle ridge. (A) An example of a wrinkle ridge from the LROC WAC mosaic; (B) The extracted wrinkle ridge composed of 23 segments. (C) An enlarged portion of Figure 4B (the upper circle denoted by letter c) demonstrating how one ridge is divided into segments because of the variation of the width of the ridge along its strike, which is indicated by the arrow directions. (D) An enlarged portion of Figure 4B (the bottom circle denoted by letter d) indicates a situation in which the strike of the ridge changes, also leading to ridge segmentation.
The features of LWRs were investigated by categorizing the retrieved segments based on geographical clustering and distribution. In the first group, we have ridge segments that form a concentric ridge seen in big basins or maria with a defined elliptical or circular perimeter and ridge segments that are centered around the midpoint. Another type, dubbed parallel ridge, has ridges that are likewise concentrated in lunar maria but typically have a regional orientation instead of a concentric one. We identified the isolated LWRs, which were classified as a third class. However, basalt plains rarely have a clean edge, and the ridge pieces may continue into the surrounding mountains. Most lone ridges can be found in basalt plains as well. According to their geographical position, each class of LWRs was further subdivided into several groups to investigate the regional peculiarities of the LWRs. Figure 6A depicts a section of a concentric ridge segment in the Mare Serenitatis and Mare Tranquillitatis region. With a few notable exceptions in the outer ring, these are all concentric. Figure 6B is an instance of the similar ridge segments in Northwestern Oceanus Procellarum; most of these segments are oriented toward the northwest. Figure 6C shows a series of LWRs dispersed over the landscape, with a few parts extending into the surrounding highlands.
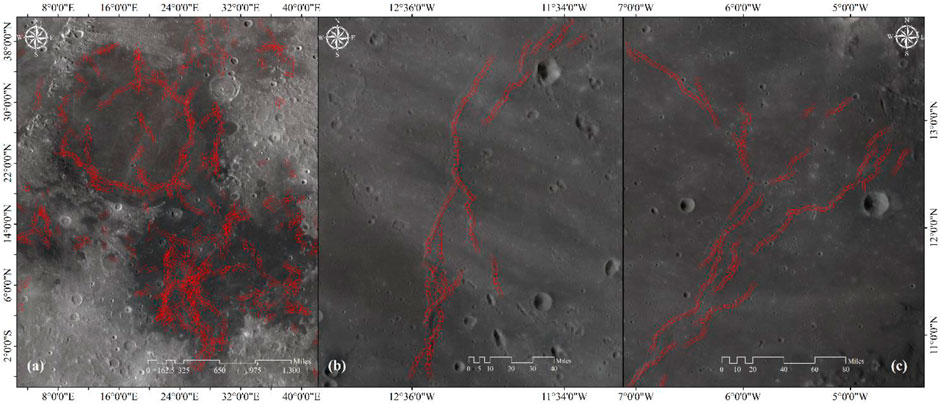
FIGURE 6. The equidistant cylindrical projection was used to classify and organize the wrinkle ridges retrieved from the LROC WAC mosaic. (A) An example of the concentric ridges in Mare Serenitatis and Mare Tranquilitatis; they are composed of 449 segments (B) A single group of parallel wrinkle ridges (C) Depicted by isolated wrinkle ridges.
4.3 Identification and measurement of concentric, parallel and isolated rides
The extracted LWR segments are used to measure some metrics, while others were developed in conjunction with the conventional grid-based topographic data. The map view parameters are classified into two categories: first, the length and width parameters, and second, the area and orientation parameters. Topographic parameters such as elevation offset, and height are included in the latter category. Using the ArcGIS 10.8 platform, we constructed a geographic information system tool to compute the parameters listed above automatically. The area of the rectangle that corresponds to a segment is its planar area. First, a local coordinate system is built with the top segment pointing to north by extracting the central line of the rectangle perpendicular to the longer edge. This allows us to determine the orientation of each segment (Figure 7A). The angle between the upper portion of the center line and the north line indicates the orientation, which can be anywhere from 90°W to 90°E (where west is a negative number and north is zero). Using spherical coordinate systems, the estimate is unaffected by projections. During the process of extraction, the longest edge that is perpendicular to the primary direction of the segment was chosen. Because of the way the orientation is calculated above, the resulting orientation will never be perpendicular to the segment’s true strike. The estimated orientation is parallel to the segment’s primary direction because the longer edge was chosen on purpose. Figure 7B shows a visualization of the discovered segments superimposed on LOLA data. To account for the likelihood that some tiny craters (the red circle in Figure 7) occur within the rectangles that show the segments of wrinkle ridges, we first eliminated the craters and then masked the topographic data included within them. The difference in elevation between the rectangle’s highest and lowest points is the height of the segments. The steps involved in determining the elevation offset are depicted in Figure 7B. As shown in Figure 7B, the portion of the ridge segment known as the crest is removed and connected to represent it. The two halves are then recognized, and the height difference between them is computed as a segment’s elevation offset. When using a georeferenced system, it doesn't matter whether the wrinkle ridges on the Moon are at the poles or the equator; the properties will be the same in both cases.
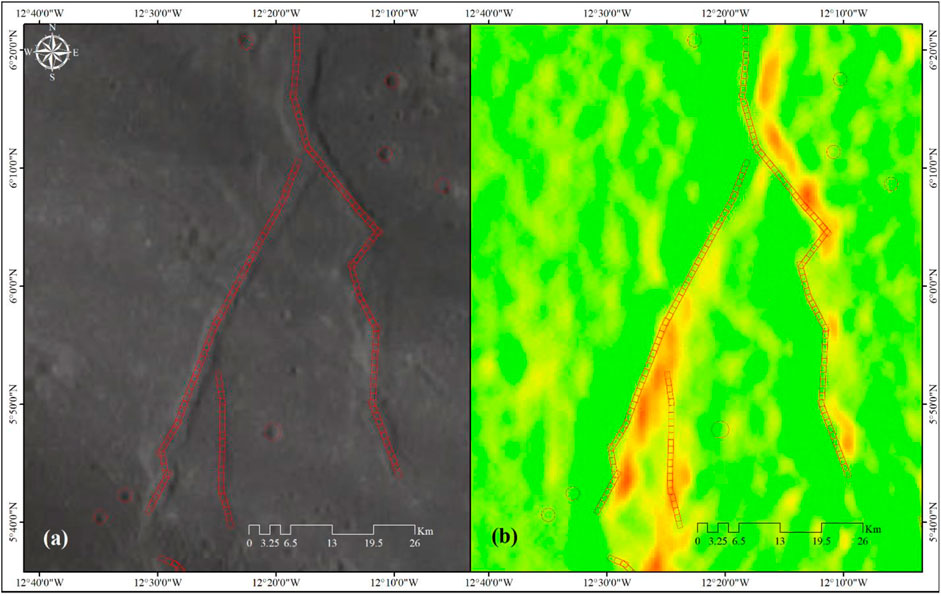
FIGURE 7. An example of showing the elevation offset and orientation of wrinkle ridge segments. (A) The process for computing positioning. (B) The process to calculate the elevation offset by overlaying the identified wrinkle ridge segments on the LOLA data.
To acquire the statistics of the wrinkle ridges features, it was necessary to weight each segment according to its length to avoid the influence of the segment’s variable sizes. The mean width and distribution of ridge widths are calculated by considering the length of a segment. Smaller sections can be cut from a bigger one, but accuracy is best attained if the pieces are all roughly the same size. The majority of the statistics, such as the average height, breadth, and elevation offset, and the correlations between these constraints, are computed using the fictitious segments. This method is useful since it can rationally evaluate the segments after assigning them proper weights.
5 Results
5.1 Maps of wrinkle ridge distribution
The study found 3,375 wrinkle ridge segments with a total length of 26,455.01 km using the LROC WAC mosaic data. After weighting by the shortest segment with a length of 0.21 km, it helped to recognize 145,341 segments. Furthermore, the 12,928 small/tiny craters were extracted to correct LWRs height estimation errors during the modeling process. LWRs are most commonly found in the maria, with a few extending into neighboring highlands and mountains. After adjusting for segment length, the mean elevation offset, height, width, and orientation of all wrinkle ridges are 40.39 m, 3.47 km, 0.29 km and −1.68°, respectively. The extracted LWRs are presented in Figure 8.
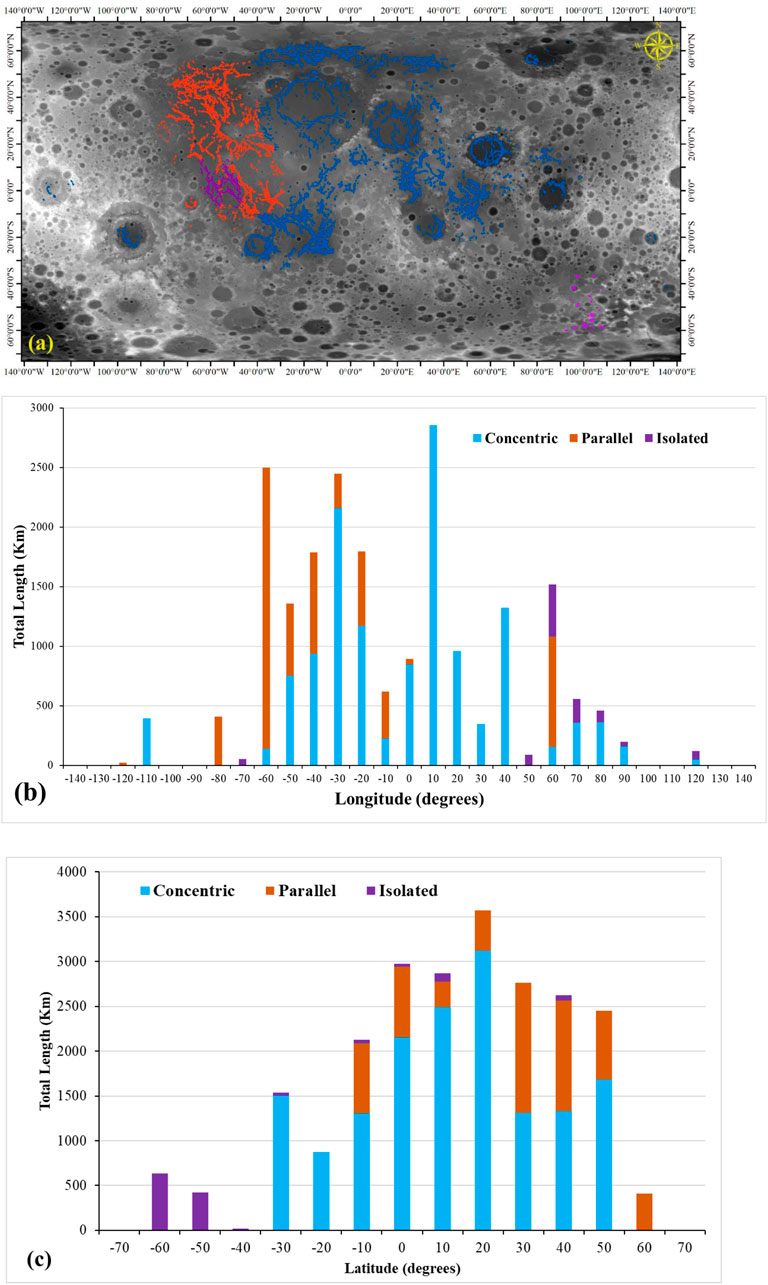
FIGURE 8. (A) The extracted segments of parallel, concentric, and isolated ridges within the study area; (B) the longitudinal distribution of the extracted LWRs; and (C) the latitudinal distribution of the extracted LWRs.
Figure 8A shows a color-coded map of the three LWRs classes: isolated (gray), parallel (orange), and concentric (blue) that are further subdivided into 42 wrinkle ridge groups on the lunar surface. Oceanus Procellarum and its neighboring Mare Imbrium have an extensive network of LWRs. Oceanus Procellarum’s northwest has the densest network, with 695 segments totaling 4560.22 km in length.
The distribution of LWR classes is depicted in Figures 8B, C. Even though both parallel ridges and concentric ridges are found around a similar latitude area, the parallel ridges are found further west than the concentric ridges. Isolated ridges may be found across the lunar surface, although most of them cluster around 10°N–50°N. Major LWRs are located in the lunar highlands and lowlands around the equator, as shown in Figures 8B, C, and statistical data show that 2,540 ridge segments, between 90° and 80° West and 70° and 60° North, the vast majority of ridges are found, somewhere around 94%. However, there is a significant asymmetry in the spreading of lunar ridges in the southern and northern hemispheres. The northern hemisphere accounts to around 75% of the overall length of the lunar ridges. Moreover, Figure 9 lists the width (9a), height (9b), and elevation offset (9c).
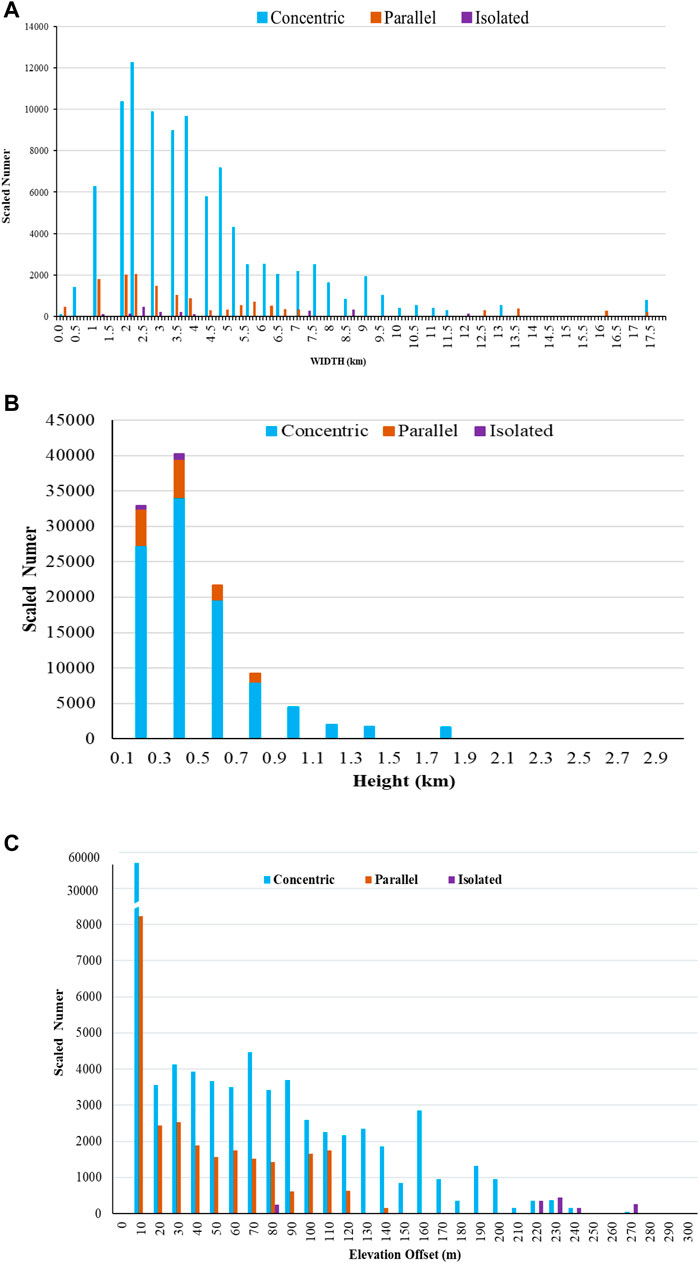
FIGURE 9. Frequency distribution of extracted LWRs (A) width, (B) height, and (C) elevation offset.
Figures 9A, B indicate the frequency distribution after weighting the length, height and width of each class of ridges segment. Parallel and concentric ridges have the same scattering of the following morphological features, despite having substantially more concentric ridge segments than parallel segments in their normalized numbers. Both parallel and concentric ridges have widths and heights of 0.3–3.0 km and 0.1–2.0 km, respectively. Parallel ridges and concentric ridges have a much more evenly distributed height and width than isolated ridges.
In this study, the highest value of elevation offset is up to 600 m; thus, after weighting by the shortest ridge, more than 95% of the elevation offsets are less than 250 m. As a result, the maximum value for the elevation offsets result of ridges in Figure 9C has been adjusted at 250 m to provide a clear presentation of the data. After weighting by length, more than 55% of the ridges in all three classes have an elevation offset of less than 8 m, indicating that the elevations on the two sides of ridges are essentially identical. The elevation offset is similarly concentrated when looking at various ridges; with most being less than 8 m, but isolated ridges have a much more scattered pattern than parallel and concentric ridges. The statistics of the weighted morphological parameters, as calculated by the weighted morphological parameters, are shown in Table 1. All type of wrinkle ridges (such as concentric, parallel and isolated) are shown in Figure 10.
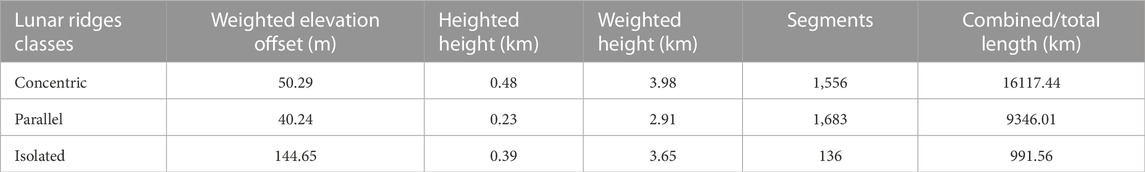
TABLE 1. Statistical results of morphological characteristics of individually class of LWRs in this study.
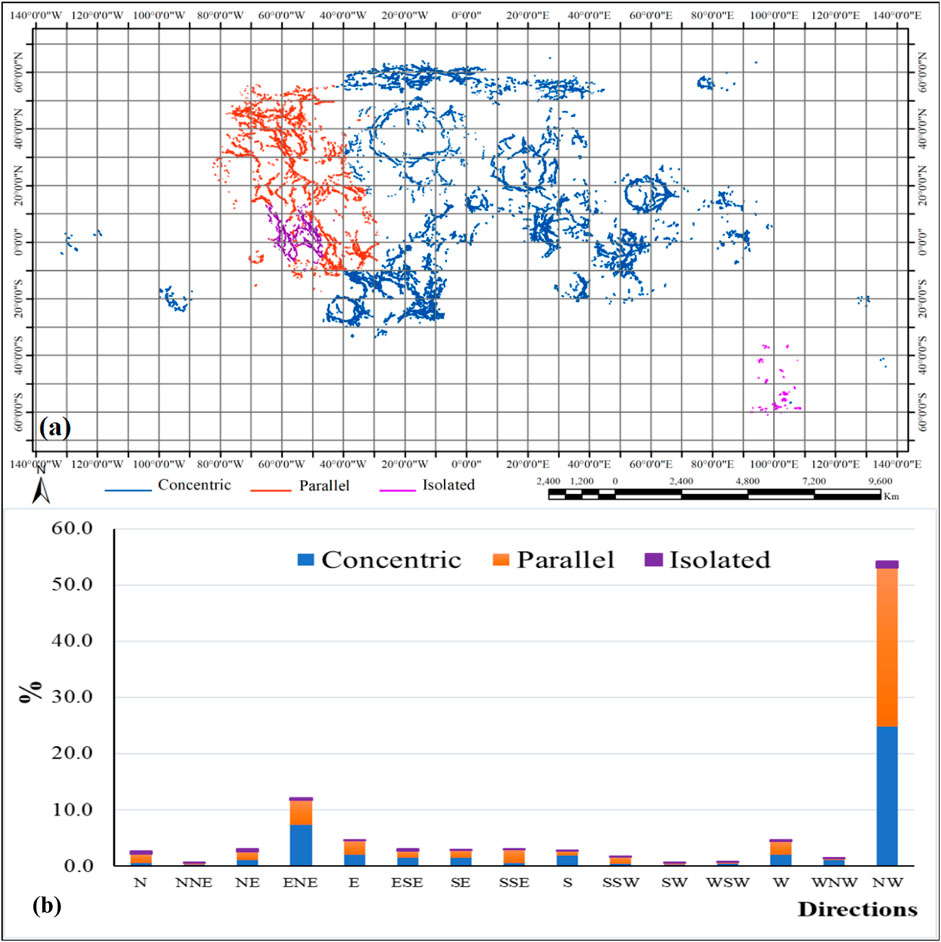
FIGURE 10. (A) The lunar surface has been split into 10° × 10° boxes into longitudinal and latitudinal dimensions, and (B) the bar graph shows the orientation of LWRs.
Figure 10 depicts the orientations of all the wrinkle ridges after each segment has been weighted according to its length. The majority of ridges have a northeast or northwest direction, with the majority at 45°W to 50°E and 30°S to 50°N. The orientation distribution, on the other hand, has no discernible geographical pattern, which is most likely due to their complex production procedure. As shown in Figure 10, the weighted of the wrinkle ridge orientations indicate how each segment’s length impacts the final result.
5.2 Concentric ridges
In this study, we used 1,556 segments and extracted fifteen groups of concentric ridges (Table 2). About 60% of the overall length of all ridges on the Moon is made up of the concentric ridges, which stretch for a total of 16119.35 km. Based on the weighted average of the length of each segment’s ridges, the mean elevation offset height, and width are 50.29 m, 0.48 km, and 3.98 km, respectively (Table 1). For example, Mare Imbrium has maximum 379 wrinkle ridges segments (the central location is at 17.23°W, 42.32°N), while Mare Undarum is very small, length 33.45 km and have 5 wrinkle ridges segments (67.23°E, 5.28°N). Each cluster of wrinkle ridges is shown in Table 2 with its corresponding set of characteristics.
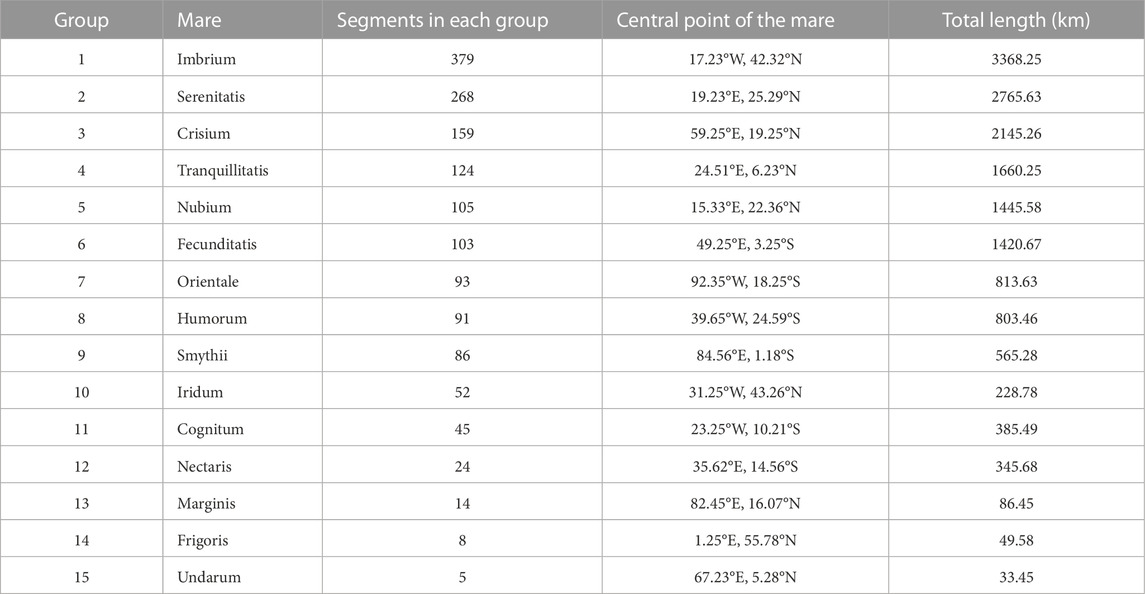
TABLE 2. The characteristics of Concentric LWRs.
5.3 Parallel ridges
The parallel wrinkle ridges are divided into four groups by the northern and western edges of the Oceanus Procellarum. Table 3 shows that there are 1683 LWR segments across all groupings. Each set of parallel ridges consists of 721segments (54.29°W, 39.25°N with 4627.13 km), while smaller groups have 164 segments (11.23°W, 56.25°N) with length 843.29 km. A total of 9346.01 km, or around 32.23% of the total length of all lunar ridges, are thought to equal the length of the corresponding ridges on Earth (Bilotti and Suppe, 1999). After weighting by segment length, the average elevation offset, height, and width of the parallel ridges are 40.24 m, 0.23 km, and 2.91 km, respectively (Table 1). The qualities associated with each set of parallel wrinkle ridges are listed in Table 3. Figure 10A shows that most of the parallel lunar wrinkle ridges exist at 90°W to 30°E and 30°S to 60°N. Figure 10B depict most of the parallel ridges found in the NW and NEE. There are four distinct groupings, the locations of which may be seen in Table 3.
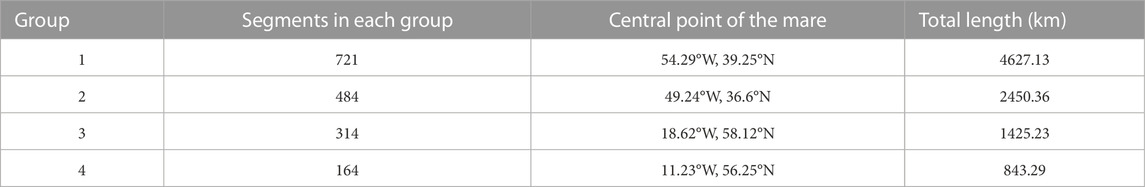
TABLE 3. The properties of Parallel LWRs.
5.4 Isolated ridges
In this study we identified 136 isolated ridge segments with 23 classified groups (Table 4). Supplementary Figure S1A shows an example of a group of isolated ridges that are restricted to an area inside of a crater filled with basalt lavas as are the majority of isolated ridges seen on basalt plains. In addition to the 12 segments that extend to neighboring highlands, the global investigation also includes scarps that extend into the surrounding area (Figure 6C) (Supplementary Figure S1B). It’s not uncommon for isolated ridges to be larger than the other two types of LWRs (see elevation offsets in Table 1). All the individual ridges add up to a total of 991.58 km in length. This total length accounts for approximately 3.5% of the Moon’s overall ridge length. The mean elevation offset, height, and width are 144.65 m, 0.39 km, and 3.65 m, respectively, after adjusting for the length of each segment (see Table 1). In most cases, each group has a preferred orientation in various locations (Figure 10B); however, there is no discernible general trend for isolated ridges. Table 4 lists the characteristics of each set of isolated ridges. Figure 10A illustrate the lunar surface’s isolated wrinkle ridges. Twenty-three isolated -ridge groupings have been found, and the locations of these ridges are shown in Table 4.

TABLE 4. The properties of isolated LWRs.
5.5 Validation of test sites
Additional to the quantitative evaluation, a ground truth was established via manual inspection of each test location. To measure how well our method works, we calculate the detection percentage, D, as follows: D = 100true positive detections/(FP + FN), where TP is the number of true positive detections, FP is the number of false positive detections, and FN is the number of false negative detections (Swets, 1988; Kovesi, 1997). The detection performance can be quantified via the parameter D (higher values are better). The quality factors are computed by counting the number of ridges that were detected and comparing them to the number of ridges that were manually drawn. The evaluation criteria are calculated by adhering to these guidelines: True positive detections (TP) are those in which the detected pixels coincide with the manually delineated ones; false positive detections (FP) are those in which the detected pixels do not coincide with the manually delineated ones; and false negative detections (FN) are those in which the manually delineated ridges are not covered by detection results. The test sites’ performance quality factors are listed in the table below. Table 5 shows that whenever the detection percentage is greater than 79%, our approach successfully detects ridges. Due to the larger surface area covered by the ridges, Site 7 has the highest detection percentage. Since there are several ridges in the vicinity of Site 12, its detection rate is the lowest. Both the ridge’s shape and the complexity of the background have an impact on the detection performance. Eroded ridges that don’t stand out too much from their surroundings are often overlooked. Because the size parameter for the structural element in near transformation is kept minimal to minimize false positive detection, some large ridges slip through the cracks as well. Most ridges are detected accurately throughout all twelve test locations, and false positives are kept to a minimum. The approach might, in theory, be used for detecting any kind of linear target.
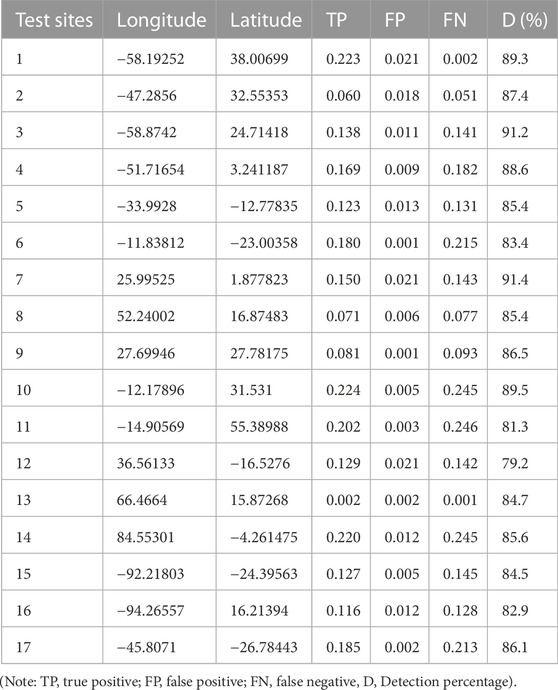
TABLE 5. LWRs detection quality factors.
6 Discussion and consequences
Assessments of the distribution and features of LWRs are essential for determining the process of their development on Moon, for the same reasons that Watters. (1991) studied Mars’ ridges and Price (1996) studied Venus’ ridges. It is the fact that LWRs were discovered on the Moon as the first terrestrial body (Watters et al., 2010), and lunar ridges have been comprehensively mapped across the entire planet to our knowledge.
Walter. (2004) analyzed the lunar ridges in the Mare Imbrium, Mare Cognitum, Mare Serenitatis regions and Oceanus Procellarum using images from the panoramic cameras and Apollo metric of the 33 ridges sampled, it measured an average width and height of 1.9 km and 160 m for the first-order ridges respectively. Plescia and Golombek. (1986) created 31 topographic profiles spanning eight ridges from stereoscopic Apollo photos of the Maria Serenitatis Imbrium, and Oceanus Procellarum and calculated the mean width (4.8–33.9 km), height (140–360 m), and elevation offset (28–240 m) for various locations. Robinson et al. (2010) used Lunar Topographic Orthophoto maps to calculate the height of 12 wrinkle ridge segments and discovered that the average height was around 253 m.
A study employing LROC WAC mosaicked images and LOLA data. Walsh et al. (2013) assessed the height of 150 LWRs in the Mare Oceanus Procellarum, Mare Crisium, Mare Serenitatis, and Mare Frigoris as well as the Mare Imbrium, and displayed that the height of LWRs ranges from 33 to 590 m, with an average height of 187 m. According to our findings, the mean elevation offset, height and width are 50.29 m, 0.48 km, and 3.98 km, respectively (Table 1). These values are similar to those reported previously, even though previous studies relied on different data sets (Plescia and Golombek, 1986; Mbge and Reidel, 2001; Montési and Zuber, 2003) or only a subset of the same data sets.
The orientation of the ridges is an important factor while investigating LWRs. Regional analyses of the Mare Serenitatis, Mare Tranquillitatis, Mare Crisum, and Mare Imbrium have already been conducted in the previous year’s Plescia and Golombek. (1986). Figure 8 depicts bar graphs for LWR, grouped from our data. If the LWRs were compressional structures, as previously stated, according to probability, an east-west axis should be the dominant stress direction in the stress field. When the length of each segment is taken into account, Figure 11 displays the width vs. elevation offset and width versus height plots for all wrinkle ridges. As shown in Figure 11, for all classes of the LWRs, there are generally linear relationships between the two sets of parameters that may be found. The width to height ratio ranges from 0.05 to 0.16, with a mean value of 0.09, suggesting that ridge height rises with increasing ridge width. The elevation offset to width ratio, on the other hand, spans from 0.008 to 0.04 with a mean of about 0.03, showing that the elevation offset appears to be less dependent on width. Furthermore, lunar ridges’ width and height relationships usually have significantly higher correlation coefficients than the elevation offset and width relationships, with the height and width of isolated ridges having the highest correlation coefficient of 0.89. Concentric ridges are similar in size and shape, and the positive ratios and stronger correlations between their height and width could indicate ridge production continuity between large and small ridges. According to Bilotti and Suppe (1999) and Watters and Konopliv (2001) for any type of lunar ridge, the width-to-elevation offset correlation coefficient is small. This, together with the smaller ratios between elevation offset, may imply that the regional slope and short-wavelength topography are the most likely sources of lunar ridge elevation offset.
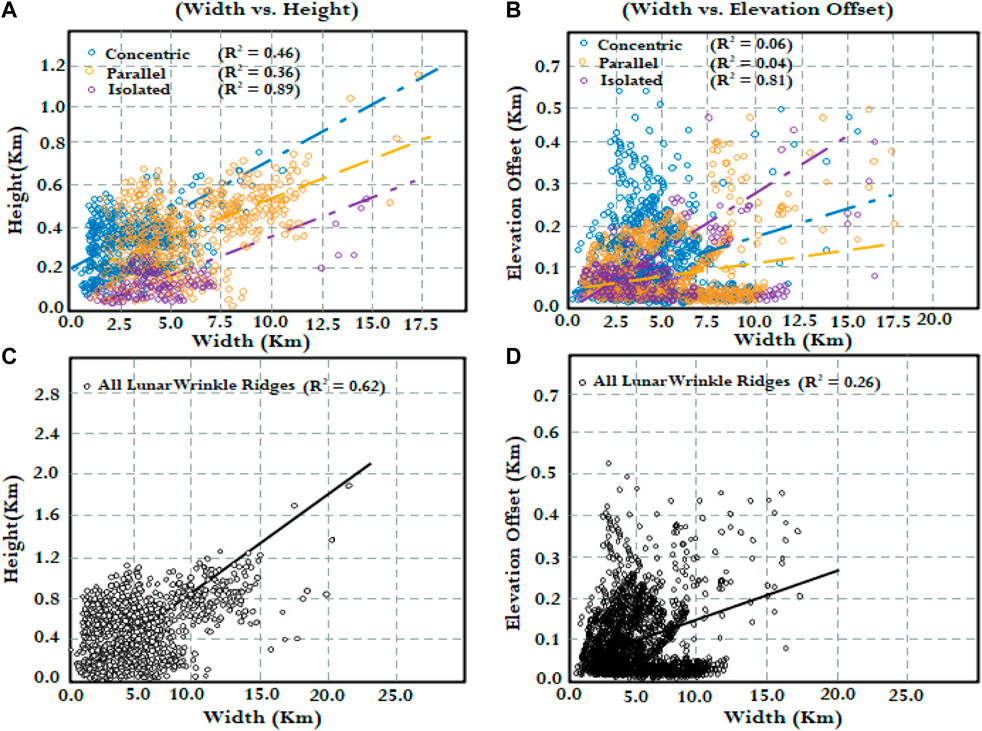
FIGURE 11. (A) width vs. height combination of three major groups of LWRs, (B) width vs. elevation offset combination of three major groups of LWRs, (C) All LWRs with width vs. height (D) All LWRs with width vs. elevation offset. Consider that the number of segments has been weighted following its size.
Previous scholars have also analyzed the link between the height and width of the lunar ridges to understand them better. According to Watters and Konopliv (2001), a linear correlation coefficient of 0.73 was found among 31 lunar maria ridge topography profiles. As a result of using different data sets, the correlations in our study (0.59) are lower for concentric ridges in all lunar maria, compared to their results. Continuity in ridge creation should be suggested by the linear relationships among small and large ridges as described earlier. Local influences can alter the detailed morphologies of lunar ridges, as evidenced by the lower correlation coefficients in global study compared to regional survey. This global study finds a very different link between elevation offset and lunar ridge width than a previous regional examination by Montési and Zuber. (2003).
This research indicates that there is only a weak link (about 0.06) between the elevation offset and breadth of concentric lunar ridges. Therefore, it is not enough to simply attribute the disagreement to a lack of consistency between the data sets, and contrary to expectations, the elevation offset does not appear to be influenced by the size of the lunar ridges. As a result, as we have stated the elevation offset is most likely unrelated to the construction of lunar ridges during the process of their formation. Bilotti and Suppe. (1999) hypothesized that premare impacts caused LWRs; however, there are many cases where ridges on the Moon cannot be attributed to the mere presence of buried rings (Supplementary Figure S2).
According to DeHon et al. (1981), who derived the mare basalt thickness by measuring the exposed crater rim heights, the thickness of the mare basalt is compatible with later studies, although the range of results is far larger than that found in those later studies. Mare basalt thicknesses more than 500 m are generally consistent with concentric ridges, and parallel ridges can be seen in basalt thicknesses of less than 250 m, but they do not necessarily intersect the isopach. Differences in the significant stresses in orientations that produced the creation of the wrinkle ridges in each class are most likely what separated the two groups of wrinkle ridges.
7 Conclusion and future directions
In this research, based on phase symmetry processing and mathematical morphological approaches, we provided an automated method for detecting LWRs from DEM data. In addition, a number of morphological operators, such as area opening and closure, are incorporated into the technique. The automated technique shows promising performance, with accuracy rates between 79% and 91%, as demonstrated by experiments conducted at seventeen sites. Moreover, lunar ridges were discovered and mapped from 70°N to 70°S and 140°E to 140°W in this study; a total of 3,375 segments or ridges with an overall length of 26,455.01 km were discovered. The ridges were divided into three groups based on their form and distribution: concentric, parallel, and isolated. Each group of ridges was then subdivided into local distributions based on their orientation, distribution, and direction. We also assessed morphological characteristics such as width, orientation, length, and elevation offset, determined for each wrinkle ridge map. According to the findings, 3,375 segments with a total length of 26455.01 km were identified, and the average values of elevation offset, width, and height of all the LWRs were 40.39 m, 3.47 km, and 0.29 km, respectively, after weighting by length. LWRs were divided into three classes according to their morphologies and distributions: parallel ridges, isolated ridges, and concentric ridges. Additionally, to investigate the likely creation process of lunar ridges, it was important to look at how the different types of morphological criteria relate to the tectonics of the Moon’s ridges. Creating global geologic information such as basin age maps, tectonic characteristics, and volcanic features assists in connecting case studies to create a comprehensive geologic history of the Moon. Thus, simultaneous gravity highs, LWRs, and extensional grabens that are concentrically orientated should be present in ideal instances. The availability of these datasets will assist in gaining a better understanding of the lunar stress field and geologic history.
Data availability statement
The original contributions presented in the study are included in the article/Supplementary Material, further inquiries can be directed to the corresponding author.
Author contributions
AT: methodology, software, formal analysis, visualization, data curation, writing—original draft, investigation, validation, writing—review and editing. JY: visualization, investigation, validation, writing—review and editing. QD: visualization, writing—review and editing. J-PB: investigation, validation, writing—review and editing. All authors contributed equally to this manuscript. All authors contributed to the article and approved the submitted version.
Funding
This research is supported by the National Scientific Foundation of China (42030110; 42241116); J-PB was funded by a DAR grant in planetology from the French Space Agency (CNES).
Acknowledgments
The authors appreciate the data supported from NASA lunar exploration missions. They provided the LOLA and LRO data.
Conflict of interest
The authors declare that the research was conducted in the absence of any commercial or financial relationships that could be construed as a potential conflict of interest.
Publisher’s note
All claims expressed in this article are solely those of the authors and do not necessarily represent those of their affiliated organizations, or those of the publisher, the editors and the reviewers. Any product that may be evaluated in this article, or claim that may be made by its manufacturer, is not guaranteed or endorsed by the publisher.
Supplementary material
The Supplementary Material for this article can be found online at: https://www.frontiersin.org/articles/10.3389/fspas.2023.1037395/full#supplementary-material
References
Bilotti, F., and Suppe, J. (1999). The global distribution of wrinkle ridges on Venus. Icarus 139, 137–157. doi:10.1006/icar.1999.6092
Byrne, P. K., Klimczak, C., McGovern, P. J., Mazarico, E., James, P. B., Neumann, G. A., et al. (2015). Deep-seated thrust faults bound the Mare Crisium lunar mascon. Earth Planet. Sci. Lett. 427, 183–190. doi:10.1016/j.epsl.2015.06.022
Chicarro, A. F., Schultz, P. H., and Masson, P. (1985). Global and regional ridge patterns on Mars. Icarus 63, 153–174. doi:10.1016/0019-1035(85)90025-9
Chin, G., Brylow, S., Foote, M., Garvin, J., Kasper, J., Keller, J., et al. (2007). Lunar reconnaissance orbiter overview: the instrument suite and mission. Space Sci. Rev. 129, 391–419. doi:10.1007/s11214-007-9153-y
DeHon, R. A., Scott, D. H., and Underwood, J. R. (1981). Geologic map of the kuiper quadrangle of Mercury. United States: USGS Astrogeology Science Center. doi:10.3133/i1233
Harmon, J. K., Campbell, D. B., Bindschadler, D. L., Head, J. W., and Shapiro, I. I. (1986). Radar altimetry of Mercury: A preliminary analysis. J. Geophys. Res. 91, 385–401. doi:10.1029/JB091iB01p00385
Klimczak, C., Crane, K. T., Habermann, M. A., and Byrne, P. K. (2018). The spatial distribution of Mercury’s pyroclastic activity and the relation to lithospheric weaknesses. Icarus 315, 115–123. doi:10.1016/j.icarus.2018.06.020
Kovesi, P. (1997). Symmetry and asymmetry from local phase. Tenth Aust. Jt. Converence Artif. Intell. 2, 4.
Li, B., Ling, Z., Zhang, J., Chen, J., Ni, Y., and Liu, C. (2018). Displacement-length ratios and contractional strains of lunar wrinkle ridges in Mare Serenitatis and Mare Tranquillitatis. J. Struct. Geol. 109, 27–37. doi:10.1016/j.jsg.2018.01.003
Mangold, N., Allemand, P., Thomas, P. G., and Vidal, G. (2000). Chronology of compressional deformation on Mars: evidence for a single and global origin. Planet. Space Sci. 48, 1201–1211. doi:10.1016/s0032-0633(00)00104-5
Maxwell, T. A., El-Baz, F., and Ward, S. H. (1975). Distribution, morphology, and origin of ridges and arches in mare serenitatis. Bull. Geol. Soc. Am. 86, 1273–1278. doi:10.1130/0016-7606(1975)86<1273:DMAOOR>2.0.CO;2
Mbge, D., and Reidel, P. (2001). A method for estimating 2D wrinkle ridge strain from application of fault displacement scaling to the Yakima folds, Washington. Geophys. Res. LETFERS 28, 3545–3548. doi:10.1029/2001gl012934
Montési, L. G. J., and Zuber, M. T. (2003). Spacing of faults at the scale of the lithosphere and localization instability: 2. Application to the central Indian basin. J. Geophys. Res. Solid Earth 108, 1–17. doi:10.1029/2002jb001924
Mueller, K., and Golombek, M. (2004). Compressional structures on Mars. Annu. Rev. Earth Planet. Sci. 32, 435–464. doi:10.1146/annurev.earth.32.101802.120553
Peeples, W. J., Sill, W. R., May, T. W., Ward, S. H., Phillips, R. J., Jordan, R. L., et al. (1978). Orbital radar evidence for lunar subsurface layering in Maria Serenitatis and Crisium. J. Geophys. Res. Solid Earth 83, 3459–3468. doi:10.1029/jb083ib07p03459
Peng, M., Wang, Y., Yue, Z., and Di, K. (2019). Automated detection of lunar ridges based on dem data. Int. Arch. Photogramm. Remote Sens. Spat. Inf. Sci. - ISPRS Arch. 42, 1431–1435. doi:10.5194/isprs-archives-XLII-2-W13-1431-2019
Phillips, C. B., and Pappalardo, R. T. (2014). Europa clipper mission concept: exploring jupiter’s ocean moon. Eos, Trans. Am. Geophys. Union 95, 165–167. doi:10.1002/2014EO200002
Plescia, J. B., and Golombek, M. P. (1986). Origin of planetary wrinkle ridges based on the study of terrestrial analogs. Bull. Geol. Soc. Am. 97, 1289–1299. doi:10.1130/0016-7606(1986)97<1289:oopwrb>2.0.co;2
Price, M. H., Watson, G., Suppe, J., and Brankman, C. (1996). Dating volcanism and rifting on Venus using impact crater densities. J. Geophys. Res. E Planets 101, 4657–4671. doi:10.1029/95JE03017
Robinson, M. S., Brylow, S. M., Tschimmel, M., Humm, D., Lawrence, S. J., Thomas, P. C., et al. (2010). Lunar reconnaissance orbiter camera (LROC) instrument overview. Space Sci. Rev. 150, 81–124. doi:10.1007/s11214-010-9634-2
Schultz, R. A., Hauber, E., Kattenhorn, S. A., Okubo, C. H., and Watters, T. R. (2010). Interpretation and analysis of planetary structures. J. Struct. Geol. 32, 855–875. doi:10.1016/j.jsg.2009.09.005
Smith, D. E., Zuber, M. T., Jackson, G. B., Cavanaugh, J. F., Neumann, G. A., Riris, H., et al. (2010). The lunar orbiter laser altimeter investigation on the lunar reconnaissance orbiter mission. Space Sci. Rev. 150, 209–241. doi:10.1007/s11214-009-9512-y
Swets, J. A. (1988). Measuring the accuracy of diagnostic systems author(s): john A. Swets source. Sci. (80-. ) 240, 1285–1293. doi:10.1126/science.3287615
Thomson, B. J., Grosfils, E. B., Bussey, D. B. J., and Spudis, P. D. (2009). A new technique for estimating the thickness of mare basalts in Imbrium Basin. Geophys. Res. Lett. 36, L12201–L12206. doi:10.1029/2009GL037600
Tran, T. N., Rosiek, M. R., Beyer, R. A., Mattson, S., Howington-Kraus, E., Robinson, M. S., et al. (2010). “Generating digital terrain models from LROC stereo images,” in Lunar planet. Sci. XLI (Berlin-Adlershof: Lunar and Planetary Institute).
Walsh, L. S., Watters, T. R., Banks, M. E., and Solomon, S. C. (2013). Wrinkle ridges on Mercury and the moon: A morphometric comparison of length–relief relations with implications for tectonic evolution. 44th Lunar Planet. Sci. Conf. 44, 2937. Available at: http://geol.umd.edu/∼lsschlei/LPSC/Walsh_LPSC_2013rr.pdf.
Walter, V. (2004). Object-based classification of remote sensing data for change detection. ISPRS J. Photogramm. Remote Sens. 58, 225–238. doi:10.1016/j.isprsjprs.2003.09.007
Watters, T. R., and Konopliv, A. S. (2001). The topography and gravity of mare serenitatis: implications for subsidence of the mare surface. Planet. Space Sci. 49, 743–748. doi:10.1016/S0032-0633(01)00007-1
Watters, T. R. (1991). Origin of periodically spaced wrinkle ridges on the Tharsis Plateau of Mars. J. Geophys. Res. 96, 15599–15616. doi:10.1029/91je01402
Watters, T. R., Robinson, M. S., Beyer, R. A., Banks, M. E., Bell, J. F., Pritchard, M. E., et al. (2010). Evidence of recent thrust faulting on the moon revealed by the lunar reconnaissance orbiter camera. Sci. 329, 936–940. doi:10.1126/science.1189590
Watters, T. R. (1988). Wrinkle Ridge assemblages. J. Geophys. Res. 93, 236–254. doi:10.1029/JB093iB09p10236
Keywords: lunar wrinkle ridges, morphologic characteristics, linear correlation, geomorphic phenomena, LROC-WAC
Citation: Tariq A, Yan J, Deng Q and Barriot J-P (2023) Analysis and mapping of lunar wrinkle ridges (LWRs) using automated LWRs detection process with LROC-WAC and LOLA data. Front. Astron. Space Sci. 10:1037395. doi: 10.3389/fspas.2023.1037395
Received: 05 September 2022; Accepted: 20 September 2023;
Published: 06 October 2023.
Edited by:
Changyi Xu, Chinese Academy of Sciences (CAS), ChinaReviewed by:
Ahsan Jamil, New Mexico State University, United StatesJavier Martin Torres, University of Aberdeen, United Kingdom
Zongyu Yue, Chinese Academy of Sciences (CAS), China
Copyright © 2023 Tariq, Yan, Deng and Barriot. This is an open-access article distributed under the terms of the Creative Commons Attribution License (CC BY). The use, distribution or reproduction in other forums is permitted, provided the original author(s) and the copyright owner(s) are credited and that the original publication in this journal is cited, in accordance with accepted academic practice. No use, distribution or reproduction is permitted which does not comply with these terms.
*Correspondence: Jianguo Yan, amd5YW5Ad2h1LmVkdS5jbg==