
95% of researchers rate our articles as excellent or good
Learn more about the work of our research integrity team to safeguard the quality of each article we publish.
Find out more
REVIEW article
Front. Astron. Space Sci. , 07 October 2022
Sec. Stellar and Solar Physics
Volume 9 - 2022 | https://doi.org/10.3389/fspas.2022.983707
This article is part of the Research Topic The Sun Seen with the Atacama Large mm and sub-mm Array (ALMA) - First Results View all 13 articles
This review comes at the time when ALMA successfully obtained the first regular observations of both a prominence and a filament. These observations have a spatial resolution of 1-2 arcsec, far better than previous prominence observations in the mm/sub-mm radio domain. The achieved resolution is compatible with the cotemporal ground-based coronagraphic observations in the hydrogen Hα line that accompany the ALMA Band 3 prominence observations. A core part of this review is the description and analysis of these pioneering ALMA observations of a quiescent prominence, focusing on various physical and geometrical properties of the observed prominence fine structures. We also summarize the basic physical processes behind the formation of mm/sub-mm continua under prominence conditions and describe the plasma diagnostics potential of ALMA solar observations. Finally, we discuss future prospects of ALMA prominence observations and the value of coordinated optical and UV spectra and images.
The Atacama Large Millimeter/submillimeter Array (ALMA) currently offers an unprecedented spatial resolution for solar observations in the radio domain. These ALMA capabilities will be further improved and exploited for the study of extended sources in the solar atmosphere including cool coronal structures like prominences. One of the primary interests of the solar physics community in ALMA observations is the ability to diagnose the kinetic temperature of the observed plasma from the measurements of the brightness temperature provided by ALMA. As is described, for example, in Wedemeyer et al. (2016), under specific conditions the plasma kinetic temperature can be directly derived from the measured brightness temperature. However, in the general case, the derivation of the kinetic temperature is not straightforward because the studied solar plasma is typically in the non-LTE state, i.e. departing from the Local Thermodynamic Equilibrium (Labrosse et al., 2010; Heinzel, 2015). This means that even though the free-free emission processes have a Planckian source function, the opacity depends on the ionisation state of the plasma which strongly departs from LTE and may be even time-dependent. In the special case of prominences, which we focus on here, there are not only observational difficulties related to ALMA observations performed above the solar limb but also increased non-LTE effects due to the critical importance of the spectral line scattering in optical and ultraviolet (UV) domains. The latter affects the ionisation in the multilevel hydrogen which in the case of prominences is dominated by Lyman and Balmer continuum photoionisation. However, the free-free opacity, which is proportional to the emission measure (see below), can be independently derived from the hydrogen Hα line intensity obtained simultaneously with the ALMA observations in a single band, or from spectral radio measurements themselves once ALMA will be able to provide near-simultaneous observations in more than one band.
Thanks to the advent of specific ALMA observations of prominences and filaments, we can review here not only the procedures leading to ALMA prominence observations and the diagnostic potential of ALMA data, but also the results of the first analyses of a quiescent prominence (Heinzel et al., 2022; Labrosse et al., 2022) and filament (da Silva Santos et al., 2022) observations. The first prominence observations were obtained only in Band 3 but, thanks to a dedicated coordinated observing campaign, are accompanied by Hα and Mg II h&k spectra. The first observations of an (active region) filament were also obtained in a single ALMA band (Band 6), accompanied by simultaneous Mg II h&k spectral observations. In the frame of this review, we address in detail the difficulties encountered in the ALMA observations of prominences and discuss various aspects of ALMA data interpretation. Of particular interest is the development of relevant multi-spectral inversion techniques.
The paper is organized as follows. In Section 2, we present a historical overview of prominence observations in mm/sub-mm domain. In Section 3 we provide a brief description of ALMA with the emphasis on solar observations. Section 4 describes the formation mechanisms of the ALMA continua under the conditions of solar prominences. The issues of the visibility of quiescent prominences in the ALMA bands are addressed in Section 5. Section 6 is devoted to a thorough discussion of the plasma diagnostic capabilities of ALMA. In Section 7 we present the set-up of the current ALMA prominence observations, together with a discussion of the complexity of the data reduction of ALMA off-limb observations and the results of the analysis of these first ALMA prominence observations. Our conclusions and the future prospects of ALMA prominence observations are addressed in Section 8.
Up to now, observations of prominences and filaments in the mm-continuum have been limited by low spatial resolution, making it difficult to accurately infer their temperatures or densities due to constrained information about the size of the observed structures and the filling factor (Heinzel et al., 2015; Rodger, 2019). Depending on the exact wavelength, filaments were found to be generally nearly invisible or slightly dark against the disk at 1.3 mm while becoming much darker at 3 mm (Hiei et al., 1986; Lindsey et al., 1992). Vrsnak et al. (1992) analysed maps of the solar disk at wavelengths between 4 and 26 mm using a beam size of 2.4 arcmin (at λ = 8 mm). They looked for correlations between low temperature regions and various structures including disk filaments. They did not find an obvious relationship, as many filaments did not present a discernable reduction in the mm-continuum temperature maps. Bastian et al. (1993) conducted a study of prominences using the Caltech submillimeter observatory. The resolution was between 20 and 30 arcsec for observations at 0.85 and 1.25 mm. They concluded that filaments and prominences were optically thin at 0.85 mm. Hα filaments were found to have a brightness temperature comparable to or below that of the disk centre. Harrison et al. (1993) caught a large erupting prominence with the James Clerk Maxwell Telescope on Mauna Kea, Hawaii, at the wavelength of 1.3 mm during the total solar eclipse of 11 July 1991. The lack of complementary observations did not allow the authors to make an accurate diagnostic, though they found that assuming a 33% filling factor, a density of 1010 cm−3 and a temperature of 6000 K was consistent with their observations. Limitation to a single band was not the case in the observations of Irimajiri et al. (1995) who presented the first simultaneous measurements of an eruptive prominence at multiple millimetre wavelengths of 2.7 mm (110 GHz), 3.4 mm (89 GHz), and 8.3 mm (36 GHz) with spatial resolutions of 15, 19, and 46 arcsec respectively. This allowed the authors to measure the spectral index for the prominence, and thus its optical thickness in each observing band. The optical thickness was of the order of unity up to about 6 at 8.3 mm. Clearly, all these observations did not reach a spatial resolution capable of revealing prominence fine structures, which are found from the optical observations down to sub-arcsecond scales (Engvold, 2015). As demonstrated in this review, ALMA enables us to address this issue.
Because of the diffraction law, it may seem an illogical idea to use an interferometer in mm (and even submm) wavelengths in order to reach an excellent spatial resolution on an extended object such as the Sun. But because of the large-scale interferometer arms possible on the ground, on one hand, and because of the properties of the emitted radiation in these bands, on the other hand, solar physicists have been very interested in the brand new instrument ALMA. Of course, radio observations of the quiet chromosphere are not a new fact and interferometers working from a few mm to a few cm (WSRT, BIMA, VLA) have paved the way to ALMA. But neither interferometers nor single dish telescopes could catch up with the permanently increasing spatial resolution of UV and optical instruments. The challenge is now to match the expected DKIST resolution of 0.15 arcsec (Rast et al., 2021).
The 66 antennas of ALMA are organized as follows: The 12-m array (50 movable antennas with 12 m diameter) and the Acatama Compact Array (ACA) which combines 12 antennas with 7 m diameter for interferometry. The set-up is completed with 4 antennas with 12 m diameter for single dish observations referred to as the ACA Total Power (TP) Array. As seen later, this set-up is necessary for having a large field of view (FOV) from which it is possible to derive the background emission. Current estimates based on numerical simulations of ALMA’s imaging capabilities (e.g., Wedemeyer and Parmer, 2015) imply a spatial resolution of (0.3–0.4) × λ/1 mm [arcsec]. In principle, every antenna will eventually be equipped with receivers covering ten frequency bands in the range from 35 to 950 GHz, corresponding to wavelengths from 8.6 to 0.3 mm, according to Wedemeyer et al. (2016). Presently, ALMA is working in 8 bands centered from 3.1 to 0.35 mm, but not all are yet available for solar observations.
In this section, we describe the formation mechanisms of the ALMA continua with a focus on prominence observations. More details can be found in Heinzel et al. (2015).
In solar prominences the principal source of opacity is the hydrogen free-free continuum. Other emission processes in the mm-continuum such as gyrosynchrotron emission can be safely neglected in the absence of strong-enough magnetic fields and of particles accelerated to relativistic speeds. Thus, the absorption coefficient at frequency ν is
where ne and np are the electron and proton densities, respectively, T the kinetic temperature, and gff ≈ 1 is the Gaunt factor which is of the order of unity but depends generally on the kinetic temperature and frequency (see, e.g., Rodger, 2019). Note that we use the cgs units throughout this section. At low temperatures, H− free-free opacity is
with nHI being the neutral hydrogen density and x takes the form
The total free–free absorption coefficient, corrected for stimulated emission, is then
where h and k are the Planck and Boltzmann constants, respectively. Contrary to UV, the stimulated emission is non-negligible in the ALMA domain.
At low temperatures the hydrogen is much less ionized and the ionization degree i = np/nH goes to zero (here nH is the total hydrogen number density). Let’s express the ratio r = κν(H−)/κν(H) as
Gouttebroze et al. (1993) computed a set of low-temperature isothermal-isobaric models with T = 4300 K, which may correspond to the radiative-equilibrium conditions (Heinzel et al., 2014). At this extremely low temperature, i decreases with increasing gas pressure and for the highest considered pressure p = 1 dyn cm−2, i = 2.3 × 10⁻². But even under such extreme conditions, r is of the order of 10–4 in the wavelength range 1–9 mm and therefore we can neglect the H− free-free opacity in prominences, contrary to solar temperature minimum where the density is very high.
In the literature some authors use the form
where α = 0.018gff. In the radio domain where hν/kT ≪ 1, the stimulated emission term can be written as hν/kT. This then gives the above alternative form which already includes the stimulated emission.
The synthetic intensity Iν, emergent from the prominence on the limb, is in general obtained as
where Bν(T) is the source function, ην the emission coefficient, tν the optical depth, and l is the geometrical path length along the LOS. The free-free processes are collisional processes and therefore the source function is Planckian, whereas ne and np result from the non-LTE ionization equilibria mainly in hydrogen and helium continua where the photoionizations and spontaneous recombinations dominate.
Using the Rayleigh–Jeans law, Iν and Bν are directly proportional to the brightness temperature Tb and to the kinetic temperature T, respectively
where c is the speed of light. Then we get from Eq. 7
Assuming an isothermal prominence we have
where τν = κν L is the total optical thickness and L is the effective geometrical thickness of the prominence along the LOS representing the absorbing path. In the optically-thin case Tb = Tτ(ν), or equivalently
where
Based on the calculations described in Section 4, the ideal brightness temperature (Tb) maps at mm wavelengths can be inferred from the Hα integrated intensity, see e.g. the study by Heinzel et al. (2015). Such maps played an important role in the period of 2015–2017 prior to the actual solar ALMA observations when prominences were evaluated as a prospective science case for ALMA. However, for accurate prediction of the visibility of prominences in ALMA, the non-ideal effects introduced by the instrument and Earth’s atmosphere have to be included and applied to the ideal Tb maps. From all possible degradations, two play the most important role: 1) the incomplete coverage of the Fourier space due to the limited number of interferometric visibilities and 2) the random phase errors of those visibilities caused by atmospheric turbulence. These effects can be included in the synthetic Tb maps thanks to the simulation toolkit contained in the standard CASA (Common Astronomy Software Applications, see http://casa.nrao.edu/) package. The simulated degraded visibilities can be obtained from ideal Tb maps using the simobserve() task. Afterwards, the visibility synthesis and image analysis (namely the comparison with the initial ideal model and the fidelity estimation) can be performed by simanalyze().
The results are presented in Figure 1. The left part shows the ideal Tb map at 100 GHz (i.e., 3 mm) used as an input model for visibility simulations. It has been computed using the observed Hα integrated intensity as described in Heinzel et al. (2015). Its resolution is
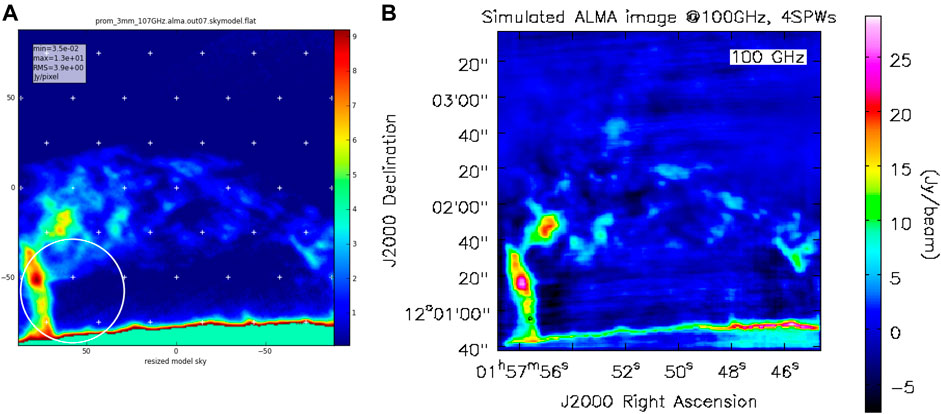
FIGURE 1. (A): Modelled (ideal) brightness temperature map at 100 GHz. The white circle shows ALMA field-of-view for single pointing, the crosses are the centres of pointing for interferometric mosaic. Fourty-nine pointings are necessary for Nyquist sampling of the displayed part of the prominence. (B): Corresponding image as seen by ALMA at 3 mm in Band 3 simulated with the CASA:simobserve() task. Reproduced from Heinzel et al. (2015).
High-resolution interferometric observations in the mm/sub-mm wavelengths open an entirely new door for the investigation of solar prominences. However, at the same time, such a new type of data brings challenges in how we can understand and interpret them. While ALMA has the potential to improve the spatial resolution in the mm/sub-mm domain by an order of magnitude, or more (see e.g. the discussion in Wedemeyer et al., 2016), we need to understand to what extent the prominences at the limb and on the disk (filaments) will be visible in the ALMA observations and how well their fine structures will be resolved. Moreover, to correctly interpret the ALMA prominence observations we need to understand how the thermal structure of the prominence plasma will appear in various ALMA bands.
As we discuss above, Heinzel et al. (2015) used the Hα coronagraphic observations of a quiescent prominence obtained by the Multichannel Subtractive Double Pass (MSDP) spectrograph to determine the visibility of the prominence fine structures at various ALMA wavelengths. The spatial resolution that can be achieved by this technique depends on the original resolution of the used Hα observations. Therefore, the spatial resolution of the synthetic ALMA images obtained by Heinzel et al. (2015) was of the order of 1 arcsec. While this does not reach the best potential resolution of ALMA, it is similar to the resolution that was achieved in the current ALMA solar observations. Of course, the solar ALMA observations mode is being continually developed and the capabilities of ALMA will thus improve over the coming years. If we want to address the issues of the visibility of prominence and filament fine structures in the future ALMA observations, we can harness the power of simulated ALMA-like prominence observations based on visualizations of prominence models.The first simulated high-resolution ALMA observations of a modelled prominence were produced by Gunár et al. (2016). These authors used the detailed 3D WPFS (Whole-Prominence Fine Structure) model of Gunár and Mackay (2015) to show to what extent both the large-scale and small-scale structures of prominences at the limb and filaments on the disk might be visible in the ALMA observations. For this purpose, the authors used a visualization method adapted from Heinzel et al. (2015) to construct synthetic images at mm/sub-mm wavelengths covering the entire ALMA range. It is worth noting that this visualization method, which is described in Gunár et al. (2016), can be applied to any model with prominence-like conditions to produce synthetic images at the wavelengths covered by ALMA. The synthetic brightness temperature maps adapted from Gunár et al. (2016) are shown in Figure 2. These simulated observations represent both the prominence at the limb and the filament on the disk in ALMA bands 6 and 3. The work of Gunár et al. (2016) showed that in prominences the large-scale structures visible at the ALMA wavelengths appear similar to those visible in the Hα line. The cool and dense prominence fine structures are well visible in the simulated ALMA images, which offer even better contrast than the Hα images (for more details see Figures 1–5 in Gunár et al., 2016). The situation becomes more complex in the case of filaments observed against the solar disk. There, in an optically rather thick case of Band 3, the filament appears as two parallel structures that are brighter than the background (see the bottom panel of Figure 2). The central region between these bright structures exhibits the same brightness temperature Tb as the (simulated) background photosphere. However, this region actually corresponds to the densest part of the simulated filament. That is obvious, for example, from the Hα image of the same filament (Figure 5 of Gunár et al., 2016). The coincidence in the similar Tb values is due to the fact that the simulated plasma has a kinetic temperature of 7,000 K, which is very close to the background brightness temperature
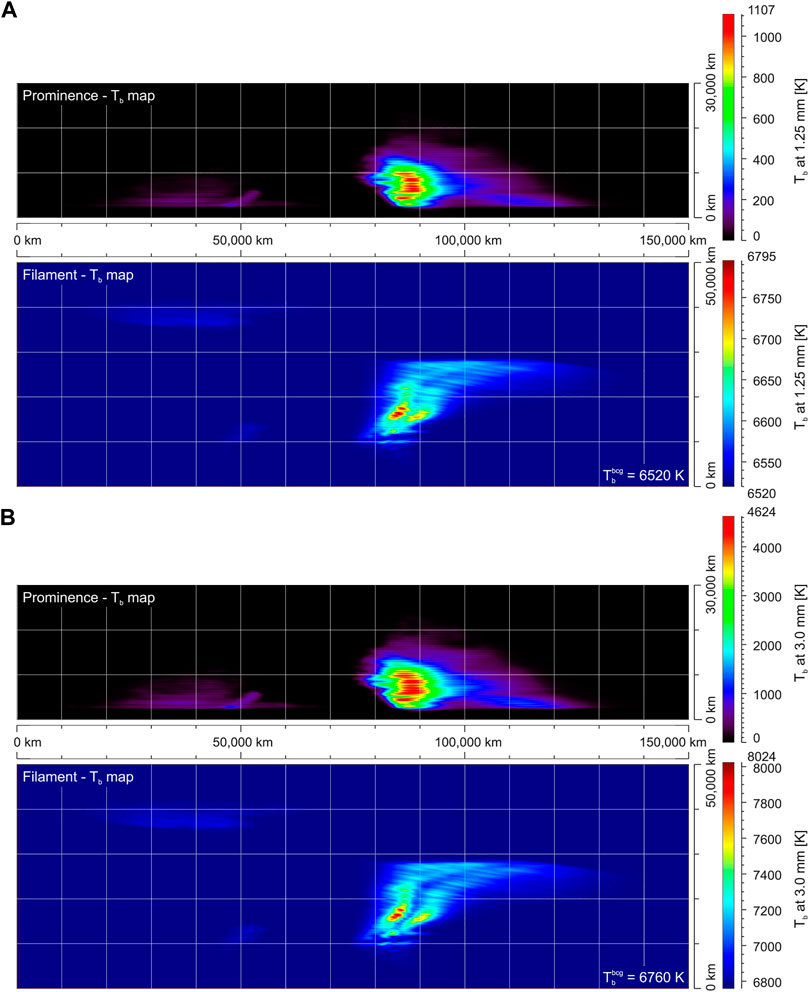
FIGURE 2. Visualization of the 3D WPFS model. (A): synthetic images obtained in Band 6 at 1.25 mm wavelength (240 GHz). (B): synthetic images obtained in Band 3 at 3.0 mm wavelength (100 GHz). Each pair of panels shows the brightness temperature map for the prominence view (top) and the brightness temperature map for the filament view (bottom). Displayed color scales are unique for each panel. The value of the background brightness temperature
As is described in Section 4, the observed specific intensity at the mm/sub-mm wavelengths can be used to derive the kinetic temperature of the solar plasma (see also Loukitcheva et al., 2004; Heinzel and Avrett, 2012). However, such derivation of the kinetic temperature is not entirely straightforward. Without modelling, it can only be performed in cases where at least two simultaneous observations are obtained at mm/sub-mm wavelengths where at one the observed prominence is optically thin and at the other it is optically thick. The kinetic temperature can also be derived from a single mm/sub-mm wavelength observation if simultaneous observations in a different spectral range–e.g. the Hα line in the optical domain–are available (see Heinzel et al., 2015, 2022). Fortunately, to study the relationship between the brightness and kinetic temperature we can also use the simulated ALMA observations produced by prominence models.
The potential of ALMA as a plasma diagnostics tool was explored by Rodger and Labrosse (2017) using 2D cylindrical models based on the code presented in Gouttebroze and Labrosse (2009). In their approach, Rodger and Labrosse (2017) self-consistently included the ionization of hydrogen and helium to compute electron densities and intensities at ALMA wavelengths. The authors investigated in detail how brightness temperature and optical thickness vary with plasma temperature and pressure at different wavelengths across the ALMA spectral bands, and how the ratio of brightness temperatures in two bands can be used to estimate the optical thickness and the emission measure. For this investigation, Rodger and Labrosse (2017) used both the isothermal–isobaric models and models with the prominence-corona transition region (PCTR) representing the gradient of the temperature between cool prominence cores and their hot coronal environment. Not surprisingly, the presence of a non-isothermal plasma along the line of sight renders the diagnostic less straightforward and these calculations once again demonstrated the necessity of complementing the observations with competent radiative transfer calculations. To illustrate this, the left panel of Figure 3 shows the relation between brightness temperature and wavelength of observation for small-scale isothermal threads.It can be seen that for optically thin emission (mostly, shorter wavelengths and lower pressures), the brightness temperature decreases with the temperature, as noted also by Gunár et al. (2016). On the contrary, the brightness temperature will be a direct measure of the plasma temperature if the plasma is optically thick at the observed wavelength. This is visible in the left panel of Figure 3 where the TB curves flatten at longer wavelengths and higher pressures. The behaviour of the absorption coefficient depends not only on wavelength but also on temperature, electron density, and ion density. This leads to the more complex variations seen in the central section of the plot where the plasma is neither optically thin nor optically thick. The left panel of Figure 3 thus shows that ALMA observations obtained at longer wavelengths (e.g., at 9 mm) would have a good potential to diagnose regions which are close to isothermal as the plasma is mostly optically thick at those wavelengths. For larger non-isothermal threads, the relation between brightness temperature measured at 9 mm and plasma temperature averaged over the region of formation of the continuum at that wavelength is shown in the right panel of Figure 3. Each point on the plot represents one optically thick line of sight going through the modeled prominence thread. The plot indicates that ALMA 9 mm observations allow a reliable measurement of the mean electron temperature in the region of the prominence where the radiation is formed. For more details see Rodger and Labrosse (2017).
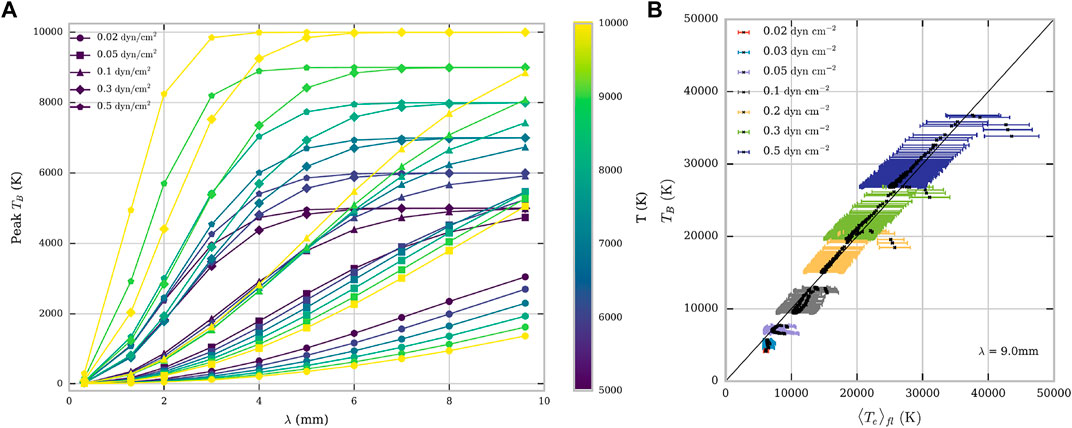
FIGURE 3. (A): Brightness temperature as a function of wavelength for isothermal isobaric prominence models. Colours correspond to plasma temperature (see colour bar on the right) and different symbols indicate different pressures. The grey-shaded areas show ALMA Bands 3 and 6. (B): Brightness temperature as a function of plasma temperature averaged over the formation layer of the 9 mm radiation. The error bars show the standard error in the mean for the average plasma temperature. Colours correspond to different pressures, as indicated in the legend. Adapted from Rodger and Labrosse (2017).
To provide deeper theoretical insight into the diagnostics of the thermal properties of solar prominences observed by ALMA, the relationship between the observed brightness temperature and the actual kinetic temperature of the studied prominence plasma was further investigated by Gunár et al. (2018). These authors used two sets of synthetic brightness temperature maps of the 3D WPFS model–one at a wavelength at which the simulated prominence is completely optically thin and another at a wavelength at which a significant portion of the simulated prominence is optically thick. Because the 3D WPFS model contains detailed information about the distribution of the kinetic temperature and the optical thickness along any line of sight, it was possible to assess whether the kinetic temperature derived from observations accurately represents the actual kinetic temperature properties of the observed plasma. Gunár et al. (2018) similarly found that the derived kinetic temperature represents an average of the actual kinetic temperature distribution along the given LOS, where it is weighted by the distribution of the opacity along that LOS. This study also confirmed that in a given pixel the optical thickness at the wavelength at which the prominence plasma is optically thick needs to be above unity or even larger to achieve sufficient accuracy of the derived information about the kinetic temperature of the analyzed plasma. However, information about the optical thickness is difficult to obtain from observations at the mm/sub-mm wavelengths alone. As the study by Rodger and Labrosse (2017) illustrates, we can speak about optically thin plasma diagnostic for τ ≲ 0.1 and optically thick plasma diagnostic for τ ≳ 10. Where the optical thickness lies between 0.1 and 10 it is more difficult to assign an optically “thin” or “thick” tag to the plasma. This stresses the importance of making available the longest wavelengths of ALMA observations to solar observers in order to have a clear, unambiguously optically thick emission regime. Rodger and Labrosse (2017) also presented a study of the diagnostic potential of the brightness temperature ratio in Bands 3 and 6 (the first two bands available to solar observers) for optical thickness and average emission measure along the line of sight.
Later, Gunár et al. (2018) showed that an empirical criterion which can identify those pixels in which the derived kinetic temperature values correspond well to the actual thermal properties of the observed prominence can be established. More details are presented in the review of numerical modelling of the Sun in mm/sub-mm wavelengths by Wedemeyer et al. (2022), which is part of this special issue.
The feasibility of prominence observations above the limb has been demonstrated by CASA simulations (see Section 5) and demonstrated during the Solar ALMA observing campaigns in 2014 and 2015 (Shimojo et al., 2017; White et al., 2017; Bastian et al., 2018). The ALMA observing setup for prominences typically includes a small mosaic (as a result of the trade-off between full-scan cadence and the FOV), sometimes accompanied by a high-cadence single-FOV observations performed as close as possible to the mosaic (so called back-to-back execution blocks). The latter serves for studies of fast dynamic phenomena on small spatial scales. The observations may be performed at a single ALMA frequency band or in multiple bands, again, in a back-to-back manner. However, truly synchronous multi-band observations are not currently possible. Because the brightness temperature measured in prominences is rather low with respect to the solar disk, the weaker MD1 attenuation mode (see, e.g., Shimojo et al., 2017) is used in order to suppress the brightness of the portion of solar disc present in the FOV. Because interferometric observations lack the flux at low spatial frequencies (a hole around zero in the uv-space), they essentially provide just the differences with respect to the average brightness. For that reason each solar interferometric (INT) observation is accompanied by a single-dish full-disk image performed by the total-power (TP) antenna synchronously with the INT execution block. The TP observation is performed using the fast-scanning method (see White et al., 2017) in order to complete the full-disk scan in a relatively short time interval. Unlike the INT observations, where the direct result of the measurement is represented by interferometric visibilities (i.e. samples of the spatial Fourier components of the image), the TP scan provides the flux density convolved with the TP-antenna primary beam at a given AzEl coordinate. This means that the TP scan produces direct low-resolution image in the absolute brightness temperature scale. The INT and TP observations have to be combined during the data-reduction process to get the complete reconstruction of the brightness map. The basic data reduction of ALMA observations is performed at ALMA Regional Centers (ARCs) as part of the Quality Assurance level 2 procedure (QA2). The standard procedures for solar INT and TP data are described in Shimojo et al. (2017) and White et al. (2017), respectively. This prominence (as all the European solar data) has been processed by the EU ARC node in Ondřejov.
It is worth noting that the combination of INT and TP solar data has caveats, especially for limb observations. The disparity between the two signals and the necessity to scale them properly has been reported in Alissandrakis et al. (2017). The CASA feather() task allows to match the INT and TP data by fitting two free parameters. Alissandrakis et al. (2017) recommend that this is done in such a way that the combined image: 1) has the average brightness temperature in the quiet solar region selected further from the limb corresponding to that obtained from the purely TP data, and 2) the average brightness temperature of corona (i.e., the small off-limb region selected further from the prominence) is approximately zero (specifically, that it is not significantly negative). An example of the results of this INT/TP matching procedure for the prominence analyzed in Section 7.2 is presented in Figure 4. It shows a profile of the brightness temperature (center-limb-corona brightness variation) along the mostly radial line crossing the solar limb. The above two conditions are mostly matched.
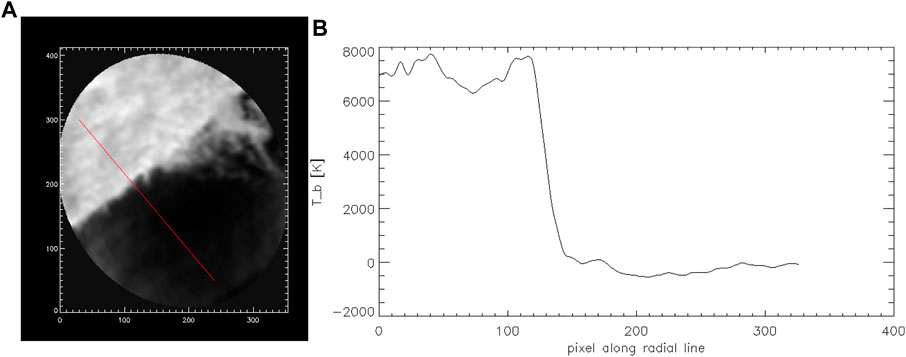
FIGURE 4. (A): Prominence analysed in Section 7.2 with red-marked radial line. (B): A profile of the brightness temperature along the radial line in the (A). The parameters in feather() has been selected such a way that the coronal brightness temperature is close to zero and the brightness of the solar disk corresponds to that observed by the TP scan.
The derivation of the kinetic or electron temperature of the prominence plasma (here we assume that the kinetic temperature of all particles is the same) is a key subject of the ALMA science as far as the solar atmosphere is concerned. The reason is that standard spectroscopic diagnostics of the temperature is based on analysis of spectral-line intensities and line shapes which represents a difficulty because of various competing processes. The line intensities depend on prominence thermodynamic parameters, but also to a large extent on the external illumination. On the other hand, the line shapes are sensitive not only to temperature, but to other non-thermal broadening processes like the microturbulence or fine-structure dynamics, not speaking about the pressure broadening which is less important in low-density prominences. Realistic knowledge of the kinetic temperature is key for discrimination between various processes of heating and cooling which are still far from being well understood under the prominence conditions (Gilbert, 2015). A reliable knowledge of the temperature distribution within the prominence fine structures and its temporal evolution will also help our understanding of the magneto-thermal convection processes discussed in Berger et al. (2011). A more straightforward way of determining temperature is to use continuum observations in the mm or sub-mm domain now provided by ALMA with unprecedented resolution.
The first prominence observations with ALMA were obtained in Band 3 (ALMA project 2017.01138.S) when a quiescent prominence was observed on 19 April 2018 (Heinzel et al., 2022; Labrosse et al., 2022). The prominence was also observed (Peat et al., 2021) by the Interface Region Imaging Spectrograph (IRIS, De Pontieu et al., 2014) and in the Hα line by MSDP instruments in Bialków (Poland) and Meudon (France).
In the following we will describe the analysis performed by Heinzel et al. (2022) and Labrosse et al. (2022) who independently demonstrated the ability of ALMA to deduce the prominence kinetic temperatures. First of all, we show in Figure 5 two co-aligned images of the brightness-temperature distribution in Band 3 and of the integrated Hα emission from Białków MSDP. Although the contrast is different in these two spectral bands, we clearly see, for the first time, a detailed prominence structure in 3 mm band consistent with that in Hα, both at spatial resolution between 1 - 2 arcsec. This is quite unique thanks to interferometric capabilities of ALMA. We immediately see that many areas have Tb rather low, around 4000 K or even less which indicates that in those areas the prominence is optically thin so that Tb ≈ Tkτ, neglecting the filling factor (see below). In Figure 6 we plot for all observed pixels the correlation between observed Tb and MSDP integrated Hα intensity E(Hα). If we overplot the synthetic color curves using the grid of non-LTE models, we see a reasonable fit. The curves split according to their kinetic temperature for highest values of E, this happens close to the saturation limit i.e. for τ ≥ 1. However, at lower τ the curves become indistinguishable so that it is difficult to find a unique solution for the kinetic temperature. At low intensities, the curves are rather flat and do not provide reasonable solutions for Tk, namely when one adds a noise in the observed Tb. This is the problem found by Heinzel et al. (2022) by analyzing ALMA and MSDP data and because of that they restricted themselves only to brighter areas where the intensity is larger than 105 cgs. For such areas they produced maps of the kinetic temperature, by inverting Band 3 and Hα. However, Heinzel et al. (2022) discovered another, even more critical problem. In Figure 6A we see that for E ≤ 105 cgs almost all pixels lay below color-coded curves which merge together in this region as discussed above. Tb along these color-coded curves represents, for a given E, a maximum value which is achieved assuming that the plane-of-sky (POS) filling factor f = 1. For lower values of f all points will have lower Tb - see also Irimajiri et al. (1995). Therefore, it seems that the scatter of pixels below the color-coded curves in fact indicates a variety of f-values within the prominence. To demonstrate the effect on inverted Tk, Heinzel et al. (2022) used three characteristic values of f being uniform in the whole FOV and produced temperature maps shown in Figure 7 We clearly see how lowering of f increases Tk. For f = 1 temperatures seem to be very low, between 5000–6000 K, but they increase to more realistic values for lower f. A surprising feature is a low temperature at borders of the prominence where one normally expects higher ones. However, these are not true borders because all weaker prominence parts were excluded for reasons explained above and, moreover, these less bright regions can be more heterogeneous and may have much lower f than that assumed. Finally, allowing the inversion to give higher-temperature solutions (in the maps the range of unique solutions was limited to 12000 K), one could have these regions hotter. All these aspects will require further detailed analysis and new ALMA observations.
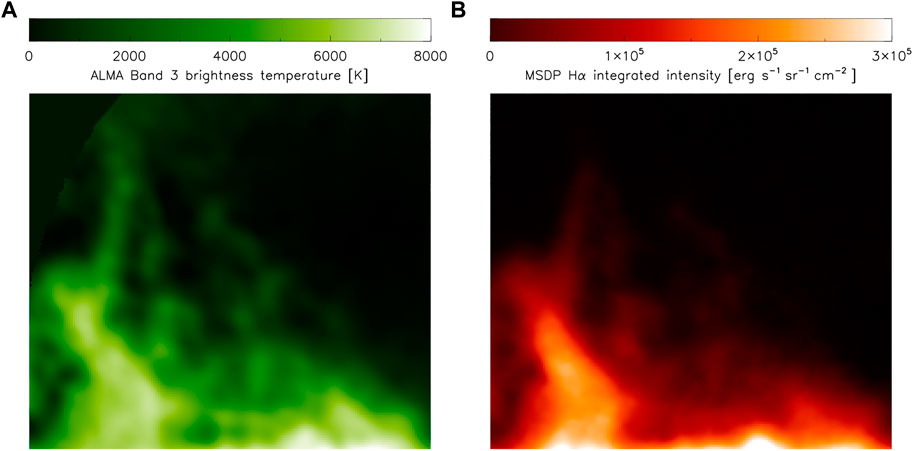
FIGURE 5. Coaligned maps of the brightness temperature Tb obtained from calibrated ALMA Band 3 INT mosaic (A) and Hα integrated intensities from MSDP Wrocław/Białków (B). The spatial resolution of both images is comparable. ALMA and MSDP data was recorded simultaneously, at 15:38:07 UT (start of ALMA mozaic) and 15:37:56 UT (start of MSDP Hα scan). Individual fine structures are well recognized. Reproduced from Heinzel et al. (2022)
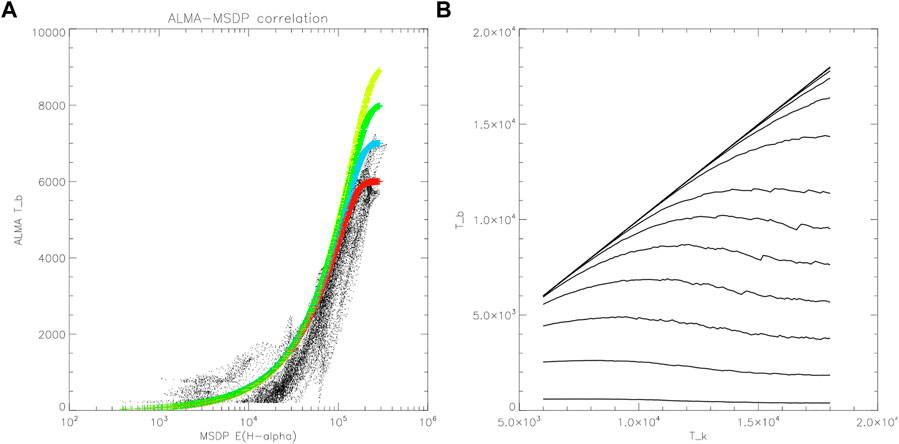
FIGURE 6. (A) - relation between observed Tb and E(Hα) in units of erg s−1 cm−2 sr−1 for all pixels from Figure 5 (dots). Color curves indicate the same relation constructed from non-LTE models and assuming a uniform distribution of kinetic temperature in the whole FOV (yellow - 9000 K, green - 8000 K, blue - 7000 K, red - 6000 K). (B) - theoretical variations of Band 3 brightness temperature Tb versus 1D-slab kinetic temperature Tk for several values of the Hα line integrated intensity. This plot was constructed from the used grid of models (small kinks on some curves are due to finite separation between the models in the grid). The individual curves correspond (from below) to E(Hα) from 104 up to 106 erg cm−2 s−1 sr−1. Reproduced from Heinzel et al. (2022).
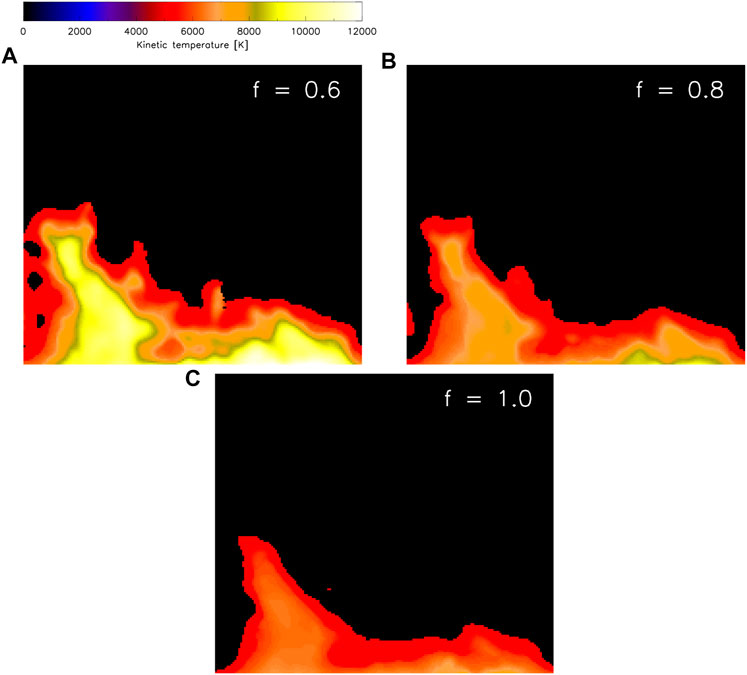
FIGURE 7. Inverted maps of kinetic temperatures for different values of the filling factor: (A) f = 0.6, (B) f = 0.8, (C) f = 1.0. The field-of-view is the same as in Figure 5. Reproduced from Heinzel et al. (2022).
The analysis by Labrosse et al. (2022), see Figure 8, shows a comparison between the brightness temperatures observed by ALMA and those derived using the Hα MSDP data, for three temperatures between 6000 and 10000 K. In this case, the non-LTE calculations were similar to those used by Rodger and Labrosse (2017). This figure reveals a very good correlation at a temperature of 8000 K–with nevertheless some scatter which could be explained by a non-uniform plasma temperature along the line of sight, and/or by a filling factor f less than 1.
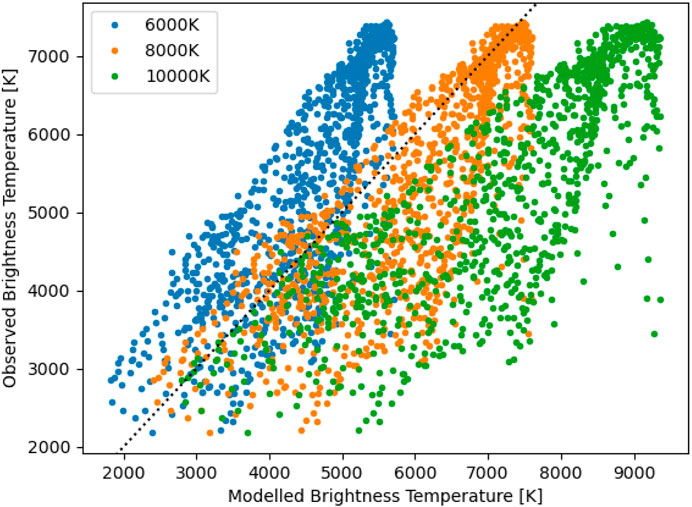
FIGURE 8. Relationship between observed brightness temperature from ALMA and that modelled using the Hα MSDP data. The modelled brightness temperatures are estimated at 6000, 8000, and 10000 K. The dotted line shows when the observed and estimated brightness temperatures are equal. Reproduced from Labrosse et al. (2022).
The very close resemblance of the prominence appearance in Hα and in ALMA Band 3 can be understood by studying the contribution functions at both wavelengths. Labrosse et al. (2022) showed that they both have a clear and consistent overlap across a wide range of pressures. The width of the 3 mm contribution function inside the 2D cylindrical prominence model used by these authors is larger than that of the Hα contribution function, which suggests that the emission detected by ALMA has a contribution from hotter plasma at the base of the PCTR. However, an obvious similarity of fine structures seen in both ALMA Band 3 and in Hα (Figure 5) can be understood in terms of the analysis made by Heinzel et al. (2015). The ratio between the integrated Hα intensity and brightness temperature (both shown in Figure 5) is proportional to a temperature-dependent factor
assuming that the fine structures are optically thin in both Hα and Band 3. Here we used the Eqs 6, 12 from Heinzel et al. (2015). For three different temperatures 6000 K, 8000 K, and 10000 K, the non-LTE departure factor b3 amounts to 0.75, 1.67, and 2.97, respectively (Jejčič and Heinzel, 2009) and corresponding values of the above factor are 2.32, 1.87, and 1.72. Therefore the ratio between the integrated Hα intensity and brightness temperature does not depend on the emission measure (which cancels there) and is only weakly dependent on the kinetic temperature. This then leads to a close resemblance between well coaligned and calibrated images in Figure 5.
It is also very interesting to compare the ALMA images with the observations by the Atmospheric Imaging Assembly (AIA; Lemen et al., 2012) on the Solar Dynamics Observatory (SDO; Pesnell et al., 2012) and with IRIS. This is presented in Figures 9, 10.
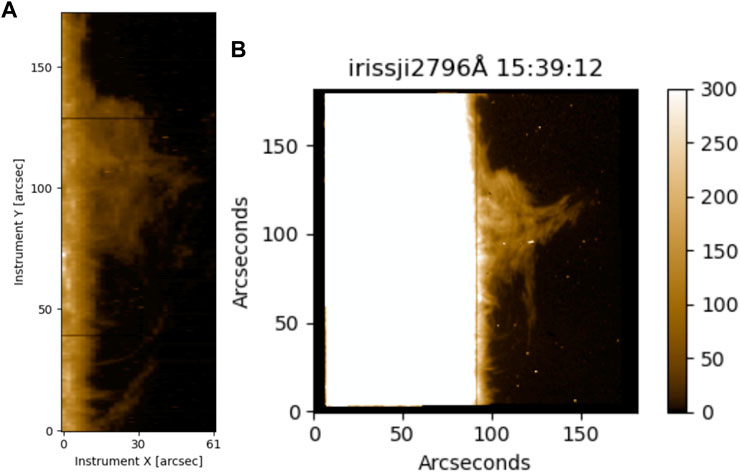
FIGURE 9. IRIS observations of the ALMA prominence: raster of the Mg II h line intensity taken at 14:14UT (A) and slit-jaw image at 2796 Å (B). Adapted from Peat et al. (2021).
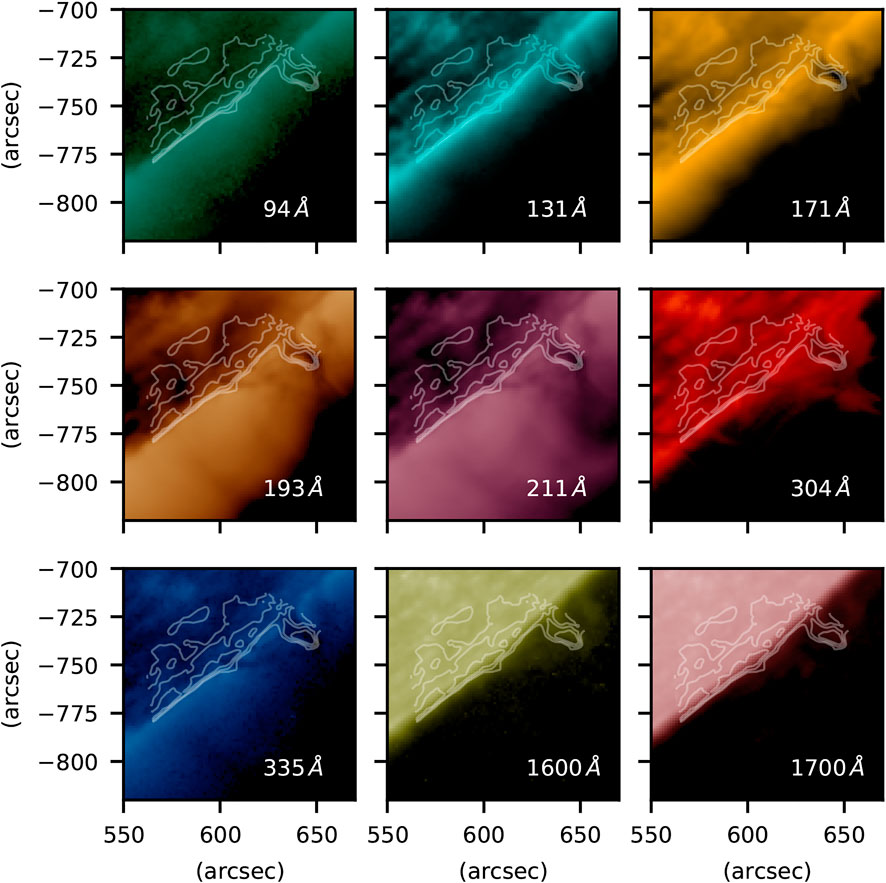
FIGURE 10. Co-aligned images of the ALMA prominence (shown as white contours at relative brightness temperatures of 1000, 2000, and 3000 K) observed with AIA. Reproduced from Labrosse et al. (2022).
Both figures show a high degree of similarity in the overall morphology of the prominence (as expected based on well-known comparisons between Hα and IRIS or AIA observations), but of course the details depend on the wavelengths used in the comparisons. A detailed analysis was carried out by Labrosse et al. (2022) with the AIA observations. These authors found that the dark structures seen in AIA 171, and more particularly at AIA 193 and AIA 211, correspond to the contours of the prominence spine seen by ALMA in Band 3. This is not surprising as we know that the optical thickness of ALMA Band 3 and of Hα are similar, and Heinzel et al. (2008) have shown that the opacity of the hydrogen and helium continua at 195 Å (responsible for the dark appearance of the prominence above the limb) is also comparable to that in the Hα line center. On the other hand, a large optical thickness of the He II 304 Å line explains the more extended structure at that wavelength as compared to ALMA Band 3—allowing fine structures to be more easily observed away from the prominence spine (the same applies to Mg II lines observed by IRIS). Correlations with ALMA Band 3 at other AIA wavelengths can also be seen in Figure 10 but the prominence is much fainter.
The first ALMA observations of a disk filament (an active region, non-eruptive filament) are reported and analyzed in the paper by da Silva Santos et al. (2022), which is part of this special issue on solar observations by ALMA. This active region filament was observed simultaneously in ALMA Band 6 and by the IRIS, SDO/AIA and the Solar Optical Telescope (SOT, Suematsu et al., 2008) on the Hinode satellite. In the absence of simultaneous observations in the Hα line or in other ALMA bands, quantitative thermal diagnostics of this filament is not possible. However, da Silva Santos et al. (2022) could conclude that some of the darkest features visible in the ALMA Band 6 (Tb < 5000 K) coincide with dark filament threads visible in the AIA 304 Å channel and in the cores of the Mg II h and k lines observed by IRIS.
In this review we addressed various aspects of the prominence physics from the point of view of radio mm/sub-mm observations. Historically, such observations have been carried out at rather low spatial resolution which did not allow the study of prominence fine structures, contrary to high-resolution observations available in optical and UV. When ALMA was going to be operational during the last decade, a hope arose that we will be ultimately able to resolve the fine structures in solar prominences and filaments in the radio domain. Based on data-driven simulations (Heinzel et al., 2015) and other modeling work (Rodger and Labrosse, 2017), several proposals have been submitted to facilitate prominence observations with ALMA. As a result, one prominence was observed still at the moderate ALMA resolution of 1-2 arcsec and the data was recently analyzed - we provide an overview of obtained results. We also mention one disk filament observation, the analysis is presented in another paper in this volume. We discussed in detail all aspects, but also caveats, of prominence plasma diagnostics using ALMA. Since only one band was used so far in prominence observations, the temperature diagnostics was possible only thanks to simultaneous ground-based observations in the hydrogen Hα line with a comparable spatial resolution. In future prominence/filament observations a quasi-simultaneous detection in more than one ALMA band will significantly enhance the ALMA diagnostical potential as a prominence plasma ‘thermometer’. The ultimate goal is to get much higher spatial resolution in the near future, at least comparable to current optical instruments such as DKIST or even better. ALMA co-observation with DKIST is very challenging because both instruments can in principle reach the so-far best spatial resolution. However, a problem can be the time difference between instrument locations (6 h) and exact coaligned pointing. DKIST can provide spectral-line diagnostics in blue, red and IR, complementary to ALMA multi-band imaging. On the other hand, there is a recent proposal for other coordinated observations with ALMA in the frame of the SOLARNET programme which includes large European facilities. And one should also consider UV/EUV spectral observations from space instruments like IRIS, SPICE on Solar Orbiter, or coming MUSE and Solar-C/EUVST. A complex spectral inversion of plasma parameters based on ALMA and multi-wavelength spectra is a highly challenging task.
All authors listed have made a substantial, direct, and intellectual contribution to the work and approved it for publication.
SG and PH acknowledge support by the grant 19-16890S and 19-17102S of the Czech Science Foundation (GA ČR) and by the project RVO:67985815 of the Astronomical Institute of the Czech Academy of Sciences. MB acknowledges support by the grants 20-09922J and 21-16808J of the Czech Science Foundation, and by the project LM2015067 from the Ministry of education of the Czech Republic. Support from STFC grant ST/T000422/1 (NL) is also gratefully acknowledged. This work was partially supported by the program ‘Excellence Initiative–Research University’ for years 2020-2026 at the University of Wrocław, Poland.
The authors declare that the research was conducted in the absence of any commercial or financial relationships that could be construed as a potential conflict of interest.
All claims expressed in this article are solely those of the authors and do not necessarily represent those of their affiliated organizations, or those of the publisher, the editors and the reviewers. Any product that may be evaluated in this article, or claim that may be made by its manufacturer, is not guaranteed or endorsed by the publisher.
Alissandrakis, C. E., Patsourakos, S., Nindos, A., and Bastian, T. S. (2017). Center-to-limb observations of the sun with ALMA . Implications for solar atmospheric models. Astron. Astrophys. 605, A78. doi:10.1051/0004-6361/201730953
Bastian, T. S., Bárta, M., Brajša, R., Chen, B., Pontieu, B. D., Gary, D. E., et al. (2018). Exploring the sun with ALMA. Messenger 171, 25. doi:10.18727/0722-6691/5065
Bastian, T. S., Ewell, J., and Zirin, H. (1993). A study of solar prominences near lambda = 1 millimeter. Astrophys. J. 418, 510. doi:10.1086/173413
Berger, T., Testa, P., Hillier, A., Boerner, P., Low, B. C., Shibata, K., et al. (2011). Magneto-thermal convection in solar prominences. Nature 472, 197–200. doi:10.1038/nature09925
da Silva Santos, J. M., White, S. M., Reardon, K., Cauzzi, G., Gunár, S., Heinzel, P., et al. (2022). Subarcsecond imaging of a solar active region filament with alma and iris. Front. Astron. Space Sci. 9. doi:10.3389/fspas.2022.898115
De Pontieu, B., Title, A. M., Lemen, J. R., Kushner, G. D., Akin, D. J., Allard, B., et al. (2014). The Interface region imaging spectrograph (IRIS). Sol. Phys. 289, 2733–2779. doi:10.1007/s11207-014-0485-y
Engvold, O. (2015). “Description and classification of prominences,” in Solar prominences. Cham: Springer. Editors J.-C. Vial, and O. Engvold (Astrophysics and Space Science Library), 41531. doi:10.1007/978-3-319-10416-4_2
Gilbert, H. (2015). “Energy balance,” in Solar prominences. Cham: Springer. Editors J.-C. Vial, and O. Engvold (Astrophysics and Space Science Library), 415157. doi:10.1007/978-3-319-10416-4_7
Gouttebroze, P., Heinzel, P., and Vial, J. C. (1993). The hydrogen spectrum of model prominences. Astron. Astrophys. 99, 513
Gouttebroze, P., and Labrosse, N. (2009). Radiative transfer in cylindrical threads with incident radiation. VI. A hydrogen plus helium system. Astron. Astrophys. 503, 663–671. doi:10.1051/0004-6361/200811483
Gunár, S., Heinzel, P., Anzer, U., and Mackay, D. H. (2018). Quiescent prominences in the era of ALMA. II. Kinetic temperature diagnostics. Astrophys. J. 853, 21. doi:10.3847/1538-4357/aaa001
Gunár, S., Heinzel, P., Mackay, D. H., and Anzer, U. (2016). Quiescent prominences in the era of ALMA: Simulated observations using the 3D whole-prominence fine structure model. Astrophys. J. 833, 141. doi:10.3847/1538-4357/833/2/141
Gunár, S., and Mackay, D. H. (2015). 3D whole-prominence fine structure modeling. Astrophys. J. 803, 64. doi:10.1088/0004-637X/803/2/64
Harrison, R. A., Carter, M. K., Clark, T. A., Lindsey, C., Jefferies, J. T., Sime, D. G., et al. (1993). An active solar prominence in 1.3 MM radiation. Astron. Astrophys. 274, L9.
Heinzel, P., and Avrett, E. H. (2012). Optical-to-Radio continua in solar flares. Sol. Phys. 277, 31–44. doi:10.1007/s11207-011-9823-5
Heinzel, P., Berlicki, A., Bárta, M., Karlický, M., and Rudawy, P. (2015). On the visibility of prominence fine structures at radio millimeter wavelengths. Sol. Phys. 290, 1981–2000. doi:10.1007/s11207-015-0719-7
Heinzel, P., Berlicki, A., Bárta, M., Rudawy, P., Gunár, S., Labrosse, N., et al. (2022). ALMA as a prominence thermometer: First observations. Astrophys. J. Lett. 927, L29. doi:10.3847/2041-8213/ac588f
Heinzel, P. (2015). “Radiative transfer in solar prominences,” in Solar prominences. Cham: Springer. Editors J.-C. Vial, and O. Engvold (Astrophysics and Space Science Library), 415103. doi:10.1007/978-3-319-10416-4_5
Heinzel, P., Schmieder, B., Fárník, F., Schwartz, P., Labrosse, N., Kotrč, P., et al. (2008). Hinode, TRACE, SOHO, and ground-based observations of a quiescent prominence. Astrophys. J. 686, 1383–1396. doi:10.1086/591018
Heinzel, P., Vial, J. C., and Anzer, U. (2014). On the formation of Mg ii h and k lines in solar prominences. Astron. Astrophys. 564, A132. doi:10.1051/0004-6361/201322886
Hiei, E., Shimizu, Y., Miyazaki, H., Imai, H., Sato, K., Kuji, S., et al. (1986). Coronal structure observed at the total solar eclipse of 11 June, 1983 in Indonesia. Astrophys. Space Sci. 119, 9–15. doi:10.1007/BF00648803
Irimajiri, Y., Takano, T., Nakajima, H., Shibasaki, K., Hanaoka, Y., and Ichimoto, K. (1995). Simultaneous multifrequency observations of an eruptive prominence at millimeter wavelengths. Sol. Phys. 156, 363–375. doi:10.1007/BF00670232
Jejčič, S., and Heinzel, P. (2009). Electron densities in quiescent prominences derived from eclipse observations. Sol. Phys. 254, 89–100. doi:10.1007/s11207-008-9289-2
Labrosse, N., Heinzel, P., Vial, J. C., Kucera, T., Parenti, S., Gunár, S., et al. (2010). Physics of solar prominences: I—spectral diagnostics and non-LTE modelling. Space Sci. Rev. 151, 243–332. doi:10.1007/s11214-010-9630-6
Labrosse, N., Rodger, A. S., Radziszewski, K., Rudawy, P., Antolin, P., Fletcher, L., et al. (2022). First high resolution interferometric observation of a solar prominence with ALMA. MNRAS 513, L30–L34. doi:10.1093/mnrasl/slac021
Lemen, J. R., Title, A. M., Akin, D. J., Boerner, P. F., Chou, C., Drake, J. F., et al. (2012). The atmospheric imaging assembly (AIA) on the solar dynamics observatory (SDO). Sol. Phys. 275, 17–40. doi:10.1007/s11207-011-9776-8
Lindsey, C., Jefferies, J. T., Clark, T. A., Harrison, R. A., Carter, M. K., Watt, G., et al. (1992). Extreme-infrared brightness profile of the solar chromosphere obtained during the total eclipse of 1991. Nature 358, 308–310. doi:10.1038/358308a0
Loukitcheva, M., Solanki, S. K., Carlsson, M., and Stein, R. F. (2004). Millimeter observations and chromospheric dynamics. Astron. Astrophys. 419, 747–756. doi:10.1051/0004-6361:20034159
Peat, A. W., Labrosse, N., Schmieder, B., and Barczynski, K. (2021). Solar prominence diagnostics from non-LTE modelling of Mg II h&k line profiles. Astron. Astrophys. 653, A5. doi:10.1051/0004-6361/202140907
Pesnell, W. D., Thompson, B. J., and Chamberlin, P. C. (2012). The solar dynamics observatory (SDO). Sol. Phys. 275, 3–15. doi:10.1007/s11207-011-9841-3
Rast, M. P., Bello González, N., Bellot Rubio, L., Cao, W., Cauzzi, G., Deluca, E., et al. (2021). Critical science plan for the daniel K. Inouye solar telescope (DKIST). Sol. Phys. 296, 70. doi:10.1007/s11207-021-01789-2
Rodger, A., and Labrosse, N. (2017). Solar prominence modelling and plasma diagnostics at ALMA wavelengths. Sol. Phys. 292, 130. doi:10.1007/s11207-017-1161-9
Rodger, A. (2019). Millimetre-continuum diagnostics and non-LTE radiative transfer modelling of solar prominences. UK: Ph.D. thesis, University of Glasgow.
Shimojo, M., Bastian, T. S., Hales, A. S., White, S. M., Iwai, K., Hills, R. E., et al. (2017). Observing the sun with the Atacama large millimeter/submillimeter array (ALMA): High-resolution interferometric imaging. Sol. Phys. 292, 87. doi:10.1007/s11207-017-1095-2
Suematsu, Y., Tsuneta, S., Ichimoto, K., Shimizu, T., Otsubo, M., Katsukawa, Y., et al. (2008). The solar optical telescope of solar-B ( Hinode): The optical telescope assembly. Sol. Phys. 249, 197–220. doi:10.1007/s11207-008-9129-4
Vrsnak, B., Pohjolainen, S., Urpo, S., Terasranta, H., Brajsa, R., Ruzdjak, V., et al. (1992). Large-scale patterns on the Sun observed in the millimetric wavelength range. Sol. Phys. 137, 67–86. doi:10.1007/BF00146576
Wedemeyer, S., Bastian, T., Brajša, R., Hudson, H., Fleishman, G., Loukitcheva, M., et al. (2016). Solar science with the Atacama large millimeter/submillimeter array – a new view of our sun. Space Sci. Rev. 200, 1–73. doi:10.1007/s11214-015-0229-9
Wedemeyer, S., Fleishman, G., De La Cruz Rodríguez, J., Gunár, S., da Silva Santos, J. M., Antolin, P., et al. (2022). Prospects and challenges of numerical modelling of the sun at millimetre wavelengths. Front. Astronomy Space Sci. 9.
Wedemeyer, S., and Parmer, A. (2015). “ALMA’s high-cadence imaging capabilities for solar observations,” in Revolution in Astronomy with ALMA: The third year. San Francisco. Editors D. Iono, K. Tatematsu, A. Wootten, and L. Testi (Astronomical Society of the Pacific Conference Series), 499, 343.
Keywords: prominences, mm/sub-mm observations, ALMA, plasma diagnostics, temperature structure
Citation: Heinzel P, Bárta M, Gunár S, Labrosse N and Vial J-C (2022) Prominence observations with ALMA. Front. Astron. Space Sci. 9:983707. doi: 10.3389/fspas.2022.983707
Received: 01 July 2022; Accepted: 14 September 2022;
Published: 07 October 2022.
Edited by:
Costas E. Alissandrakis, University of Ioannina, GreeceReviewed by:
Debi Prasad Choudhary, California State University, United StatesCopyright © 2022 Heinzel, Bárta, Gunár, Labrosse and Vial. This is an open-access article distributed under the terms of the Creative Commons Attribution License (CC BY). The use, distribution or reproduction in other forums is permitted, provided the original author(s) and the copyright owner(s) are credited and that the original publication in this journal is cited, in accordance with accepted academic practice. No use, distribution or reproduction is permitted which does not comply with these terms.
*Correspondence: Petr Heinzel, cGhlaW56ZWxAYXN1LmNhcy5jeg==
Disclaimer: All claims expressed in this article are solely those of the authors and do not necessarily represent those of their affiliated organizations, or those of the publisher, the editors and the reviewers. Any product that may be evaluated in this article or claim that may be made by its manufacturer is not guaranteed or endorsed by the publisher.
Research integrity at Frontiers

Learn more about the work of our research integrity team to safeguard the quality of each article we publish.