 Gregory D. Fleishman
 Juan Carlos Martinez Oliveros2
95% of researchers rate our articles as excellent or good
Learn more about the work of our research integrity team to safeguard the quality of each article we publish.
Find out more
MINI REVIEW article
Front. Astron. Space Sci. , 21 September 2022
Sec. Stellar and Solar Physics
Volume 9 - 2022 | https://doi.org/10.3389/fspas.2022.966444
This article is part of the Research Topic The Sun Seen with the Atacama Large mm and sub-mm Array (ALMA) - First Results View all 13 articles
This paper identifies several unsolved questions about solar flares, which can potentially be answered or at least clarified with mm/submm observations with ALMA. We focus on such questions as preflare phases and the initiation of solar flares and the efficiency of particle acceleration during flares. To investigate the preflare phase we propose to use the extraordinary sensitivity and high spatial resolution of ALMA, which promises to identify very early enhancements of preflare emission with high spatial resolution and link them to the underlying photospheric magnetic structure and chromospheric flare ribbons. In addition to revealing the flare onsets, these preflare measurements will aid in the investigation of particle acceleration in multiple ways. High-frequency imaging spectroscopy data in combination with the microwave data will permit the quantification of the high-energy cutoff in the nonthermal electron spectra, thus helping to constrain the acceleration efficiency. Detection and quantification of secondary relativistic positron (produced due to nonthermal accelerated ions) contribution using the imaging polarimetry data will help constrain acceleration efficiency of nonthermal nuclei in flares. Detection of a “mysterious” rising spectral component with high spatial resolution will help determine the emission mechanism responsible for this component, and will then help in quantifying this either nonthermal or thermal component of the flaring plasma. We discuss what ALMA observing mode(s) would be the most suitable for addressing these objectives.
Solar flares are explosive transient phenomena, in which free magnetic energy accumulated in the solar corona is promptly released and converted to other forms of energy—kinetic, thermal, and nonthermal. This energy release manifests itself throughout the entire electromagnetic wavelength range, from radio waves to gamma-rays. These manifestations are highly different in the various wavelength regimes; thus, revealing complementary facets of the solar flare. Flare manifestations in the radio domain are very diverse. At the meter and decimeter wavelengths, ≲ 1 GHz, radio emission is mainly produced by nonthermal electrons via coherent emission mechanisms. For example, such emissions can be produced by electron beams or shock waves. At higher frequencies, the flaring radio emission is dominated by the incoherent gyrosynchrotron emission produced by nonthermal electrons spiraling in the ambient magnetic field. Thermal free-free emission may also contribute, especially in the preflare and late decay phases. At the sub-THz range, observations of flare emission are limited. Several observed cases show that the sub-THz emission may represent a continuation of the nonthermal gyrosynchrotron spectrum, or show a distinct component that rises with frequency. Some contribution from thermal free-free emission is always present in the sub-THz range.
One chromospheric or photospheric manifestation of solar flares are the so-called white-light flares. These are defined as strong enhancements in the white-light continuum, associated with highly energetic flares, although white-light flares have also been observed during moderately energetic flares ∼M5 (e.g. Svestka, 1976; Neidig and Cliver, 1983; Machado et al., 1989). Different mechanisms for their generation have been proposed, ranging from particle bombardment to wave-particle interactions. These mechanisms try to explain the sudden heating of the chromospheric/photospheric material to temperatures conducive to the emission in the white-light wavelength band. How the flare energy or at least a fraction of it is deposited in the lower atmospheric layers and converted into heat is still a topic of active research. Some of the proposed mechanisms are: bombardment by non-thermal electrons (e.g. Hudson, 1972; Aboudarham and Henoux, 1986), proton/ion bombardment Machado et al. (1978), soft X-ray and/or EUV irradiation, dissipation of Alfven waves and chromospheric backwarming Machado et al. (1989). The close spatial and temporal relation between the hard X-rays observed by the Reuven Ramaty High Energy Spectroscopic Imager (RHESSI) spacecraft and white-light emission (e.g. Battaglia and Kontar, 2011; Martínez Oliveros et al., 2011; Martínez Oliveros et al., 2012; Kuhar et al., 2016) suggest that non-thermal electron responsible for the hard X-ray emission are likely responsible for the white-light enhancements Ding (2007).
Flares have been associated with helioseismic signatures observed in the solar photosphere and propagating in the solar interior (Kosovichev and Zharkova, 1998). These helioseismic signatures, called sunquakes, are believed to be the photospheric and subphotospheric responses to flares and the changing magnetic and chromospheric conditions prompted by flares. Several mechanisms for their generation have been proposed. Some of these generation mechanisms can be grouped into the following: particle heating or bombardment (e.g. Kosovichev and Zharkova, 1998; Lindsey and Donea, 2008; Zharkova, 2008; Zharkov et al., 2013) and Lorentz force “induction” (e.g. Hudson et al., 2008; Alvarado-Gómez et al., 2012). It is still not clear if there is a unique generation mechanism or depending on chromospheric and photospheric conditions there is one more dominant. What is clear is that there is, in general, a spatial and temporal relation between enhancements in HXR and WL emissions and the location and timing of sunquakes (Buitrago-Casas et al., 2015).
In the ultraviolet (UV) range the emission is a combination of thermal free-free continuum and spectral lines produced by various ions in different ionization states. UV emission may form at various heights from the chromosphere to the corona, depending on the ion. For example, UV emission can trace flare ribbons formed due to precipitation of the nonthermal particles accelerated in the coronal portion of the flare to the dense and cool chromosphere. In the extreme UV (EUV) range, the emission is dominated by the hot corona. The EUV emission in the course of flares is mainly driven by the plasma response to the flaring energy deposition; this could be direct heating at or near reconnection sites, or heating due to Coulomb loss of the flare-accelerated particles. It is important to note that the EUV emission is dominated by spectral lines produced by ions; thus, the spectral shapes of these lines are sensitive to the ion velocity distributions including nonthermal broadening detected in some cases.
Next, the soft X-ray (SXR) spectral range is primarily dominated by thermal emission of the hot flaring plasma, hotter than the plasma producing the bulk of the EUV emission. The SXR-emitting plasma can either be heated directly or by the nonthermal particles accelerated in flares. The more energetic hard X-ray (HXR) emission is dominated by bremsstrahlung produced due to collisions of nonthermal electrons with ambient plasma. The highest energy photons, gamma-rays, are produced by several processes due to electrons or ions accelerated in flares. The nonthermal relativistic electrons (and positrons) produce a continuum component due to bremsstrahlung, while nonthermal ions/nuclei produce numerous gamma-ray lines and a continuum component due to decay of pions produced in nuclear collisions.
We see that each regime of the electromagnetic spectrum illuminates solar flares from its own perspective. Examining a flare in a particular energy range typically clarifies some scientific questions, but also produces new questions, which, in order to answer, often requires data taken in another range of the spectrum. This paper attempts to review what science questions can be solved or at least clarified by examining millimeter and sub-THz data obtained with high spatial, temporal, and spectral resolution, with an emphasize on ALMA solar capabilities.
Several previous studies hint at interesting physics in the early phases of flares, yet leave important questions unanswered. For instance, Hudson et al. (2021) find evidence using GOES/XRS data for hot plasma emission in the soft X-ray (SXR) regime prior to the main flare impulsive phase, suggesting a separate precursor heating process. Battaglia et al. (2009) additionally find that flares observed in HXRs by RHESSI sometimes show thermal components much earlier than the nonthermal counterparts. This finding is inconsistent with the thick-target flare model, in which plasma is heated primarily due to energy deposition by energetic electrons. If this result should hold, it would require conduction or, alternatively, energetic ions, to be the primary means of energy transfer between the corona and the chromosphere early in the flare. However, microwave studies (e.g., Altyntsev et al., 2012) showed that such cases may be due to insufficient HXR sensitivity, and that there could be nonthermal electrons very early in the flare, as one of the first signatures of a flare in progress. There have been other detections (e.g., Asai et al., 2006) of nonthermal emission in the pre-flare phase for large flares using microwave and HXR observations. Some early impulsive (“cold”) flares do not show any pre-flare phase, but do begin with a prominent nonthermal phase (Bastian et al., 2007; Lysenko et al., 2018). Evidence of superhot plasma arising near the reconnection site via direct heating has also been observed in early flare HXR measurements (Caspi and Lin, 2010; Caspi et al., 2014) as well as in the microwave measurements (Gary and Hurford, 1989; Fleishman et al., 2015).
Studies of EUV and UV emission show additional evidence of activity in the early flare phases. Certain EUV and UV lines in the chromosphere and transition region are highly responsive to the presence of accelerated electrons and can therefore provide an indirect, yet sensitive, measure of their presence (e.g., Testa et al., 2020). Panos and Kleint (2020), Panos et al. (2018), and Woods et al. (2021) provide further examples of early flare signatures, finding that there are distinct characteristics of the Mg II handk line features measured by the Interface Region Imaging Spectrograph (IRIS) during the pre-flare and impulsive phases compared to non-flaring intervals. Other studies using Hinode/SOT have found chromospheric indicators before the flare start (e.g., Bamba et al., 2013).
In short, previous studies are inconclusive as to whether the thick-target flare model holds in the early phases of flares. The high sensitivity of ALMA can potentially answer this question by picking out very faint signatures of plasma heating and nonthermal electrons in early flare and pre-flare phases, and also by identifying the location of these signatures. Spectral measurements permitting an unambiguous determination of the emission mechanism, thermal or nonthermal, are needed. Measurements in a single ALMA band or a combination of them could work here. The latter requires the use of subarrays, which is not yet offered at the time of this writing. Various ALMA bands could be helpful for preflare studies, although the lowest frequency bands one and two might be preferable as they provide the largest field of view, thus, maximizing chances to catch a flare.
Flares involve the major restructuring of active region magnetic field and are associated with the conversion of magnetic energy into thermal, non-thermal, and kinetic energy and high-energy electromagnetic radiation. The latter can have a significant impact on the ionization of the Earth’s atmosphere and thus affect communications, alter satellite trajectories and even damage space-borne instrumentation. However, while the arrival time and, to some extent, geoeffectiveness of coronal mass ejections can be modeled and predicted, giving some form of early warning of the onset of a geomagnetic storm, this is not possible for flares (which have emission that reaches the near Earth environment very quickly), so that the only way to minimize their impact would be to forecast their occurrence before they happen.
Flares occur in active regions, following a slow build-up of magnetic energy which gets suddenly released in one or more flare reconnection events (Benz, 2017), but the precise location of these reconnections has not been identified. Various types of observations have shown that reconnection could happen in photospheric, chromospheric and coronal structures; the intrinsically small scale of reconnection provides an additional difficulty in directly observing it (Wang et al., 2017). Most studies have been directed towards identifying the conditions in which reconnection may happen, and identifying observational signatures of the build-up of either magnetic energy or the emergence of magnetic configurations that may lead to such events.
Significant efforts have been devoted towards identifying precursor signatures of flare events from ground-based and space observations, with varying degrees of success. There are three classes of precursors proposed (Aschwanden, 2020): 1) those involving the presence of specific features in photospheric magnetic structures (such as shear, penumbra type, length of polarity inversion line, etc); 2) those involving some type of magnetic configuration change observed in the photospheric magnetic field (such as helicity injection, new photospheric flux emergence and so on); and 3) direct observation of precursor activity in UV, EUV or X-ray observations, assumed to be related to the main flare itself (e.g. enhanced turbulence, brightenings at many wavelengths, line broadening, jets). More recently, machine learning techniques have also been applied in a two pronged effort aimed at both 1) identify precursor patterns not readily detectable in available data sets, and 2) at utilizing such precursors to glean information about which processes are responsible for flare triggering, and where do they take place (Chen et al. (2019); Bobra and Ilonidis (2016) and references therein).
The vast majority of the suggested precursors relies on some type of photospheric magnetic field observations for two reasons. First, flares being magnetic phenomena, it makes sense to utilize magnetic field observations; second, both line-of-sight and vector photospheric magnetic field observations at high resolution are routinely available from ground and space-based instrumentation. However, these observations are limited to the photosphere, and while they can determine photospheric field distribution, strength and structure, provide magnetic field boundaries to theoretical models, and detect the emergence of new flux from the solar interior, they fail to provide direct measurements at the reconnection locations, which are located at larger heights (e.g., Chen et al., 2020).
Magnetic field measurements in the solar corona might provide better tools for flare forecasting, but are far more scanty and difficult to obtain from ground-based or space-born observatories, so that they can not constitute a viable tool to identify precursors and build an active region monitoring system capable of forecasting flares (Landi et al., 2016). In fact, instruments observing in the visible and near-infrared wavelength range can only observe the solar corona at the limb; narrow-band EUV and X-ray imaging instruments do not have the diagnostic capabilities necessary to measure coronal magnetic fields, while among available or planned EUV high-resolution spectrometers, only Hinode/EIS includes a Magnetically Induced Transition (MIT) (Fe X 257.26 Å), which is the only spectral line in the EUV range capable of detecting magnetic fields in the solar corona (Li et al. (2015); Li et al. (2016)).
However, recent work suggested that the coronal magnetic field may indeed provide signatures that suggest the imminence of a solar flare. In fact, a new diagnostic technique which utilizes the Fe X MIT allows the use of EUV spectra to measure the strength of the magnetic field in the solar corona maintaining the arcsecond-size spatial resolution typical of high-resolution EUV spectrometers (Si et al. (2020); Landi et al. (2020)). Such a technique was applied by Landi et al. (2021) to a series of EIS spectrally-resolved images taken before, during and after a C2.0 flare. Landi et al. (2021) found that within 22 min of flare onset the magnetic field measured with the Fe X MIT line underwent a strong enhancement at a location which later corresponded to the footpoints of post-flare loops; also, this magnetic field enhancement stored enough magnetic energy to power then entire flare, and was completely dissipated during the flare (see Figure 1). A similar conclusion has been made for an X8.3 limb flare with the imaging microwave spectroscopy technique (Fleishman et al., 2020).
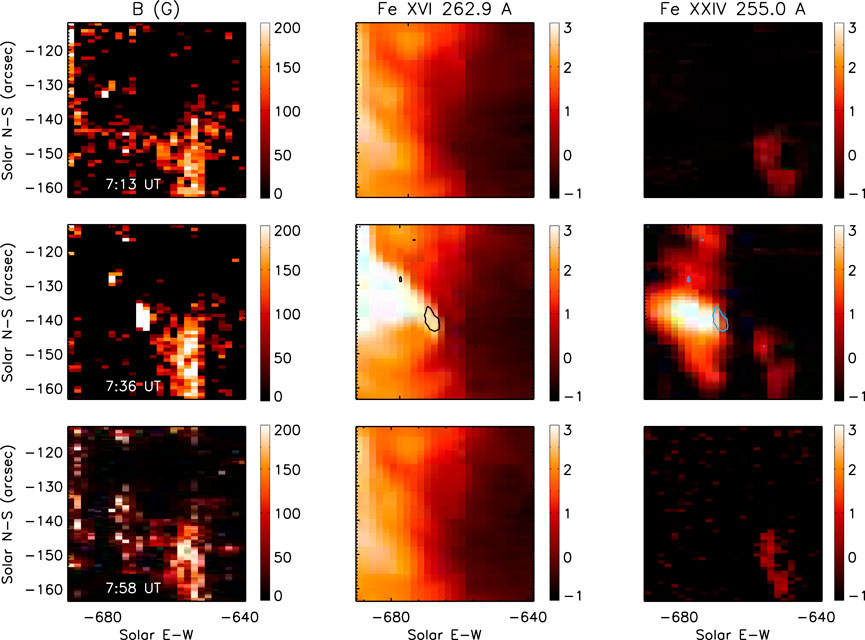
FIGURE 1. Maps of the magnetic field strength B (left column), and of the intensity (log10 values, in erg cm−2s−1sr−1) of the Fe XVI 262.9 Å line (center column) and Fe XXIV 255.0 Å line (right column) as observed 22 min before the C2.0 flare on 24 Aug 2007 (top row), during the flare (middle row), and after the flare (bottom row). In the middle row, the magnetic field strength stronger than 250 G is superimposed as a contour plot in the Fe XVI and Fe XXIV images during the flare.
The results of Landi et al. (2021) raise more questions than they answer, due to their intrinsic limitations. They point to a new window where magnetic field energy build-up can be directly observed before the flare, possibly suggesting a precursor activity that can provide at the same time an early warning of possible flare activity, and an indication of the energy available to the flare. However, these results need to be confirmed with other flare observations, which however are not available yet. Furthermore, the EIS observations used by Landi et al. (2021) were taken with a rastering slit spectrometer, so that the field of view was limited, not observed simultaneously, and the cadence was slow (22 min). Also, Hinode/EIS only includes one magnetically-sensitive spectral line (Fe X 257.26 Å), which can provide measurements of the magnetic field only in the temperature range where the Fe X ion is formed, around 1 MK. What is really needed are measurements of the coronal magnetic field at multiple heights (and hence temperatures) spanning from the chromosphere to the lower corona, which can complement both Hinode/EIS measurement of the magnetic field at 1 MK on one side, and be associated to changes in photospheric and coronal plasma structures routinely observed in many wavelength ranges on the other.
Coronal magnetic field can be inferred from the microwave imaging observations due to sensitivity of the radio emission to the ambient magnetic field in two main radiation processes: the free-free emission and the gyroresonance (GR) emission. The latter may occur at the frequencies below ∼40 GHz (Anfinogentov et al., 2019) at some rare cases, but typically at much lower frequencies. At the higher frequencies, the free-free emission from the chromosphere dominates, whose degree of polarization provides diagnostics of LOS component of the magnetic field. Free-free emission at various frequencies is formed at various heights of the solar chromosphere (Loukitcheva et al., 2017); thus, observing this emission at a range of ALMA frequencies will permit recovering the LOS B component over a corresponding range of heights.
Combining photospheric (optical), chromospheric (ALMA), and coronal (radio) measurements of the magnetic field, one can build an evolving height profile of the magnetic field over these three elements of the solar atmosphere. This will help determine where the preflare changes of the magnetic field are the most prominent and what dedicated observations could the optimal to address the fundamental physics that leads to the flare and then use this knowledge to forecast the flare. Measurements of the magnetic field with ALMA require polarimetric observations. The degree of polarization of the free-free emission increases with the magnetic field, while decreases with the frequency. This implies that observations in band one and two could be most favorable for this study. On the other hand, probing magnetic field in deeper chrompsphere may require higher-frequency bands to be used.
Nonthermal electrons accelerated in solar flares produce nonthermal emissions—primarily, HXR, gamma-ray, and radio. Of particular importance are the highest energy particles because these highest energies tell us about the acceleration efficiency and, thus, about the involved acceleration mechanism(s). The highest energy, relativistic electrons (and positrons if present) can be detected in the gamma-ray range and at the radio wavelengths. The diagnostic potential of the gamma-rays is somewhat limited because (i) there are other competing contributions in the gamma-ray range; (ii) only a minor subset of solar flares is detected in the gamma-ray range above background; and (iii) there are no gamma-ray instruments with high spatial resolution. The radio domain is free from these limitations.
The nonthermal radio emission is dominated by the gyrosynchrotron (GS) process, where the emission is produced by electrons spiraling in the ambient magnetic field. The GS emission in solar flares is characterized by a spectrum that typically has a spectral peak at the microwave range, while falls following roughly power-laws towards lower and higher frequencies. Supplementary videos to (Fleishman et al., 2020) display dependence of the GS spectrum on the key physical parameters including the high-energy cut-off of the nonthermal electron spectrum. This high-energy cut-off mainly affects the high-frequency end of the GS spectrum. Sometimes, even emission at microwave frequencies (dozens GHz or so) may be sensitive to the high-energy cutoff value (see, e.g., Fleishman et al., 2016), while in other cases the high-energy end of the nonthermal electron spectrum affects emission at higher frequencies at the mm/sub-mm range covered by ALMA.
Microwave spectroscopy observations permit measuring magnetic field, plasma density, and nonthermal electron properties with high spatial and temporal resolution (Fleishman et al., 2020). The available diagnostics employing the EOVSA data in 1–18 GHz range provide the number density, the spectral index, and (in some cases) the low-energy cut-off; however, the high-frequency cut-off cannot reliably be determined in most cases because of the lack of the high-frequency observations. To estimate the high-energy end of the electron spectrum, we need to combine EOVSA measurements in the microwave range and ALMA measurements in the mm or/and sub-mm range. ALMA spatial resolution in any configuration is sufficient to complement the EOVSA one. Yet, combining data from two different instruments represents a challenge as the maps from those instruments have to be carefully aligned and consistent calibrations and background subtractions performed. Once done, the combined EOVSA-ALMA data sets will help uniquely investigate the high-energy end of the nonthermal electron spectrum, which is inconceivable with any other instrument or a combination thereof.
It is yet unclear how the flare energy is divided between nonthermal electrons and nuclei and also between different nucleus species. The diagnostics of the accelerated ions at the flare site is highly limited because of their big masses, which makes inefficient most of the radiative processes by the ions such as gyrosynchrotron radiation or bremsstrahlung. Some information about the accelerated ions is available from the deexcitation gamma-ray lines and from high-energy gamma-ray continuum produced by decay of π0 particles produced in high-energy nuclear interactions.
Another product of the high-energy nuclear interactions is the relativistic positrons, which are low-mass particles and so are efficient emitters of the gyrosynchrotron radiation and bremsstrahlung. Thus, intensity of these continuum emissions from the positrons can be high enough to be detected in observations. However, there is a great challenge of how to distinguish the positron contributions from more well-known emissions produced by the electrons accelerated in the flare.
To address this challenge we note that the fast electrons and positrons are created differently in flares. The electrons are somehow accelerated from the original thermal Maxwellian distribution forming a nonthermal tail falling with energy from a few keV to a few Mev with a reasonably steep spectral slop. In contrast, the positrons are created as relativistic particles at or above 1 MeV from β+ decay or at even higher energies from π+ decay (Murphy et al., 2005). Some of flare-produced radioactive nuclei experience β+ decay (Ramaty et al., 1979), N → N′ + e+ + νe, where N is the original radioactive nucleus, e.g. 11C or 15O, N′ is the final nucleus, e+ is the positron and νe is the electron neutrino. The β+ decay time varies from a fraction of second to hours depending on the nucleus. Another option is the decay of π+ particles (Dermer, 1986), π+ → μ+ + νμ,
It is difficult to do using the gamma-ray continuum they generate because the positron-produced bremsstrahlung spectrum is indistinguishable from the electron-produced one. However, the situation with the gyrosynchrotron emission is remarkably much more promising, because this emission is circularly polarized with the senses opposite for oppositely charged particles, electrons and positrons. Fleishman et al. (2013) described a method of identification of the microwave emission produced by positrons and presented a 2000-Mar-13 flare in which the corresponding signature is detected.
Figure 2 illustrates the idea of the methodology: if a high-energy spectrum is dominated by positrons then a proportionally high-frequency GS emission will be dominated by the positrons, too. This GS component has the ordinary mode circular polarization in contrast to the extraordinary mode polarization produced by the electrons. The polarization of the radio emission is a standard observable in the form of the right-hand-side (RCP) or left-hand-site (LCP) circular polarization. The association between these observables and the ordinary and extraordinary modes depends on the direction of the line-of-sight (LOS) component of the magnetic field at the source. Thus, imaging radio data complemented by spatially resolved magnetic measurements are needed to distinguish the electron and positron contributions to the GS emission.
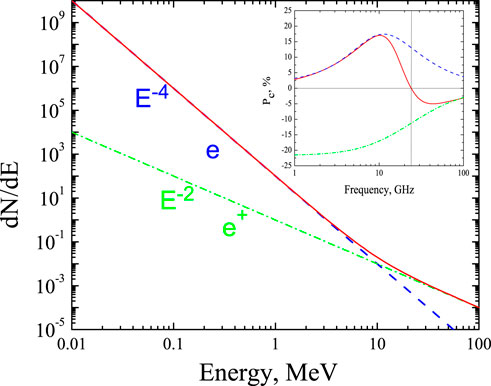
FIGURE 2. A cartoon illustrating a distinct contribution by relativistic positrons to GS emission. An assumed power-law energy spectrum of nonthermal electrons (dashed blue) with a typical spectral index of four and a schematic flat power-law energy spectrum of positrons (dash-dotted green) are shown in the main panel. Note that real spectra of relativistic positrons may deviate from the power-law, but contain a bump in the 1–10 MeV range. In this example, the total number of electrons is almost six orders of magnitude larger than the number of positrons. The red solid curve shows the composite spectrum dominated by electrons at low energies and by positrons at high energies. Circular polarization of the GS emission produced by these two components, appropriately color-coded, and by their composition is shown in the inset. The positron contribution results in the polarization reversal at a high frequency shown by red arrow. The demarcation frequency depends on the magnetic field at the radio source and the crossing point in the energy spectra and can vary between dozens and hundreds GHz.
Fleishman et al. (2013) identified several events, where the microwave emission at 35 GHz was likely produced by the positrons. They described in some detail the cleanest 2000-Mar-13 case, where the wave-mode identification was straightforward because of simple on-disk source morphology. Additional evidence in favor of the positron origin of the high-frequency emission in this event comes from the quantitative modeling of its spectrum. Figure 3 presents the observed microwave spectrum (filled circles) at the peak flare time at 3.75–35 GHz. The dashed curve displays a model GS spectrum produced by nonthermal electrons with a broken power-law energy spectrum derived from spectral fit of the detected HXR spectrum (Gan et al., 2001). Other parameters of the model source are selected such as to match the low-frequency part of the radio spectrum. The high-frequency emission is underestimated by this model. To make up for this mismatch we added a relativistic positron population with the parameters printed in the left panel. This overall minor population is indeed capable of bringing the full spectrum in agreement with the observed one (note that radio emissions produced by electrons and positrons add together at high frequencies, where the emission is optically thin, but the spectrum is completely dominated by the electron opacity at low frequencies, where the emission is optically thick). The right panel of the Figure shows the measured and modeled polarization. The modeled polarization matches the observed one well at 35 GHz, while overestimates it at the lower frequencies. This is likely due to nonuniformity of the real source, which is ignored in the model.
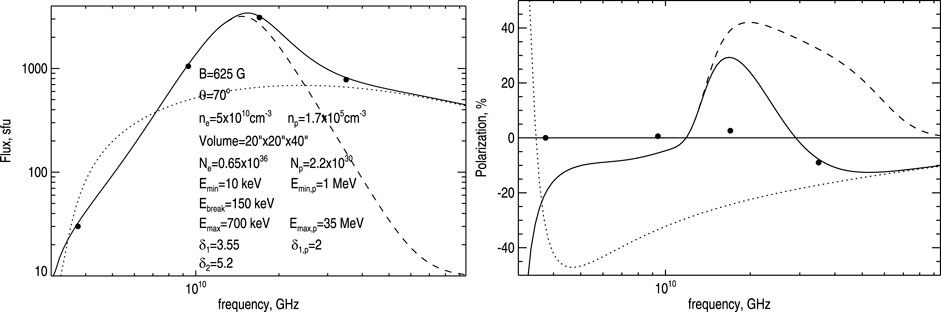
FIGURE 3. Microwave observations and a single-zone GS model (parameters of the model are printed in the left panel) for the 2000 March 13 event. The broken power-law spectrum of the nonthermal electrons is taken from Gan et al. (2001) derived from analysis of the HXR spectrum. The magnetic field value and the source dimensions are taken such as to match the low-frequency measurements. The resulting microwave spectrum (dashed curve) underestimates the emission at high frequencies. Adding emission produced by a relativistic positron component (dotted curve) offers a good match at all frequencies. Note that these two components are optically thin at high frequencies, so the contributions add up, while the opacity at tlow frequencies is solely determined by the electron contribution, so the positron component has no effect on the total spectrum at the low frequencies. The model also offers a correct sense and value of the polarization at the highest frequency, 35 GHz (see text for the details).
In this example the positron contribution to the GS spectrum seems to dominate at a relatively low frequency, 35 GHz, although our estimates suggests that in more typical cases such contributions could become dominant at much higher frequencies,
Spectrum of nonthermal gyrosynchrotron emission falls with frequency at the mm/sub-mm range; see the example in Figure 4. In such cases, the high-frequency source is rather compact,
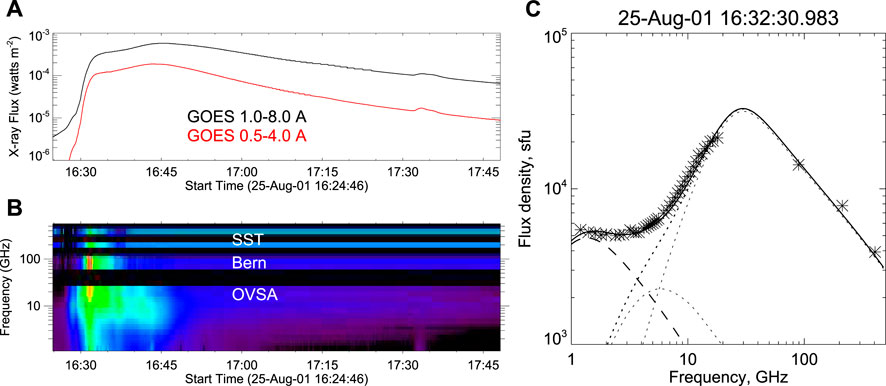
FIGURE 4. An example of a SOL 2001-08-25T16:23 flare with, perhaps, the most broadband nonthermal radio emission. (A) GOES light curves shown for the context; (B) the multi-instrument dynamic spectrum of the at 1–405 GHz; (C) the measured and model spectrum of the flare at the peak time 16:32:31 UT. The model assumes Emax =10 MeV. From Fleishman et al. (2017); reproduced by permission of the AAS.
We conclude that observing solar flares with ALMA can advance our understanding of the flare physics. We described several science questions, where we expect either incremental of breakthrough progress with the appropriately set up ALMA observations. We expect, however, that most impressive discoveries will made in areas, which we do not currently foresee.
All authors listed have made a substantial, direct, and intellectual contribution to the work and approved it for publication.
GF was supported in part by NSF grants AGS-2121632, and AST-1820613 80NSSC20K0627, 80NSSC19K0068, 80NSSC20K0718, and 80NSSC18K1128 to New Jersey Institute of Technology. EL was supported by NASA grants 80NSSC18K0647, 80NSSC18K1553, 80NSSC22K0750 and NSF grant AGS-1621686. JM was supported by NASA grants 80NSSC18K1250, NNX16AG89G, 80NSSC21K0521. LG was supported by NSF CAREER grant AGS 1752268 and NASA grants 80NSSC20K0627 and 80NSSC20K0718.
The authors declare that the research was conducted in the absence of any commercial or financial relationships that could be construed as a potential conflict of interest.
All claims expressed in this article are solely those of the authors and do not necessarily represent those of their affiliated organizations, or those of the publisher, the editors and the reviewers. Any product that may be evaluated in this article, or claim that may be made by its manufacturer, is not guaranteed or endorsed by the publisher.
Aboudarham, J., and Henoux, J. C. (1986). Non-thermal excitation and ionization of hydrogen in solar flares. I. Effects on a flaring chromosphere. A&A 168, 301–307.
Altyntsev, A. A., Fleishman, G. D., Lesovoi, S. V., and Meshalkina, N. S. (2012). Thermal to nonthermal energy partition at the early rise phase of solar flares. ApJ 758, 138. doi:10.1088/0004-637X/758/2/138
Alvarado-Gómez, J. D., Buitrago-Casas, J. C., Martínez-Oliveros, J. C., Lindsey, C., Hudson, H., and Calvo-Mozo, B. (2012). Magneto-acoustic energetics study of the seismically active flare of 15 february 2011. Sol. Phys. 280, 335–345. doi:10.1007/s11207-012-0009-6
Anfinogentov, S. A., Stupishin, A. G., Mysh’yakov, I. I., and Fleishman, G. D. (2019). Record-breaking coronal magnetic field in solar active region 12673. ApJ 880, L29. doi:10.3847/2041-8213/ab3042
Asai, A., Nakajima, H., Shimojo, M., White, S. M., Hudson, H. S., and Lin, R. P. (2006). Preflare nonthermal emission observed in microwaves and hard X-rays. Publ. Astron Soc. Jpn. 58, L1–L5. doi:10.1093/pasj/58.1.L1
Aschwanden, M. J. (2020). Global energetics of solar flares. XI. Flare magnitude predictions of the GOES class. ApJ 897, 16. doi:10.3847/1538-4357/ab9630
Bamba, Y., Kusano, K., Yamamoto, T. T., and Okamoto, T. J. (2013). Study on the triggering process of solar flares based onhinode/sot observations. ApJ 778, 48. doi:10.1088/0004-637X/778/1/48
Bastian, T. S., Fleishman, G. D., and Gary, D. E. (2007). Radio spectral evolution of an X‐ray-poor impulsive solar flare: Implications for plasma heating and electron acceleration. ApJ 666, 1256–1267. doi:10.1086/520106
Battaglia, M., Fletcher, L., and Benz, A. O. (2009). Observations of conduction driven evaporation in the early rise phase of solar flares. A&A 498, 891–900. doi:10.1051/0004-6361/200811196
Battaglia, M., and Kontar, E. P. (2011). Height structure of X-ray, EUV, and white-light emission in a solar flare. A&A 533, L2. doi:10.1051/0004-6361/201117605
Bobra, M. G., and Ilonidis, S. (2016). Predicting coronal mass ejections using machine learning methods. ApJ 821, 127. doi:10.3847/0004-637X/821/2/127
Buitrago-Casas, J. C., Martínez Oliveros, J. C., Lindsey, C., Calvo-Mozo, B., Krucker, S., Glesener, L., et al. (2015). A statistical correlation of sunquakes based on their seismic and white-light emission. Sol. Phys. 290, 3151–3162. doi:10.1007/s11207-015-0786-9
Caspi, A., Krucker, S., and Lin, R. P. (2014). Statistical properties of super-hot solar flares. ApJ 781, 43. doi:10.1088/0004-637X/781/1/43
Caspi, A., and Lin, R. P. (2010). RHESSI line and continuum observations of super-hot flare plasma. ApJ 725, L161–L166. doi:10.1088/2041-8205/725/2/L161
Chen, B., Shen, C., Gary, D. E., Reeves, K. K., Fleishman, G. D., Yu, S., et al. (2020). Measurement of magnetic field and relativistic electrons along a solar flare current sheet. Nat. Astron. 4, 1140–1147. doi:10.1038/s41550-020-1147-7
Chen, Y., Manchester, W. B., Hero, A. O., Toth, G., DuFumier, B., Zhou, T., et al. (2019). Identifying solar flare precursors using time series of SDO/HMI images and SHARP parameters. Space weather. 17, 1404–1426. doi:10.1029/2019SW002214
Dermer, C. D. (1986). Binary collision rates of relativistic thermal plasmas. II - Spectra. ApJ 307, 47. doi:10.1086/164391
Ding, M. D. (2007). The origin of solar white-light flares. In Phys. Chromospheric Plasmas, eds. P. Heinzel, I. Dorotovič, and R. J. Rutten (San Francisco: Astronomical Society of the Pacific Conference Series) 368, 417
Fleishman, G. D., Altyntsev, A. T., and Meshalkina, N. S. (2013). Microwave signature of relativistic positrons in solar flares. Publ. Astron Soc. Jpn. 65, S7. doi:10.1093/pasj/65.sp1.S7
Fleishman, G. D., Gary, D. E., Chen, B., Kuroda, N., Yu, S., and Nita, G. M. (2020). Decay of the coronal magnetic field can release sufficient energy to power a solar flare. Science 367, 278–280. doi:10.1126/science.aax6874
Fleishman, G. D., and Kontar, E. P. (2010). Sub-thz radiation mechanisms in solar flares. ApJ 709, L127–L132. doi:10.1088/2041-8205/709/2/L127
Fleishman, G. D., Nita, G. M., and Gary, D. E. (2017). A large-scale plume in an X-class solar flare. ApJ 845, 135. doi:10.3847/1538-4357/aa81d4
Fleishman, G. D., Nita, G. M., and Gary, D. E. (2015). Energy partitions and evolution in a purely thermal solar flare. ApJ 802, 122. doi:10.1088/0004-637X/802/2/122
Fleishman, G. D., Xu, Y., Nita, G. N., and Gary, D. E. (2016). Validation of the coronal thick target source model. ApJ 816, 62. doi:10.3847/0004-637X/816/2/62
Gan, W. Q., Li, Y. P., and Chang, J. (2001). Energy shortage of nonthermal electrons in powering a solar flare. ApJ 552, 858–862. doi:10.1086/320574
Gary, D. E., and Hurford, G. J. (1989). A simple solar microwave burst observed with high spectral resolution. ApJ 339, 1115. doi:10.1086/167366
Hudson, H. S., Fisher, G. H., and Welsch, B. T. (2008). “Flare energy and magnetic field variations,”. Editors R. Howe, R. W. Komm, K. S. Balasubramaniam, and G. J. D. Petrie. Subsurf. Atmos. Influ. Sol. Activity (San Francisco, CA: Astronomical Society of the Pacific Conference Series), 383, 221.
Hudson, H. S., Simões, P. J. A., Fletcher, L., Hayes, L. A., and Hannah, I. G. (2020). Hot X-ray onsets of solar flares. Mon. Not. R. Astron. Soc. 501, 1273–1281. doi:10.1093/mnras/staa3664
Hudson, H. S. (1972). Thick-target processes and white-light flares. Sol. Phys. 24, 414–428. doi:10.1007/BF00153384
Kaufmann, P., Raulin, J.-P., Correia, E., Costa, J. E. R., de Castro, C. G. G., Silva, A. V. R., et al. (2001). Rapid submillimeter brightenings associated with a large solar flare. Astrophys. J. 548, L95–L98. doi:10.1086/318932
Kaufmann, P., Trottet, G., Giménez de Castro, C. G., Raulin, J.-P., Krucker, S., Shih, A. Y., et al. (2009). Sub-terahertz, microwaves and high energy emissions during the 6 december 2006 flare, at 18:40 UT. Sol. Phys. 255, 131–142. doi:10.1007/s11207-008-9312-7
Kontar, E. P., Motorina, G. G., Jeffrey, N. L. S., Tsap, Y. T., Fleishman, G. D., and Stepanov, A. V. (2018). Frequency rising sub-THz emission from solar flare ribbons. A&A 620, A95. doi:10.1051/0004-6361/201834124
Kosovichev, A. G., and Zharkova, V. V. (1998). X-ray flare sparks quake inside Sun. Nature 393, 317–318. doi:10.1038/30629
Krucker, S., Giménez de Castro, C. G., Hudson, H. S., Trottet, G., Bastian, T. S., Hales, A. S., et al. (2013). Solar flares at submillimeter wavelengths. Astron. Astrophys. Rev. 21, 58. doi:10.1007/s00159-013-0058-3
Kuhar, M., Krucker, S., Oliveros, J. C., Battaglia, M., Kleint, L., Casadei, D., et al. (2016). Correlation of hard X-ray and white light emission in solar flares. ApJ 816, 6. doi:10.3847/0004-637X/816/1/6
Landi, E., Habbal, S. R., and Tomczyk, S. (2016). Coronal plasma diagnostics from ground-based observations. J. Geophys. Res. Space Phys. 121, 8237–8249. doi:10.1002/2016JA022598
Landi, E., Hutton, R., Brage, T., and Li, W. (2020). Hinode/EIS measurements of active-region magnetic fields. ApJ 904, 87. doi:10.3847/1538-4357/abbf54
Landi, E., Li, W., Brage, T., and Hutton, R. (2021). Hinode/EIS coronal magnetic field measurements at the onset of a c2 flare. ApJ 913, 1. doi:10.3847/1538-4357/abf6d1
Li, W., Grumer, J., Yang, Y., Brage, T., Yao, K., Chen, C., et al. (2015). A novel method to determine magnetic fields in low-density plasma facilitated through accidental degeneracy of quantum states in Fe9+. ApJ 807, 69. doi:10.1088/0004-637X/807/1/69
Li, W., Yang, Y., Tu, B., Xiao, J., Grumer, J., Brage, T., et al. (2016). Atomic-level pseudo-degeneracy of atomic levels giving transitions induced by magnetic fields, of importance for determining the field strengths in the solar corona. ApJ 826, 219. doi:10.3847/0004-637X/826/2/219
Lindsey, C., and Donea, A. C. (2008). Mechanics of seismic emission from solar flares. Sol. Phys. 251, 627–639. doi:10.1007/s11207-008-9140-9
Loukitcheva, M., White, S. M., Solanki, S. K., Fleishman, G. D., and Carlsson, M. (2017). Millimeter radiation from a 3D model of the solar atmosphere. A&A 601, A43. doi:10.1051/0004-6361/201629099
Lüthi, T., Lüdi, A., and Magun, A. (2004). Determination of the location and effective angular size of solar flares with a 210 GHz multibeam radiometer. A&A 420, 361–370. doi:10.1051/0004-6361:20035899
Lysenko, A. L., Altyntsev, A. T., Meshalkina, N. S., Zhdanov, D., and Fleishman, G. D. (2018). Statistics of "cold" early impulsive solar flares in X-ray and microwave domains. ApJ 856, 111. doi:10.3847/1538-4357/aab271
Machado, M. E., Emslie, A. G., and Avrett, E. H. (1989). Radiative backwarming in white-light flares. Sol. Phys. 124, 303–317. doi:10.1007/BF00156272
Machado, M. E., Emslie, A. G., and Brown, J. C. (1978). The structure of the temperature minimum region in solar flares and its significance for flare heating mechanisms. Sol. Phys. 58, 363–387. doi:10.1007/BF00157282
Martínez Oliveros, J.-C., Hudson, H. S., Hurford, G. J., Krucker, S., Lin, R. P., Lindsey, C., et al. (2012). The height of a white-light flare and its hard X-ray sources. ApJ 753, L26. doi:10.1088/2041-8205/753/2/L26
Martínez Oliveros, J. C., Couvidat, S., Schou, J., Krucker, S., Lindsey, C., Hudson, H. S., et al. (2011). Imaging spectroscopy of a white-light solar flare. Sol. Phys. 269, 269–281. doi:10.1007/s11207-010-9696-z
Murphy, R. J., Share, G. H., Skibo, J. G., and Kozlovsky, B. (2005). The physics of positron annihilation in the solar atmosphere. Astrophys. J. Suppl. S 161, 495–519. doi:10.1086/452634
Neidig, D. F., and Cliver, E. W. (1983). The occurrence frequency of white-light flares. Sol. Phys. 88, 275–280. doi:10.1007/BF00196192
Panos, B., Kleint, L., Huwyler, C., Krucker, S., Melchior, M., Ullmann, D., et al. (2018). Identifying typical Mg II flare spectra using machine learning. ApJ 861, 62. doi:10.3847/1538-4357/aac779
Panos, B., and Kleint, L. (2020). Real-time flare prediction based on distinctions between flaring and non-flaring active region spectra. ApJ 891, 17. doi:10.3847/1538-4357/ab700b
Ramaty, R., Kozlovsky, B., and Lingenfelter, R. E. (1979). Nuclear gamma-rays from energetic particle interactions. ApJS 40, 487–526. doi:10.1086/190596
Si, R., Brage, T., Li, W., Grumer, J., Li, M., and Hutton, R. (2020). A first spectroscopic measurement of the magnetic-field strength for an active region of the solar corona. ApJ 898, L34. doi:10.3847/2041-8213/aba18c
Testa, P., Polito, V., and Pontieu, B. (2020). IRIS observations of short-term variability in moss associated with transient hot coronal loops. ApJ 889, 124. doi:10.3847/1538-4357/ab63cf
Wang, H., Liu, C., Ahn, K., Xu, Y., Jing, J., Deng, N., et al. (2017). High-resolution observations of flare precursors in the low solar atmosphere. Nat. Astron. 1, 0085. doi:10.1038/s41550-017-0085
Woods, M. M., Sainz Dalda, A., and De Pontieu, B. (2021). Unsupervised machine learning for the identification of preflare spectroscopic signatures. ApJ 922, 137. doi:10.3847/1538-4357/ac2667
Zharkov, S., Green, L. M., Matthews, S. A., and Zharkova, V. V. (2013). Properties of the 15 february 2011 flare seismic sources. Sol. Phys. 284, 315–327. doi:10.1007/s11207-012-0169-4
Keywords: flares, sun, submm interferometry, gyrosynchrotron emission, thermal, positron
Citation: Fleishman GD, Martinez Oliveros JC, Landi E and Glesener L (2022) What aspects of solar flares can be clarified with mm/submm observations?. Front. Astron. Space Sci. 9:966444. doi: 10.3389/fspas.2022.966444
Received: 10 June 2022; Accepted: 19 August 2022;
Published: 21 September 2022.
Edited by:
Costas E. Alissandrakis, University of Ioannina, GreeceReviewed by:
Fabio Lepreti, University of Calabria, ItalyCopyright © 2022 Fleishman, Martinez Oliveros, Landi and Glesener. This is an open-access article distributed under the terms of the Creative Commons Attribution License (CC BY). The use, distribution or reproduction in other forums is permitted, provided the original author(s) and the copyright owner(s) are credited and that the original publication in this journal is cited, in accordance with accepted academic practice. No use, distribution or reproduction is permitted which does not comply with these terms.
*Correspondence: Gregory D. Fleishman, Z2ZsZWlzaG1AbmppdC5lZHU=
Disclaimer: All claims expressed in this article are solely those of the authors and do not necessarily represent those of their affiliated organizations, or those of the publisher, the editors and the reviewers. Any product that may be evaluated in this article or claim that may be made by its manufacturer is not guaranteed or endorsed by the publisher.
Research integrity at Frontiers
Learn more about the work of our research integrity team to safeguard the quality of each article we publish.