 Anders Ohma
 Karl Magnus Laundal
  Jone Peter Reistad
  Nikolai Østgaard
95% of researchers rate our articles as excellent or good
Learn more about the work of our research integrity team to safeguard the quality of each article we publish.
Find out more
ORIGINAL RESEARCH article
Front. Astron. Space Sci. , 20 September 2022
Sec. Space Physics
Volume 9 - 2022 | https://doi.org/10.3389/fspas.2022.958749
This article is part of the Research Topic Understanding the Causes of Asymmetries in Earth's Magnetosphere-Ionosphere System View all 11 articles
The By component of the magnetic field inside the magnetosphere is positively correlated with the By component of the Interplanetary Magnetic Field (IMF). This leads to asymmetries in aurora, plasma convection and electric currents between the northern and southern hemispheres It has been demonstrated that magnetic conjugate locations in the northern and southern ionosphere become less displaced during magnetospheric substorms, which are associated with enhanced reconnection in the near-Earth tail. Here we directly address how the average By component in the magnetotail evolves relative to substorm onset by performing a superposed epoch analysis of the magnetic field observed at nightside geosynchronous orbit during periods with dominant IMF By. The observations demonstrate that the average |By| in the magnetotail increases during the loading phase prior to onset. |By| maximizes in the expansion phase and is subsequently reduced during the remaining unloading phase. The observed trends become more pronounced using substorm onset lists that on average identify stronger substorms. Since dayside reconnection dominates over tail reconnection during the loading phase, whereas tail reconnection dominates during the unloading phase, the results demonstrate how asymmetries build up during periods with low tail reconnection and are reduced during periods with enhanced tail reconnection in agreement with previous case studies of conjugate auroral substorm features.
The By component of the magnetic field inside the magnetosphere, on both open and closed field lines, is positively correlated with the Interplanetary Magnetic Field (IMF) By component (e.g. Fairfield, 1979; Cowley and Hughes, 1983; Lui, 1984; Kaymaz et al., 1994; Wing et al., 1995; Petrukovich et al., 2005; Case et al., 2021). An intrinsic part of having such an induced By component on closed field lines is a relative displacement of magnetic conjugate locations in the two hemispheres. This displacement is seen in auroral observations (Liou et al., 2001; Frank and Sigwarth, 2003; Østgaard et al., 2004, 2011a; Reistad et al., 2013, 2016).
The first physical description of how the IMF By component enters the magnetosphere was put forward by Cowley (1981), who proposed that the asymmetries arise through the convection cycle: When a significant By component is present in the IMF, the field lines reconnecting at the dayside magnetospause are added asymmetrically to the lobes due to the magnetic tension force acting on these newly opened field lines. The field lines are added more toward dawn in the northern hemisphere and more toward dusk in the southern hemisphere for IMF By > 0 and more toward dusk in the northern hemisphere and more toward dawn in the southern hemisphere for IMF By < 0. This asymmetric loading causes asymmetric convection in the lobes; towards dusk in the northern hemisphere and dawn in the southern hemisphere for positive IMF By and vice versa for negative IMF By. The By component subsequently enters the closed magnetosphere as the field lines reconnect in the tail.
Khurana et al. (1996) suggested a different scenario for introducing a By component in the closed magnetosphere. They argue that asymmetric loading of magnetic flux in the two lobes for IMF By ≠ 0 affect the closed magnetosphere directly by pressure waves, setting up an asymmetric convection between the two hemispheres and leading to a displacement of the magnetic field lines, introducing the asymmetries more directly. Tenfjord et al. (2015, 2017, 2018) used magnetohydrodynamic (MHD) modeling and magnetometer observations at geosynchronous orbit, and showed a response of the magnetospheric system consistent with this view. Both simulations and observations show that the By component inside the closed magnetosphere responds to the IMF By component in about 10 min and that the field reconfigures to the IMF By component in about 1 hour. Other studies have reported longer time lags between IMF By and magnetotail By, suggested to be consistent with By being introduced into the closed magnetosphere by tail reconnection (Motoba et al., 2011; Rong et al., 2015; Browett et al., 2017). However, these studies do not consider any direct or indirect measurements of the tail reconnection rate. The interpretation that tail reconnection introduces By is thus based solely on the inferred time lags, an interpretation that has been challenged (Tenfjord et al., 2017; Ohma et al., 2018).
Reconnection in the near-Earth tail maximizes during magnetospheric substorms, unloading magnetic flux and energy stored in the magnetotail (Hones, 1979; Dmitrieva et al., 2004; Milan et al., 2007). Substorms usually consist of three phases: (1) A growth phase prior to onset (McPherron, 1970), generally associated with southward IMF (Caan et al., 1977; Wild et al., 2009), during which dayside reconnection increases the open flux content in the magnetotail lobes, (2) an expansion phase (Akasofu, 1964), where the polar cap contracts as the aurora expands poleward and the open flux content in the lobes is reduced explosively and (3) a recovery phase, where the magnetosphere-ionosphere system reverts towards its pre-onset configuration. The substorm process represents a loading-unloading cycle of the magnetosphere, with a loading phase prior to onset and an unloading phase after onset. Magnetic pressure builds up in the lobes during the loading phase and decreases during the unloading phase (Caan et al., 1975, 1978; Coxon et al., 2018). Juusola et al. (2011) demonstrated how the occurrence of bursty bulk flows, which can be considered a proxy of tail reconnection, continues to increase throughout the expansion phase, maximizes in the beginning of the recovery phase and remains at an elevated level throughout the recovery phase. The unloading thus continues well into the recovery phase.
During the unloading phase, the magnetotail reconfigures from a stretched, tail-like configuration to a more dipolar configuration (Fairfield and Ness, 1970; Hones, 1979). The stretching of the tail during the loading phase corresponds to a strengthening of the |Bx| component and a weakening of the Bz component, whereas the dipolarization corresponds to a weakening of the |Bx| component and a strengthening of the Bz component. The dipolarization typically commences at radial distances of 7–10 RE in the midnight region a few minutes before the auroral onset is observed, and subsequently expands in all directions (Miyashita et al., 2009). Near midnight at geosynchronous orbit, the field is dipolarized in about 20 min (Liou et al., 2002).
There is a growing number of studies that observe a reduction of the north-south asymmetries during periods with enhanced near-Earth tail reconnection, opposing the view that the By associated asymmetries are introduced by tail reconnection. Østgaard et al. (2011b, 2018) and Ohma et al. (2018) examined the evolution of conjugate auroral features during substorms, and reported that the asymmetries at onset are reduced or even removed during the expansion phase. Grocott et al. (2010) performed a superposed epoch analysis of the ionospheric convection in both hemispheres relative to substorm onset, and showed that the IMF By control of the nightside convection on closed field lines disappears during substorms. Using convection data from the northern hemisphere, Reistad et al. (2018) found that the return flow pattern at lower latitudes on the nightside becomes more similar in both location and magnitude as the activity increases. Ohma et al. (2019) investigated the average plasma convection in the lobes, and found more north-south aligned convection during periods with enhanced tail activity. Recently, Ohma et al. (2021b) used MHD simulations with dominant IMF By to demonstrate that magnetic conjugate locations in the two hemispheres become less displaced during the unloading phase, associated with a significant increase in the tail reconnection rate. It has been argued by e.g. Østgaard et al. (2018) that the observed reduction is associated with the reduction of lobe pressure occurring in the period following substorm onset.
Few studies directly address how increased tail reconnection affect By in the closed magnetosphere. Cowley and Hughes (1983) parametrized their observations based on the Kp index–a measure of the general activity level and not specifically tail activity–and found that the average induced By decreases as the Kp value increases. Using measurements from Cluster neutral sheet crossings, Cao et al. (2014) also considered the Kp index, and found increasing By as Kp increases. However, they excluded neutral sheet crossings with high ion velocity to avoid the local influence of bursty bulk flow on the magnetic field, which could bias their data toward non-substorm intervals. The increased Kp thus represents increased dayside reconnection. Saita et al. (2011) used MHD simulations to study substorm-like events for non-zero IMF By. Their run with negative IMF By shows an enhancement of magnetotail By prior to onset and subsequently a reduction after onset, whereas their run with positive IMF By is more ambiguous. In three MHD runs presented by Ohma et al. (2021b), the mean By induced in the magnetotail consistently increases during the loading phase and decreases during the unloading phase.
In this study, we directly address how the large-scale By induced in the magnetotail is influenced by enhanced tail reconnection during periods with strong IMF By. We have done this using magnetic field measurements by Geostationary Operational Environmental Satellite (GOES) at geosynchronous orbit, and performed a superposed epoch analysis of the magnetic field observations relative to substorm onset. The data and method used in this study are described in the next section and the results of our analysis are presented in Section 3. We discuss the implications of the observations in Section 4 and conclude the paper in Section 5.
We use magnetic field measurements obtained by the fluxgate magnetometers on board GOES 8–15, which are all spacecraft operating on geosynchronous orbit above North America (Singer et al., 1996). This constellation of spacecraft is referred to as GOES for the rest of this manuscript. Data are available from December 1995 to December 2019 and are considered in Solar Magnetic (SM) coordinates. After temperature compensation, the accuracy of the instrument is 1 nT. The solar wind data used in this study are the omni 1-min data, which is time shifted to the bow shock (King and Papitashvili, 2005). This data are presented in Geocentric Solar Magnetic (GSM) coordinates. Note that the two coordinate systems have a common y-axis.
To identify substorms, we use three different substorm onset lists. The first is the onset list presented by Newell and Gjerloev (2011), which is based on identifying negative bays in the SML index (Gjerloev, 2012). This index is based on ∼100 magnetometers in the northern hemisphere, mainly at auroral latitudes, and quantifies the strength of the westward electrojet. Due to the large number of observatories in the auroral zone, the SML index is sensitive to auroral activations and therefore well suited to get a precise determination of substorm onset. The second onset list we use was presented by McPherron and Chu (2018). This list is based on the Midlatitide Positive Bay (MPB) index (Chu et al., 2015), which is based on 41 magnetometer observatories at mid-latitude in both hemispheres. We use a threshold level on the area of the bays of
To identify the average behavior of the large-scale By component in the magnetotail (and the orientation of the magnetic field), we perform a superposed epoch analysis of the observed field relative to substorm onset. Only data between 22 and 4 magnetic local time are included in the statistics (XSM < − 3.31 RE). A few clear outliers (spikes) have also been removed from the GOES data. To select periods with dominant IMF By, only onsets where the mean IMF clock angle θCA in a 120-min window centered at onset is between −135° and −45° or between 45° and 135° are included. Intervals with less than 60 IMF vectors are discarded. We also ensure that the IMF orientation is stable in this interval by demanding that the circular variance within the 120-min interval is less than 0.1. This quantity is defined as
We subtract the background magnetic field at the GOES locations using the T01 model (Tsyganenko, 2002a,b) during each substorm event before we calculate the superposed averages. However, instead of using the instantaneous solar wind values, we use the average solar wind values in the 120-min interval centered at onset for each event. We also set IMF By = 0. This ensures that the background magnetic field model is static throughout the different substorm events, and that the full induced By component is observed. Observed changes are thus only based on measurements and not influenced by potential changes in the background model during the substorms.
After subtracting the background, we calculate the superposed mean and median values. This is done for each component of the magnetic field, in addition to the orientation of the magnetic field in the yz-plane as measured in SM coordinates. To estimate the errors we use bootstrapping, which is applicable without assuming that the data are normally distributed. For each time step relative to onset we make a 100 random samples of the data (with replacement). The standard deviation of the mean and median values calculated from these 100 samples represents the error.
3527 onsets in the N&G list, 3062 onsets in the McP&C list and 3151 onsets in the O&G list fulfill all the above criteria. Note that as the three onset lists aim to identify the same phenomena, they are not independent and often identify the same substorms. Regardless, we use several lists as there are significant differences between them. If we consider onsets identified within ±15 min between the three lists to be the same substorm, N&G and McP&C have 1214 shared onsets, N&G and O&G have 1170 shared onsets, and McP&C and O&G have 717 shared onsets. 472 onsets are shared between all three lists. Thus, a major part of the onsets are only present in one list and the observations turn out to be significantly affected by the choice of list. By presenting the result using three lists, similarities and differences between various lists are transparently displayed and directly comparable.
The superposed epoch analysis of the GOES magnetic field data relative to substorm onset is displayed in Figures 1–4, showing the mean values from 60 min before onset to 60 min after onset. The left column corresponds to −135 < θCA < − 45 and the right column corresponds to 45 < θCA < 135. Zero epoch indicates substorm onset, as identified by the N&G list (Figure 1), the McP&C list (Figure 2), the O&G list (Figure 3) and the control list (Figure 4). The first row in each figure displays the average IMF By (green) and IMF Bz (red), and the numbers in this panel indicate the number of substorms contributing to the statistics. The second row displays the superposed mean (blue) and median (orange) AL index. The mean and median Bx, By and Bz at geosynchronous orbit are shown in the third, forth and fifth row, respectively. The GOES magnetic field measurements have been labelled with Δ to signify that the observed deviations from the background T01 model are displayed. Note that the IMF is in Geocentric Solar Magnetic (GSM) coordinates, whereas the GOES data are in Solar Magnetic (SM) coordinates. The sixth panel displays how the superposed orientation of the magnetic field relative to the modelled field evolves in the yz-plane. For all six panels, the width of the curves indicate the error of the averages estimated using bootstrapping. Finally, the seventh row indicates the number of GOES vectors at each time step.
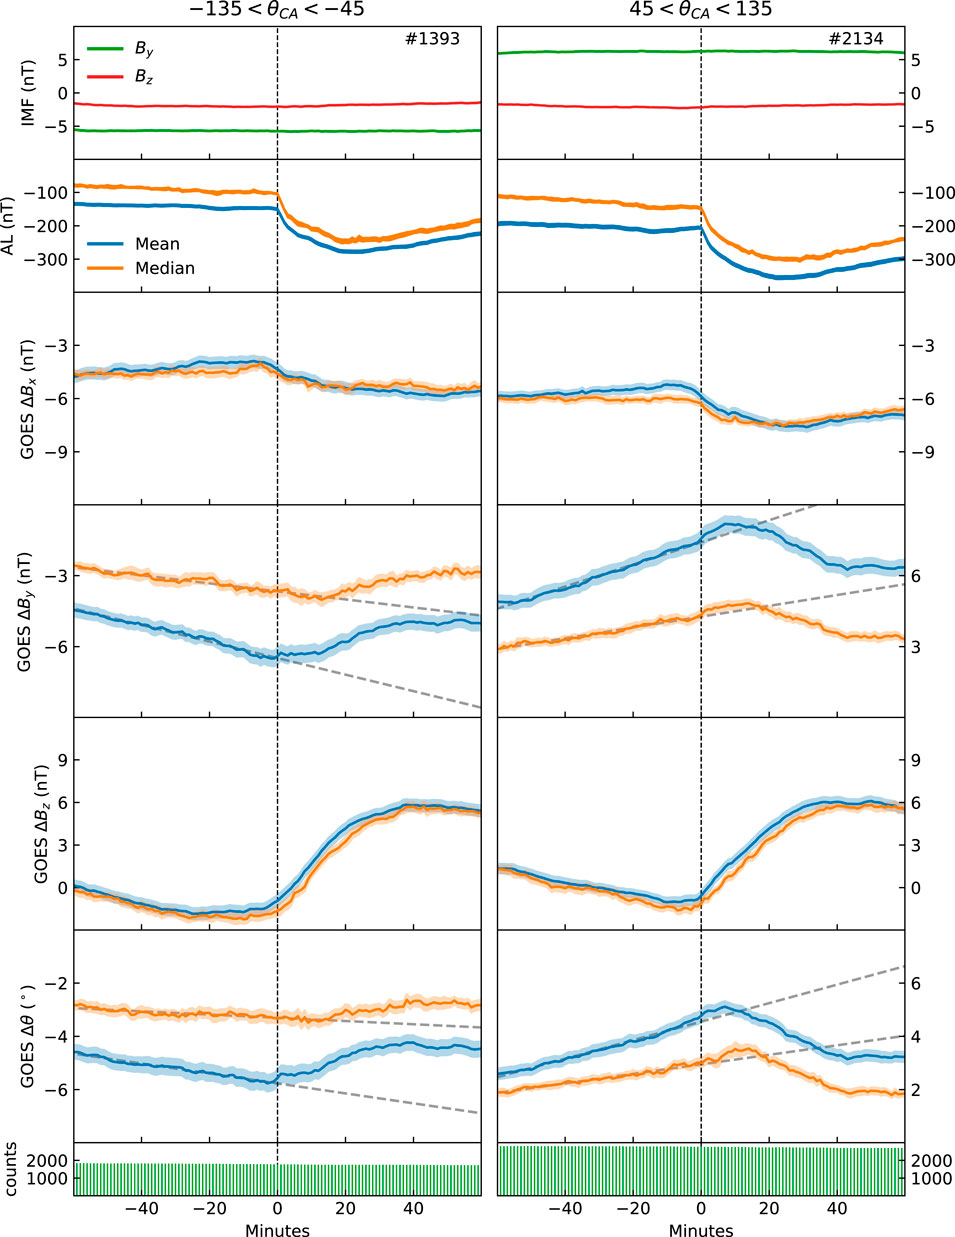
FIGURE 1. Superposed epoch analysis relative to substorm onset as identified by the N&G onset list. The rows display IMF By (green) and Bz (red), AL index, GOES ΔBx, ΔBy, ΔBz, Δθ and number of observations. Mean is blue, median is orange and curve widths indicate standard error.

FIGURE 2. Superposed epoch analysis relative to substorm onset as identified by the McP&C onset list, format as Figure 1.
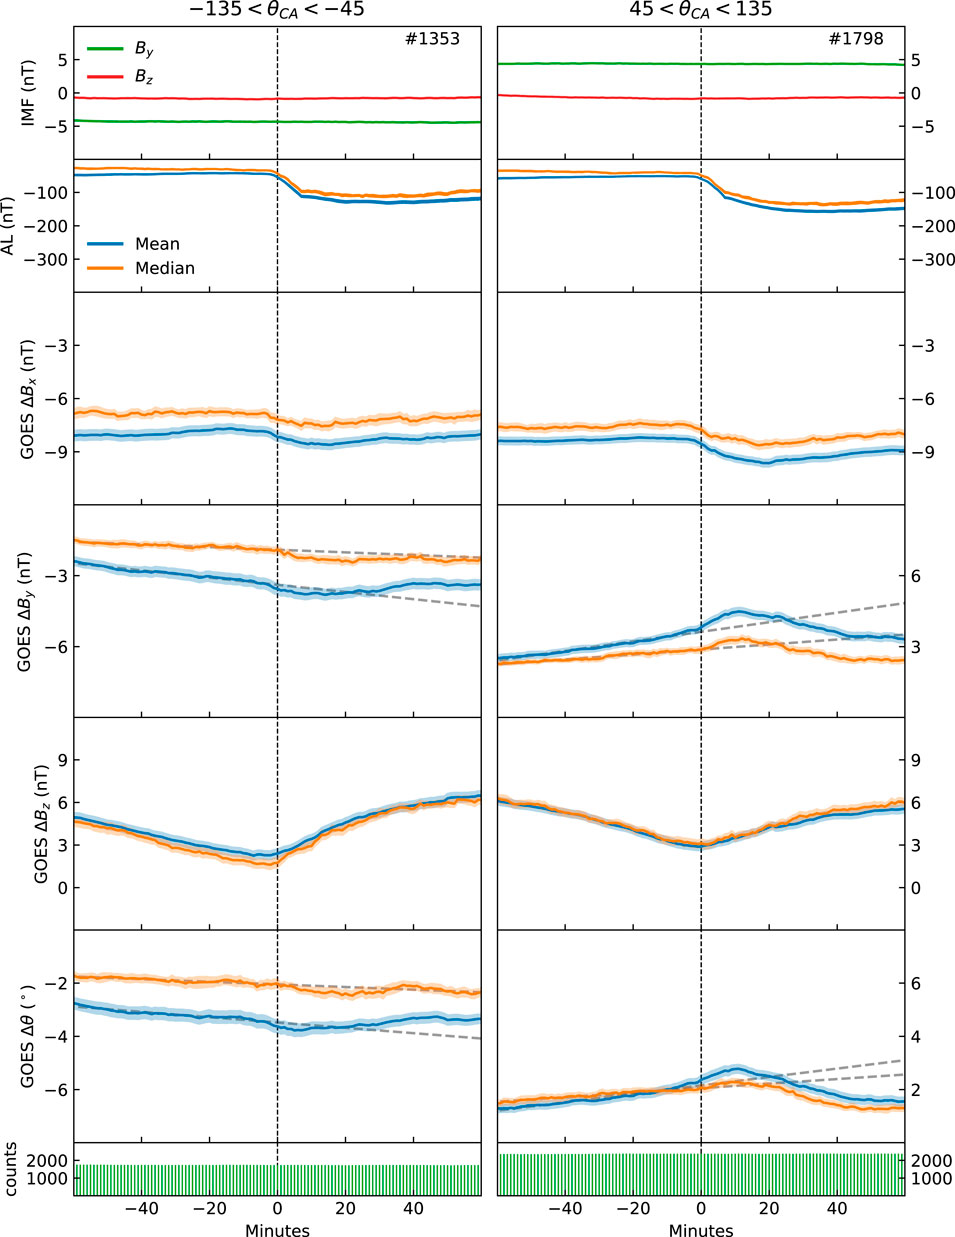
FIGURE 3. Superposed epoch analysis relative to substorm onset as identified by the O&G onset list, format as Figure 1.
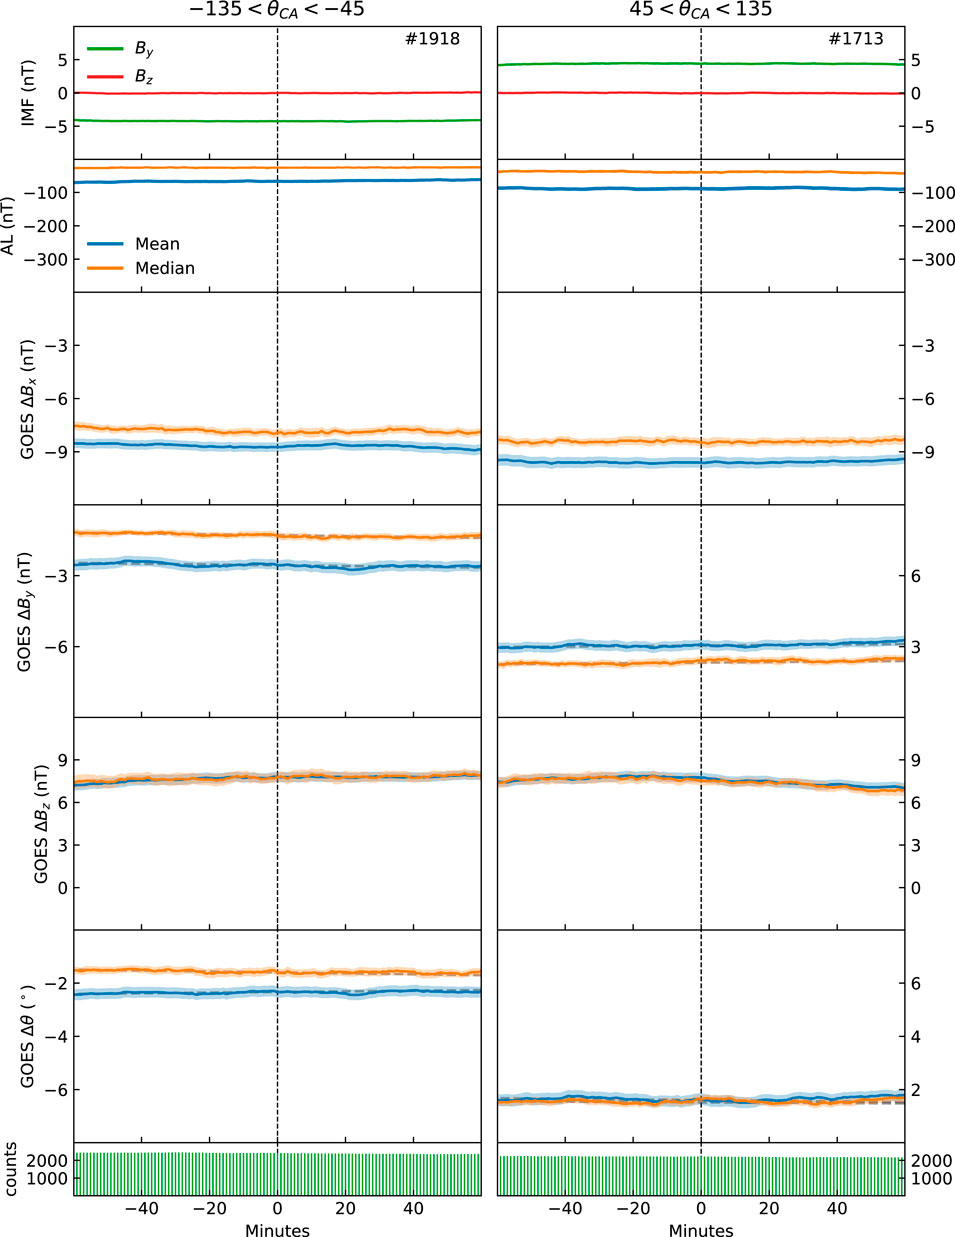
FIGURE 4. Superposed epoch analysis relative to randomly identified control times, format as Figure 1.
The trends observed in ΔBx and ΔBz in Figures 1–3, combined with the trend in the AL index, are consistent with the expected substorm behavior. There is a distinct negative bay in the AL index following onset in the three figures, and ΔBz is clearly weakened prior to onset and dipolarized after onset. The dipolarization occurs in 40 min. This is longer than the 20 min when only the midnight region is considered (Liou et al., 2002), and is a consequence of using data between 22 and 04 magnetic local time. A small increase in ΔBx before onset, followed by a clear weakening associated with the dipolarization, is observed in all panels. As evident from the figures, the changes in both ΔBx and ΔBz commence at or just before zero epoch, which is the expected behavior (Miyashita et al., 2009). The anticipated average evolution of these quantities relative to onset is thus captured by the statistics when considering the three real onset lists. Figure 4, which displays superposed statistics relative to randomly selected time steps, shows no signatures of substorm behaviour, as expected. This figure thus represents the average values for the solar wind conditions selected.
For the N&G list (Figure 1), clear peaks in |ΔBy| are observed at or following substorm onset. For negative IMF By, the observed ΔBy becomes increasingly negative prior to onset. Correspondingly, the observed ΔBy becomes increasingly positive prior to onset for positive IMF By. Consistent trends are seen in Δθ. As the trend prior to onset is near linear, we have made a linear fit based on the superposed values between -60 and 0 epoch time. These fits are shown as dashed lines, highlighting the changes that occur after onset. |ΔBy| and |Δθ| peak at or in the minutes after onset, followed by a decrease during the latter part of the expansion phase and the recovery phase. The peaks in the superposed medians constantly lag the peaks in the superposed means. The absolute value of the superposed means are consistently higher that the superposed medians, and the changes are more extreme. This indicates that the tail of the distributions changes more than its central values.
For the McP&C list (Figure 2), clear peaks are seen in both |ΔBy| and |Δθ| in all subset, except for the superposed median values during negative IMF By where the change is less pronounced. Again, the increase in |ΔBy| and |Δθ| are near linear prior to onset. Peaks occur within 20 epoch followed by a significant decrease. The changes are less pronounced than the corresponding changes when using the N&G list. However, the average onset signatures are also less pronounced (|ΔBz| and AL), indicating that the identified substorms are, on average, weaker. The differences between the superposed mean and median |ΔBy| and |Δθ| using the McP&C list are similar as when using the N&G list.
The superposed mean and median of |ΔBy| and |Δθ| using the O&G list are shown in Figure 3. The trends observed here deviate somewhat from that of the other two onset lists. The values increase linearly before onset, and peaks within 20 epoch, except the median for negative IMF By which does not have any clear peak. For positive IMF By, there is a clear increase following onset, before |ΔBy| and |Δθ| decrease significantly. For negative IMF By, the superposed means clearly change compared to the linear fit, whereas the superposed medians do not. The trends are thus similar, but even less pronounced than the trends seen in both Figure 1 and Figure 2. This can again be related to weaker average substorms, as indicated by the more vague substorm signatures in ΔBz and AL for the O&G list. As for the other onset lists, mean trends are more pronounced than median trends.
Finally, Figure 4 displays the superposed mean and median relative to randomly identified control times during similar conditions as the real substorm onset. For both positive and negative IMF By, |ΔBy| and |Δθ| remian at a constant level. The trends seen in Figures 1–3 thus deviate significantly from the trends in the control sample shown in Figure 4, becoming more pronounced as the average substorm strength increases. While the increase in |ΔBy| and |Δθ| before onset is gradual and near linear in all subsets, the response after onset is more variable between the lists and IMF By polarity. As seen in Figures 1–3, |ΔBy| and |Δθ| continue to increase after substorm onset in most subsets. For the superposed mean values, the peaks occur between −1 to 14 min relative to onset, with a mean delay of 7 min. The median values peak between 5 and 22 min after onset, with a mean delay of 14 min. The peaks are directly followed by a significant decrease in nearly all subsets, lasting to about 40 min after onset.
The standard errors of the averages, represented by the width of the curves in Figures 1–4, ranges from 0.1 to 0.4 nT. These rather narrow intervals are a result of the large number of GOES measurements at each epoch time (1500–3000). The standard deviation, however, ranges from 8 to 16 nT. This demonstrates that although the mean and median values are determined with high certainty, individual measurements and events can deviate considerably from these average values. In the above error estimates, we have neglected the 1 nT accuracy of the magnetometers. This seems rather crude, as this accuracy is comparable to the changes observed in Figures 1–3. However, if we assume that the instrumental uncertainty is systematic, it will only affect the magnitude and not the trends seen in Figure 1, on the other hand, the instrumental uncertainty is random, either between subsequent measurements or between events due to different calibration with time or between spacecraft, the error of the averages reduces as
The average GOES |By| on the nightside increases gradually and significantly during the growth phase. The mean |By| peaks within 20 min of onset, and is followed by a significant decrease during the latter part of the expansion phase and recovery phase. The increase in the induced |By| prior to onset clearly signifies that this component is introduced by another mechanism than tail reconnection, which is low during the loading phase (Dmitrieva et al., 2004; Juusola et al., 2011). Furthermore, |By| is reduced during the unloading phase, most distinctly between 15 and 40 min after onset, which is the period when the tail reconnection rate maximizes (Juusola et al., 2011). This decrease suggests that the induced By component is actually reduced by tail reconnection. These observational trends are consistent with the notion that asymmetries arise directly as a consequence of asymmetric loading of magnetic flux to the lobes (Khurana et al., 1996; Tenfjord et al., 2015) and that near-Earth tail reconnection acts to reduce these interhemispheric asymmetries (Ohma et al., 2018; Reistad et al., 2018; Østgaard et al., 2018).
The statistics indicate an apparent inconsistency with the view that increased tail reconnection removes asymmetries, specifically the clear peak seen after onset for positive IMF By in the N&G and O&G lists. This peak implies that tail reconnection enhances By at geosynchronous altitudes in the initial part of the expansion phase. However, this does not indicate that the asymmetric configuration of the magnetosphere-ionosphere system in general is caused by tail reconnection as the induced By component (1) has already been increasing significantly during the growth phase and (2) increases for some minutes following onset before it decreases significantly, whereas the tail reconnection rate continues to increase throughout the entire expansion phase (Juusola et al., 2011). The observed peak and delay before the induced By component is reduced do, however, indicate that the response is on a different time scale that the response in the Bx and Bz component, which both start their substorm related reconfiguration at or a few minutes before the identified onsets. This could imply that the reduction of |By| is a consequence of this reconfiguration rather than an integral part of the dipolarization front. There are several physical processes that can contribute to the observed delay between substorm onset and the clear reduction of induced By, as outlined in the following paragraphs.
It has been argued that the reduction of asymmetries during the unloading phase is related to the reduction of lobe pressure as open flux is being removed from the lobes by near-Earth tail reconnection (Ohma et al., 2018; Østgaard et al., 2018; Reistad et al., 2018). As pointed out by Ohma et al. (2018), the increased magnetic field magnitude associated with the dipolarization also increases the magnetic stiffness of the closed field line region, making it less affected by pressure gradient forces imposed by the lobe pressure. Coxon et al. (2018) used data from the Cluster spacecraft to investigate the evolution of the average lobe pressure relative to substorm onset. They find a 20-min plateau in the lobe pressure after onset before the pressure is reduced. A source of this delay could be that substorm reconnection initially commences on closed field lines (McPherron et al., 1973; Hones, 1979) and that a few minutes elapse before the first open field line reconnects (Hones et al., 1986; Baker et al., 1996). Based on auroral observations, it can take ∼10 min before the onset feature expands to the open-closed boundary (e.g. Elphinstone and Hearn, 1993; Milan et al., 2008). Furthermore, Juusola et al. (2011) demonstrated how the presence of fast flows in the tail, which can be considered as a proxy of the reconnection rate, build up during the expansion phase. There could thus be a delay before the nightside reconnection rate significantly surpasses the dayside reconnection rate to reduce the lobe pressure. The 20-min delay reported by Coxon et al. (2018) is in good agreement with the delay observed in this study. However, no clear delay between onset and the reduction of lobe pressure was seen by Caan et al. (1975, 1978) or Yamaguchi et al. (2004). Furthermore, Mende et al. (2003) showed that the polar cap on average contracts directly after onset based on a superposed epoch analysis of global far-ultraviolet auroral images.
In addition to considering the pressure balance between the lobes and the closed magnetotail, the transport and reconfiguration of the field within the tail must be considered. During the unloading phase, magnetic flux is transported Earthward from the reconnection region and the field lines become more dipolar. This leads to a pileup in the inner magnetosphere, increasing the magnetic field strength. If this occurs without changing the orientation of the field lines in the YZ-plane, both By and Bz increases. Since the ionospheric footpoint of magnetic field lines cannot move freely–there is a frictional force acting between the iononized plamsa, trying to follow the magnetic field lines, and the neutral atmosphere–it will likely be a delay before the field lines start to move substantially in the azimuthal direction due to inertia. If this is the case, the induced By will increase in the initial unloading phase, whereas the orientation remains about constant. Based on Figures 1–3, this is not completely the case as Δθ increases after onset in some subsets. It is also possible that the field lines that enter geosynchronous orbit during the initial unloading phase are more asymmetric that the field lines they replace, as these field lines where closed also prior to onset, but located farther tailward. As shown by e.g. Ohma et al. (2021b), the asymmetries are largest near the open-closed boundary, which corresponds to the most tailward located field lines of the closed magnetotail. These field lines could thus increase the asymmetry as they enter geosynchronous altitudes.
A sketch of how we envision the large-scale configuration of the magnetotail relative to substorm onset is shown in Figure 5 during positive IMF By conditions. Four different time steps relative to substorm onset are shown, where the field lines are red and the green dots indicates the geosynchronous location. The green vectors indicate the magnitude of induced By and the blue vectors the presence of Earthward flow.The loading phase typically begins ∼60 min before onset (Li et al., 2013). Asymmetric loading of magnetic flux has already been ongoing for some time at the beginning of the loading phase due to our restrictions on θCA, which means that the magnetotail is already asymmetric at t = −60. Since the dayside reconnection rate is larger than the nightside reconnection rate during this phase, there is a flux pileup in the lobes. The magnetic pressure therefore increases, resulting in increased pressure gradient forces acting on the closed magnetotail. This causes a gradual increase in the induced By between -60 and 0 epoch, as the applied force change the field line orientation. The process continues until t = 0, where the lobe pressure maximizes. As indicated the sketch, the field line located at geosynchronous orbit (dark red) at t = −60 remains at about the same location until t = 0, but becomes considerably more twisted.
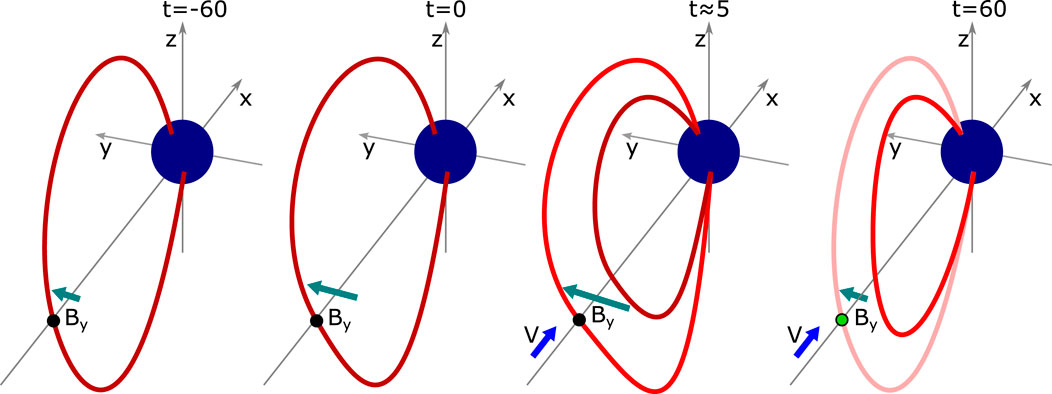
FIGURE 5. Configuration of magnetic field lines in the magnetotail at different stages of the substorm. There is a small positive By component at geosynchronous orbit (dark red field line) when the loading phase commences (t = −60 min). This By component increases gradually until substorm onset (t = 0 min) due to increased lobe pressure. In the initial unloading phase, By increases even more due to pileup of magnetic flux and transport of more asymmetric field lines (pure red) into geosynchronous orbit (t ≈ 5 min). The induced By then decreases, as newly closed field lines (light red) enter geosynchronous orbit and the lobe pressure is reduced (t = 60 min).
Reconnection commences in the magnetotail at t = 0, which cause the field lines in the inner magnetosphere to convect Earthward and dipolarize. In the first few minutes, reconnection occurs at closed field lines (e.g. Hones et al., 1986). In this initial unloading phase, the field lines keep or increase their orientation as they reconfigure, leading to an increase in By at geosynchronous orbit. At t ≈ 5, the induced By peaks. This is indicated in the sketch, where a new field line (clear red) with larger By has replaced the field line located there at onset (dark red). Sometime after onset (typically a few minutes), reconnection reaches the open-closed boundary and open lobe field lines starts to reconnect. The lobe pressure then decreases as the open flux is removed, which in turn increases the pressure in the closed flux region. In addition, the field lines that became asymmetric during the loading phase are effectively transported Earthward and replaced by newly closed field lines. Since the By component in the lobes is generally lower than the By component in the closed magnetosphere (Kaymaz et al., 1994), they are less asymmetric when they reconnect. Furthermore, due to the enhanced convection, they spend less time in the tail before they are transported away. The closed field lines are thus exposed to the asymmetric pressure distribution for a shorter amount of time compared to before onset, and are thus not able to become very asymmetric before they are themselves replaced by new field lines. In response to this combination of the decreased lobe pressure, increased magnetic pressure at closed field lines and stronger convection, the magnetotail reconfigures to a more symmetric state. In the sketch (t = 60), a new field line (light red) populates the geosynchronous orbit, with a significantly reduced By component due to the above effects.
Performing a superposed epoch analysis of the tail magnetic field at geosynchronous orbit relative to substorm onset during IMF By dominated periods, we have shown that the induced |By| component increases during the loading phase, peaks in the initial expansion phase and decreases during the remaining expansion and recovery phase. As anticipated, the peaks have the same polarity as the imposed IMF By component. The observed trends become more pronounced using substorm onset list that, on average, identify the strongest substorms. The observed evolution is consistent with asymmetric lobe pressure playing the major role in inducing By in the closed magnetotail (Khurana et al., 1996; Tenfjord et al., 2015) and that increased tail reconnection act to reduce the IMF By associated asymmetries (Ohma et al., 2018, 2021b; Reistad et al., 2018; Østgaard et al., 2018). The delay between substorm onset and the reduction of By observed at geosynchronous orbit is proposed to be caused by a combination of inertia, pileup of flux in the inner magnetosphere and a potential delay before lobe pressure decreases.
Publicly available datasets were analyzed in this study. This data can be found here: The solar wind data including the AL index used in this study can be found at https://cdaweb.gsfc.nasa.gov/sp_phys/data/omni/ and the GOES data at https://satdat.ngdc.noaa.gov/sem/goes/data/. The Newell and Gjerloev (2011) and Ohtani and Gjerloev (2020) substorm lists can be found at https://supermag.jhuapl.edu/substorms/.
AO had the idea for the study, performed the statistical analysis and wrote the manuscript. KL, JR and NØ helped develop the idea and supported the work throughout the process. All authors contributed to manuscript revision, read, and approved the submitted version.
This project was funded by the Norwegian Research Council under contracts 223252/F50 and 300844/F50, and by the Trond Mohn Foundation.
We acknowledge the substorm timing lists identified by Newell and Gjerloev (2011), McPherron and Chu (2018) and Ohtani and Gjerloev (2020), the SMU and SML indices (Newell and Gjerloev, 2011) and the SuperMAG collaboration (Gjerloev, 2012).
The authors declare that the research was conducted in the absence of any commercial or financial relationships that could be construed as a potential conflict of interest.
All claims expressed in this article are solely those of the authors and do not necessarily represent those of their affiliated organizations, or those of the publisher, the editors and the reviewers. Any product that may be evaluated in this article, or claim that may be made by its manufacturer, is not guaranteed or endorsed by the publisher.
Akasofu, S.-I. (1964). The development of the auroral substorm. Planet. Space Sci. 12, 273–282. doi:10.1016/0032-0633(64)90151-5
Baker, D. N., Pulkkinen, T. I., Angelopoulos, V., Baumjohann, W., and McPherron, R. L. (1996). Neutral line model of substorms: Past results and present view. J. Geophys. Res. 101, 12975–13010. doi:10.1029/95JA03753
Browett, S. D., Fear, R. C., Grocott, A., and Milan, S. E. (2017). Timescales for the penetration of IMF by into the Earth’s magnetotail. J. Geophys. Res. Space Phys. 122, 579–593. doi:10.1002/2016JA023198
Caan, M. N., McPherron, R. L., and Russell, C. T. (1977). Characteristics of the association between the interplanetary magnetic field and substorms. J. Geophys. Res. 82, 4837–4842. doi:10.1029/JA082i029p04837
Caan, M. N., McPherron, R. L., and Russell, C. T. (1975). Substorm and interplanetary magnetic field effects on the geomagnetic tail lobes. J. Geophys. Res. 80, 191–194. doi:10.1029/JA080i001p00191
Caan, M. N., McPherron, R. L., and Russell, C. T. (1978). The statistical magnetic signature of magnetospheric substorms. Planet. Space Sci. 26, 269–279. doi:10.1016/0032-0633(78)90092-2
Cao, J., Duan, A., Dunlop, M. W., Wei, X., and Cai, C. (2014). Dependence of IMF by penetration into the neutral sheet on IMF Bz and geomagnetic activity. J. Geophys. Res. Space Phys. 119, 5279–5285. doi:10.1002/2014JA019827
Case, N. A., Hartley, D. P., Grocott, A., Miyoshi, Y., Matsuoka, A., Imajo, S., et al. (2021). Inner magnetospheric response to the interplanetary magnetic field by component: Van allen probes and arase observations. JGR. Space Phys. 126, e2020JA028765. doi:10.1029/2020JA028765
Chu, X., Hsu, T.-S., McPherron, R. L., Angelopoulos, V., Pu, Z., Weygand, J. J., et al. (2014). Development and validation of inversion technique for substorm current wedge using ground magnetic field data. JGR. Space Phys. 119, 1909–1924. doi:10.1002/2013JA019185
Chu, X., McPherron, R. L., Hsu, T.-S., and Angelopoulos, V. (2015). Solar cycle dependence of substorm occurrence and duration: Implications for onset. JGR. Space Phys. 120, 2808–2818. doi:10.1002/2015JA021104
Cowley, S. W. H., and Hughes, W. J. (1983). Observation of an IMF sector effect in the Y magnetic field component at geostationary orbit. Planet. Space Sci. 31, 73–90. doi:10.1016/0032-0633(83)90032-6
Cowley, S. W. H. (1981). Magnetospheric asymmetries associated with the y-component of the IMF. Planet. Space Sci. 29, 79–96. doi:10.1016/0032-0633(81)90141-0
Coxon, J. C., Freeman, M. P., Jackman, C. M., Forsyth, C., Rae, I. J., and Fear, R. C. (2018). Tailward propagation of magnetic energy density variations with respect to substorm onset times. J. Geophys. Res. Space Phys. 123, 4741–4754. doi:10.1029/2017JA025147
Dmitrieva, N. P., Sergeev, V. A., and Shukhtina, M. A. (2004). Average characteristics of the midtail plasma sheet in different dynamic regimes of the magnetosphere. Ann. Geophys. 22, 2107–2113. doi:10.5194/angeo-22-2107-2004
Elphinstone, R. D., and Hearn, D. J. (1993). The auroral distribution and its relation to magnetospheric processes. Adv. Space Res. 13, 17–27. doi:10.1016/0273-1177(93)90306-V
Fairfield, D. H., and Ness, N. F. (1970). Configuration of the geomagnetic tail during substorms. J. Geophys. Res. 75, 7032–7047. doi:10.1029/JA075i034p07032
Fairfield, D. H. (1979). On the average configuraton of the geomagnetic tail. J. Geophys. Res. 84, 1950–1958. doi:10.1029/JA084iA05p01950
Frank, L. A., and Sigwarth, J. B. (2003). Simultaneous images of the northern and southern auroras from the Polar spacecraft: An auroral substorm. J. Geophys. Res. 108, 8015. doi:10.1029/2002JA009356
Gjerloev, J. W. (2012). The SuperMAG data processing technique. J. Geophys. Res. 117, A09213. doi:10.1029/2012JA017683
Grocott, A., Milan, S. E., Yeoman, T. K., Sato, N., Yukimatu, A. S., and Wild, J. A. (2010). Superposed epoch analysis of the ionospheric convection evolution during substorms: IMFBYdependence. J. Geophys. Res. 115, A00105. doi:10.1029/2010JA015728
Haaland, S. E., Paschmann, G., Förster, M., Quinn, J. M., Torbert, R. B., McIlwain, C. E., et al. (2007). High-latitude plasma convection from Cluster EDI measurements: Method and IMF-dependence. Ann. Geophys. 25, 239–253. doi:10.5194/angeo-25-239-2007
Hones, E. W., Fritz, T. A., Birn, J., Cooney, J., and Bame, S. J. (1986). Detailed observations of the plasma sheet during a substorm on april 24, 1979. J. Geophys. Res. 91, 6845–6859. doi:10.1029/JA091iA06p06845
Hones, E. W. (1979). Transient phenomena in the magnetotail and their relation to substorms. Space Sci. Rev. 23, 393–410. doi:10.1007/BF00172247
Juusola, L., Østgaard, N., and Tanskanen, E. (2011). Statistics of plasma sheet convection. J. Geophys. Res. 116, A08201. doi:10.1029/2011JA016479
Kaymaz, Z., Siscoe, G. L., Luhmann, J. G., Lepping, R. P., and Russell, C. T. (1994). Interplanetary magnetic field control of magnetotail magnetic field geometry: IMP 8 observations. J. Geophys. Res. 99, 11113–11126. doi:10.1029/94JA00300
Khurana, K. K., Walker, R. J., and Ogino, T. (1996). Magnetospheric convection in the presence of interplanetary magnetic fieldBy: A conceptual model and simulations. J. Geophys. Res. 101, 4907–4916. doi:10.1029/95JA03673
King, J. H., and Papitashvili, N. E. (2005). Solar wind spatial scales in and comparisons of hourly Wind and ACE plasma and magnetic field data. J. Geophys. Res. 110, A02104. doi:10.1029/2004JA010649
Li, H., Wang, C., and Peng, Z. (2013). Solar wind impacts on growth phase duration and substorm intensity: A statistical approach. J. Geophys. Res. Space Phys. 118, 4270–4278. doi:10.1002/jgra.50399
Liou, K., Meng, C.-I., Lui, A. T. Y., Newell, P. T., and Wing, S. (2002). Magnetic dipolarization with substorm expansion onset. J. Geophys. Res. 107, 1131. doi:10.1029/2001JA000179
Liou, K., Newell, P. T., Sibeck, D. G., Meng, C.-I., Brittnacher, M., and Parks, G. (2001). Observation of IMF and seasonal effects in the location of auroral substorm onset. J. Geophys. Res. 106, 5799–5810. doi:10.1029/2000JA003001
Lui, A. T. Y. (1984). “Characteristics of the cross-tail current in the Earth’s magnetotail,” in Magnetospheric currents. Editor T. A. Potemra (American Geophysical Union), 28, 158–170. doi:10.1029/GM028p0158
McPherron, R. L., and Chu, X. (2018). The midlatitude positive bay index and the statistics of substorm occurrence. JGR. Space Phys. 123, 2831–2850. doi:10.1002/2017JA024766
McPherron, R. L. (1970). Growth phase of magnetospheric substorms. J. Geophys. Res. 75, 5592–5599. doi:10.1029/JA075i028p05592
McPherron, R. L., Russell, C. T., Kivelson, M. G., and Coleman, P. J. (1973). Substorms in space: The correlation between ground and satellite observations of the magnetic field. Radio Sci. 8, 1059–1076. doi:10.1029/RS008i011p01059
Mende, S. B., Frey, H. U., Morsony, B. J., and Immel, T. J. (2003). Statistical behavior of proton and electron auroras during substorms. J. Geophys. Res. 108, 1339. doi:10.1029/2002JA009751
Milan, S. E., Boakes, P. D., and Hubert, B. (2008). Response of the expanding/contracting polar cap to weak and strong solar wind driving: Implications for substorm onset. J. Geophys. Res. 113, A09215. doi:10.1029/2008JA013340
Milan, S. E., Provan, G., and Hubert, B. (2007). Magnetic flux transport in the dungey cycle: A survey of dayside and nightside reconnection rates. J. Geophys. Res. 112, A01209. doi:10.1029/2006JA011642
Miyashita, Y., Machida, S., Kamide, Y., Nagata, D., Liou, K., Fujimoto, M., et al. (2009). A state-of-the-art picture of substorm-associated evolution of the near-earth magnetotail obtained from superposed epoch analysis. J. Geophys. Res. 114, A01211. doi:10.1029/2008JA013225
Motoba, T., Hosokawa, K., Ogawa, Y., Sato, N., Kadokura, A., Buchert, S. C., et al. (2011). In situ evidence for interplanetary magnetic field induced tail twisting associated with relative displacement of conjugate auroral features. J. Geophys. Res. 116, A04209. doi:10.1029/2010JA016206
Newell, P. T., and Gjerloev, J. W. (2011). Evaluation of SuperMAG auroral electrojet indices as indicators of substorms and auroral power. J. Geophys. Res. 116, A12211. doi:10.1029/2011JA016779
Ohma, A., Østgaard, N., Laundal, K. M., Reistad, J. P., Hatch, S. M., and Tenfjord, P. (2021b). Evolution of IMF by induced asymmetries: The role of tail reconnection. JGR. Space Phys. 126, e2021JA029577. doi:10.1029/2021JA029577
Ohma, A., Østgaard, N., Reistad, J. P., Tenfjord, P., Laundal, K. M., Moretto Jørgensen, T., et al. (2019). Observations of asymmetric lobe convection for weak and strong tail activity. J. Geophys. Res. Space Phys. 124, 9999–10017. doi:10.1029/2019JA026773
Ohma, A., Østgaard, N., Reistad, J. P., Tenfjord, P., Laundal, K. M., Snekvik, K., et al. (2018). Evolution of asymmetrically displaced footpoints during substorms. J. Geophys. Res. Space Phys. 123. doi:10.1029/2018JA025869
Ohma, A., Reistad, J. P., and Hatch, S. M. (2021a). Modulation of magnetospheric substorm frequency: Dipole tilt and IMF by effects. JGR. Space Phys. 126, e2020JA028856. doi:10.1029/2020JA028856
Ohtani, S., and Gjerloev, J. W. (2020). Is the substorm current wedge an ensemble of wedgelets?: Revisit to midlatitude positive bays. JGR. Space Phys. 125, e2020JA027902. doi:10.1029/2020JA027902
Østgaard, N., Humberset, B. K., and Laundal, K. M. (2011a). Evolution of auroral asymmetries in the conjugate hemispheres during two substorms. Geophys. Res. Lett. 38, L03101. doi:10.1029/2010GL046057
Østgaard, N., Laundal, K. M., Juusola, L., Åsnes, A., Haaland, S. E., and Weygand, J. M. (2011b). Interhemispherical asymmetry of substorm onset locations and the interplanetary magnetic field. Geophys. Res. Lett. 38, L08104. doi:10.1029/2011GL046767
Østgaard, N., Mende, S. B., Frey, H. U., Immel, T. J., Frank, L. A., Sigwarth, J. B., et al. (2004). Interplanetary magnetic field control of the location of substorm onset and auroral features in the conjugate hemispheres. J. Geophys. Res. 109, A07204. doi:10.1029/2003JA010370
Østgaard, N., Reistad, J. P., Tenfjord, P., Laundal, K. M., Rexer, T., Haaland, S. E., et al. (2018). The asymmetric geospace as displayed during the geomagnetic storm on 17 august 2001. Ann. Geophys. 36, 1577–1596. doi:10.5194/angeo-36-1577-2018
Petrukovich, A. A., Baumjohann, W., Nakamura, R., Runov, A., and Balogh, A. (2005). Cluster vision of the magnetotail current sheet on a macroscale. J. Geophys. Res. 110, A06204. doi:10.1029/2004JA010825
Reistad, J. P., Østgaard, N., Laundal, K. M., Ohma, A., Snekvik, K., Tenfjord, P., et al. (2018). Observations of asymmetries in ionospheric return flow during different levels of geomagnetic activity. J. Geophys. Res. Space Phys. 123, 4638–4651. doi:10.1029/2017JA025051
Reistad, J. P., Østgaard, N., Laundal, K. M., and Oksavik, K. (2013). On the non-conjugacy of nightside aurora and their generator mechanisms. J. Geophys. Res. Space Phys. 118, 3394–3406. doi:10.1002/jgra.50300
Reistad, J. P., Østgaard, N., Tenfjord, P., Laundal, K. M., Snekvik, K., Haaland, S. E., et al. (2016). Dynamic effects of restoring footpoint symmetry on closed magnetic field lines. J. Geophys. Res. Space Phys. 121, 3963–3977. doi:10.1002/2015JA022058
Rong, Z. J., Lui, A. T. Y., Wan, W. X., Yang, Y. Y., Shen, C., Petrukovich, A. A., et al. (2015). Time delay of interplanetary magnetic field penetration into Earth’s magnetotail. J. Geophys. Res. Space Phys. 120, 3406–3414. doi:10.1002/2014JA020452
Saita, S., Kadokura, A., Sato, N., Fujita, S., Tanaka, T., Ebihara, Y., et al. (2011). Displacement of conjugate points during a substorm in a global magnetohydrodynamic simulation. J. Geophys. Res. 116, A06213. doi:10.1029/2010JA016155
Singer, H., Matheson, L., Grubb, R., Newman, A., and Bouwer, D. (1996). “Monitoring space weather with the GOES magnetometers,” in GOES-8 and beyond. Editor E. R. Washwell (International Society for Optics and Photonics SPIE), 2812, 299–308. doi:10.1117/12.254077
Tenfjord, P., Østgaard, N., Haaland, S. E., Snekvik, K., Laundal, K. M., Reistad, J. P., et al. (2018). How the IMFByInduces a LocalByComponent during northward IMFBzand characteristic timescales. J. Geophys. Res. Space Phys. 123, 3333–3348. doi:10.1002/2018JA025186
Tenfjord, P., Østgaard, N., Snekvik, K., Laundal, K. M., Reistad, J. P., Haaland, S. E., et al. (2015). How the IMF By induces a By component in the closed magnetosphere and how it leads to asymmetric currents and convection patterns in the two hemispheres. J. Geophys. Res. Space Phys. 120, 9368–9384. doi:10.1002/2015JA021579
Tenfjord, P., Østgaard, N., Strangeway, R., Haaland, S. E., Snekvik, K., Laundal, K. M., et al. (2017). Magnetospheric response and reconfiguration times following IMF By reversals. J. Geophys. Res. Space Phys. 122, 417–431. doi:10.1002/2016JA023018
Tsyganenko, N. A. (2002a). A model of the near magnetosphere with a dawn-dusk asymmetry 1. Mathematical structure. J. Geophys. Res. 107, SMP 12-1–SMP 12-15. doi:10.1029/2001JA000219
Tsyganenko, N. A. (2002b). A model of the near magnetosphere with a dawn-dusk asymmetry 2. Parameterization and fitting to observations. J. Geophys. Res. 107, SMP 10-11–SMP 10-17. doi:10.1029/2001JA000220
Wild, J. A., Woodfield, E. E., and Morley, S. K. (2009). On the triggering of auroral substorms by northward turnings of the interplanetary magnetic field. Ann. Geophys. 27, 3559–3570. doi:10.5194/angeo-27-3559-2009
Wing, S., Newell, P. T., Sibeck, D. G., and Baker, K. B. (1995). A large statistical study of the entry of interplanetary magnetic field Y-component into the magnetosphere. Geophys. Res. Lett. 22, 2083–2086. doi:10.1029/95GL02261
Keywords: reduced asymmetry, tail reconnection, substorms, magnetotail reconfiguration, geosynchronous orbit, IMF By, magnetotail By, north-south asymmetries
Citation: Ohma A, Laundal KM, Reistad JP and Østgaard N (2022) Evolution of IMF By induced asymmetries during substorms: Superposed epoch analysis at geosynchronous orbit. Front. Astron. Space Sci. 9:958749. doi: 10.3389/fspas.2022.958749
Received: 01 June 2022; Accepted: 31 August 2022;
Published: 20 September 2022.
Edited by:
Olga Khabarova, Institute of Terrestrial Magnetism Ionosphere and Radio Wave Propagation (RAS), RussiaReviewed by:
Renata Lukianova, Space Research Institute, RussiaCopyright © 2022 Ohma, Laundal , Reistad and Østgaard . This is an open-access article distributed under the terms of the Creative Commons Attribution License (CC BY). The use, distribution or reproduction in other forums is permitted, provided the original author(s) and the copyright owner(s) are credited and that the original publication in this journal is cited, in accordance with accepted academic practice. No use, distribution or reproduction is permitted which does not comply with these terms.
*Correspondence: Anders Ohma, QW5kZXJzLk9obWFAdWliLm5v
Disclaimer: All claims expressed in this article are solely those of the authors and do not necessarily represent those of their affiliated organizations, or those of the publisher, the editors and the reviewers. Any product that may be evaluated in this article or claim that may be made by its manufacturer is not guaranteed or endorsed by the publisher.
Research integrity at Frontiers
Learn more about the work of our research integrity team to safeguard the quality of each article we publish.