 A. Ramón-Ballesta
 J. Pascual-Granado
 R. Garrido
94% of researchers rate our articles as excellent or good
Learn more about the work of our research integrity team to safeguard the quality of each article we publish.
Find out more
BRIEF RESEARCH REPORT article
Front. Astron. Space Sci., 22 July 2022
Sec. Stellar and Solar Physics
Volume 9 - 2022 | https://doi.org/10.3389/fspas.2022.948979
This article is part of the Research TopicChallenges of Asteroseismology in the Era of Space MissionsView all 12 articles
δ Scuti stars are intermediate-mass pulsators located in the classical Cepheid instability strip with spectral types ranging from A to F. In the last years, some authors found an amplitude and frequency modulation in some of these stars. In our work we have chosen the continuous wavelet transform as the more appropriate tool to perform a time-frequency analysis of the light curves of HD 174936 and HD 174966. We have chosen this tool because, unlike the short time Fourier transform, that uses a fixed windows size, the continuous wavelet transform uses short windows at high frequencies and long windows at low frequencies, making it like an adaptive analysis tool. In order to improve the resolution of the frequencies obtained by the continuous wavelet transform, we have also used the synchrosqueeze algorithm to “focus” the result. Then, we are capable to obtain a measure of the instantaneous frequencies of the signal in a wide range of frequencies. To check our results, we have compared them with the synchrosqueezed continuous wavelet transform of a synthetic signal generated with the frequencies previously obtained by a classical approach. Our results show that some frequencies are stable, at least within the observation run time, although some others show some kind of variation. This is the first time that such variations in the oscillation frequencies of HD 174936 and HD 174966 are reported.
The δ Scuti (δ Sct) stars (Baglin et al., 1973; Rodríguez et al., 2000) are intermediate-mass (i.e. between 1.5 and 3 solar masses) pulsators located in the classical Cepheid instability strip, near the main sequence or moving from the main sequence to the giant branch. Their spectral types range from A to F and they are multi-periodic pulsators with frequencies found between 3 d−1 and 80 d−1 (Aerts et al., 2010; Uytterhoeven et al., 2011). Thus, these stars are very good laboratories to test theories of angular momentum and chemical transport in stellar interiors.
Amplitude modulation in δ Sctstars has been found in recent years (see, e.g., Breger and Pamyatnykh, 2006; Breger et al., 2012; Barceló Forteza et al., 2015). Also, Bowman and Kurtz, (2014); Bowman et al. (2021) found amplitude and frequency modulation in some δ Scuti stars. Amplitude and/or frequency modulation has also been found in other type of stars (see, e.g., a brief compilation in Guzik et al., 2015, and references therein). These authors used a wavelet-based technique, different from the one use in this work, to study amplitude modulations in a sample of different pulsating stars.
In this work we analyse the stability of the oscillation frequencies of the δ Sctstars HD 174936 and HD 174966. We have applied an analysis based on the synchrosqueezed continuous wavelet transform (SSCWT from now on) to the CoRoT (Baglin et al., 2006) light curves of these stars. The curves contain about 27 days of observations for each star with 32 s of sampling. From this data, García Hernández et al. (2009) found 422 oscillation frequencies for HD 174936. The authors did not expect such a high number of frequencies in this star and they also found a flat distribution of lower amplitude peaks. This so-called grass has also been found in more stars observed with CoRoT (see, e.g., Poretti et al., 2009) and its origin has been a matter of debate (see Section 1 of de Franciscis et al., 2018, and references therein). They also found a large separation structure of 52 μHz in the frequency spectra. For HD 174966, García Hernández et al. (2013) found 185 frequencies with no grass effect. The authors also found a large separation structure of 65 μHz in the frequency spectra of both stars. In a recent study, Ramón-Ballesta et al. (2021) also included these stars in their search for the signature of the rotational splitting in the frequency spectra. They found a rotational splitting value of 26 μHz for HD 174936 and 19 μHz for HD 174966.
As the continuous wavelet transform requires the points to be equally spaced in time, we have previously filled the gaps using the MIARMA method developed by Pascual-Granado et al. (2015). We have compared our results with stationary synthetic time-series generated from the frequencies mentioned before. In particular, we have used the first 160 frequencies to generate the synthetic signal of HD 174936 and the 20 first frequencies to generate the synthetic signal of HD 174966. We needed less frequencies in this last star because the RMS improves much faster than for HD 174936 during the prewhitening cascade. With this article we aim to pave the way for a methodology that can be used in future studies.
This paper is organised as follows: in Section 2 we introduce the wavelet transform as the tool we used for the time-frequency analysis. In section 3 we show our results and discuss them. Finally, in Section 4 we present our conclusions.
The tool we have chosen to do the time-frequency analysis is the continuous wavelet transform (CWT from now on). Unlike the short time Fourier transform, that uses a fixed window size, the CWT uses short temporal windows at high frequencies and long temporal windows at low frequencies, thus making it an adaptive analysis tool. In the same sense, these frequency windows are longer at high frequencies than at low frequencies. This means that the frequency resolution is better at low frequencies and decreases as the frequency rises, as it will be explained in the following paragraphs. These sizes are automatically defined by the CWT algorithm. The CWT relies on the use of a mother wavelet ψ(t), i.e., a wave-like function of finite energy. This function can be scaled and shifted in a way that conserves the energy (Eq. (1)), thus generating daughter wavelets.
Here, a is the scale factor and b is the translation along the time axis. The choice of the mother wavelet is usually made to match the expected shape of the signal, i.e. a sinusoidal wavelet is used to analyse a sinusoidal signal to ensure the correlation between the wavelet and the signal. In the case of the time-frequency analysis of non-stationary time series generated by natural processes, one of the most used mother wavelets is the Morlet wavelet (see e.g. Percival and Walden, 2000). This wavelet can be expressed as in Eq. (2).
Here, σ is the parameter that defines the general trade-off between the temporal and the frequency precision,
The CWT of the signal s can then be defined as in Eq. (3) below. The CWT produces a matrix of power coefficients (see, e.g., Mallat, 2009) that we can represent in a scales versus time diagram. The power of the coefficients is then plotted using a colormap in arbitrary units.
A scale a can be related to a frequency f in several manners. One of the most used definitions of frequency is taking the central frequency of the wavelet as the actual frequency of that particular wavelet. If the signal contains the same frequency, the wavelet and signal will correlate in the CWT, thus providing a measure of the “instantaneous” frequency of the signal at each point. The choice of scales to perform the CWT is dependent on the sampling frequency and the length of the signal. The sampling frequency defines the maximum frequency (i.e., the Nyquist frequency) the CWT can scan (fmax = fs/2) and the length (L) of the signal defines the minimum frequency the CWT is capable of detecting (fmin ∝ 1/L). The relation between scales and frequencies obeys an inverse power law (i.e., f ∝ 1/a). The frequency resolution is related to the length in the temporal axis of the analysis window at that particular frequency and is translated as the width of the frequency band in the CWT plot. Due to that, the resolution is smaller at lower frequencies (because they require longer temporal windows) than the resolution at high frequencies. Consequently, the frequency bands in the plots will get wider as the frequency increases. Daubechies and Maes, (1996); Daubechies et al. (2011) proposed a “focusing” algorithm that they called synchrosqueezing in order to reduce the width of the frequency bands of the CWT. With this algorithm they reallocate the energy around a central frequency but preserving the time resolution, thus providing a better resolution in the frequency axis. This synchrosqueezed CWT (SSCWT) remains invertible so that the original signal can still be reconstructed and also reduces the background noise in the plots. This algorithm is implemented in Python as the ssqueezepy package (Muradeli, 2020), which we have used in our analysis.
The plots show the frequency in d−1 in the vertical axis versus time in d in the horizontal axis. The colour map shows the power of the wavelet coefficients of the CWT and the SSCWT using arbitrary units. As the frequencies used in the synthetic curves are stationary, we expect to find straight bands in all of them. However, unexpected results came across in some frequencies. One of the most frequent artefacts occurs when there are two or more frequencies that are too close to each other. In this case, the CWT might not be able to completely separate them, with the coefficients overlapping and thus creating an interference pattern in the SSWCT similar to that of a modulated frequency. Sometimes, these behaviours can be corrected by fine tuning the mother wavelet parameter σ to make the analysis more sensitive to frequency changes at the cost of decreasing the temporal accuracy (i.e., increasing the σ parameter). However, depending on the length of the signal, it is not always possible to reach enough frequency resolution before losing all the information in the temporal axis. An example of this behaviour is shown in Figure 1 where, using the light curve of HD 174936, in the left panels (A and C) a setting of σ = 8 was used and the interference pattern can be seen in the SSWCT (C). In the right panels (B and C), we increased the parameter to σ = 30 and the effect has been corrected. It is also worth noting the unavoidable border effect that appears in both ends of the plots. This happens because the CWT takes the beginning and the end of the signal as actual changes of frequency (from 0 to something and from something to 0, respectively). The same effect would happen in the gaps had they not been filled using the MIARMA algorithm. Another artefact that can be seen in panel D of Figure 1 is the appearance of equidistant light blue (almost white) bands around the synchrosqueezed frequency of 27.01 d−1. Comparing with the same frequency in the CWT plot (panel B of Figure 1), we can see that this bands in the SSCWT actually mark the edges of the frequency band in the CWT. This also happens in other frequencies we have analysed (not shown) and therefore we concluded that these light bands are likely a residual of the edge of the CWT bands.
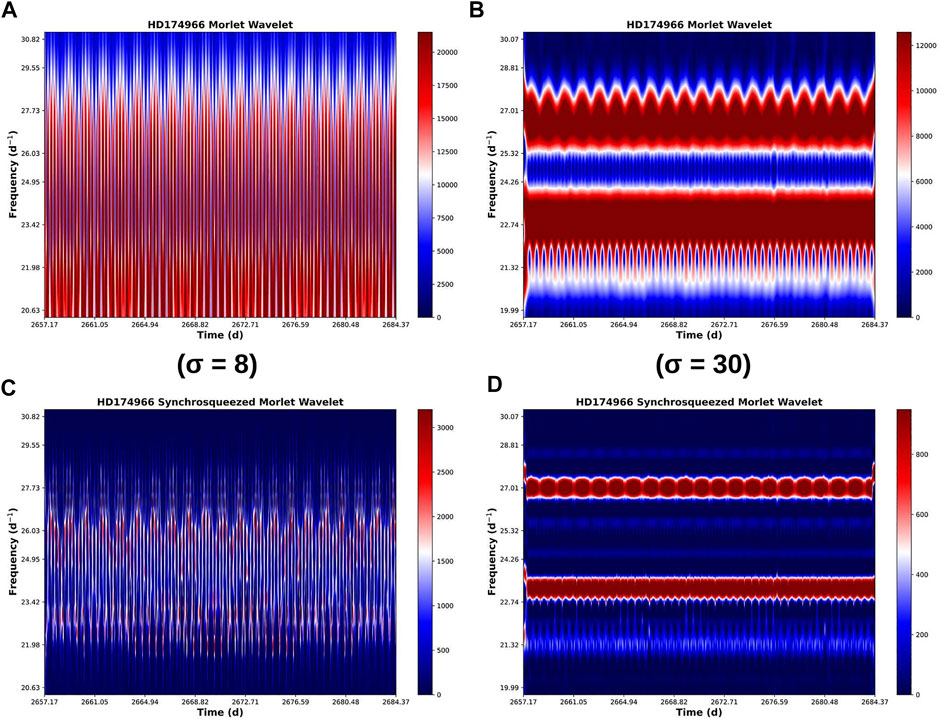
FIGURE 1. Example of a SSCWT analysis of the same region of pulsation frequencies for HD 174966. The plot shows the oscillation frequencies versus time. The colour map shows the power of the wavelet coefficients in arbitrary units. (A): Interference pattern that appears in the CWT when the frequencies are too close to resolve setting σ = 8 in the mother wavelet. The SSCWT in (C) is not able to resolve this frequencies either. (B): the same set of frequencies are resolved by setting σ = 30. In this case, the three frequencies at 21.32, 23.24 and 27.01 d−1 can be clearly seen. The frequency at 27.01 d−1 shows a wobbling in the power, probably because the frequencies of the daughter wavelets that scanned that region did not exactly match the frequency of the signal, thus generating the effect. The fact that this wobbling also appears in the analysis of the synthetic curve (not shown) is what led us to think that this variation was not a real modulation in amplitude. The light blue bands in (D) at about 24.2, 25.3 and 28.7 d−1 are artefacts of the synchrosqueezing algorithm, created at the places where there were the edges of the frequency bands in the CWT (B).
The frequencies found for the light curve of HD 174936 show a similar behaviour to the frequencies found in the synthetic signal. An example is given in Figure 2, in which the main pulsation frequency at 13.70 d−1 along with another frequency at 15.58 d−1 are shown. The upper panels (A and B) display the CWT coefficients, whereas the lower panels (C and D) show the SSCWT result. In the same sense, the left panels (A and C) are for the analysis of the real light curve and the right panels (B and D) for analysis of the synthetic signal. In this case, the CWT (panels A and B) seems unable to completely resolve both frequencies with the red edges of both bands slightly overlapping. This may hamper the synchrosqueezing a bit, which can explain the unexpected changes in the 15.58 d−1 frequency.
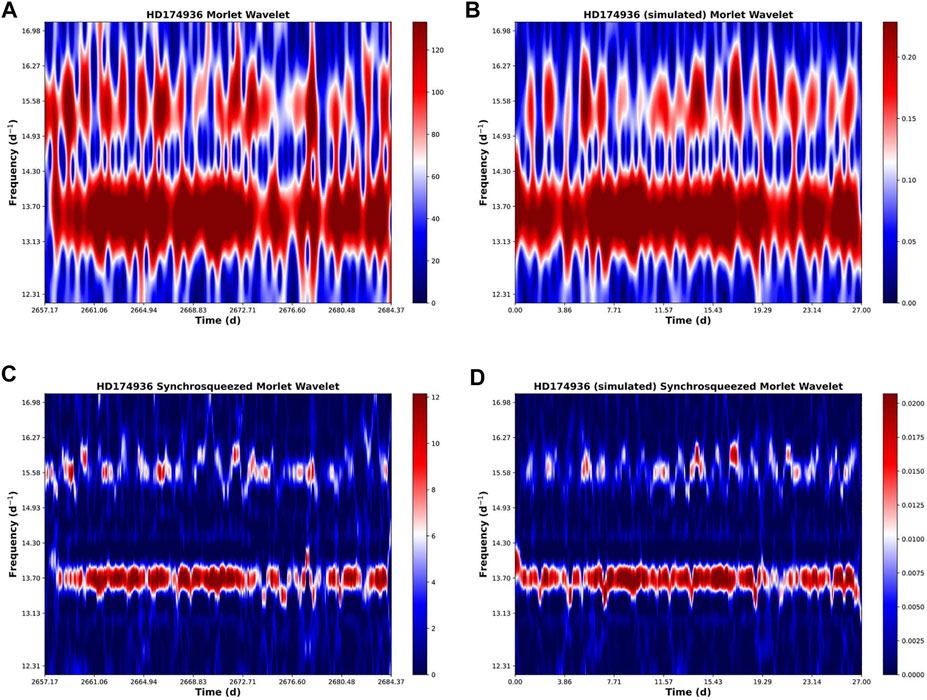
FIGURE 2. Main pulsation frequencies of HD 174936. The similar behaviour of the frequencies at 13.70 and 15.58 d−1 found in the analysis of both the real and the synthetic data can be used to confirm that the frequencies found in the light curve are stationary. The CWT of both frequencies shown seem to interact a bit (i.e. the edges of the red bands in panels (A) and (B), corresponding to the frequencies at 13.70 and 15.58 d−1, overlap a bit.) That could explain the erratic behaviour of the frequency at 15.58 d−1 in the SSCWT in both panels (C) and (D). Additionally, there can also be happening the same effect as in the wobbling explained in Figure 1.
In Figure 3 a similar overlapping effect can be happening in the different frequencies shown between 1.89 and 2.34 d−1. The same can be happening between the two frequencies at 4.46 and 4.8 d−1. However, in the frequency at 4.46 d−1 there is a clear difference between the synthetic (panels B and D) and the real signal (panels A and C). Whereas the analysis of the synthetic curve displays an almost straight band throughout the whole observation time, the frequency in the real observations seems to be weaker during the first eight to 10 days. This could be an indication of an instability of some kind in this particular frequency.
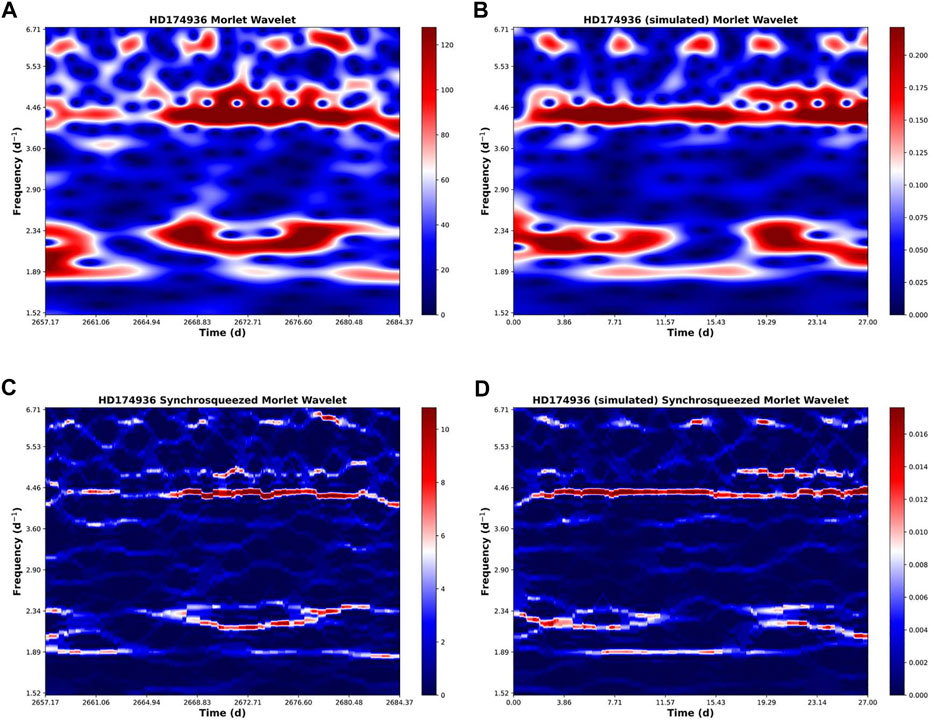
FIGURE 3. Frequencies of HD 174936 between 1.52 d−1 and 6.71 d−1. The CWT (panels A and B) of the group of frequencies between 1.89 d−1 and 2.34 d−1 shows some overlapping in the coefficients (red zones) and this can be hampering the synchrosqueeze algorithm. Hence the apparent instability of these frequencies in the SSWCT (panels C and D). The same could be happening between the frequency at 4.46 d−1 and a slightly higher one around 4.8 d−1. In the frequency at 4.46 d−1, the SSWCT of the synthetic curve shows an almost straight and continuous band along the temporal axis whereas in the signal from the star the band seems to be weaker in the first 8-10 days of observation, which could be a sign of an instability of some kind in this frequency.
In HD 174966, Figure 4 shows a frequency at 5.51 d−1 and another one at 6.3 d−1. The frequency at 5.51 d−1 shows a clearly different behaviour in the light curve of the star (panels A and C in Figure 4) than in the synthetic one (panels B and D). The analysis of the synthetic curve shows a well defined straight band (apart from the border effect), whereas the frequency coming from the analysis of the real signal suffers an interruption at about 2666 d, then is resumed at 2672 d and stopped again at 2677 d before finally resuming at 2678 d. The other frequency at about 6.3 d−1 seems to be reacting in an opposite way, which might be an indication of an interaction between these two frequencies. We can discard an artefact of the method because of the different behaviour of the synthetic signal. Another possible explanation to this phenomenon could be that this frequency would correspond to a transient of some sort or a magnetic field altering the oscillation mode in a period of few days. A longer observation run of this star would be needed in order to confirm the instability of the pulsation.
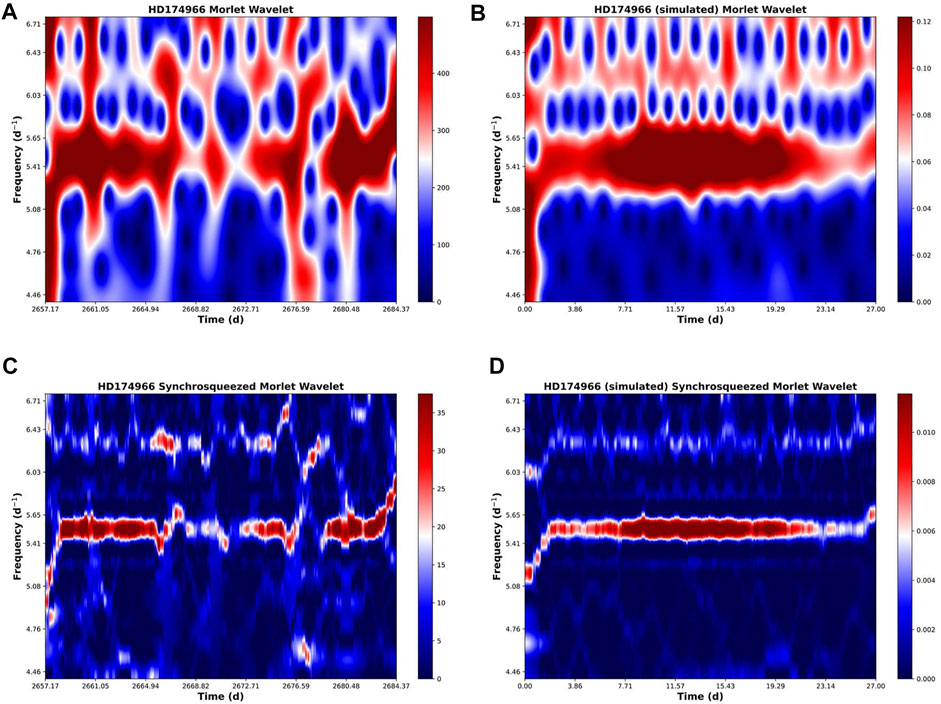
FIGURE 4. Frequencies of HD 174966 between 4.46 d−1 and 6.71 d−1. The frequency at 5.51 d−1 shows a clearly different behaviour in the signal (A,C) compared to the synthetic curve (B,D). The SSWCT of the synthetic curve shows a uniform band, apart from the border effect, whereas the SSWCT of the light curve suffers an interruption at about 2666 d, then is resumed at 2672 d and then stopped again at 2677 d before finally resuming at 2678 d. The other frequency at about 6.3 d−1 seems to be reacting in an opposite way. This behaviour maybe due to an interaction between these two frequencies but could also be due to a transient of some kind or a magnetic field modulation.
The other frequencies found for this star (see e.g. the main pulsation frequencies previously shown in Figure 1) do not show any different behaviour compared to the synthetic signal.
We have used the synchrosqueezed continuous wavelet transform to analyse the light curves of HD 174936 and HD 174966 and we have compared the results with the same analysis on synthetic light curves generated for these stars. Most of the frequencies found show a similar behaviour in both real and synthetic cases, although some of them show unexpected variations only in the real light curves. These variations in the light curves of HD 174936 and HD 174966 are here reported for the first time, which shows the high potential of the synchrosqueezed wavelet transform to uncover new physics of δ Sctstars.
The synchrosqueezed wavelet transform shows better results in the low frequency region than in the high frequency region. The continuous wavelet transform is complementary to the synchrosqueezing in order to identify possible artefacts.
Further studies with longer observation runs would be needed in order to confirm our findings.
Publicly available datasets were analyzed in this study. This data can be found here: CoRoT Data Archive http://idoc-corot.ias.u-psud.fr/sitools/client-user/COROT_N2_PUBLIC_DATA/project-index.html.
RG, JP-G, and AR-B contributed to conception and design of the study. AR-B performed the analyses described in the manuscript and also wrote the first draft of the manuscript. JP-G prepared the data so it could be analysed and also provided the synthetic light curves. All authors contributed to manuscript revision, read, and approved the submitted version.
AR-B, JP-G, and RG acknowledge funding support from Spanish public funds for research from project ESP 2017-87676-C5-5-R from the “Plan Estatal de Investigación Científica y Técnica y de Innovación”, from project PID 2019-107061GB-C63 from the ‘Programas Estatales de Generación de Conocimiento y Fortalecimiento Científico y Tecnológico del Sistema de I+D+i y de I+D+i Orientada a los Retos de la Sociedad’, and from the State Agency for Research through the “Center of Excellence Severo Ochoa” award to the Instituto de Astrofísica de Andalucía (SEV-2017-0709), all from the Spanish Ministry of Science, Innovation and Universities (MCIU). AR-B also acknowledges funding support from project PRE 2018-084322 from the ‘Programa Estatal de Promoción del Talento y su Empleabilidad del Plan Estatal de Investigación Científica y Técnica y de Innovación 2013-2016’ of the Spanish MCIU.
The authors would like to thank the two reviewers who kindly reviewed the manuscript and provided valuable suggestions and insightful comments.
The authors declare that the research was conducted in the absence of any commercial or financial relationships that could be construed as a potential conflict of interest.
All claims expressed in this article are solely those of the authors and do not necessarily represent those of their affiliated organizations, or those of the publisher, the editors and the reviewers. Any product that may be evaluated in this article, or claim that may be made by its manufacturer, is not guaranteed or endorsed by the publisher.
The Supplementary Material for this article can be found online at: https://www.frontiersin.org/articles/10.3389/fspas.2022.948979/full#supplementary-material
Aerts, C., Christensen-Dalsgaard, J., and Kurtz, D. W. (2010). Asteroseismology. Dordrecht: Springer.
Baglin, A., Auvergne, M., Barge, P., Deleuil, M., Catala, C., Michel, E., et al. (2006). “Scientific objectives for a minisat: CoRoT,” The CoRoT mission pre-launch status - stellar seismology and planet finding. Editors M. Fridlund, A. Baglin, J. Lochard, and L. Conroy (1306 of ESA Special Publication), 33.
Baglin, A., Breger, M., Chevalier, C., Hauck, B., Le Contel, J. M., Sareyan, J. P., et al. (1973). Delta Scuti stars. A and A 23, 221.
Barceló Forteza, S., Michel, E., Roca Cortés, T., and García, R. A. (2015). Evidence of amplitude modulation due to resonant mode coupling in the δ Scuti star KIC 5892969. A particular or a general case? Astron. Astrophys. 579, A133. doi:10.1051/0004-6361/201425507
Bowman, D. M., Hermans, J., Daszyńska-Daszkiewicz, J., Holdsworth, D. L., Tkachenko, A., Murphy, S. J., et al. (2021). KIC 5950759: A high-amplitude δ Sct star with amplitude and frequency modulation near the terminal age main sequence. Mon. Not. R. Astron. Soc. 504, 4039–4053. doi:10.1093/mnras/stab1124
Bowman, D. M., and Kurtz, D. W. (2014). Pulsational frequency and amplitude modulation in the δ Sct star KIC 7106205. Mon. Not. R. Astron. Soc. 444, 1909–1918. doi:10.1093/mnras/stu1583
Breger, M., Fossati, L., Balona, L., Kurtz, D. W., Robertson, P., Bohlender, D., et al. (2012). Relationship between low and high frequencies in δ Scuti stars: Photometric kepler and spectroscopic analyses of the rapid rotator KIC 8054146. Astrophys. J. 759, 62. doi:10.1088/0004-637X/759/1/62
Breger, M., and Pamyatnykh, A. A. (2006). Amplitude variability or close frequencies in pulsating stars - the δ Scuti star FG Vir. Mon. Not. R. Astron. Soc. 368, 571–578. doi:10.1111/j.1365-2966.2006.10119.x
Daubechies, I., and Maes, S. (1996). “A nonlinear squeezing of the continuous wavelet transform based on auditory nerve models,” in Wavelets in medicine and biology (USA: CRC Press), 527–546. 2000 N.W. Corporate Blvd., Boca Raton, FL 33431-9868.
Daubechies, I., Lu, J., and Wu, H.-T. (2011). Synchrosqueezed wavelet transforms: An empirical mode decomposition-like tool. Appl. Comput. Harmon. Analysis 30, 243–261. doi:10.1016/j.acha.2010.08.002
de Franciscis, S., Pascual-Granado, J., Suárez, J. C., García Hernández, A., and Garrido, R. (2018). Fractal analysis applied to light curves of δ Scuti stars. Mon. Not. R. Astron. Soc. 481, 4637–4649. doi:10.1093/mnras/sty2496
García Hernández, A., Moya, A., Michel, E., Garrido, R., Suárez, J. C., Rodríguez, E., et al. (2009). Asteroseismic analysis of the CoRoT δ Scuti star HD174936. Astron. Astrophys. 506, 79–83. doi:10.1051/0004-6361/200911932
García Hernández, A., Moya, A., Michel, E., Suárez, J. C., Poretti, E., Martín-Ruíz, S., et al. (2013). An in-depth study of HD 174966 with CoRoT photometry and HARPS spectroscopy: Large separation as a new observable for δ Scuti stars. Astron. Astrophys. 559, A63. doi:10.1051/0004-6361/201220256
Guzik, J. A., Kosak, K., Bradley, P. A., Jackiewicz, J., Uytterhoeven, K., and Kinemuchi, K. (2015). The occurrence of non-pulsating stars in the gamma dor and delta set pulsation instability regions: Results from Kepler Quarter 14-17 data. Astron. Rev. 29, 1–2. doi:10.1080/21672857.2014.11519738
Mallat, S. (2009). “A wavelet tour of signal processing,” in The sparse way. Third Edition3rd edn. (Boston: Academic Press). doi:10.1016/B978-0-12-374370-1.X0001-8
Muradeli, J. (2020). ssqueezepy. GitHub. Note. Available at: https://github.com/OverLordGoldDragon/ssqueezepy/.
Pascual-Granado, J., Garrido, R., and Suárez, J. C. (2015). Miarma: A minimal-loss information method for filling gaps in time series. Astron. Astrophys. 575, A78. doi:10.1051/0004-6361/201425056
Percival, D. B., and Walden, A. T. (2000). Wavelet methods for time series analysis. Cambridge: Cambridge University Press. doi:10.1017/cbo9780511841040
Poretti, E., Michel, E., Garrido, R., Lefèvre, L., Mantegazza, L., Rainer, M., et al. (2009). HD 50844: A new look at δ Scuti stars from CoRoT space photometry. Astron. Astrophys. 506, 85–93. doi:10.1051/0004-6361/200912039
Ramón-Ballesta, A., García Hernández, A., Suárez, J. C., Rodón, J. R., Pascual-Granado, J., Garrido, R., et al. (2021). Study of rotational splittings in δ Scuti stars using pattern finding techniques. Mon. Not. R. Astron. Soc. 505, 6217–6224. doi:10.1093/mnras/stab1719
Rodríguez, E., López-González, M., and López de Coca, P. (2000). A revised catalogue of delta Sct stars. Astron. Astrophys. Suppl. Ser. 144, 469–474. doi:10.1051/aas:2000221
Keywords: stars:Delta Scuti, stars:variable, stars:pulsations, wavelet analysis, wavelet transform, synchrosqueeze, asteroseismology
Citation: Ramón-Ballesta A, Pascual-Granado J and Garrido R (2022) Time-frequency analysis of HD 174936 and HD 174966 using the synchrosqueezed wavelet transform. Front. Astron. Space Sci. 9:948979. doi: 10.3389/fspas.2022.948979
Received: 20 May 2022; Accepted: 29 June 2022;
Published: 22 July 2022.
Edited by:
Maria Ann Weber, Delta State University, United StatesReviewed by:
Joyce Ann Guzik, Los Alamos National Laboratory (DOE), United StatesCopyright © 2022 Ramón-Ballesta, Pascual-Granado and Garrido. This is an open-access article distributed under the terms of the Creative Commons Attribution License (CC BY). The use, distribution or reproduction in other forums is permitted, provided the original author(s) and the copyright owner(s) are credited and that the original publication in this journal is cited, in accordance with accepted academic practice. No use, distribution or reproduction is permitted which does not comply with these terms.
*Correspondence: A. Ramón-Ballesta, YS5yYW1vbmJhbGxlc3RhQGdtYWlsLmNvbQ==
Disclaimer: All claims expressed in this article are solely those of the authors and do not necessarily represent those of their affiliated organizations, or those of the publisher, the editors and the reviewers. Any product that may be evaluated in this article or claim that may be made by its manufacturer is not guaranteed or endorsed by the publisher.
Research integrity at Frontiers
Learn more about the work of our research integrity team to safeguard the quality of each article we publish.