
94% of researchers rate our articles as excellent or good
Learn more about the work of our research integrity team to safeguard the quality of each article we publish.
Find out more
METHODS article
Front. Astron. Space Sci., 19 August 2022
Sec. Astronomical Instrumentation
Volume 9 - 2022 | https://doi.org/10.3389/fspas.2022.924871
This article is part of the Research TopicRobotic TelescopesView all 12 articles
 A. Castellón1,2
 G. Larrubia3
 R. Castillo3
 A. J. Castro-Tirado4,2*
 E. Fernández-García4C. Pérez del Pulgar2A. Reina2S. Castillo-Carrión5
This article describes a fuzzy logic-based method optimized for the dome control of a robotic astronomical observatory. A Mamdani inference has been developed in order to make the decision to open or close the dome. The input variables are obtained from data received from a weather station besides the percentage of cloudy sky as derived by two allsky cameras. The software has been tested at the BOOTES-1 observatory as part of the BOOTES Global Network of Robotic Telescopes led by IAA-CSIC.
The BOOTES Global Network (Burst Observer and Optical Transient Exploring System) have so far five observatories located in Algarrobo Costa and El Arenosillo (Spain), Lauder (New Zealand), San Pedro Mártir (México), and Yunnan (China). Their main goal is to find and study optical counterparts from transient phenomena such as gamma-ray bursts, gravitational wave bursts, and others. Most information about GRB and GW triggers are distributed through GCN (Barthelmy, 1998) between subscribers. The first robotic telescope network was ROTSE (Akerlof et al., 1999), and now between working are MASTER (Lipunov, 2019) and BOOTES (Castro-Tirado et al., 2012).
Therefore, they do not have semi-spherical dome, instead they do have a gabled dome that opens completely allowing a fast movement from the telescope toward any point in the sky as response to any astronomical alert deserving fast reaction.
The observatories are robotized. Therefore, the observation time is set depending on the height of the Sun above the horizon, and they respond to alerts they receive from different sources. As response time needs to be in a very short space of time, the dome has to stay open as much time as possible, that is to say, every time sky conditions allow it and meteorological situation does not signify a danger to the set of instruments.
As the two relevant subsystems are a meteorological station and two allsky cameras, one inside the dome and other outside, a software program inspects in real-time information from the meteorological station and the cameras, and it decides whether or not to open the dome. However, this decision based on classical logic has turned out to be too rigid. Sometimes, the software, when the thresholds set for some parameters were exceeded, decided to closed the dome for a period of time, and it was found a posteriori that it could have been open, losing the opportunity to observe the transient phenomenon that happened precisely at that instant. (Murphy’s law usually works).
That is why we thought about fuzzy logic because in these kind of situations, it adopts human behavior, is more flexible, and it does not keep too harsh yes or no decisions.
The chosen method has been developed by Mamdani and Assilian (1975) and it is widely used in decision making problems. It is stated in four steps:
1. Fuzzification of the input variables. Input variables are taken, and their memberships to associate fuzzy sets are calculated.
2. Rule evaluation. Fuzzy rules are applied to the input variables. If a given fuzzy rule has multiple antecedents, the operators are used to obtain a single evaluation number. This value is applied to the consequent using the minimum method (truncates the consequent with the antecedent’s truth value) or product method (multiply all values by antecedent’s truth value).
3. Aggregation of the rule outputs. A single fuzzy set is obtained by unifying the outputs from the previous fuzzy rules and by combining membership functions of all rule consequents.
4. De-fuzzification. The result is shown as a classic membership value taking as input the fuzzy set from the previous step. The method used is the centroid, which returns the center of the area under the associated membership functions:
where x is the input variable and μA is the membership function.
The Mamdani fuzzy inference method has been widely used in a variety of fields, including those related to meteorology, as can be seen in Manish et al. (2019) and Agboola et al. (2013).
The BOOTES observatories have two allsky cameras named CASANDRA (Compact All-Sky Array of Night Devices for Rapid Alerts) and Starcam. CASANDRA is composed by a Moravian G4-16000 with Nikon equipped with a fish-eye 16 mm lens, and it is located inside the observatory. The Starcam is a ZWO120MM wide-angle lens situated outside the observatory, and it is protected by a carbon fiber transparent dome. Astrometry is obtained from both cameras. This allows calculating in real time the chip coordinates where the stars should be projected.
The software looks in the CCD or CMOS detector for the stars among those from the Hipparcos catalog with magnitude below 3 and 5, and it fills files (one per camera) with the following structure:
1. Date/time in FITS format.
2. Zenithal distance of the Moon in degree format.
3. Illuminated Moon fraction (percentage).
4. Percentage of stars with magnitude below 3 found.
5. Percentage of stars with magnitude below 5 found.
The following is a sample line from these files:
2022-01-20T06:30:34___56.13___95.00%___86.11%___53.85%
This mean that at 06:30:34 time on 20 January 2022, the Moon set at 56.13 deg of zenithal distance had 95% illuminated Moon surface, 86.11% stars in range with magnitude below 3 were found, and 53.85% stars in range with magnitude below 5 were found.
The fact that zenithal distance of the Moon percentage of illuminated Moon surface is considering, in moonless sky or when the Moon is low above the horizon, cloud absence will turn into a high percentage of stars found, but the Moon presence decreases these values due to three main causes:
• The Moon saturates a significative fraction of the CCD or CMOS detector depending on its brightness, reducing useful exploration area.
• Sky background increases its brightness preventing fainter stars to be detected.
• Strong moonlight ensures, at the outside camera dome (Starcam), all the imperfections that complicate star detection such as scratches, bird or insect excrements, and rain or dew drops.
Software used in both cameras removes a circular area centered at the Moon location, and the given radius is adapted to the percentage of the illuminated Moon and at the zenithal distance of the Moon. As it shall be seen later, it is required that modified functions to input variable membership values are introduced.
In any case, Moon’s influence on star count is higher in Starcam (outside) than in CASANDRA (inside), which makes sense due to the sensitivity and optics difference between them.
Another software process runs in real time, reads information from meteorological station, and produces files with the following structure:
1. Date in YYYY-MM-DD format
2. Universal time in hh:mm:ss format
3. Atmospheric pressure in inch of mercury column
4. Inside temperature in Fahrenheit degrees
5. Outside temperature in Fahrenheit degrees
6. Inside relative humidity
7. Outside relative humidity
8. Inside dew point in Fahrenheit degrees
9. Outside dew point in Fahrenheit degrees
10. Current wind speed in miles per hour
11. Average wind speed during last 10 min in miles per hour
12. Wind direction in azimuth degrees from North and clockwise, that is to say, 0 for North, 90 for East, etc.
13. Day rain until current time in inches
14. Inch per hour from daily rain
15. Dome status (negative value if dome is closed or there is no signal, and 1 if dome is open).
Moonless nights are considered when the zenithal distance of the Moon is higher than 85 deg (or below the horizon) of the Moon illuminated surface is lower than 10%. In both cases, Moon’s influence is not significant in percentage of stars found by Starcam.
A previous statistics with data from a complete year was made to check relationship between the fields (3, 4), (5, 6), and (7, 8) and between the percentages of stars found and stars with magnitude below 3 and 5. The results are given in Table 1.
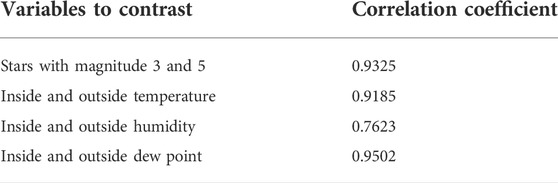
TABLE 1. Correlation between pairs of variables.
Certainly, there is a correlation between these field pairs, and for this particular reason, the number of variables is simplified, and both the percentage of stars with 3rd magnitude and the outside meteorological data will be used.
The following variables will be used:
• VL: very low
• L: low
• N: normal
• H: high
• VH: very high
To infer the corresponding values, all the values from each field in the yearly statistic were ordered from low to high until they reach
• For VL: 7% of the sample
• For L: 16% of the sample
• For N: 50% of the sample (median)
• For H: 66% of the sample
• For VH: 93% of the sample
This method will be applied in most variables, except rain, humidity, and CASANDRA and Starcam values, which will have a designed process.
The membership function from this variable will take only value 1 for rain absence, and value 0 for rain (field 13). Obviously, the dome must stay closed during any rain. This is in fact a classic set and not a fuzzy one. Due to local climatology, only in 1,145 (out of 37,981) were rain recorded, and this is covered in Figure 1 left.
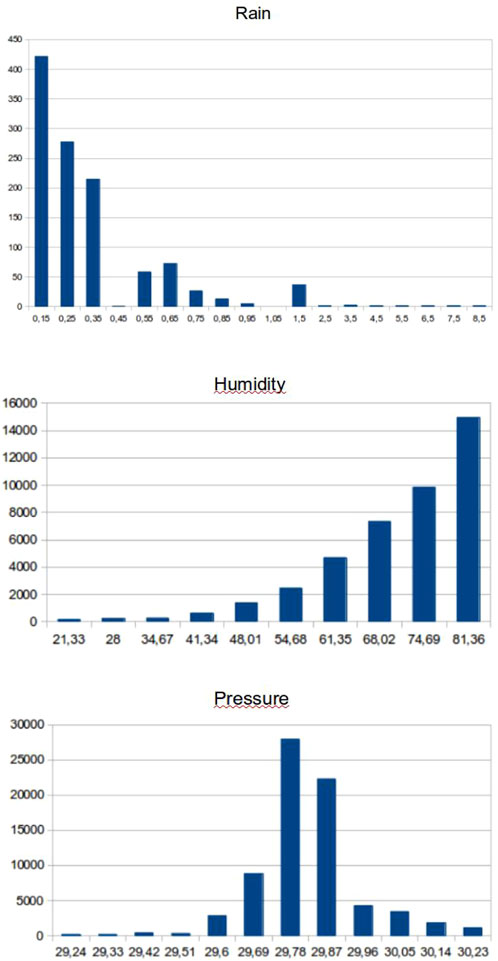
FIGURE 1. Rain, humidity, and pressure frequency.
Once again, a classic set will be used. The membership function will take value 0 if relative humidity is greater or equal to 95%, and value 1 otherwise. During high humidity, optic, mechanic, and electronic instrumentation are in danger; moreover, the stars found collection is lower due to water condensation on top of outside dome (Figure 1 center).
This is the last no fuzzy set. It will use field 15 (open or closed dome). If dome is closed or there is no signal, membership function will return value 0. Otherwise (open dome), it will return value 1. If dome is open, records from inside CASANDRA camera (inside) will be used instead of outside Starcam camera (outside).
Low pressure predicts storm, cyclone or torrential rain appearance, very pernicious situations for the telescope, and assembling and electronics. In this circumstance, the dome must stay closed. High pressure means steady weather with a high probability of clear sky, which is positive for opening the dome. In the year, statistic sample considered the atmospheric pressure has a median of 29,805 inches of mercury. That is the normal value (N) for the membership functions. From that to the maximum, there will be set values high (H) or very high (VH), and from median to the minimum, values low (L) or very low (VL) (Figure 1 right).
Pressure values on their own do not give more information than possible bad weather. More clarifying is pressure variation during a time interval before decision making, which will be described in next subsection. Very low (MB) pressure reaches at 29.65, low (L) at 29.71, normal (N) at 29.79, high (H) at 29.83, and very high (VH) at 30.01 (Figure 2A).
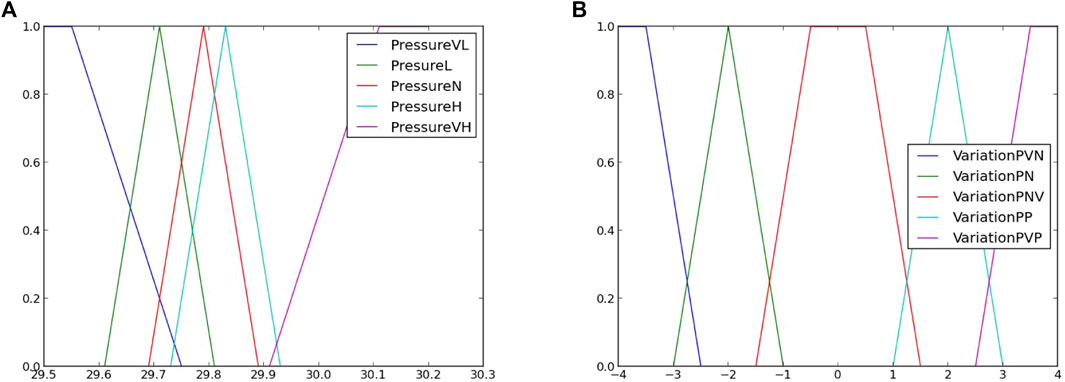
FIGURE 2. Pressure variable membership functions (A). Pressure variation membership functions (B).
Pressure variation values are obtained by reading pressure field 20 min before making the decision to open or close the dome. Let set a counter at 0, each pressure values rise between one record and the next increases counter by 1, and each descent decreases it by 1. If there is no pressure change, counter stays invariable. A study was developed with the relationship between pressure variation and rain records and stars collections from both cameras to analyze pressure variation influence on clouds or rain appearance. It was noticed that a very negative pressure variation leads to rain and percentage of stars found is very low. With positive variations, it can rain, but only with a high standard deviation; for this reason, perhaps the weather gets better.
It is notified that when pressure decreases slowly, there is practically no rain. Rain appears when pressure decreases roughly, and as cumulative rain increases, pressure also does it slowly. To summarize, very negative pressure variation leads to clouds and rain, low pressure variation shows steady weather, and positive pressure variation shows that weather gets better or worse (it not only depends on pressure absolute value and but also on variation value).
The membership functions are made by considering that most relevant data are obtained with negative, very negative, positive, and very positive pressure variations. Triangular functions are used for these variables and a trapezoidal one when there is no variation. Very negative (VN) pressure variation reaches at -3, negative (N) at -2, no variation (WV) at 0, positive (P) at 2, and very positive (VP) at 3 (Figure 2B).
This variable excludes itself from Gaussian function because there are only a few days with significant wind preventing the observations. Indeed, these are the most dangerous days for the telescope assembling and the dome that when it is open acts like a sail.
Reference values are 0.5 for low speed (L), 1 for normal speed (N), 5 for high speed (H), and 11 for very high speed (VH). These membership functions are reflected in Figure 3A.
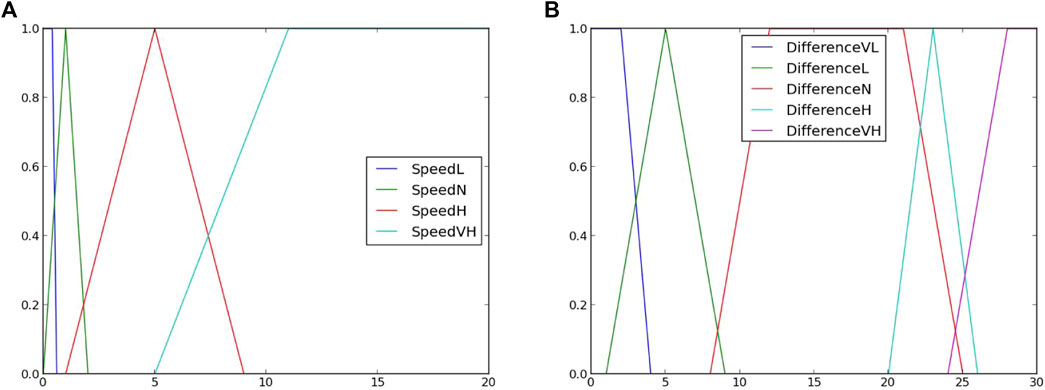
FIGURE 3. Wind speed membership functions (A). Temperature and dew point difference membership functions (B).
For analyzing this variable, low wind speed has been discarded because, in this circumstance, wind direction is irrelevant. The analysis of percentage of stars found with CASANDRA and Starcam depending on wind direction shows that percentage is very low with South/Southeast wind and relatively high with North/Northwest wind, as can be seen in the circular graphics in Figure 4.
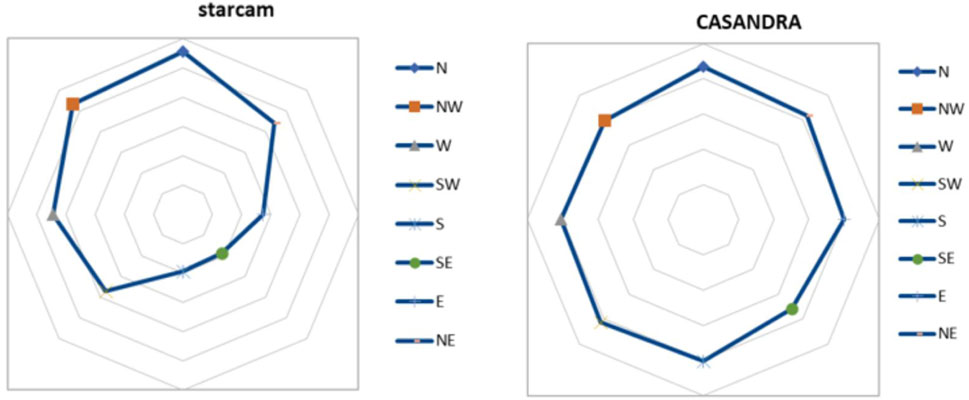
FIGURE 4. Percentage of hits according to wind direction frequencies.
The distance to the center represents the average percentage of right stars searched. It can be seen in both graphics that the southeastern wind lowers the percentage, whereas the northern wind improves the situation.
As expected in the Starcam, when temperature is close to dew point, the average percentage of stars found is very low. The lowest percentage reaches at a difference of 2.06 Fahrenheit degrees. On the other hand, when this difference is very high (from 19.64 Fahrenheit degrees), the average percentage is very high, and standard deviation is very low, which indicates not only a lot of accuracy but also what is mostly happening.
All this considered membership function takes the following values: 3 for very low difference (VL), 5 for low difference (L), 20 for normal difference (N), 23 for high difference (H), and 26 for very high difference (VH). This is shown in Figure 3B.
These values will be added to meteorological variables. They will be useful when Starcam shows high or very high percentage of accuracy because this means good sky, and it is convenient to open the dome. While dome is open, CASANDRA records will be considered. This is because CASANDRA is more efficient than Starcam in star search, even in unfavorable Moon conditions.
This fact has been inferred by performing statistics on a sample of 12,975 moonless records and 20,238 Moon night records. Usually, percentage of accuracy is high because the robotized classic logic-based system that was in charge during statistic opened the dome when meteorological conditions were good. Not surprisingly is that percentage of accuracy is higher in moonless nights than in nights with Moon. Either way, while CASANDRA records are not bad, there is no problem with keeping the dome open. This is the reason why CASANDRA membership function will return 1 at percentage of accuracy higher than 50% and 0 otherwise, that is, like a no fuzzy set.
Starcam situation is very different. As it is outside the dome, it captures pictures in all circumstances: rainy, clear sky, cloudy, dew, and with Moon or moonless. It is less sensitive, and it field of view is smaller than of the CASANDRA one. Due to being protected by a carbon fiber transparent dome, either accumulative dirt or condensation deteriorates the capacity of reinforce star position in the field of vision. After dividing the sample of 21,775 Starcam records without Moon into quintiles, it is considered a value of 12.24 for variable wrong reading (W), 75 for regular reading (R), 88.57 for good reading (G), and 91.67 for very good reading (VG).
As mentioned earlier, bright Moon’s presence in the sky causes a success reduction at searching stars in both cameras and more emphasized in Starcam than in CASANDRA. It is concluded (from other logical way) for an overall sample of 74,801 records achieved in the corresponding Moon nights. The idea is to modify ends from the membership functions of the variable wrong record, regular record, good record, and very good record depending on zenithal distance of the Moon and percentage of illuminated Moon fraction. For that purpose, coefficients to multiply ends functions have been searched. Keep in mind that a percentage of stars found of, for example, 56%, would be bad for a moonless night but very acceptable with bright and high Moon in the sky.
On a first statistical analysis, percentile 70 is taken as reference. Table 2 displays the average percentage of success at percentile 70 for different values of illuminated Moon fraction.
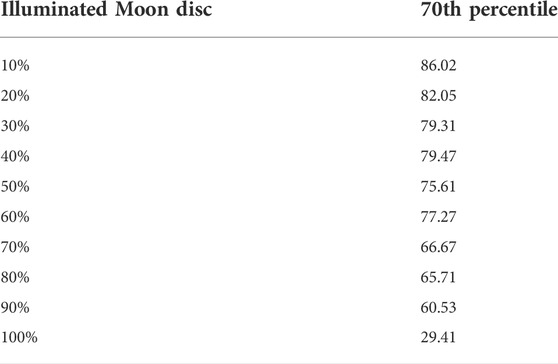
TABLE 2. Percentage of stars.
It can be seen, as expected, that success index decreases as moon brightness increases (all possible zenithal distances for Moon nights are included in the table). The reason was shown earlier: As illuminated Moon fraction increases, there is less sky area to explore, and it is more difficult to find stars with a brighter sky. Table 3 shows average percentage of accuracy for zenithal distances between 20 and 85 deg.
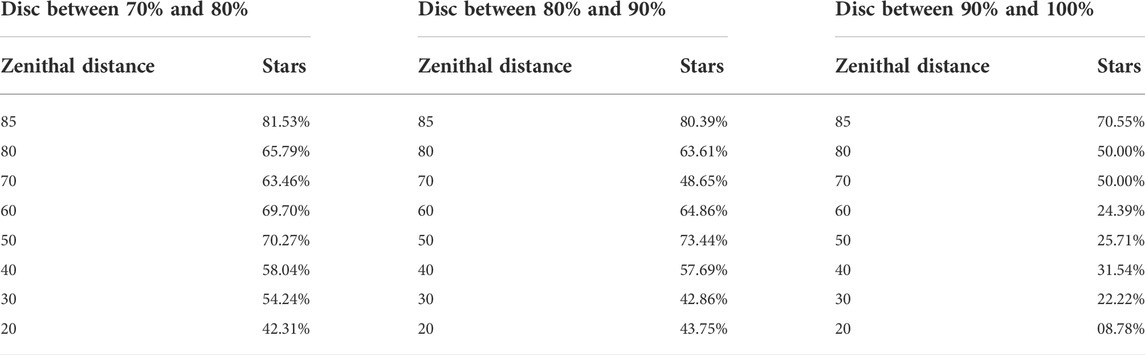
TABLE 3. Percentages of stars found as a function of the lunar disk and zenith distance from the Moon.
It is noticed an expected behavior: percentage of success increases as Moon is far from zenith. However, there will be nights with high percentage of illuminated Moon fraction, but with the others, conditions favorable for opening the dome. As CASANDRA is more efficient in recognizing stars than Starcam, the inference method will keep the dome open even though Starcam records have very low percentage of success.
The collection of multiplier coefficient to endpoints of the membership functions have been made after comparing Starcam records from all summer nights from 2019, 2020, and 2021. Summer was chosen because of the usual lack of clouds during the season, and then it has almost no influence in the comparison of efficiency in star recognition with or without Moon.
In moonless nights, it has been calculated a value of 86.11% success at percentile 80. In nights with Moon, the corresponding values of percentile 80 were located at zenithal distances between 25 and 85 deg and between 50 and 100% of percentage of illuminated Moon fraction. Percentages of illuminated Moon fraction lower than 50% were discarded because efficiency in star counting was very similar to the one at moonless nights. Remember that near new Moon, the satellite has low height over the horizon, and it stays at the sky for a short time, then it barely interferes with the count. See Table 4 for an example.
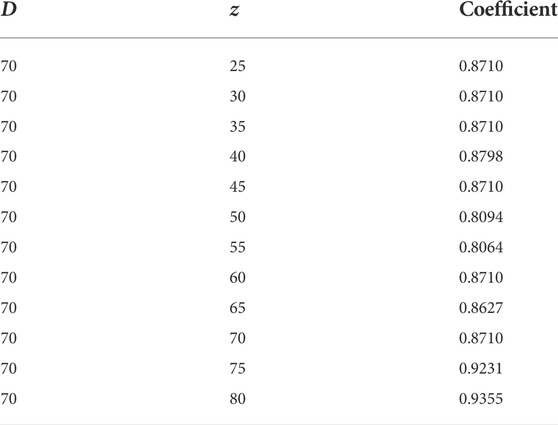
TABLE 4. Coefficients obtained by statistical methods.
The coefficient has been obtained by dividing the percentile 80 of moonless nights by the corresponding percentile of nights with 70%
So, if membership function for record VH at moonless night was
including Moon’s influence, it would be expressed as:
with k = Coefficient (D, z). See Figure 5A.
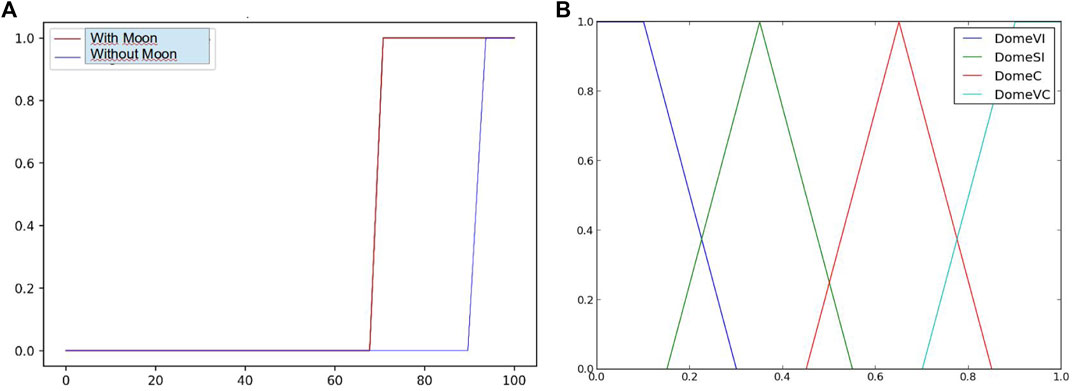
FIGURE 5. Variation of the membership function due to the influence of the Moon (A). Degree of convenience of opening dome (B).
By using the variables described in the previous section, the conditional inference rules if…then…kind were written. For inference rule consequent, it has determined output values very inconvenient, slight convenient, convenient, and very convenient, with membership functions in Figure 5B.
After variable analysis, the following rules were written:
1. If rains, then the dome has to remain closed.
2. If humidity, then the dome has to remain closed.
3. If average wind speed is high, then it is slightly convenient to open dome.
4. If average wind speed is very high, then it is very inconvenient to open dome.
5. If pressure variation is very negative, then it is very inconvenient to open dome.
6. If pressure variation is negative, then it is slightly convenient to open dome.
7. If temperature-dew point difference is very low, then it is slightly convenient to open dome.
8. If temperature-dew point difference is high, then it is convenient to open dome.
9. If temperature-dew point difference is very high, then it is very convenient to open dome.
10. If pressure is very low, then it is very inconvenient to open dome.
11. If pressure is high, then it is convenient to open dome.
12. If pressure is very high, then it is very convenient to open dome.
13. If wind direction is close to Southeast and average speed is not low, then it is slightly convenient to open dome.
14. If wind direction is close to North, then it is convenient to open dome.
15. If closed dome and Starcam record is not wrong, then it is convenient to open dome.
16. If Starcam record is very wrong, then it is very inconvenient to open dome.
17. If open dome and CASANDRA record are not wrong, then it is very convenient to open dome.
The non-fuzzy character of rules 1 and 2 implies to modifying the centroid formula in the following sense:
where r and h are the corresponding values of the membership functions rain and humidity.
The process begins with fuzzification of all input variables, taking their value and establishing membership value to the corresponding fuzzy set. These inputs are applied to the previous 17 inference rules by using, if necessary, a modifier or, if there is more than one antecedent, by using the appropriate operator ∧ (minimum) or ∨ (maximum). The result is applied to the consequent by using the minimum method, and all outputs are unified by using the maximum operator to obtain a single set for each output variable. As interest is in a numerical value and not in a set, the centroid method at interval [0, 1] will be applied to the set, and the membership value to open the dome will be obtained.
For inference rule consequent, output values will be determined, which will be different types of convenience to open dome, very inconvenient, slight convenient, convenient, and very convenient.
For the testing of the inference model, we have built a database of 48,684 records containing the information described in Section 2 regarding the weather station data and the readings from the CASANDRA and Starcam cameras. These data cover a time period from 1 January 2020 to 29 December 2021. Of these 48,684 measures, the dome was open in 29,411 (60.41%) and closed in 19,273 (39.59%).
Table 5 shows statistics on the degrees of convenience of opening the dome provided by the modified Mamdani method of Eq. 3.
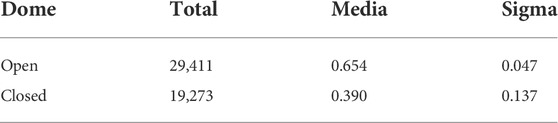
Table 5. Statistics of the degree of convenience of opening dome.
As expected, we observed a clear difference between the degrees of convenience obtained with open dome and closed dome. Moreover, the standard deviations are small, indicating a logical clustering.
It should be noted that in the almost 2 years for which we have used data, the dome has been closed at times due to breakdowns or maintenance work. However, even in these circumstances, it is interesting to know how the inference engine would have responded from the meteorological data and the readings from the external camera (Starcam).
For this study and in view of the statistics, we have considered that the dome could be opened from a degree of convenience greater than or equal to the mean minus one standard deviation, that is, 0.607 = 0.654 − 0.047. By this criterion, on 2,059 occasions, the dome was closed when the model indicates that it could have been opened.
Figure 6 shows two situations (one with Moon and one without Moon) where the model indicated to open the dome, and it was indeed open. The bright light on the left edge of the images is an aerial beacon that was subsequently shielded at our request to avoid stray lights.
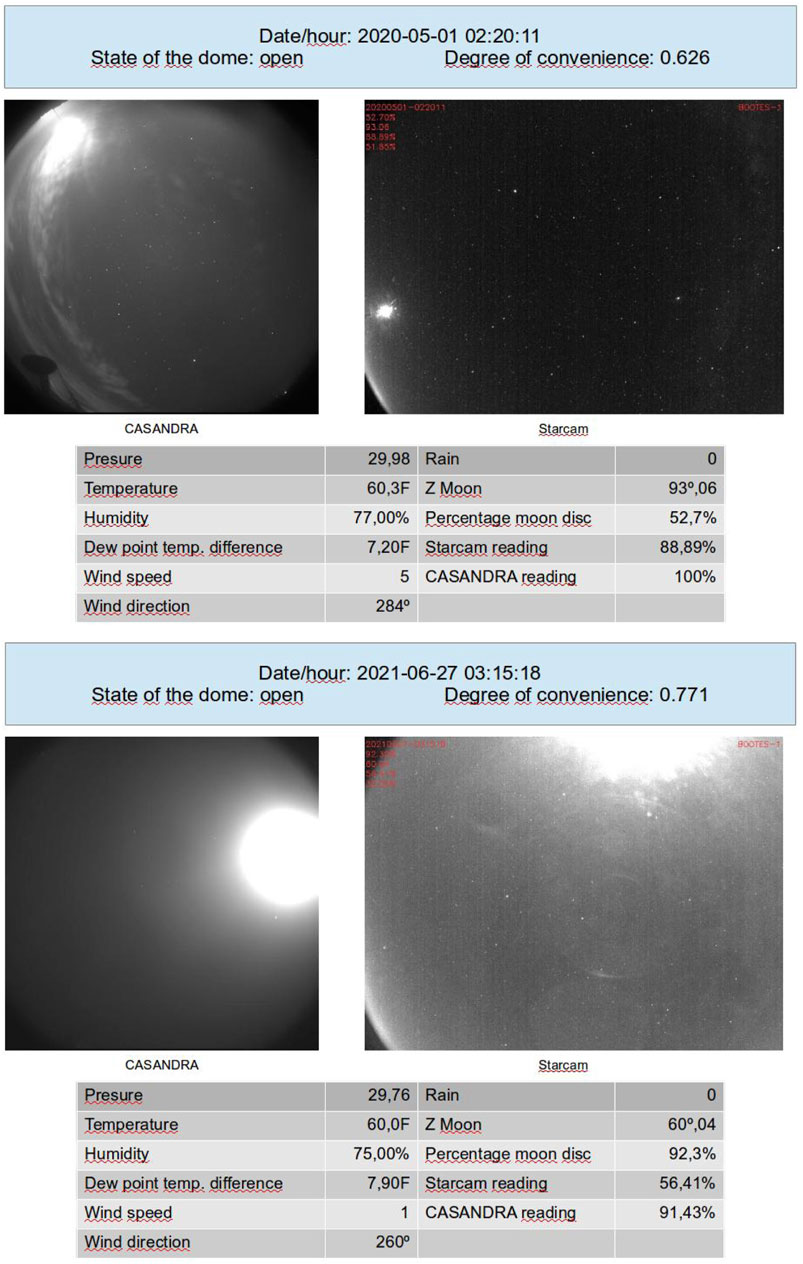
FIGURE 6. Degree of suitability indicates open dome, and the dome was open.
Figure 7 shows two cases where the degree of convenience advises to close the dome with the dome being closed. In the first one, there was a cumulative rainfall in the last hour of 0.42 inches, which forces the inference engine to return a 0 degree of convenience to open dome. The second was completely cloudy with a Starcam reading of 0% stars found.
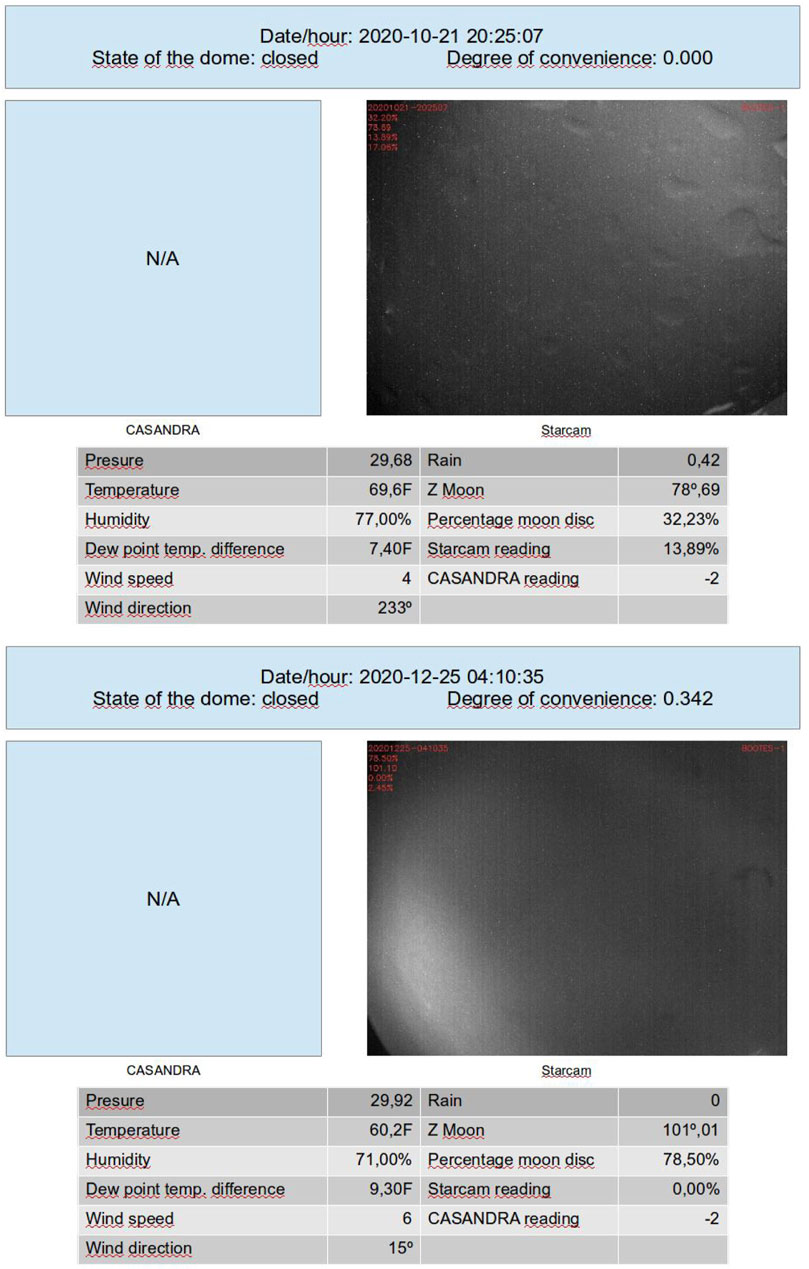
FIGURE 7. Degree of suitability indicates close dome, and the dome was closed.
Figure 8 shows two examples where the dome was closed, but the Mamdani engine indicates that it should have been opened.
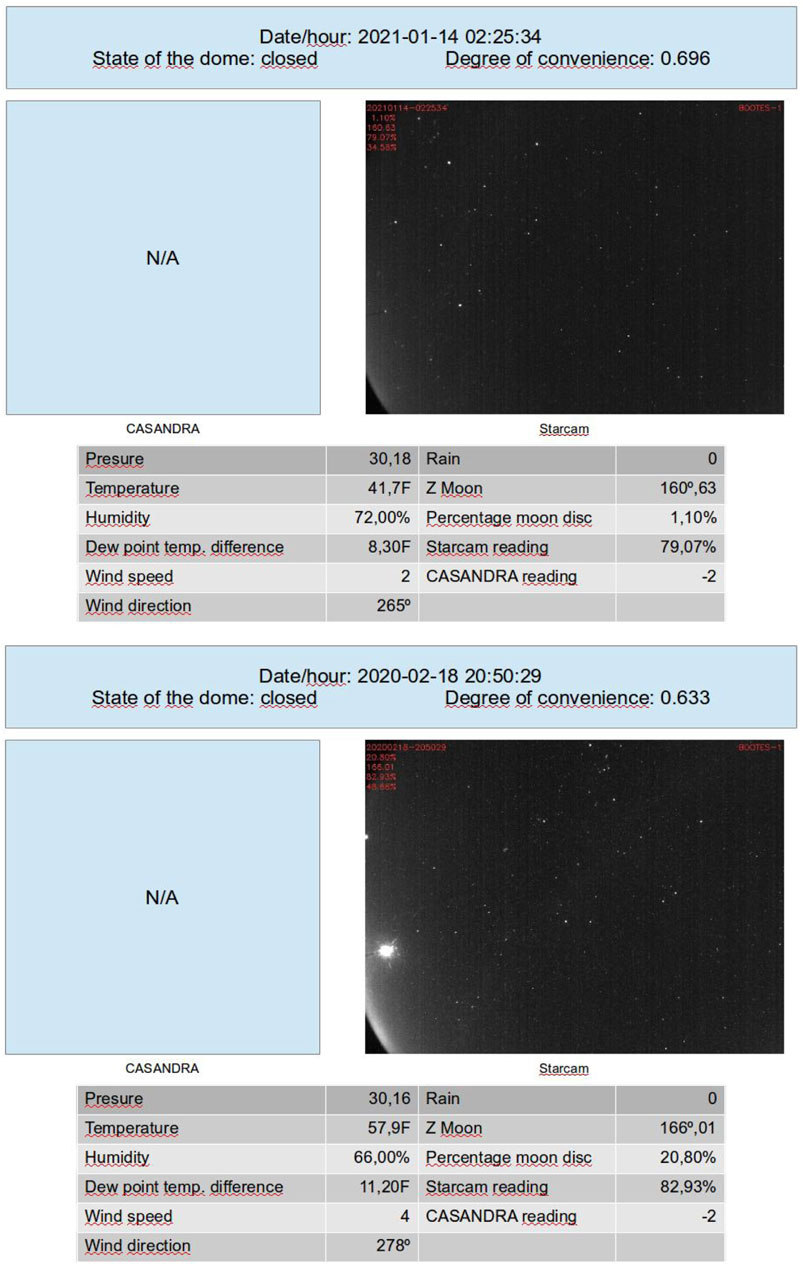
FIGURE 8. Dome was closed, but the degree of convenience indicated that it could have remained open.
Finally, Figure 9 shows two cases where the dome was open, yet the method of inference indicates that it should have been closed.
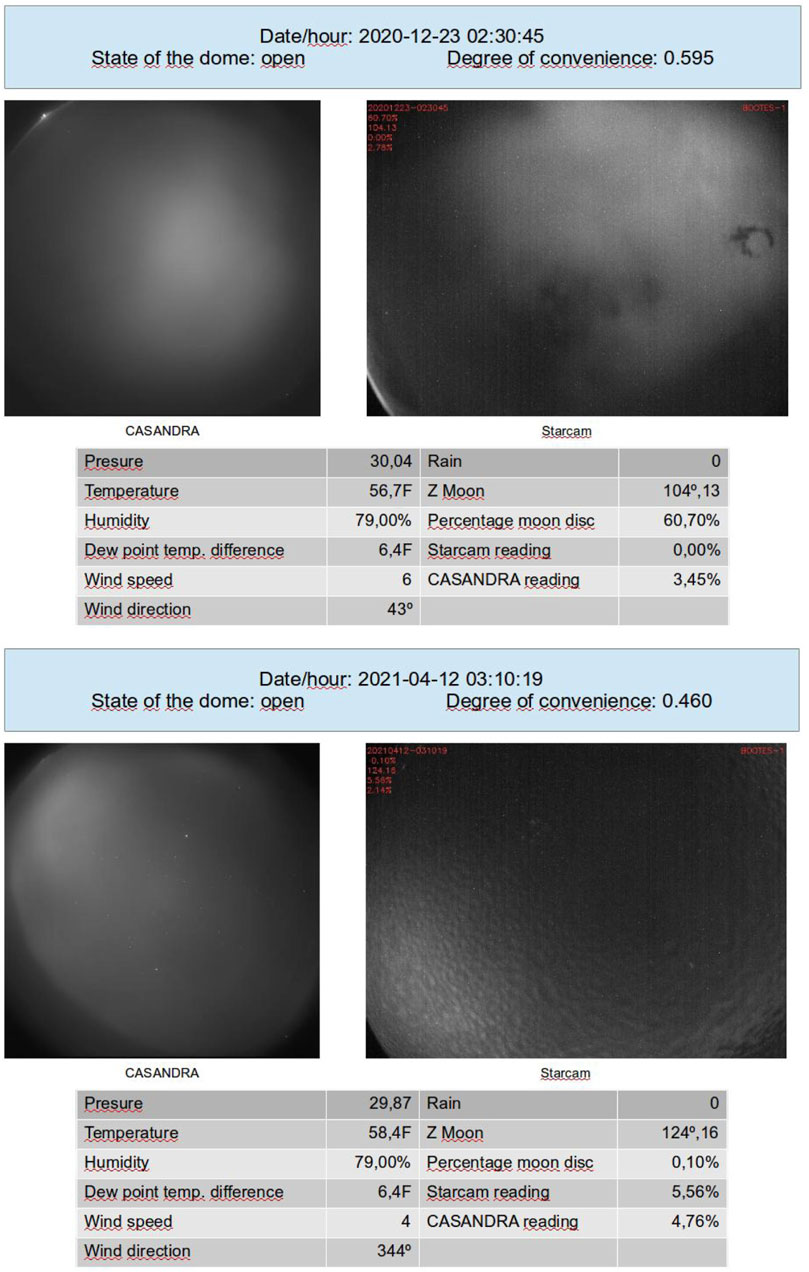
FIGURE 9. Dome was open, but the degree of convenience indicated that it could have remained closed.
The tests described in the previous section have been performed with data collected from the past and applying the inference method to it. Now, it is time to perform the tests with data obtained in real time. It has not been possible to tackle this task at the time of writing this article due to a recent malfunction of the weather station, which returns absurd data for humidity and outside temperature to the dome and has yet to be corrected.
Our intention is to export this method tested at the BOOTES-1 observatory to the rest of the BOOTES observatories, which are equipped with the same instrumentation. In each of them, we must then carry out the corresponding statistical studies in order to determine the corresponding membership functions.
We assume that some adjustments to the endpoints of the membership functions of the variables will result from real-time experimentation.
The very first task of an astronomical observatory before starting its observing work is to check whether the conditions are right for opening the dome. In networks of robotic observatories around the world, dusk occurs over a too wide a range of times to be monitored by a human. Thus, an algorithm has to be developed to make that decision. In this work, we have experimented on the suitability of the tools that fuzzy logic offers in this sense, which has been proven in the absence of completing this experimentation in real time.
The raw data supporting the conclusion of this article will be made available by the authors upon request, without undue reservation.
All authors listed have made a substantial, direct, and intellectual contribution to the work and approved it for publication. Under the leadership ship of AC, both GL and RC, optimized the method, whereas AC-T, EF-G, CP, AR, and SC-C, provided the data and tested the method.
AC-T acknowledges support from the Spanish Ministry Project PID 2020-118491GB-I00, Junta de Andalucía Project P20-01068, and the “Center of Excellence Severo Ochoa” award for the Instituto de Astrofísica de Andalucía (SEV-2017-0709).
The authors declare that the research was conducted in the absence of any commercial or financial relationships that could be construed as a potential conflict of interest.
All claims expressed in this article are solely those of the authors and do not necessarily represent those of their affiliated organizations, or those of the publisher, the editors, and the reviewers. Any product that may be evaluated in this article, or claim that may be made by its manufacturer, is not guaranteed or endorsed by the publisher.
Agboola, A. H., Gabriel, A. J., Aiyu, E. O., and Alese, B. K. (2013). Development of a fuzzy logic based rainfall prediction model. Fed. Univ. Technol. 3 (4), 427–433. P.M.B. 704, Akure, Ondo State, Nigeria.
Akerlof, C. W., Balsano, R., Barthelmy, S., Bloch, J., Butterworth, P., Casperson, D., et al. (1999). Observation of contemporaneous optical radiation from a γ-ray burst Nature, 398, 400–402. doi:10.1038/18837
Barthelmy, S. D., Cline, T. L., Butterworth, P., Kippen, R. M., Briggs, M. S., and Connaughton, V. (1998). The grb coordinates network (gcn): A status report, fourth huntsville gamma-ray burst symposium. AIP Conf. Proc. 428, 99–103. doi:10.1063/1.1361631
Castro-Tirado, A. J., Jelínek, M., Gorosabel, J., Kubánek, P., Cunniffe, R., and Guziy, S. (2012). Building the BOOTES world-wide network of robotic telescopes. Astronomical Soc. India Conf. Ser. 7, 313–320.
Lipunov, V. M., Vladimirov, V. V., Gorbovskoi, E. S., Kuznetsov, A. S., Zimnukhov, D. S., Balanutsa, P. V., et al. (2019). The concept of a multi-functional astronomy complex and dynamically integrated database applied to multi-channel observations with the MASTER global network. Astron. Rep. 63, 293–309. doi:10.1134/s1063772919040073and others
Mamdani, E. H., and Assilian, S. (1975). An experiment in linguistic synthesis with a fuzzy logic controller. Int. J. Man-Machine Stud. 7, 1–13. doi:10.1016/s0020-7373(75)80002-2
Keywords: fuzzy logic, Mamdani, inference model, dome control, robotic observatory
Citation: Castellón A, Larrubia G, Castillo R, Castro-Tirado AJ, Fernández-García E, Pérez del Pulgar C, Reina A and Castillo-Carrión S (2022) Dome control with fuzzy logic. Front. Astron. Space Sci. 9:924871. doi: 10.3389/fspas.2022.924871
Received: 20 April 2022; Accepted: 14 July 2022;
Published: 19 August 2022.
Edited by:
Shilong Liao, Shanghai Astronomical Observatory (CAS), ChinaReviewed by:
Edwin Quintero, Technological University of Pereira, ColombiaCopyright © 2022 Castellón, Larrubia, Castillo, Castro-Tirado, Fernández-García, Pérez del Pulgar, Reina and Castillo-Carrión. This is an open-access article distributed under the terms of the Creative Commons Attribution License (CC BY). The use, distribution or reproduction in other forums is permitted, provided the original author(s) and the copyright owner(s) are credited and that the original publication in this journal is cited, in accordance with accepted academic practice. No use, distribution or reproduction is permitted which does not comply with these terms.
*Correspondence: A. J. Castro-Tirado, YWpjdEBpYWEuZXM=
Disclaimer: All claims expressed in this article are solely those of the authors and do not necessarily represent those of their affiliated organizations, or those of the publisher, the editors and the reviewers. Any product that may be evaluated in this article or claim that may be made by its manufacturer is not guaranteed or endorsed by the publisher.
Research integrity at Frontiers
Learn more about the work of our research integrity team to safeguard the quality of each article we publish.