 Noora Partamies
 Fasil Tesema
 Emma Bland1
- 1The University Centre in Svalbard (UNIS), Longyearbyen, Norway
- 2Birkeland Centre for Space Science, University of Bergen, Bergen, Norway
- 3Department of Physics, University of Helsinki, Helsinki, Finland
Characteristics of pulsating aurora (PsA) at the equatorward part of the auroral oval have been well described in the literature by previous studies. We extend our knowledge on high-latitude PsA observations by analysing 68 PsA events from the optical observatory on Svalbard, at 75° magnetic latitude. We found that the pulsating emission structures are particularly large and transient, they do not experience drift motion, or their drift motion cannot be traced. Our results show that the high-latitude PsA events relate to lower geomagnetic activity and weaker solar wind driving than the lower latitude PsA. The high-latitude PsA events also occur less frequently, which is in agreement with their association to lower-than-average geomagnetic activity. We further show that the ionospheric electron density values during high-latitude PsA events are low compared to the lower latitude PsA. This, together with the non-traceable nature of the pulsating emission structures, suggests that these events are strongly dominated by a sub-type called Amorphous Pulsating Aurora (APA). We therefore conclude that, unlike the lower latitude PsA events, the high-latitude PsA events are not likely to cause direct changes in the chemical composition of the mesosphere.
1 Introduction
Pulsating aurora (PsA) consists of irregular shapes of diffuse aurora, which undergo temporal fluctuations between bright and dim states. A thorough review of PsA properties has been recently published by Nishimura et al. (2020). PsA is known to associate with energetic particle precipitation, hard enough to enhance the ionisation of the D region. This further leads to production of odd hydrogen (HOx, defined as the sum of H, OH, and HO2 molecules) and odd nitrogen (NOx, defined as the sum of N, NO, and NO2 molecules), which in turn catalytically deplete ozone (Turunen et al., 2016; Tesema et al., 2020; Verronen et al., 2021). HOx species mainly affect the mesospheric ozone, while the NOx gases have a long enough lifetime to be transported down to the upper stratosphere in the darkness of the polar night. NOx can thus cause a longer-term reduction in the atmospheric ozone content during the winter season (Verronen et al., 2021).
Based on the visual appearance and temporal behaviour of PsA, Grono & Donovan (2018) categorised auroral pulsations into three sub-classes: patchy aurora (PA), patchy pulsating aurora (PPA) and amorphous pulsating aurora (APA). Both PA and PPA consist of quasi-stable patches of diffuse emission, which experience brightness fluctuations at various extents of the patch area. For both these sub-types the characteristic property is the stability of the patches. They are often trackable in the order of minutes, which includes many periods between stages of dim and bright. This allows individual patches to be followed, and in fact Grono & Donovan (2018) showed that these patches drift along the ionospheric convection.
The range of electron flux during PsA was studied in more detail by Tesema et al. (2020). They used the Sodankylä Ion and Neutral Chemistry model (Verronen et al., 2005) to investigate the chemical impact of median and extreme flux spectra, which were constructed from spacecraft measurements of precipitating electrons. While the median and upper envelope electron spectra led to significant reduction in mesospheric ozone, no appreciable chemical change was detected during electron precipitation following the lower envelope spectrum of PsA. This led the authors to examine if the PsA type was in any way related to the precipitation energy and flux. In their follow-up study Tesema et al. (2020b) demonstrated that the bulk of PA and PPA is related to higher precipitation energies, while the electron density enhancements during APA are on average milder, and the enhancements are concentrated at higher altitudes in the ionosphere. The tendency for high precipitation energy during PA and PPA is in agreement with the statistical occurrence of these two types. According to Grono & Donovan (2020), PA and PPA occurrence is clustered on the magnetic latitudes of 62–68° and magnetic local time (MLT) of 01–06. The majority of APA type, however, is observed within the same latitude and time region but also extending to pre-midnight MLT, deep into the morning sector (in their dataset up to seven MLT), as well as up to 75°MLAT. The limitations of the observed latitude and time ranges are due to the station locations of the Time History of Events and Macroscale Interactions during Substorms (THEMIS) camera network (Donovan et al., 2006).
The existence of high-latitude PsA is not a new observation but has been confirmed by photometer measurements at high latitudes of both hemispheres (Brekke & Pettersen, 1971; Craven & Burns, 1990; Wu & Rosenberg, 1992). These earlier studies focussed on the occurrence rate, pulsation period and emission intensities of PsA. In the first report on high-latitude PsA, Brekke & Pettersen (1971) investigated photometer measurements collected over two winter seasons at Ny-Ålesund station on Svalbard. They concluded that the peak occurrence of PsA takes place at 8:30–10:30 MLT in the pre-noon sector and that no PsA was observed in the afternoon or night sectors, although the photometer was in operation throughout the day in the polar night. They further noted that the PsA characteristics were not dependent on magnetic activity (measured by Kp index), but commented on PsA being most often seen on the southern part of the sky. Later, Craven & Burns (1990) reported post-noon high-latitude PsA from an Antarctic station at 13–14 MLT. These events typically only lasted for half an hour and had 2–3 times longer pulsation periods (20–30 s) than observations from lower latitudes had suggested (2–10 s). The afternoon PsA events occurred later in MLT during low magnetic activity (Kp index 1–2), while during higher magnetic activity (Kp index ≥3) PsA ended earlier as the station moved into the polar cap earlier in the afternoon. As a comparison, Wu & Rosenberg (1992) also studied PsA activity from South Pole station in Antarctica. They reported a maximum occurrence at magnetic noon for Kp index values 0–1, and a dawnward shift of the occurrence maximum at higher Kp. They further identified an appearance of afternoon occurrence maximum of PsA for higher magnetic activity (Kp index ≥3). Recently, Bland et al. (2021) reported D-region electron density enhancements associated with PsA that extended as far as 80° magnetic latitude over Antarctica. They estimated the instantaneous Energetic Electron Precipitation (EEP) impact area associated with PsA events by measuring 10–12 MHz radiowave attenuation using the Super Dual Auroral Radar Network (SuperDARN). In their set of 76 PsA events, five were accompanied by radiowave attenuation at McMurdo Station (80° magnetic latitude). However, the presence of optical PsA was confirmed only at a lower latitude site (at Syowa at 66.5° magnetic latitude), so it was not known whether the radiowave attenuation observed at McMurdo Station during these events was caused by PsA or another type of EEP occurring simultaneously with the lower-latitude PsA.
What is left unexplored is the precipitation characteristics and type of the high-latitude PsA. In this study, we analyse PsA events observed over Svalbard at 75° magnetic latitude where the polar night allows continuous auroral imaging 3 months a year. Earlier studies on high-latitude PsA were based on data from one or two winter season, while we investigate a decade’s worth of auroral image data, which makes the results less biased by the level of solar or geomagnetic activity for any individual winter season. Using image data allows the examination of the two-dimensional structures of PsA. As the previous studies have reported significant atmospheric chemical responses due to PsA electron precipitation at lower latitudes, we want to characterise the high-latitude PsA in order to conclude if this PsA population is likely to contribute to the atmospheric forcing as well.
2 Data and Events
To detect the PsA events we have primarily used auroral all-sky camera quicklook data, i.e. keograms, from a DSLR all-sky camera (ASC) at the Kjell Henriksen Observatory (KHO) on Svalbard. The keograms consist of north–south slices of individual images (see samples in Figure 2), which are assembled together in time order. PsA appears as thin green and dark vertical stripes in the keograms as the diffuse aurora structures turn on and off (see the keogram part below the white curve in Figure 1). As a result of visually viewing all keograms of the colour DSLR data since 2010, we gathered 68 PsA events in total. We followed the event selection criteria of Partamies et al. (2017) in that the pulsations were required to reach the local zenith, and that no events shorter than 30 min were considered. While the lifetime limit is mainly determined by what is reliably detectable in keograms, the minimum PsA duration in our event set is about an hour. The requirement of PsA reaching the local zenith is implemented to allow comparisons with zenith and field aligned pointing European Incoherent Scatter (EISCAT) radar experiments.
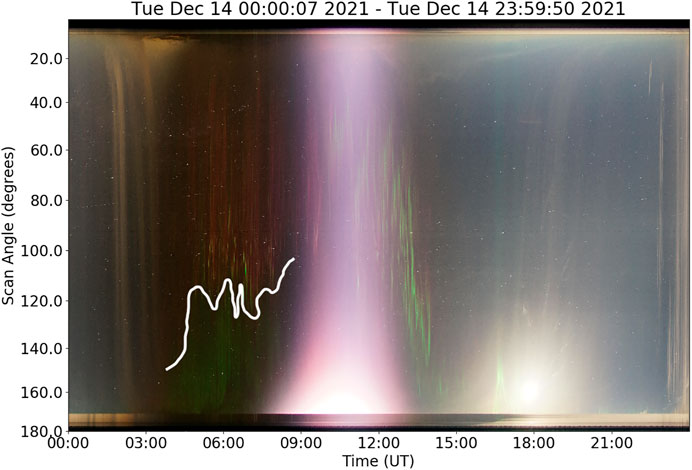
FIGURE 1. An example keogram on 14 December 2012. Scan angle 0° is towards magnetic north and 180° is towards magnetic south. The orange glow at two to three UT is light pollution illuminated thin clouds. The white curve between three and nine UT and scan angles of 100°–150° approximately separates the red-dominated morning sector aurora over the zenith from the green pulsating aurora over the southern part of the sky. The red/purple glow between about 9 and 13 UT is daylight, during which some red and green auroral structures can be seen. Green aurora continues until about 15 UT. The bright object on the southern sky at 17–18 UT is the moon. At Svalbard the magnetic local time (MLT) is about UT + 3 h.
We also selected a reference set of events during which PsA signatures are observed on the southern part of the field-of-view without them reaching all the way to the local zenith. This consists of 57 events from the same years as our primary PsA, in 2010–2021, but different days. These PsA periods can be used to assess the role of the solar wind and magnetic activity driving in latitude extent of PsA.
Figure 1 shows an example of the colour ASC daily quicklook data we have used to initially identify PsA events. At 03–09 UT the white curve separates the red-dominated dayside auroral structures at and poleward of the zenith from the green PsA further equatorward. The green PsA consists of diffuse emission with thin vertical stripes that appear as the auroral structures turn on and off over time. This example PsA event did not reach the local zenith (scan angle 90°), but was selected to the reference set of events where PsA only appears equatorward of local zenith (fourth column in Table 1).
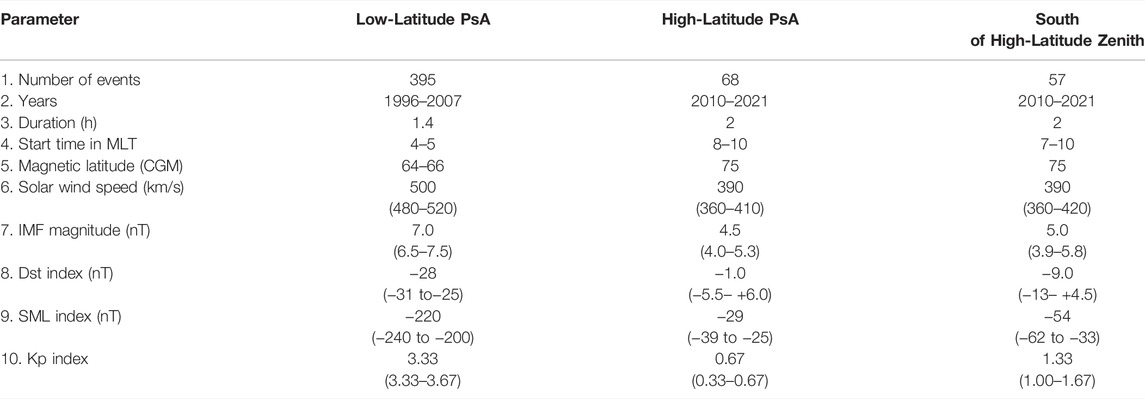
TABLE 1. Median values of basic characteristics as well as solar wind and magnetic parameters during PsA at low and high latitudes. The last column includes a set of events where PsA is seen on the souther part of the sky but does not reach the zenith. The numbers in parentheses under each median value describe the median value confidence intervals based on bootstrapping.
For further sub-categorising the high-latitude PsA types we have examined individual images in addition to the keograms. These full-colour images are captured at a cadence of about 12 s. Following the PsA sub-categorisation of the earlier work by Grono & Donovan (2018) and Tesema et al. (2020b), the keograms of the high-latitude PsA show no convection-driven “streamlines” of quasi-stable patches but rather only thin stripes. The finding is confirmed by viewing individual images, which are dominated by large transient regions of diffuse emission, as shown by a sequence of images in Figure 2. These regions do not drift, or their drift is not traceable. It is therefore not applicable to talk about pulsation periods in connection with these PsA events. These observations refer to Amorphous Pulsating Aurora (APA) type. In our high-latitude PsA event set and the reference set of PsA events, we found only one case where patches with little pulsations appeared. This Patchy Aurora (PA) region was surrounded by APA type transient structures. An eastward drift of some individual patches was apparent during most of the event. An animation of this example event as well as an animation of the more typical event in Figure 2 are uploaded as Supplementary Material.
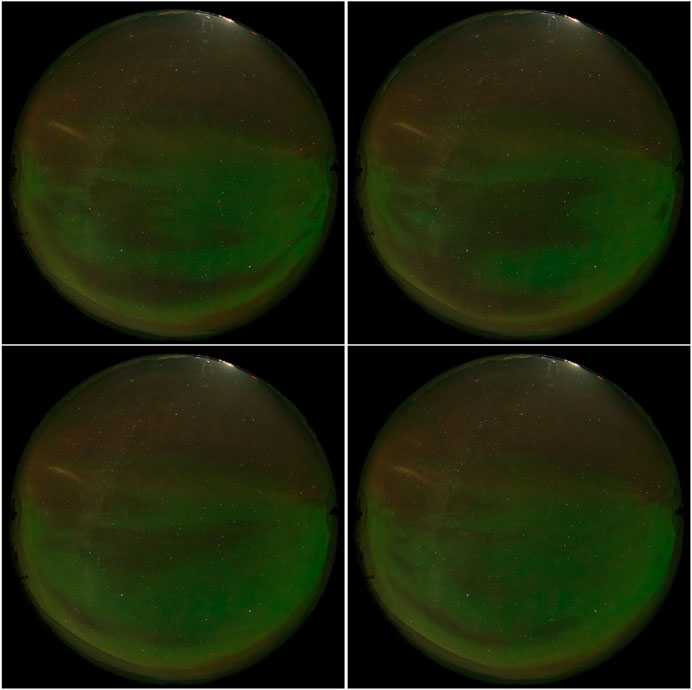
FIGURE 2. Four consecutive images from the KHO colour all-sky camera during a pulsating aurora event on 16 January 2021. The images are taken at 06:13:15 (top left), 06:13:27 (top right), 06:13:38 (bottom left), and 06:13:50 UT (bottom right). North is to the top and east to the left in the images. An animation of the whole PsA event from 05:50 UT until 07:30 UT is included as supplementary material.
To determine the solar wind driving conditions we used the OMNIWeb data for solar wind speed and Interplanetary Magnetic Field (IMF). These data are propagated to the magnetopause and have a temporal resolution of 1 minute. We also used the Dst index to assess the geomagnetic activity conditions. These index data were downloaded from the World Data Centre in Kyoto in 1 hour time resolution. We further used the lower envelope curve of the SuperMAG auroral electrojet index, SML (Gjerloev, 2012) to assess the global electrojet activity level, as well as Kp index (Matzka et al., 2021), which scales with the size of the auroral oval (Sigernes et al., 2011).
EISCAT Svalbard Radar (Wannberg et al., 1997) is located about 1 km away from KHO, thus providing ionospheric measurements within the ASC zenith region. The data consist of height profiles of electron density, electron and ion temperature and ion velocity as a standard set of parameters along the radar beam with a temporal resolution of 1 minute. In this study, we only analyse the electron density profiles collected during PsA events that reached the radar field-of-view. EISCAT data were available for 20 PsA events. The radar experiments1 range from arc_slice and manda with altitude resolutions of 0.9 km and 0.5–1.0 km respectively, to tau7, ipy, beata, folke and taro with altitude resolutions of 3–4 km at the bottom part of the ionosphere. For all the experiments during the PsA events we only use data from the non-steerable parabolic antenna (a diameter of 42 m). These data are analysed for the electron density values at the height range of 80–110 km, divided into three 10 km thick layers. Each height layer then includes two to three electron density values per profile, except for the high-resolution experiments arc_slice and manda where 10–20 electron density values are resolved in each 10 km layer.
3 Results
3.1 Duration and Local Time for PsA
As a low-latitude reference of PsA events we use the list of about 400 PsA events by Partamies et al. (2017), which is based on a decade long time series of ASC images from five camera stations in the Fennoscandian Lapland. This region sees mainly the equatorward part of the auroral oval, and thus the particle precipitation region from the outer radiation belt. It is worth noting that this reference set of PsA events is seven times larger than the list of our high-latitude PsA events, and covers a different time period that is equally long but does not overlap (see Table 1). Nonetheless, the comparison is valid for typical values of solar wind driving conditions and the underlying level of magnetic activity during PsA.
Key parameters characterising the PsA events are collected in Table 1. The difference in the number of PsA events for the two equally long time periods is striking. While the local cloudiness may affect the number of high-latitude events, which are detected from one station data rather than multiple, this is unlikely to be the only reason for such a big difference. Furthermore, the time span of high-latitude events has been magnetically quieter than that of the low-latitude events, which should be favourable for high-latitude PsA. This kind of an effect is not seen.
The median duration of 1.4 h was reported for the low-latitude events by Partamies et al. (2017) and 2 h by Tesema et al. (2020). The authors also noted, however, that their value was conservative and often limited by the end of the imaging at sunrise. The duration of the high-latitude events (parameter three in Table 1) is about 0.5 h longer. A more recent radar study on PsA showed that indeed the median lifetime of PsA is likely to be over 2 hours (Bland et al., 2019), while also taking into account events lasting for less than 30 min. Our high-latitude PsA events also last for about 2 hours, and they also often become undetectable due to the increasing daylight (as can be seen in Figure 1). In the Svalbard winter the daylight period is short so this is considered as a minor limitation. On the other hand, other precipitation regions often dominate the camera field-of-view around noon.
The start time of the PsA period in MLT (parameter four in Table 1) is consistently 3–4 h earlier for the low-latitude events as compared to the high-latitude events. Although Partamies et al. (2017) showed an event where pulsations continued over Svalbard as soon as the patches disappeared from the Lapland FoV, this scenario is clearly not the average case. There are much fewer PsA events observed at high latitudes and their occurrence in MLT does not often continue seamlessly from the low-latitude PsA activity. The high-latitude PsA typically starts between 7 and 11 MLT, as shown in Figure 3. With the duration of about 1–3 h about half of these events last past the MLT noon.
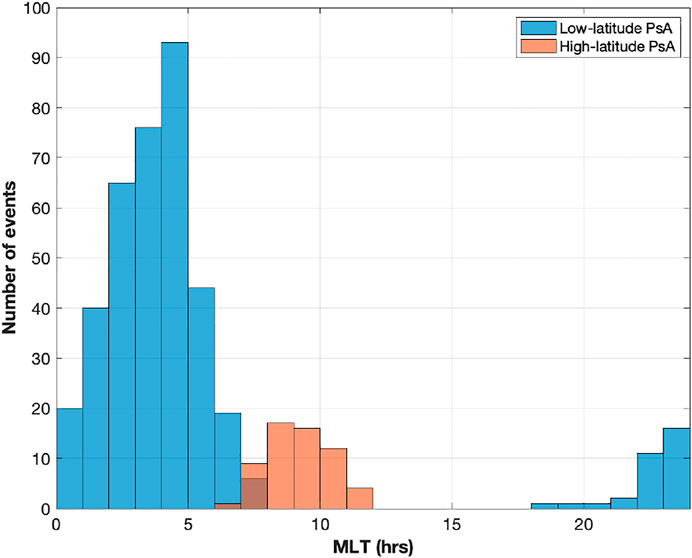
FIGURE 3. The MLT distribution of low-latitude PsA (blue) and high-latitude PsA (salmon). We have used the start time of the PsA event to compile these histograms. The MLT is estimated as UT+2.5 h for the low-latitude events and as UT+3 h for the high-latitude events.
3.2 Solar Wind and Geomagnetic Activity Conditions for PsA
Solar wind speed and IMF magnitude median values are listed in Table 1 (parameters 6 and 7) for PsA from the two latitude ranges. While the median solar wind speed for the low-latitude PsA of 500 km/s exceeds the average speed, the wind speed during the high-latitude events is about 390 km/s, which is at the level of average solar wind speed or below. The difference in the solar wind speed for the two PsA populations is illustrated by the histograms in Figure 4. The solar wind speed distribution for the low-latitude events extends up to 800 km/s (blue histogram), while no solar wind speed values above 600 km/s have been observed during the high-latitude PsA events (salmon histogram). Due to the large difference between the number of events in the two PsA populations, we used the bootstrapping method to estimate the confidence interval of the median values. The low-latitude PsA distributions were resampled with replacement 500 times and the high-latitude PsA distributions 100 times. The resulting confidence intervals for the median values are given in the parentheses under the median values in Table 1. Even with the relatively small sample sizes in this study, the median values of the two PsA populations clearly differ from each other.
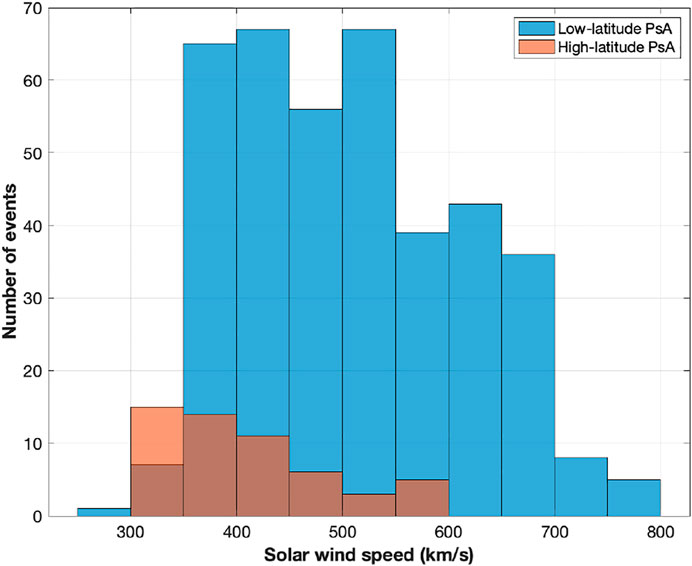
FIGURE 4. The solar wind speed distribution during the low-latitude PsA (blue) and high-latitude PsA (salmon). We have plotted the median solar wind speed during the individual PsA periods.
The IMF magnitude values (parameter seven in Table 1) for the two PsA populations reveal a similar behaviour: the solar wind driving is stronger during the low-latitude PsA events than it is during the high-latitude PsA events. Both Dst, SML and Kp index values (parameters 8–10 in Table 1) also suggest stronger activity during the low-latitude PsA than during the high-latitude PsA. The bootstrapped confidence intervals of the median values for the two PsA populations are clearly separated. This suggests that the low-latitude PsA events take place during substorm recovery phases, while the high-latitude PsA does not have a direct relationship to the global magnetic activity. Instead, the high-latitude events occupy a globally quiet auroral oval, where the “quiet” is not just a time sector difference from the midnight but occurs during the time when the midnight oval is also quiet.
The fourth column of Table 1 contains the same solar wind and magnetic activity parameters for our reference set of high-latitude PsA events. For this event set we have chosen PsA periods that are observed in the Svalbard ASC data but which only occupy the southern part of the sky without ever reaching the local zenith. These “south of high-latitude zenith” events do not have overlap with the high-latitude PsA events but are a completely separate PsA population. With this additional event set we hope to determine the main driver that brings the PsA poleward. Judging by the median values in the table, PsA stays equatorward of the Svalbard zenith when the global electrojet activity is elevated during the late morning MLT hours. SML and Kp index median values for this reference event set are about twice that for the high-latitude PsA, while none of the other parameters listed in the table shows a significant difference.
3.3 Particle Precipitation During PsA
All available EISCAT Svalbard Radar electron density profiles measured during PsA have been analysed to outline the electron density behaviour in the ionosphere at 80–110 km. As these data have been collected by radar runs with eight different experiments and variable altitude resolutions, we bin all electron density values into three height layers: 80–90 km, 90–100 km and 100–110 km. Additional time averaging is not done but all measured electron density profiles within the PsA periods have been included individually in the height averaging. This procedure is comparable to that by Tesema et al. (2020b). The temporal resolution of analysed EISCAT data is ∼1 min. Most of the 20 PsA events, for which EISCAT data were available, were covered over the full lifetime of the events. Seven PsA events started before the radar experiment did but only four of them lack more than 30 min of data coverage at the beginning. In total 2457 individual electron density profiles were collected during the PsA events.
The results in Figure 5 show that the logarithm of the electron densities in m−3 decreases with decreasing height. Above 100 km, log (Ne) varies from 10.5 to 11 (black histogram). At 90–100 km the logarithm ranges from 9.8 to 10.8 (purple histogram). The widest distribution of electron densities is found at the height of 80–90 km, where log (Ne) peaks at 9.7 but ranges from 9 to 10.4 (orange histogram).
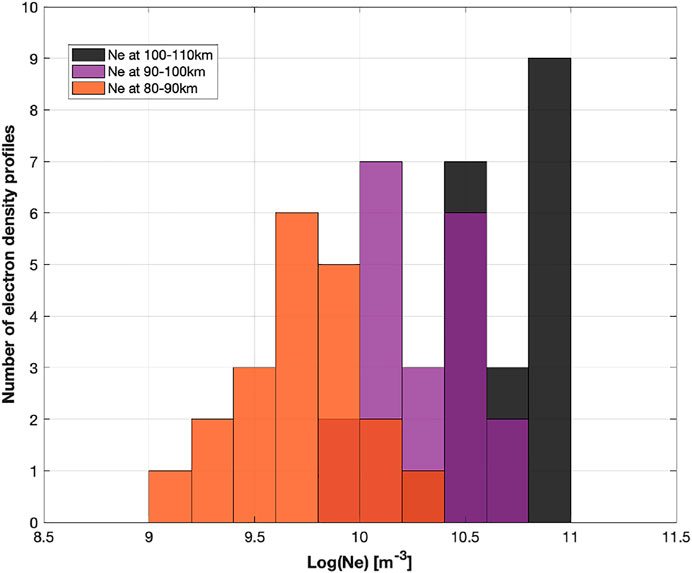
FIGURE 5. All available electron density (Ne) profiles during PsA events have been averaged over three height regions: 80–90 km (orange), 90–100 km (purple) and 100–110 km (black). The bars here are transparent to show the height of the bars behind. The bin width is 0.2.
In the results by Tesema et al. (2020b), the logarithm of the electron densities for all PsA types peaked in the range of 11–11.5 at the height of 100–110 km. Percentile values of 10%, 50% and 90% for APA at that height range were 10.8, 11.2, and 11.5 respectively. At 90–100 km, their APA related electron density log values for 10% and 90% percentiles were 10.2 and 11.3 with a median of 10.8. And at 80–90 km, the log (Ne) observed during APA events had 10% and 90% percentiles of 9.4 and 10.6 with a median value of 10.1. Our results overlap with the lower range of their Ne distributions, as apart from two values the high-latitude electron densities are below the median values observed during low latitude APA events. While our results mainly overlap with the low value tails of the electron density distributions collected during APA type PsA of Tesema et al. (2020b), it is worth noting that both PA and PPA also have the tail of the distribution towards the low electron density values.
4 Discussion
To the best of our knowledge this is the first large-scale report and characterisation of high-latitude PsA. Svalbard image data provide a unique opportunity to examine the occurrence and properties of high-latitude PsA. While ASC stations within the main auroral oval region will never experience dark skies during the day, the Svalbard camera data allows us to study the occurrence and the appearance of PsA at any time of the day during the polar night from November until February. The decade of images analysed here does not include a single PsA event at any other time of the day than the pre-noon sector, at 3–10 UT or 6–13 MLT. About half of these events extend across the MLT noon. This is in agreement with the early report on high-latitude pulsating aurora by Brekke & Pettersen (1971), who found high-latitude PsA exclusively in the pre-noon hours. The agreement of these studies suggests that the lack of afternoon PsA in the early study was not due to a solar activity bias as our study covers a full solar cycle.
PsA studies by Partamies et al. (2017) and Tesema et al. (2020) investigated events at the equatorward part of the auroral, which is considered more typical latitude region for PsA occurrence. Compared to their results, our high-latitude PsA events have a lower occurrence rate, and they are related to milder magnetic activity and weaker solar wind driving as well as less energetic electron precipitation. Our results further show that the milder magnetic activity is not only due to the PsA event times being temporally farther away from the midnight sector substorm activity, but that the magnetic activity is globally less severe during the high-latitude PsA as compared to earlier reports of PsA at the equatorward part of the oval. It is particularly interesting that our PsA observations show electron densities towards the tail of the electron density distributions measured at lower latitudes (Tesema et al., 2020b). PsA has been shown to have a significant effect on the atmospheric chemistry and a significant role in the precipitation energy deposition in the morning sector MLT (Hosokawa & Ogawa, 2015; Tesema et al., 2020; Verronen et al., 2021; Partamies et al., 2022). However, all studies on atmospheric impact have been based on PsA at the equatorward part of the oval with an MLT span from midnight until about six MLT. Our findings suggest that these high-latitude PsA events do not significantly contribute to the changing mesospheric chemistry as the bulk part of the precipitation energy is deposited higher up in the atmosphere. In fact, the high-latitude PsA events more likely resemble the lower envelope energy-flux spectrum of PsA, which has been shown to cause no HOx production and no O3 depletion (Tesema et al., 2020).
The quiet electrojet conditions observed during high-latitude PsA suggest an anti-correlation between latitudes of PsA occurrence and geomagnetic activity. The higher the geomagnetic activity the lower latitudes the PsA occupy as the auroral oval expands. This idea is verified by employing a reference PsA event set where PsA is observed in the Svalbard image data but does not reach the local zenith (Table 1). In these reference set cases Kp index exceeds unity, while during our zenith-reaching events Kp stays below unity. The fact that Kp is only required to exceed one for PsA not reaching the zenith over Svalbard may also explain why so few high-latitude PsA events were detected over a decade. In the time span of our PsA events (2010–2021) Kp index was below one only for 30% of the time in total. Just like in the early report by Brekke & Pettersen (1971), the occurrence time of our PsA events does not show correlation with the magnetic activity. The meridional extent of PsA, however, does seem to correlate with the magnetic activity.
The statistical occurrence of different PsA types by Grono & Donovan (2020) does not cover our high-latitude region, nor the local magnetic noon. What they do suggest, however, is that APA type reaches furthest poleward and closest to noon. Bland et al. (2019) observed PsA activity extending to magnetic noon at Syowa Station (66.5° magnetic latitude). The five PsA-related events at McMurdo station (80° magnetic latitude) reported by Bland et al. (2021) were classified as APA and one as PPA. The classification was done for Syowa Station where optical data were available, while the rest of the PsA observations were based on HF attenuation of the SuperDARN radar signal and noise. It is worth noting, however, that the whole set of southern hemispheric events was heavily biased by APA (over 70%). Nonetheless, their PsA observations give an indication towards high-latitude PsA being primarily APA. These PsA-related HF attenuation events took place during the late afternoon to pre-midnight MLT hours with Kp index at 2–3. This may indicate that the EEP was related to high-latitude substorm precipitation rather than PsA at McMurdo. However, as mentioned by Grono & Donovan (2018), APA type PsA tend to occur earlier than the other PsA types. APA type has been observed pre-midnight and within substorm aurora, and may thus contribute to substorm-related particle precipitation as well.
In particular our visual sub-categorisation but also the fact that our PsA events were associated with relatively low electron densities, strongly supports the conclusion that the high-latitude PsA events are nearly exclusively APA type events. While our comparison of ionospheric electron densities between low and high latitude PsA events does not take into account a possible difference between the ambient ionospheric conditions of the two station locations, both electron density studies are performed for local time hours leading to the daylight. As we further only conclude that the high-latitude electron density values are low (below the median value) compared to the range of electron densities reported by (Tesema et al., 2020b) during APA type PsA, we anticipate that our conclusion is robust enough to support the visual PsA categorisation of this study. In agreement with earlier studies, our findings indicate that APA tends to be the PsA type carrying the least energy into the atmosphere. It is thus not likely to cause direct chemical changes in the mesosphere but would rather represent the lower envelope energy-flux spectrum of PsA. It is important to note, however, that even without the ionisation reaching the mesosphere, a significant indirect chemical impact may take place through thermospheric ionisation, NOx production and consequent downward transport inside the winter polar vortex (Verronen et al., 2021).
While our PsA population that occurs south of the high latitude zenith (rightmost column in Table 1) may be related to earlier substorm activity in the midnight sector with dawnward drifting energetic electrons, the high-latitude PsA are less dependent on geomagnetic activity and more persistent during quiet conditions. This is in agreement with high-latitude chorus wave observations, which peak in the noon sector and persist through the magnetically quiet time (Spasojevic & Inan, 2010). Due to the quiet conditions the fluxes of the high-energy source electron population may be lower, which can explain the dominance of low-energy APA in the dayside PsA observations. As discussed by Liang et al. (2021), while patchy pulsating aurora is commonly related to cold plasma structuring at the equatorial region, the APA type PsA does not necessarily have the same source region. They further noted a possibility that the APA type would be associated with depletions rather than enhancements in the cold plasma. This would lead to lower fluxes of energetic electrons available for wave-particle interaction and thus, lower fluxes of precipitation. However, there are still unanswered questions about the structuring and the source region of the APA type PsA. Resolving the remaining questions will require coordinated ground and space-based measurements during the different PsA types.
5 Conclusion
We have analysed a decade of high-latitude auroral image data for signatures of pulsating aurora (PsA). In total, we identified 68 PsA events, which is a low number compared to the length of the data series. The occurrence of these PsA events is focussed on the pre-noon magnetic local time (MLT) sector, between about 5 and 11 MLT. About half of our PsA events lasted into the post-noon sector, but no late afternoon or nighttime PsA were found. Our results show that these PsA events are related to lower geomagnetic activity and lower solar wind driving compared to PsA at lower latitudes. Electron density measurements during our PsA events also show lower values at ionospheric heights of 80–110 km compared to the PsA events at lower latitudes. Both the low ionisation rate and the transient and non-traceable appearance of these PsA events suggest that they are of sub-type called Amorphous Pulsating Aurora (APA). Due to their low ionisation rate these PsA events are not likely to lead to any direct changes in the mesospheric chemical composition, but will rather contribute to the indirect chemical changes during the winter months.
Data Availability Statement
The original contributions presented in the study are included in the article/Supplementary Material, further inquiries can be directed to the corresponding author.
Author Contributions
All authors listed have made a substantial, direct, and intellectual contribution to the work and approved it for publication.
Funding
The work by NP is supported by the Norwegian Research Council (NRC) under CoE contract 223252. FT is funded by Finnish Centre of Excellence in Research of Sustainable Space (Academy of Finland grant number 312351). The work by EB is supported by NRC under the contract 287427.
Acknowledgments
The authors thank Claudia Buck from FH Aachen in Germany for exploring the topic of high-latitude PsA events for her Bachelor thesis. Without those conversations this work would still be undone. The authors also thank the KHO team and PI Dag Lorentzen for maintenance of the auroral colour camera. We gratefully acknowledge the SuperMAG collaborators (https://supermag.jhuapl.edu/info/?page=acknowledgement).
Conflict of Interest
The authors declare that the research was conducted in the absence of any commercial or financial relationships that could be construed as a potential conflict of interest.
Publisher’s Note
All claims expressed in this article are solely those of the authors and do not necessarily represent those of their affiliated organizations, or those of the publisher, the editors and the reviewers. Any product that may be evaluated in this article, or claim that may be made by its manufacturer, is not guaranteed or endorsed by the publisher.
Supplementary Material
The Supplementary Material for this article can be found online at: https://www.frontiersin.org/articles/10.3389/fspas.2022.923396/full#supplementary-material
Footnotes
1For experiment descriptions see: https://eiscat.se/scientist/document/experiments/
References
Bland, E. C., Partamies, N., Heino, E., Yukimatu, A. S., and Miyaoka, H. (2019). Energetic Electron Precipitation Occurrence Rates Determined Using the Syowa East SuperDARN Radar. JGR Space Phys. 124, 6253–6265. doi:10.1029/2018JA026437
Bland, E., Tesema, F., and Partamies, N. (2021). D-region Impact Area of Energetic Electron Precipitation during Pulsating Aurora. Ann. Geophys. 39, 135–149. doi:10.5194/angeo-39-135-2021
Brekke, A., and Pettersen, H. (1971). Some Observations of Pulsating Aurora at Spitzbergen. Planet. Space Sci. 19, 536–540. doi:10.1016/0032-0633(71)90171-1
Craven, M., and Burns, G. B. (1990). High Latitude Pulsating Aurorae. Geophys. Res. Lett. 17, 1251–1254. doi:10.1029/GL017i009p01251
Donovan, E., Mende, S., Jackel, B., Frey, H., Syrjäsuo, M., Voronkov, I., et al. (2006). The THEMIS All-Sky Imaging Array-System Design and Initial Results from the Prototype Imager. J. Atmos. Solar-Terrestrial Phys. 68, 1472–1487. doi:10.1016/j.jastp.2005.03.027
Gjerloev, J. W. (2012). The SuperMAG Data Processing Technique. J. Geophys. Res. 117, a–n. doi:10.1029/2012JA017683
Grono, E., and Donovan, E. (2018). Differentiating Diffuse Auroras Based on Phenomenology. Ann. Geophys. 36, 891–898. doi:10.5194/angeo-36-891-2018
Grono, E., and Donovan, E. (2020). Surveying Pulsating Auroras. Ann. Geophys. 38, 1–8. doi:10.5194/angeo-38-1-2020
Hosokawa, K., and Ogawa, Y. (2015). Ionospheric Variation during Pulsating Aurora. J. Geophys. Res. Space Phys. 120, 5943–5957. doi:10.1002/2015JA021401
Liang, J., Nishimura, Y., Donovan, E., Yang, B., and Angelopoulos, V. (2021). Potential Association between the Low-Energy Plasma Structure and the Patchy Pulsating Aurora. Front. Astron. Space Sci. 8, 792653. doi:10.3389/fspas.2021.792653
Matzka, J., Stolle, C., Yamazaki, Y., Bronkalla, O., and Morschhauser, A. (2021). The Geomagnetic Kp Index and Derived Indices of Geomagnetic Activity. Space weather. 19. doi:10.1029/2020SW002641
Nishimura, Y., Lessard, M. R., Katoh, Y., Miyoshi, Y., Grono, E., Partamies, N., et al. (2020). Diffuse and Pulsating Aurora. Space Sci. Rev. 216 (4). doi:10.1007/s11214-019-0629-3
Partamies, N., Whiter, D., Kadokura, A., Kauristie, K., Nesse Tyssøy, H., Massetti, S., et al. (2017). Occurrence and Average Behavior of Pulsating Aurora. J. Geophys. Res. Space Phys. 122, 5606–5618. doi:10.1002/2017JA024039
Partamies, N., Whiter, D., Kauristie, K., and Massetti, S. (2022). Local Time Dependence of Auroral Peak Emission Height and Morphology. Ann. Geophys. Discuss. doi:10.5194/angeo-2022-6
Sigernes, F., Dyrland, M., Brekke, P., Chernouss, S., Lorentzen, D. A., Oksavik, K., et al. (2011). Two Methods to Forecast Auroral Displays. J. Space Weather Space Clim. 1, A03. doi:10.1051/swsc/2011003
Spasojevic, M., and Inan, U. S. (2010). Drivers of Chorus in the Outer Dayside Magnetosphere. J. Geophys. Res. 115, a–n. doi:10.1029/2009JA014452
Tesema, F., Partamies, N., Nesse Tyssøy, H., and McKay, D. (2020b). Observations of Precipitation Energies during Different Types of Pulsating Aurora. Ann. Geophys. 38, 1191–1202. doi:10.5194/angeo-38-1191-2020
Tesema, F., Partamies, N., Tyssøy, H. N., Kero, A., and Smith‐Johnsen, C. (2020). Observations of Electron Precipitation during Pulsating Aurora and its Chemical Impact. JGR Space Phys. 125. doi:10.1029/2019JA027713
Turunen, E., Kero, A., Verronen, P. T., Miyoshi, Y., Oyama, S. I., and Saito, S. (2016). Mesospheric Ozone Destruction by High‐energy Electron Precipitation Associated with Pulsating Aurora. JGR Atmos. 121, 11852–11861. doi:10.1002/2016JD025015
Verronen, P. T., Kero, A., Partamies, N., Szeląg, M. E., Oyama, S.-I., Miyoshi, Y., et al. (2021). Simulated Seasonal Impact on Middle Atmospheric Ozone from High-Energy Electron Precipitation Related to Pulsating Aurorae. Ann. Geophys. 39, 883–897. doi:10.5194/angeo-39-883-2021
Verronen, P. T., Seppälä, A., Clilverd, M. A., Rodger, C. J., Kyrölä, E., Enell, C.-F., et al. (2005). Diurnal Variation of Ozone Depletion during the October-November 2003 Solar Proton Events. J. Geophys. Res. 110. doi:10.1029/2004JA010932
Wannberg, G., Wolf, I., Vanhainen, L.-G., Koskenniemi, K., Röttger, J., Postila, M., et al. (1997). The EISCAT Svalbard Radar: A Case Study in Modern Incoherent Scatter Radar System Design. Radio Sci. 32, 2283–2307. doi:10.1029/97RS01803
Keywords: pulsating aurora, particle precipitation, ionosphere, solar wind driving, high-latitude aurora
Citation: Partamies N, Tesema F and Bland E (2022) Appearance and Precipitation Characteristics of High-Latitude Pulsating Aurora. Front. Astron. Space Sci. 9:923396. doi: 10.3389/fspas.2022.923396
Received: 19 April 2022; Accepted: 09 June 2022;
Published: 26 July 2022.
Edited by:
Simon Wing, Johns Hopkins University, United StatesReviewed by:
Agnit Mukhopadhyay, National Aeronautics and Space Administration, United StatesJun Liang, University of Calgary, Canada
Copyright © 2022 Partamies, Tesema and Bland. This is an open-access article distributed under the terms of the Creative Commons Attribution License (CC BY). The use, distribution or reproduction in other forums is permitted, provided the original author(s) and the copyright owner(s) are credited and that the original publication in this journal is cited, in accordance with accepted academic practice. No use, distribution or reproduction is permitted which does not comply with these terms.
*Correspondence: Noora Partamies, bm9vcmEucGFydGFtaWVzQHVuaXMubm8=