- 1National Center for Atmospheric Research, Boulder, CO, United States
- 2Hansen Experimental Physics Laboratory, Stanford University, Stanford, CA, United States
- 3Goddard Planetary Heliophysics Institute, University of Maryland–Baltimore County, Baltimore, MD, United States
- 4NASA Goddard Space Flight Center, Greenbelt, MD, United States
Through meticulous daily observation of the Sun’s large-scale magnetic field the Wilcox Solar Observatory (WSO) has catalogued two magnetic (Hale) cycles of solar activity. Those two (∼22-year long) Hale cycles have yielded four (∼11-year long) sunspot cycles (numbers 21 through 24). Recent research has highlighted the persistence of the “Extended Solar Cycle” (ESC) and its connection to the fundamental Hale Cycle–albeit through a host of proxies resulting from image analysis of the solar photosphere, chromosphere and corona. This short manuscript presents the correspondence of the ESC, the surface toroidal magnetic field evolution, and the evolution of the Hale Cycle. As Sunspot Cycle 25 begins, interest in observationally mapping the Hale and Extended cycles could not be higher given potential predictive capability that synoptic scale observations can provide.
1 Introduction
For over four centuries solar observers have pondered the physical origins of the canonical marker of solar activity–the sunspot. It took more than 200 years after the sketching and cataloging of sunspots commenced before it was discovered that the number of sunspots waxes and wanes over an approximately 11-year period (Schwabe, 1849). A half century later, mapping the latitudinal variation of the spotted Sun yielded the “butterfly diagram,” a pattern progressing from latitudes around 30° (north and south) to the equator over the 11-year period (Maunder, 1904). In the golden age of solar astronomy that followed, it was first suggested (Hale, 1908) and then demonstrated (Hale et al., 1919) that sunspots were sites of intense magnetism protruding through the Sun’s photosphere and that the polarities of the butterfly’s wings alternated in sign with a period of about 22 years (Hale and Nicholson, 1925). This alternating magnetic polarity cycle is synonymously identified with its discoverer, the eponymous (22-year) “Hale Cycle,” or the (22-year) “Hale Magnetic Polarity Cycle.” Understanding how the magnetic spots, their butterfly patterning, and the polarity flipping are tied together to drive solar activity has formed the keystone problem of observational (Babcock, 1961), theoretical (Leighton, 1969) solar- and astro-physics in the intervening century (e.g., Hathaway, 2010).
For over four decades another term describing solar activity has sporadically appeared in the literature–the “Extended Solar Cycle.” The extended solar cycle (e.g., Wilson, 1987) (ESC) was used to describe an spatio-temporal extension of the sunspot butterfly pattern to higher solar latitudes (to around 55°) and further back in time (by almost a decade). A culmination of many years of painstaking observation the ESC is exhibited in prominences and filaments (e.g., Bocchino, 1933; Hansen and Hansen, 1975), ‘ephemeral’ (small-scale transient) active regions (e.g., Harvey and Martin, 1973), global-scale features of the Sun’s corona (e.g., Altrock, 1988) and the zonal flow patterns (e.g., Howard and Labonte, 1980; Snodgrass and Wilson, 1987) of the “torsional oscillation” In effect, this assortment of observational phenomena created a set of spatio-temporally overlapping chevron-like activity patterns.
The concept of the ESC was ‘re-discovered’ by McIntosh et al., 2020 in their study of extreme ultraviolet brightpoints and their associated magnetic scale (McIntosh et al., 2014, hereafter M2014). They identified a pattern of coronal and photospheric features that was greatly extended in time and latitude relative to the sunspot butterfly. They deduced that the activity bands observed were the (toroidal) magnetic bands of the Hale Cycle, but no concurrent photospheric magnetic measurement was available to affirm their deduction. The core inference of their study was that the spatio-temporal overlap and interaction of extended activity bands observed contributed directly to the shape (the butterfly) and modulation (the amplitude) of the sunspot cycle.
Figure 1 shows the evolution of the total sunspot number, the latitudinal distribution of sunspots and the data-inspired construct introduced by M2014 that inferred the magnetic activity band arrangement and progression of the Hale Cycle and how those bands contribute to the modulation of sunspot cycles. This ‘band-o-gram,’ introduced in Section 3 (and Figure 8) of M2014, was intended as a qualitative, and not quantitative, illustration of the position, timing and magnetic field strength of the bands—with the emphasis on their phasing. The activity bands in the band-o-gram start their (assumed) linear progression towards the equator from 55°latitude at each hemispheric maxima, meeting and disappearing at the equator at the terminator. At the terminator the polar reversal process commences at 55°latitude, progressing poleward at their (assumed) linear rate—reaching the pole at the appropriate hemispheric maximum. So, for a list of hemispheric maxima and terminators, a band-o-gram can be constructed. The width of the bands is prescribed by a Gaussian distribution 10° in latitude, commensurate with those observed in the coronal brightpoints originally studied by M2014.
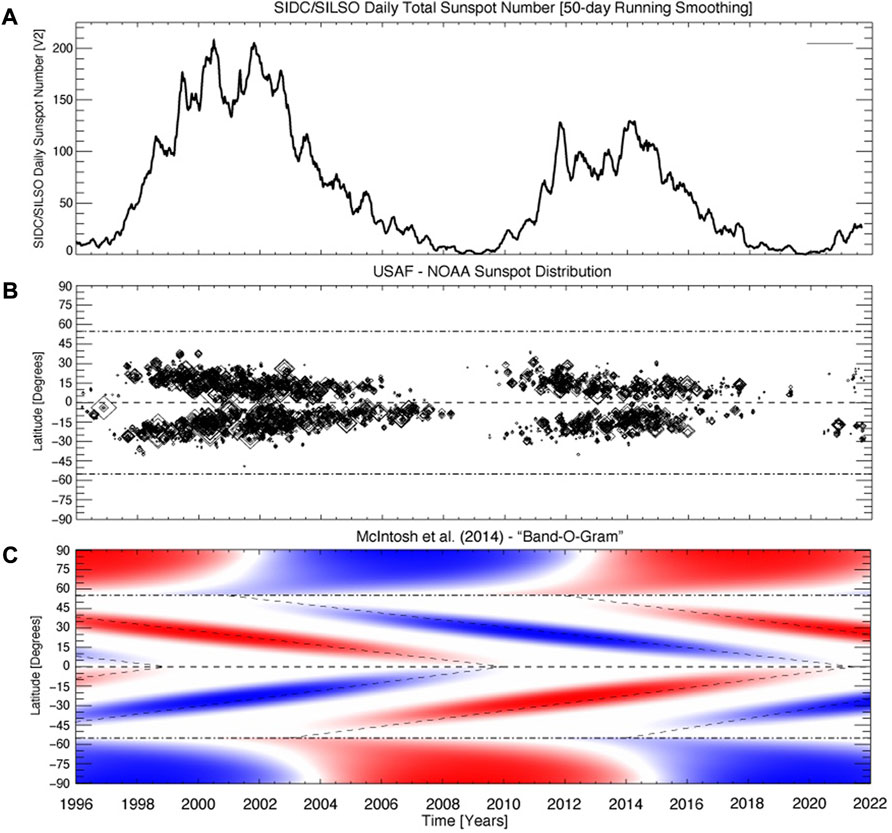
FIGURE 1. Sunspot evolution since 1996. Comparing and contrasting the evolution of the total sunspot number provided [panel (A)], the spatio-temporal distribution of sunspots provided by the US Air Force and NOAA [panel (B)], and a data-driven schematic of the Hale Cycle evolution constructed by M2014, the band-o-gram [panel (C)].
2 Data and method
The Wilcox Solar Observatory (WSO) began collecting daily low spatial resolution observations of the Sun’s global (or mean) magnetic field in May 1975 (Scherrer et al., 1977) and a very well-known data product of WSO is the evolution of the Sun’s polar cap magnetic fields (Svalgaard et al., 1978). These low-resolution synoptic observations are ideal for identifying large-scale, long-lived, patterns - reducing the effects of small-scale, rapidly changing fields of emerging magnetic regions. Following, Duvall et al. (1979) the daily WSO magnetograms are obtained by scanning boustrophedonically along 11 east-west rows (i.e., the observation of alternate rows in opposite directions—if one row is taken from left to right then the next row is from right to left). The 180″ magnetograph aperture moves 90″ between points in the east-west direction and 180″ north or south between rows, taking a 15 s integration of the Fe I 5247Å line at 195 points on the solar disk—resulting in a total of about 2 h per daily map. Because of the large aperture size of the magnetograph the regions from 70° to the poles lie entirely within the last aperture and are not resolved.
Following the method of Howard (1974) and Duvall et al. (1979), the daily WSO magnetographs can be decomposed into the poloidal and toroidal components which, according to dynamo models, are regenerated from one another, alternating and repeating in an approximately 22-year cycle (e.g., Charbonneau, 2010). The method used to perform this decomposition is detailed by (Shrauner and Scherrer, 1994), where the daily WSO magnetographs are first separated into their positive and negative magnetic field polarities which are then tracked as they cross the solar disk. They are then fitted to estimate the average east-west inclination angle of the magnetic field—or the toroidal component of the photospheric magnetic field (see Figure 1 of Lo et al., 2010, for an illustration of the geometry).
In this paper we use the Shrauner and Scherrer (1994) derivative data product of the WSO toroidal magnetic field component in the photosphere and the WSO polar magnetic field estimate using the five central aperture pointings (central meridian ± two) in first and last rows of observations documented by Svalgaard et al. (1978).
3 Results
An initial study of the slowly evolving behavior (Shrauner and Scherrer, 1994) noted the potential relationship with the ESC. Figure 2 contrasts four and a half decades of WSO observations with the evolution of the sunspot number over the same timeframe. Panel B shows the latitude-time variation of the WSO toroidal magnetic field component in addition to the field strength of the northern and southern polar regions.
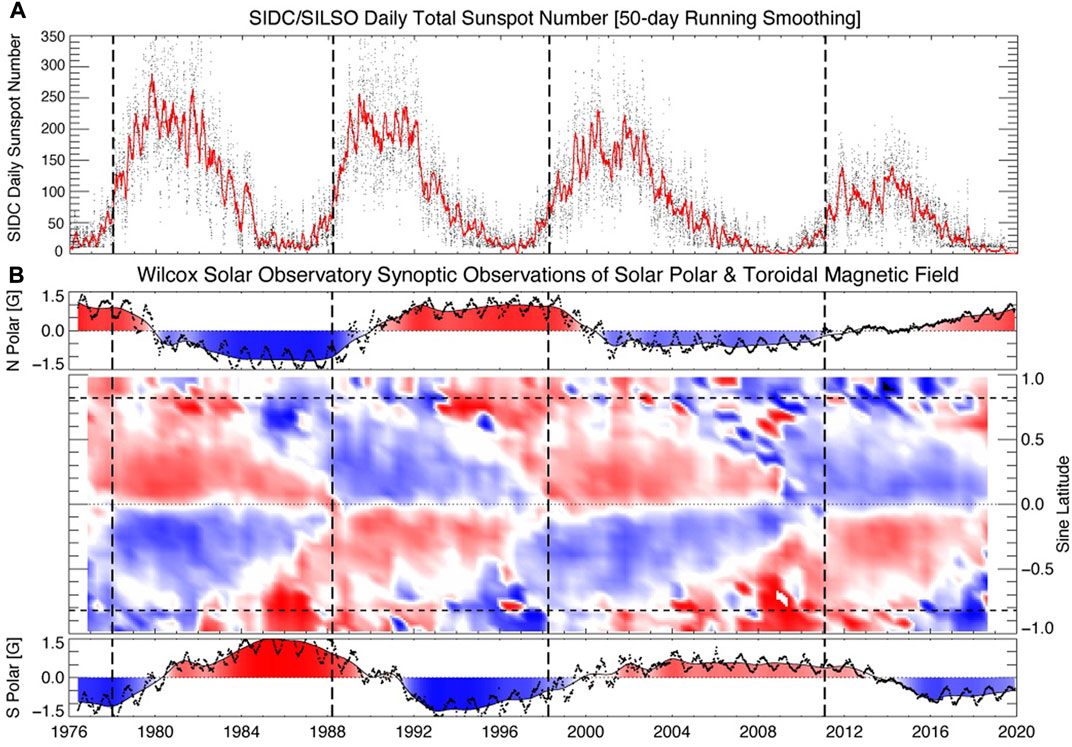
FIGURE 2. WSO Inferred toroidal magnetic field evolution since 1976. Comparing and contrasting the evolution of the total sunspot number [panel (A)], with the spatio-temporal distribution of the derived toroidal magnetic field component (central) and polar magnetic field components (above north and below south) derived from daily WSO observations [panel (B)]. Note that the toroidal field panel is in its native sine latitude format (Lo et al., 2010). The horizontal dashed lines indicate a latitude of 55° while the vertical dashed lines shown in each panel mark the times of the Hale Cycle termination events studied by M2019.
Several features of Figure 2 are immediately visible, but perhaps the most striking are the strong overlap in time of the toroidal magnetic systems, the short transitions from one polarity to the next - evidenced through the narrow white (very near 0G) zones, the lack of field migration across the Sun’s equator, and the close association of these last two features at the Sun’s equator four times in the record (in 1978, 1988, 1998 and 2011). The patterns, including a strong resemblance to the ESC, are described in more detail by Shrauner and Scherrer (1994) and Lo et al. (2010).
The last of these features, synchronized zero-crossing transitions at the lowest latitudes in each hemisphere, are concurrent with events that mark the end of the Hale Cycle progressions, or termination events as they have become known, that were initially described by M2014 and explored again (in more detail) recently (McIntosh et al., 2019, hereafter M2019). The termination events are illustrated with dashed vertical lines in Figure 2. These events signify the final cancellation of the magnetic systems that were responsible for the last sunspot cycle at the equator and, near-simultaneously, a period of very rapid growth of the next sunspot cycle at mid-solar latitudes. Interestingly, M2019 also noted that these termination events at the equator were co-temporal with the start of the polar magnetic field reversal process. This process is perhaps best visualized through the observed progression of the highest latitude filaments (or polar crown filament) to the pole, the so-called “rush to the poles” (e.g., Babcock, 1961; Sheeley et al., 1989). The time at which this poleward march completes corresponds to when the measured polar magnetic field crosses zero.
In order to visually compare the WSO observations (Figure 2B) and the ESC band-o-gram (Figure 1C) (extended to cover the baseline of the WSO observations) we convert the WSO data from sine latitude to latitude and the result can be seen in Figure 3.
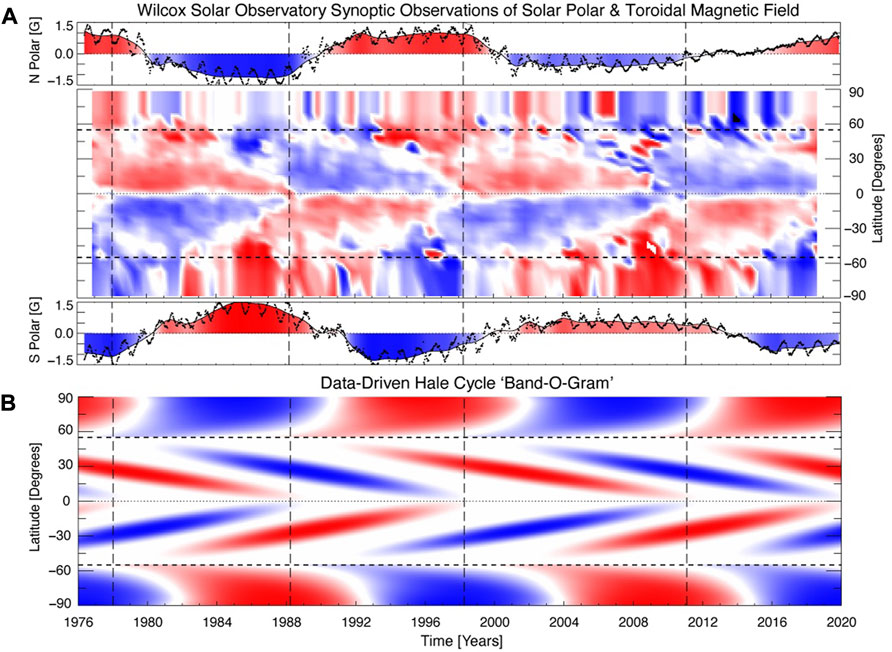
FIGURE 3. Comparing and contrasting the WSO toroidal magnetic field [Panel (A), see Figure 2B and now expressed in latitude] and polar cap measurements with the data-inspired band-o-gram (B) (cf. Figure 1C) now extended to cover the WSO record. The horizontal dashed lines indicate a latitude of 55° while the vertical dashed lines shown in each panel mark the times of the Hale Cycle termination events studied by M2019.
Additionally, Table 1 of Liu and Scherrer (2022) places bounds on the correspondence of the toroidal field zero-crossings (near the solar equator) with the Hale Cycle terminator events determined by other means. With the 5° resolution of the WSO magnetograph scanning rows around the equator the zero-crossing times of the toroidal magnetic field provided correspond well with the Hale Cycle terminator times presented in Table 1 of M2019: 1978.00 [N5:1976.67, S5:1977.17]; 1988.50 [N5:1988.75, S5:1986.83]; 1997.75 [N5:1997.75, S5:1999.17]; 2011.20 [N5:2008.83, S5:2011.50].
3.1 High-res/low-res and the 2021 hale cycle termination
The alternating toroidal field patterns clearly visible in the WSO observations are borne out also with considerably higher spatial resolution observations from space with SOHO/MDI and SDO/HMI shown in Figure 4; Figure 2 of Liu and Scherrer (2022) which, unlike our previous plots, are current to time of publication. In tandem, the three magnetograph observations illustrate the clear pattern of the ESC that is consistent with previous studies. Further, as we have discussed immediately above, we observe that another zero crossing of the toroidal magentic field at the equator, characteristic of a Hale Cycle terminator event, occurred very recently. In a forthcoming publication we will explore this event in detail (McIntosh et al., 2020 - in preparation).
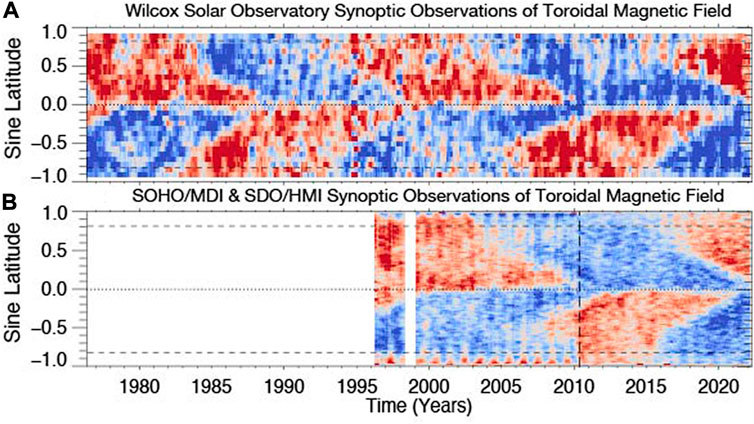
FIGURE 4. Comparing and contrasting the WSO toroidal magnetic field [Panel (A)] and version derived from the higher-resolution full-disk space observations SOHO/MDI and SDO/HMI [Panel (B)] with the latter described by Liu and Scherrer (2022) updated to the present. The vertical dashed line in Panel B indicates the transition from observations from SOHO/MDI (prior to May 2010) and SDO/HMI (following May 2010).
4 Discussion
A general criticism of the M2014 band-o-gram is that it was based on catalogued proxies of the photospheric magnetic field through chromospheric and coronal features. Those tracked features formed by the overlapping activity bands observed were not necessarily representative of the photospheric or interior magnetic field itself. It is clear from the WSO observations that, while comparison of the observed progression with the band-o-gram is still qualitative, that there is an overwhelming correspondence of the features observed in the WSO observations with those of the highly idealized band-o-gram. We note that a similar treatment of higher spatial resolution photospheric observations from the Mt Wilson Solar Observatory over a shorter timeframe yields similar correspondence (Ulrich and Boyden, 2005).
Further, it is known that the heliosphere exhibits a “sector” structure. The sector, or Hale sector, structure reflects the polarity of the heliospheric magnetic field relative to the solar direction in a state of either being “away” from or “towards” the Sun and expresses the largest spatial scales of solar magnetism and connectivity (e.g., Hudson et al., 1980). Since the earliest articles about sector structure (e.g., Rosenberg et al., 1969) the solar cycle has been noted to have a strong annual modulation around solar minimum. At that time the heliospheric current sheet (HCS) is so flat that for 6 months of the year (early December to early June) the Earth is at southern heliographic latitudes and the dominant polarity corresponds to the Sun’s southern hemisphere. For the other 6 months of the year in these epochs the Earth almost exclusively samples the dominant polarity of the north, holding at a level of ∼85% (e.g., Svalgaard and Wilcox, 1975). The top panel of Figure 5 shows the tilt of the HCS as computed by the WSO from 1976 to the present. The slowly evolving solar minimum behavior of the HCS is shown graphically in the lower panel of the figure - an adaptation of Figure 1 of Echer and Svalgaard (2004). The wavelet transform is used to illustrate the prominent periodicities in the sector structure - at approximately one Carrington rotation (CR) timescale, and the other at approximately 1 year. There are two clear results shown in Figure 5: 1) the strongest signal at 1 year indeed corresponds to the times of extreme HCS flatness, but also that the strongest signal reverts to CR timescales at Hale Cycle terminators, when the tilt rises sharply with new and stronger new-cycle active regions emerging at mid latitudes. 2) the onset of the annual periodicity signal is at apprximately 0.4 cycles (first dotted vertical line) for even numbered cycles and at 0.6 cycles (second dotted vertical line) for odd numbered cycles. We reserve discussion of the 22-year difference between odd and even numbered cycles to a manuscript in preparation, that looks at a longer epoch than that covered by the WSO we focus on. Nevertheless, this highly ordered large-scale sector structure is one more piece of evidence consistent with the data-inspired ESC schematic based on the timing of the Hale Cycle terminators.
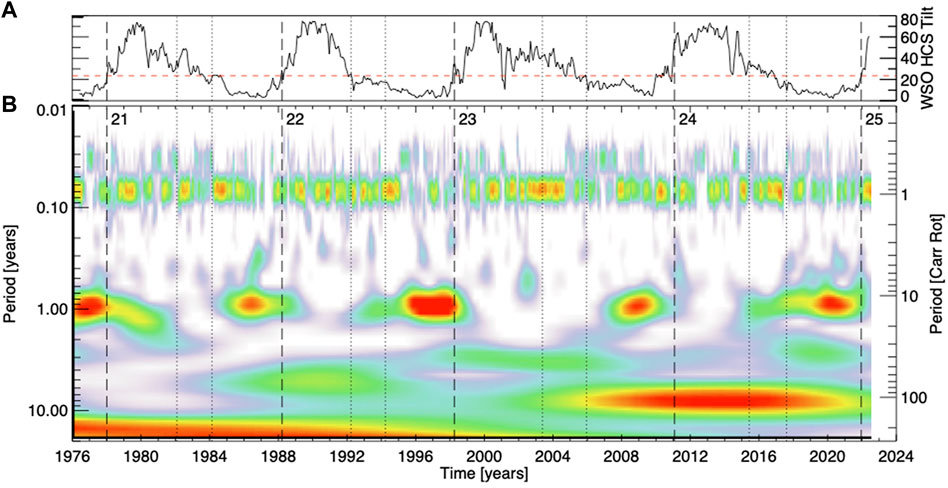
FIGURE 5. (A) The tilt angle of the Heliospheric current sheet as measured by the WSO. (B) Morlet wavelet map of the interplanetary magnetic field polarity 1976–2022 showing periodicities from 4 days to 22 years. As in Figures 2, 3, the vertical dashed lines shown in each panel mark the times of the Hale Cycle termination events studied by M2019; the dotted vertical lines correspond to 0.4 and 0.6 of the cycles’ duration from terminator to terminator (cf. Leamon et al., 1969). The dashed horizontal line in the HCS tilt panel is drawn at 23.4°; exceeding this value is a reasonable scalar proxy for the Hale Cycle terminator.
5 Conclusion
The meticulous daily synoptic scale observations of the WSO have captured two complete 22-year Hale cycles. These observations have permitted a mapping of the Sun’s photospheric toroidal magnetic field component over that timeframe. Key features of the WSO observations compare directly to the data-inspired schematic of the ESC that was conceived to illustrate how the activity bands of the ESC can interact to shape the latitudinal progression of sunspot cycles and their amplitude. The WSO observations should unambiguously unify the Hale magnetic cycle and the ESC as being, physically, one and the same and indistinguishable. These low spatial resolution ground-based observations are corroborated by higher resolution space-based magnetographic observations from SOHO and SDO where all three identify zero-crossing events we associate as Hale Cycle terminators. As Lo et al. (2010) and M2014 inferred, there is predictive capability in these synoptic analyses through the ESC -providing strong indicators of the current progression and potential evolution of upcoming solar activity at the decadal scale, beyond those amenable through the analysis of sunspots. This result demonstrates the intrinsic power of synoptic observations at a time when it is becoming increasingly difficult to sustain such efforts.
Data availability statement
The original contributions presented in the study are included in the article/supplementary material, further inquiries can be directed to the corresponding author.
Author contributions
All authors conceived the experiment, PS, LS, and SM analyzed the results. SM created Figures 1–3; RL created Figure 5. All authors reviewed the manuscript.
Funding
SMC is supported by the National Center for Atmospheric Research, which is a major facility sponsored by the National Science Foundation (NSF) under Cooperative Agreement No. 1852977. RL acknowledges support from NASA's Living With a Star Program. Stanford University operates WSO with funding provided by the NSF through Grant No. 1836370. PHS is supported by NASA contract NAS5-02139 (SDO/HMI). SOHO/MDI data used is provided by the SOHO/MDI consortium. SOHO is a project of international cooperation between ESA and NASA. SMC and RJL acknowledge the grant of Indo-US Virtual Networked Center (IUSSTF-JC-011-2016) to support the joint research on Extended Solar Cycles.
Acknowledgments
We acknowledge his steadfast stewardship of the data and calibration. Sunspot data from the NOAA Space Weather Prediction Center and the World Data Center SILSO, Royal Observatory of Belgium, Brussels.
Conflict of interest
The authors declare that the research was conducted in the absence of any commercial or financial relationships that could be construed as a potential conflict of interest.
Publisher’s note
All claims expressed in this article are solely those of the authors and do not necessarily represent those of their affiliated organizations, or those of the publisher, the editors and the reviewers. Any product that may be evaluated in this article, or claim that may be made by its manufacturer, is not guaranteed or endorsed by the publisher.
References
Altrock, R. C. (1988). “Variation of solar coronal Fe XIV 5303 Å emission during solar Cycle 21,” in Solar and stellar coronal structure and dynamics. Editor R. C. Altrock (Boulder, Colorado: National Solar Observatory), 414–420.
Babcock, H. W. (1961). The topology of the Sun’s magnetic field and the 22-YEAR cycle. Astrophys. J. 133, 572. doi:10.1086/147060
Bocchino, G. (1933). Migrazione delle protuberanze durante il ciclo undecennale dell’attività solare. Oss. Mem. dell’Osservatorio astrofisico Arcetri 51, 5–47.
Charbonneau, P. (2010). Dynamo models of the solar cycle. Living Rev. Sol. Phys. 7, 3. doi:10.12942/lrsp-2010-3
Duvall, J., Scherrer, P. H., Svalgaard, L., and Wilcox, J. M. (1979). Average photospheric poloidal and toroidal magnetic field components near solar minimum. Sol. Phys. 61, 233–245. doi:10.1007/BF00150408
Echer, E., and Svalgaard, L. (2004). Asymmetry in the Rosenberg-Coleman effect around solar minimum revealed by wavelet analysis of the interplanetary magnetic field polarity data (1927–2002). Geophys. Res. Lett. 31, 12808. doi:10.1029/2004GL020228
Hale, G. E., Ellerman, F., Nicholson, S. B., and Joy, A. H. (1919). The magnetic polarity of sun-spots. Astrophys. J. 49, 153. doi:10.1086/142452
Hale, G. E., and Nicholson, S. B. (1925). The law of sun-spot polarity. Astrophys. J. 62, 270. doi:10.1086/142933
Hale, G. E. (1908). On the probable existence of a magnetic field in sun-spots. Astrophys. J. 28, 315. doi:10.1086/141602
Hansen, R., and Hansen, S. (1975). Global distribution of filaments during solar cycle No. 20. Sol. Phys. 44, 225–230. doi:10.1007/BF00156857
Harvey, K. L., and Martin, S. F. (1973). Ephemeral active regions. Sol. Phys. 32, 389–402. doi:10.1007/BF00154951
Howard, R., and Labonte, B. J. (1980). The sun is observed to be a torsional oscillator with a period of 11 years. Astrophys. J. 239, L33–L36. doi:10.1086/183286
Howard, R. (1974). Studies of solar magnetic fields. III: The east-west orientation of field lines. Sol. Phys. 39, 275–287. doi:10.1007/BF00162418
Hudson, H. S., Svalgaard, L., and Hannah, I. G. (1980). Solar sector structure. Space Sci. Rev. 186, 17–34. doi:10.1007/s11214-014-0121-z
Leamon, R. J., McIntosh, S. W., and Title, A. M. (1969). Deciphering solar magnetic activity: The solar cycle clock. Front. Astron. Space Sci. 9, 886670. doi:10.3389/fspas.2022.886670
Leighton, R. B. (1969). A magneto-kinematic model of the solar cycle. Astrophys. J. 156, 1. doi:10.1086/149943
Liu, A. L., and Scherrer, P. H. (2022). Solar toroidal field evolution spanning four sunspot cycles seen by the Wilcox solar observatory, the solar and heliospheric observatory/michelson Doppler imager, and the solar dynamics observatory/helioseismic and magnetic imager. Astrophys. J. Lett. 927, L2. doi:10.3847/2041-8213/ac52ae
Lo, L., Hoeksema, J. T., and Scherrer, P. H. (2010). “Three cycles of the solar toroidal magnetic field and this peculiar minimum,” in SOHO-23: Understanding a peculiar solar minimum. Editors S. R. Cranmer, J. T. Hoeksema, and J. L. Kohl (California, United States: Astronomical Society of the Pacific), 428. Conference Series 109.
Maunder, E. W. (1904). Note on the distribution of sun-spots in heliographic latitude, 1874 to 1902. Mon. Not. R. Astron. Soc. 64, 747–761. doi:10.1093/mnras/64.8.747
McIntosh, S. W., Chapman, S. C., Leamon, R. J., Egeland, R., and Watkins, N. W. (2020). Overlapping magnetic activity cycles and the sunspot number: Forecasting sunspot cycle 25 amplitude. Sol. Phys. 295, 163. doi:10.1007/s11207-020-01723-y
McIntosh, S. W., Leamon, R. J., Egeland, R., Dikpati, M., Fan, Y., and Rempel, M. (2019). What the sudden death of solar cycles can tell us about the nature of the solar interior. Sol. Phys. 294, 88. doi:10.1007/s11207-019-1474-y
McIntosh, S. W., Wang, X., Leamon, R. J., Davey, A. R., Howe, R., Krista, L. D., et al. (2014). Deciphering solar magnetic activity. I. On the relationship between the sunspot cycle and the evolution of small magnetic features. Astrophys. J. 792, 12. doi:10.1088/0004-637X/792/1/12
Rosenberg, R. L., Coleman, J., and Paul, J. (1969). Heliographic latitude dependence of the dominant polarity of the interplanetary magnetic field. J. Geophys. Res. 74, 5611–5622. doi:10.1029/JA074i024p05611
Scherrer, P. H., Wilcox, J. M., Svalgaard, L., Duvall, J., Dittmer, P. H., and Gustafson, E. K. (1977). The mean magnetic field of the sun: Observations at stanford. Sol. Phys. 54, 353–361. doi:10.1007/BF00159925
Schwabe, M. (1849). Sonnen-und Saturn-Beobachtungen im Jahre 1848, von Herrn Hofrath Schwabe in Dessau. Astr. Nachr. ;.28, 301–304. doi:10.1002/asna.18490281904
Sheeley, N. R., Wang, Y.-M., and Harvey, J. W. (1989). The effect of newly erupting flux on the polar coronal holes. Sol. Phys. 119, 323–340. doi:10.1007/BF00146182
Shrauner, J. A., and Scherrer, P. H. (1994). East-west inclination of large-scale photospheric magnetic fields. Sol. Phys. 153, 131–141. doi:10.1007/BF00712496
Snodgrass, H. B., and Wilson, P. R. (1987). Solar torsional oscillations as a signature of giant cells. Nature 328, 696–699. doi:10.1038/328696a0
Svalgaard, L., Duvall, J., and Scherrer, P. H. (1978). The strength of the Sun’s polar fields. Sol. Phys. 58, 225–239. doi:10.1007/BF00157268
Svalgaard, L., and Wilcox, J. M. (1975). Long term evolution of solar sector structure. Sol. Phys. 41, 461–475. doi:10.1007/BF00154083
Ulrich, R. K., and Boyden, J. E. (2005). The solar surface toroidal magnetic field. Astrophys. J. 620, L123–L127. doi:10.1086/428724
Keywords: Sun, solar cycle, solar magnetic cycle, dynamo, sunspots
Citation: McIntosh SW, Scherrer PH, Svalgaard L and Leamon RJ (2022) Uniting the Sun’s Hale magnetic cycle and “extended solar cycle” paradigms. Front. Astron. Space Sci. 9:923049. doi: 10.3389/fspas.2022.923049
Received: 18 April 2022; Accepted: 28 September 2022;
Published: 24 October 2022.
Edited by:
Luis Eduardo Antunes Vieira, National Institute of Space Research (INPE), BrazilReviewed by:
Kalevi Mursula, University of Oulu, FinlandLaura Balmaceda, George Mason University, United States
Paul Charbonneau, Université de Montréal, Canada
Copyright © 2022 McIntosh, Scherrer, Svalgaard and Leamon. This is an open-access article distributed under the terms of the Creative Commons Attribution License (CC BY). The use, distribution or reproduction in other forums is permitted, provided the original author(s) and the copyright owner(s) are credited and that the original publication in this journal is cited, in accordance with accepted academic practice. No use, distribution or reproduction is permitted which does not comply with these terms.
*Correspondence: Scott W. McIntosh, bXNjb3R0QHVjYXIuZWR1
 Scott W. McIntosh
 Philip H. Scherrer
 Leif Svalgaard2
 Robert J. Leamon