 Joachim Birn
 Michael Hesse3
 Andrei Runov
95% of researchers rate our articles as excellent or good
Learn more about the work of our research integrity team to safeguard the quality of each article we publish.
Find out more
ORIGINAL RESEARCH article
Front. Astron. Space Sci. , 23 June 2022
Sec. Space Physics
Volume 9 - 2022 | https://doi.org/10.3389/fspas.2022.908730
This article is part of the Research Topic Plasma Waves in Space Physics: Carrying On the Research Legacies of Peter Gary and Richard Thorne View all 15 articles
Anisotropic electron distributions can be a major source of free energy for the generation of microinstabilities and waves. Here we investigate specifically anisotropies of the suprathermal electrons associated with dipolarization events in the geomagnetic tail. The investigation is based on an MHD simulation of magnetotail reconnection, flow bursts and dipolarization. This simulation is used to trace test particles in the electromagnetic fields of the MHD simulation and investigate their acceleration and contributions to flux increases. The simulated velocity distributions yield anisotropies which can be dominantly parallel (“cigar”-shaped), perpendicular (“pancake”-shaped) to the magnetic field, or a combination thereof (e.g., “rolling-pin”-shaped), depending on location, relative timing, and energy.
Charged particle flux increases at suprathermal energies of tens to hundreds of keV are a typical signature of dipolarization events in the near magnetotail, associated with substorms and other activity (e.g., Lezniak et al., 1968; Parks and Winckler, 1968; Arnoldy and Chan, 1969; Baker et al., 1978; Belian et al., 1981; Nakamura et al., 2002; Runov et al., 2009; Sergeev et al., 2009; Deng et al., 2010; Fu et al., 2020). In the tail region beyond about 10 RE distance, these events are commonly associated with earthward flow bursts, which are most likely caused by reconnection events farther tailward. They are characterized by a rapid increase of the normal magnetic field Bz (dipolarization front, “DF”), indicating a transient or permanent change from a stretched, tail-like, to a more dipolar magnetic field configuration. The region of enhanced Bz immediately after the DF has been named “dipolarizing flux bundle” (DFB) (Liu et al., 2013) or “flux pileup region” (FPR) (e.g., Khotyaintsev et al., 2011). A plausible interpretation identifies DFBs with entropy-depleted magnetic flux tubes (Sergeev et al., 1996; Wolf et al., 2009), originally proposed by Pontius and Wolf (1990) and also called “bubbles.” They are likely caused by the severance, via reconnection, of parts of closed field lines, which are ejected tailward as “plasmoids” (e.g., Hones, 1979). The likely mechanism of the energetic particle flux increases is the acceleration of charged particles by the localized cross-tail electric field associated with a flow burst and dipolarization. This conclusion is supported particularly by particle tracing in analytic or numerically simulated electric field pulses associated with localized flow bursts (Zelenyi et al., 1990; Birn et al., 1997, 1998, 2004; Li et al., 1998; Zaharia et al., 2000; Ashour-Abdalla et al., 2011; Gabrielse et al., 2012; Pan et al., 2014; Artemyev et al., 2015; Gabrielse et al., 2016).
The major acceleration mechanisms affecting electrons are direct acceleration by the electric field in regions of low magnetic field strength, as well as betatron and Fermi acceleration, which affect electrons more adiabatically. In the reconnection/dipolarization scenario, the direct acceleration is likely confined to the vicinity of the reconnection site, such that betatron and Fermi acceleration in the collapsing DFB are the most likely candidates (e.g., Fu et al., 2020, and references therein). Each mechanism may dominate at different times or in different regions, causing anisotropies of the distribution functions, which could provide free energy for microscopic waves and instabilities. The observed velocity distributions exhibit anisotropies that can be dominantly parallel (“cigar”-shaped), perpendicular (“pancake”-shaped) to the magnetic field, or a combination thereof (e.g., “rolling-pin”-shaped) (e.g., Liu et al., 2017, 2020).
Fu et al. (2011), using Cluster data in the region ∼15 RE downtail, found an association between pancake shaped distributions with “growing” FPRs, defined by increasing earthward flow velocity at the front and cigar-shaped distributions with “decaying” FPRs, defined by a peak of velocity coincident with the DF. On the basis of “Time History of Events and Macroscale Interactions during Substorms” (THEMIS) observations at distances of 11–14 RE, Runov et al. (2013) found that suprathermal (
Such anisotropies may be the source of free energy driving microinstabilities and waves (Gary, 1993; Gary et al., 2014; Gary, 2015). Such waves, on one hand, would tend to reduce or limit the anisotropies (Khotyaintsev et al., 2011; Zhang et al., 2018) but, on the other, can also be a source of energy transport in the form of Poynting flux away from a DFB/FPR (Le Contel et al., 2009). Specifically, perpendicular electron anisotropies in the DFB region behind the front may be the source of whistler waves (Le Contel et al., 2009; Deng et al., 2010; Khotyaintsev et al., 2011; Viberg et al., 2014; Li et al., 2015; Breuillard et al., 2016; Le Contel et al., 2017) or electron-cyclotron waves (Zhou et al., 2009).
Using the three-dimensional time-dependent electric and magnetic field from MHD simulations of near-tail reconnection and flow bursts as basis for test particle studies, we have previously investigated electron acceleration associated with dipolarizations, identified acceleration mechanisms and source regions, and provided insights into spatial and temporal variations of electron and ion fluxes (Birn et al., 1997, 2004, 2013). These simulations also indicated energetic electron anisotropies with a dominance of perpendicular fluxes farther down the tail and closer to the equatorial plane, but an increasing importance of parallel anisotropy closer to Earth and at higher latitudes. In addition, a triple peak structure of flux increases near 0°, 90°, and 180° was found, which has been denoted a “rolling pin” distribution (Liu et al., 2017).
In the present paper we further investigate electron acceleration and flux properties, extending the results of Birn et al. (2013), and Birn et al. (2014) on the basis of the same MHD simulation (Birn et al., 2011). In Section 2 we summarize major features of the MHD simulation and the test particle simulation approach. We focus on features in three different regions, the plasma sheet boundary layer, the inner flux pileup region earthward of an approaching and stopping bubble, and the stopping region of a DFB farther tailward that is reached by reconnected fields. Section 3 demonstrates pitch angle variations and Section 4 characteristic velocity distributions obtained from the test particle approach. Section 5 then illustrates typical orbits and acceleration mechanisms affecting the distributions with a summary and discussion givrn in Section 6.
Our approach is based on a combination of a three-dimensional MHD simulation of near-tail reconnection and field collapse (Birn et al., 2011) with particle tracing in the fields of this simulation. Dimensionless units were used throughout. As in earlier papers, a realistic conversion to dimensional units may be based on a magnetic field unit (lobe field at the location of x-line formation) Bn = 12.6 nT, velocity (Alfvén speed) vn = 1,000 km/s, and length unit of Ln = 1.5RE, leading to a time unit (“Alfvén time”) tn = Ln/vn ≈ 10 s, and electric field En = vnBn = 12.6 mV/m and an energy unit
The dynamic evolution was preceded by a period of external driving, which lasted until t = 61, leading to the formation of a thin embedded sheet of intensified current density in the near tail peaked around x = −10. In the following we will refer to the configuration at t = 61 as the “initial state.” At this time a finite resistivity was imposed, localized in the region of enhanced current density, which was kept constant in time. (Birn et al., 2011). Figure 1A shows magnetic flux contours in the x, z plane at this time together with the initial pressure, which is used to categorize characteristic source regions, as indicated in Figure 1B: the inner central plasma sheet (CPS, red color), the outer CPS (orange), the plasma sheet boundary layers; ayer (PSBL, green) and the lobes (light blue). The dynamic evolution after t = 61 led to the formation of a neutral line (Bz = 0 line) at t ≈ 90 and the initiation of slow reconnection. Faster reconnection and the generation of fast flows started at t ≈ 125, when reconnection proceeded to the lobes, presumably due to a combination of reconnection with ballooning/interchange type modes, which were enabled by the reduced entropy of reconnected lobe magnetic flux tubes, which were shortened from plasmoid ejection (Birn et al., 2011, 2015).
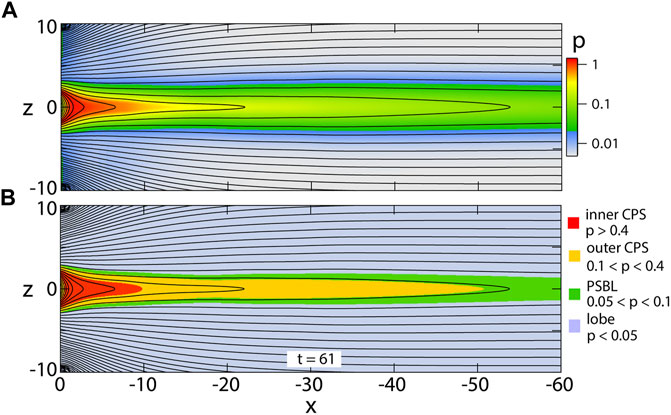
FIGURE 1. Initial state after completion of the driving period, (A) magnetic flux contours and pressure (color) in the x, z plane at t = 61; (B) characteristic source regions defined by the initial pressure as indicated in the right margin: inner central plasma sheet (CPS), outer central plasma sheet, plasma sheet boundary layer (PSBL), and lobe.
Figure 2 illustrates the fast evolution, showing the propagation of a DFB. The color in the left column shows the magnetic field component Bz in the x, z plane together with magnetic flux contours (black lines). The heavy blue contours indicate the enhanced cross-tail electric field, and the plus signs indicate locations where energetic electron fluxes are evaluated. The color in the right column shows the electric field component Ey in the x, y plane together with contours of constant Bz; the contour near x = −9 is the Bz = 0 line, referred to as x-line. The DFB is indicated by the yellow and red color in Figures 2A–C and by a propagating contour in Figures 2D–F. It is limited in x and y to a few RE, consistent with observations (e.g., Nakamura et al., 2004). It comes to rest and actually bounces back after about t = 132, also consistent with observations (Panov et al., 2010a; Panov et al., 2010b; Nakamura et al., 2012; Panov et al., 2013). It is characterized by a cross-tail electric field that far exceeds the reconnection electric field, which is of the order of 0.1, consistent with “fast reconnection” (e.g., Birn et al., 2001). (Our normalization is based on units near the location of the x-line.) The locations indicated by plus signs become enveloped by the DFB after t ≈ 132. They are chosen to represent three characteristic regions: the location (−1,0,1.9) represents a PSBL location; the others correspond to central plasma sheet locations close to the stopping region, (−1.5,0) is just inward of the region reached by reconnected field lines, while (−2,0,0) and (−2,0,1) are reached even by reconnected lobe field lines, as concluded from the MHD simulation. The latter two locations are right at the equatorial plane and somewhat off the equator.
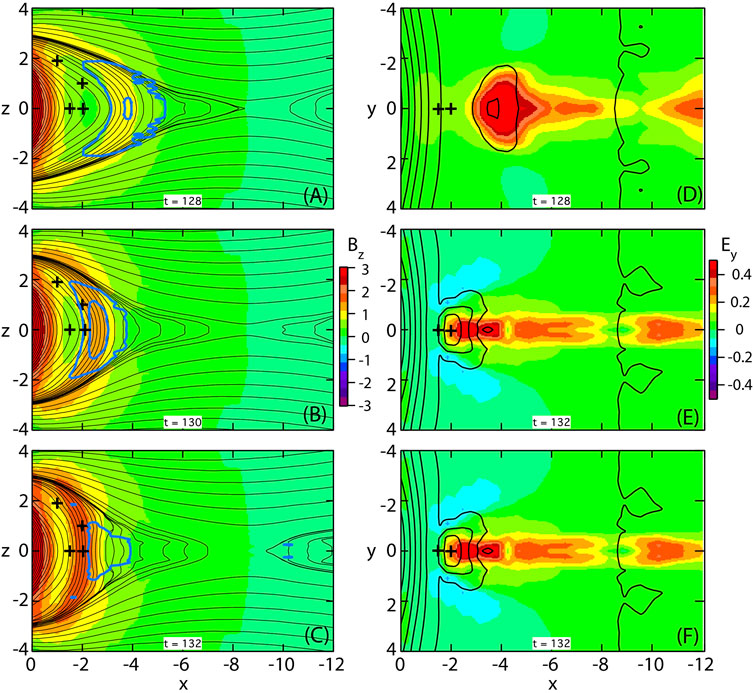
FIGURE 2. Propagation of a DFB obtained form the MHD simulation. The left column (A–C) shows in color the magnetic field component Bz in the x, z plane together with magnetic flux contours (black lines). The heavy blue contours show the enhanced cross-tail electric field at intervals of 0.4 and the plus signs indicate locations where energetic electron fluxes are evaluated. The right column (D–F) shows in color the electric field component Ey in the x, y plane together with contours of Bz at intervals of 0.5.
The orbit integration procedure was discussed in detail by Birn et al. (2004) and Birn et al. (2014). Here we repeat some major facts. The MHD results were saved at intervals of 1 Alfvén time (800 time steps, corresponding to
A backward tracing technique (Curran and Goertz, 1989) was used to integrate orbits from selected “final” times and locations backward in time until they reached the initial state (t = 61) or a boundary of the simulation box, using mirroring at the inner boundary x = 0. We then applied Liouville’s theorem of the conservation of phase space density F along a phase space trajectory to calculate F values and differential energy fluxes at the final destination from the initial and boundary values at the “source” locations. A full distribution function at the chosen final location and time can then be obtained by varying the final energy and pitch angle. Time profiles of fluxes at selected locations, energies and pitch angles are obtained by varying the times from which particles are launched backwards.
The Validity of the backward tracing is based on the absence of collisions and becomes questionable when collisional regions are encountered. In our case one might consider the regions of low magnetic field, where orbits can undergo pitch angle scattering and our integrations change between drift orbits and full orbits as such regions. We found out, however, that this was not significant. Whereas pitch angles were conserved at these transitions, by accident we had initially set new phase angles to zero for continuing full orbits. Replacing that with random phase angles as intended did change some individual orbits significantly, but did not alter the characteristic pattern of the distributions.
Since the MHD simulation does not provide electron information (other than density, which should equal ion density), particular choices must be made in defining the initial and boundary electron distributions at the source locations. For the results reported here, we again imposed isotropic kappa-distributions (Vasyliunas, 1968; Christon et al., 1988; Christon et al., 1989)
with a κ value of 4.5 and chose a fixed initial and boundary temperature kTe = 0.5 keV. Liouville’s theorem of the conservation of F along a phase space trajectory implies that the final distribution is related to the source by
where ΔW is the energy gain (or loss) along the trajectory. Flux enhancements therefore are directly related to the energy gain and the density n0 of the source plasma.
We note that the electron velocities were normalized by
where mp and me denote proton and electron mass, respectively. The (normalized) kinetic energy of an electron is then given, in the relativistic approach, by
where
and u is the normalized electron velocity, given by
where μ is the normalized relativistic magnetic moment (Birn et al., 2004).
Our orbit integration includes several modifications from the approach described in Birn et al. (2004) and Birn et al. (2014):
1) The particle reflection at the inner boundary of the simulation box now takes into account a finite time of travel to the actual mirror point outside the box closer to Earth. This delay time was estimated by using a Tsyganenko model (Tsyganenko, 1987) to calculate this travel time based on the velocity and pitch angle at the inner boundary. This affected primarily particles at low pitch angles. As a consequence, they exhibit fewer bounces than if they are immediately reflected back into the box, reducing the number of neutral sheet crossing, which are the dominant source of Fermi acceleration type B (Northrop, 1963).
2) The linear interpolation of the electromagnetic fields between the finite grid points could lead to spurious parallel electric fields. This effect was eliminated by separating the electric field into a field-aligned and a perpendicular component, and interpolating the two individually. We found, however, that this affected only very few orbits and did not alter the distributions in a noticeable way.
3) We discovered that the fluxes and phase space densities shown in Birn et al. (2014) were inadvertently evaluated with κ = 2.5 rather than κ = 4.5 as stated in the paper. This has no effect on the particle orbits, however, nor on the qualitative features shown. The only effect is to raise the numerical values at high energies.
The variations of electron fluxes at the four selected locations (indicated on top of the panels) are shown in Figure 3 as functions of time and pitch angle for several energies, together with the variations of Bz (top, red curves) and plasma density (bottom) obtained from the MHD simulation. The energies are labeled based on our normalization factor Wn = 5.22 keV. (A different choice of vn could reduce those energies, for instance vn = 500 km/s, Wn = 1.30 keV, would reduce the energies by a factor 1/4.)
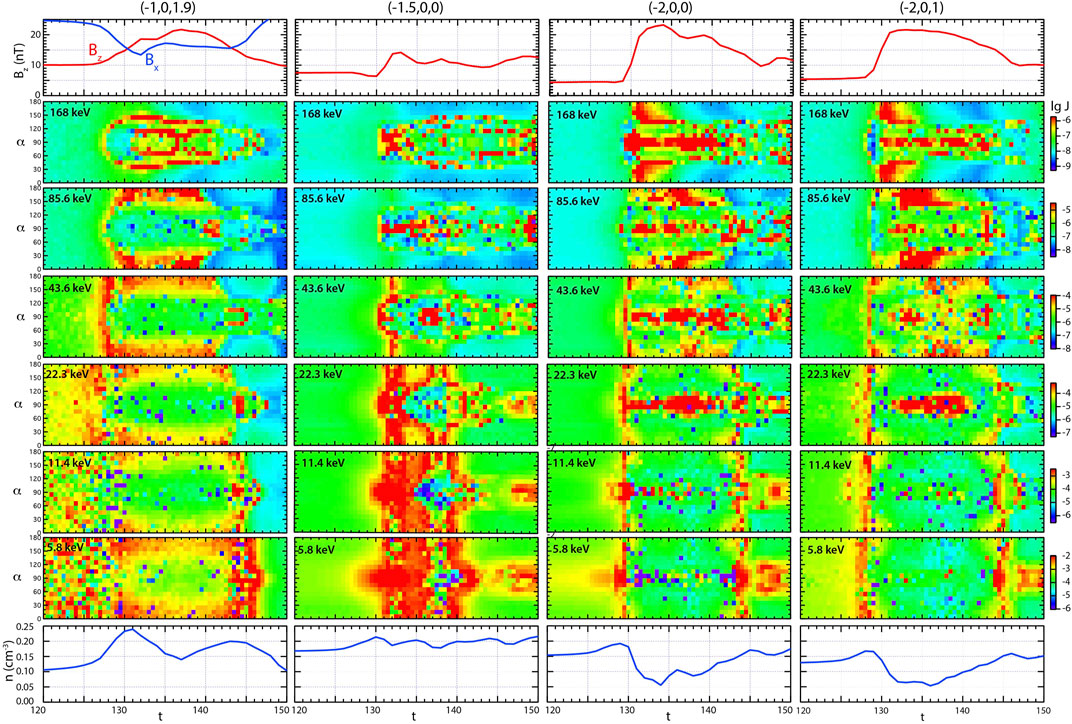
FIGURE 3. Simulated electron fluxes as functions of time and pitch angle at four selected locations indicated on top. Different energies are indicated in the colored panels. The top and bottom panels show the magnetic field Bz (in red) and the plasma density n, respectively, at the three locations. For the PSBL location, (-1, 0, 1.9), the magnetic field component Bx is also added (blue curve, top left panel).
The MHD results (top and bottom) in Figure 3 show characteristically different signatures at the selected locations. The Bz increase at the PSBL location (red curve, top left panel) is more gradual than at the equator; it goes together with an entry deeper into the plasma sheet, as shown by the decrease of Bx (blue curve in the top left panel) and the density increase (bottom left panel). These features have been reported earlier in the context of energetic ion fluxes (Birn et al., 2017).
The inner CPS location (second column), which is not reached by reconnected, depleted flux tubes at the time of dipolarization, shows a more modest increase of Bz than the two locations farther tailward (third and fourth column). It also shows a slight increase in density (bottom panel), resulting from a compression of preexisting plasma sheet plasma, whereas the two locations farther out show a decrease, which is more typical (Runov et al., 2011) and consistent with the arrival of depleted reconnected PSBL and lobe flux tubes.
At low energies of a few keV the energetic electron fluxes reflect the behavior of the MHD plasma density at all locations, showing a drop when the plasma density is reduced and an increase at the innermost CPS location. At higher energies, the results are different. The PSBL location (left column) is characterized by a very brief increase, which tends to start near 90° but then rapidly spreads to all pitch angles. This is followed by a persistent increase around 0 and 180° at most energies. Only at the highest one of 168 keV the distribution becomes more complicated, with double peaks around 45 and 135°.
The inner CPS location (second column) up to ∼23 keV is characterized by an enhancement of fluxes, which also starts around 90°. It is interrupted by a brief decrease around t = 137. A closer inspection (not shown here) indicates that this is due to the arrival of reconnected field lines, which carry plasma from the more distant tail and, at higher energies, PSBL and lobes. The highest energies show a more persistent enhancement around 90°.
The outer two CPS locations (third and fourth column) show very similar features. The third column corresponds to the results shown in the left column of Figure 4 in Birn et al. (2014) with the modifications discussed in Section 2. The qualitative features are not changed by those modifications. The major difference is a change of scales, which results from the steeper slope of the source energy distribution associated with the larger kappa value. Fluxes at 22.3 keV show a persistent perpendicular anisotropy (peak near 90°), after a very brief nearly isotropic enhancement. In contrast the higher energies show the triple peak (rolling pin) structure at 0, 90, and 180°, discussed already by Birn et al. (2014). Interestingly, at the highest energy, the peaks at 0 and 180° tend to move away from the field-aligned direction toward 45 and 135° after the dipolarization.
Figure 4 shows velocity distributions at the chosen locations for t = 132, right after the dipolarization, which is the period most commonly investigated in observations. We note that each pixel again corresponds to a single trajectory mapping the source phase space density to the final location. This allows us to identify the relative energy gain ΔW/W0 (second row) as the main contribution to flux enhancements, where W0 is the energy at the initial location, and the particle origins (bottom row), as defined in Figure 1. We note that both of these quantities do not depend on the assumed source distributions; they are simply a consequence of the orbits governed by the MHD electric and magnetic fields.
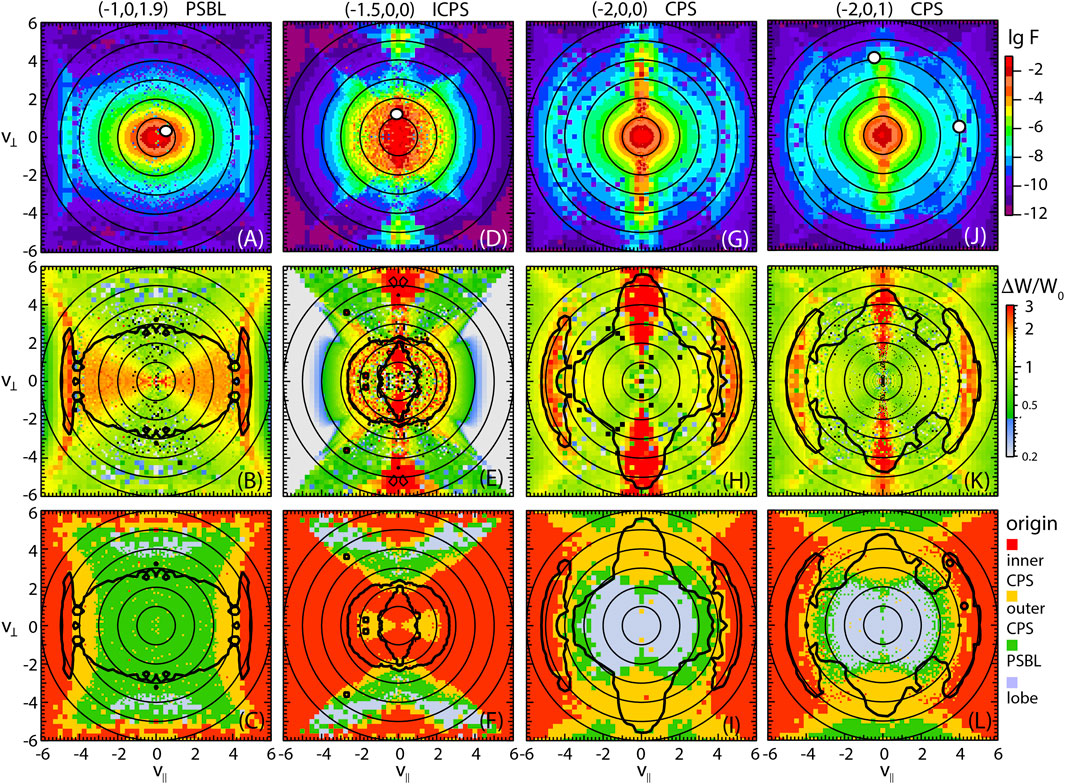
FIGURE 4. Electron velocity distributions at chosen location for t = 132: (top row, a, d, g, j) phase space density, (second row, b, e, h, k) relative energy gain, and (third row, c, f, i, l) origin of particles contributing to the phase space density. For the chosen normalization, the velocity unit is given by (3) as 42,850 km/s. The heavy black contours indicate the regions of enhanced F (top row) and the white dots in the top panels show final velocities used to illustrate characteristic orbits in Section 5.
The distributions in Figure 4 show characteristic differences, as well as some commonalities. The PSBL distribution (Figure 4A) shows the field-aligned anisotropy already demonstrated by Figure 3 (left column). This extends also to two counter streaming beams, which, however, may not be distinct in observed distributions. They are slightly more enhanced relative to the lower energies because of their origin in the inner CPS, where the densities are higher (Figure 4C). Such beams are also present in the CPS distributions at x = −2 (Figures 4G,J) with similar origin in the inner CPS (Figures 4I,L). The distribution just earthward of the stopping (Figure 4D) does not show such beams. However, all CPS distributions show strong ring-like perpendicular anisotropies. For the outer locations, x = −2, the particles originate primarily from the outer CPS (orange color in Figures 4I,L, while hte contributions at the inner location x = −1.5 come predominantly from the inner CPS (red color in Figure 4F).
Overall, the contributions to the distribution at the inner location x = −1.5 come from the inner CPS, consistent with the conclusion from the MHD simulation that reconnected field lines do not reach this location. There is an inner region of the distribution just inside the almost circular contour in Figure 4E at v ≈ 2 (corresponding to about 20 keV) that appears almost uniformly energized by factors ΔW/W0 ≈ 2 enclosing the strongly anisotropic disk at lower energy. This appears to be region that is adiabatically compressed earthward of the DFB itself and roughly isotropically heated.
In the CPS distributions farther out there are similar regions of lobe origin (light blue color in (Figures 4I,L) that are also energized, but by smaller gains (ΔW/W0 ≈ 1 corresponding to doubling the energy), representing the nearly isotropic cores of the distributions. Their origin is again consistent with a result from lobe field reconnection, inferred from the MHD simulation.
Figure 4 already provided some basic facts about the history and origin of the accelerated particles contributing to the enhanced energetic electron fluxes. However, it is instructive to illustrate these with specific orbits.
Details of the acceleration mechanism have been discussed previously by Birn et al. (2004, 2012). It is essentially the same at all energies. We therefore illustrate it in Figure 5 for a particle at relatively low energy, close to the initial thermal energy of 0.1 (corresponding to ∼0.52 keV for our chosen units). The particle originates from a closed field line extending into the more distant tail. It becomes trapped in the inner tail when the field line becomes reconnected and bounces several times while participating in the field collapse. Figure 5B demonstrates that the acceleration takes place at neutral sheet crossings, to be interpreted as first-order Fermi acceleration of type B (Northrop, 1963), akin to a slingshot effect in the curved earthward moving magnetic field. The parallel acceleration can equally well be interpreted as E×B drift in the direction of the magnetic field curvature vector or as curvature drift in the direction opposite to the cross-tail electric field Ey (Birn et al., 2013).
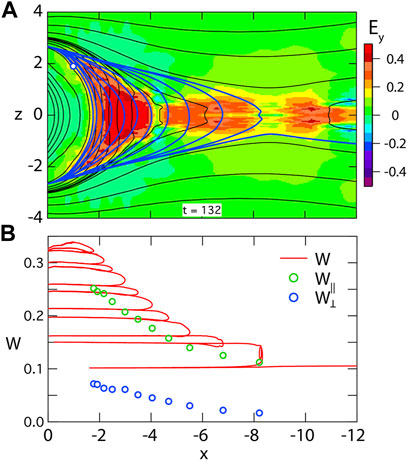
FIGURE 5. Electron orbit contributing to the enhanced field-aligned fluxes at the PSBL location (−1, 0, 1.9), (A) projection of the orbit into the x, z plane superposed on the color-coded electric field at t = 132, (B) particle energy as function of x (red curve) together with the parallel (green circles) and perpendicular (blue circles) components at the equatorial crossings.
The particle illustrated in Figure 5 also has a small perpendicular drift velocity component, which becomes enhanced at each neutral sheet crossing as well (Blue circles). This acceleration can be attributed to the betatron effect, which can also be interpreted in two ways (Birn et al., 2013): as E ×B drift in the direction of increasing magnetic field strength or as gradient B drift in the direction opposite to the cross-tail electric field.
Figure 6 illustrates the history of a particle contributing to the perpendicular anisotropy in the inner pileup region. This is a particle of initially thermal energy, less than 0.1, being almost at rest in the inner tail. It gets “scooped up” in front of the approaching DFB (Figures 6B–D) and experiences betatron acceleration from the magnetic field increase that also affects the field in front of the DFB flow bursts. As illustrated by Figure 6A, the particle initially exhibits a wider bounce near x = −6, before it its pitch angle gets scattered and it continues on a narrow bounce around z = 0 toward its final location at x = −1.5. For a brief period, near x = −2.5, it stays below the equatorial plane z = 0. This is due to the fact that the magnetic field at this time and location becomes indented (Figure 2C) such that the particle becomes trapped in a field minimum below z = 0.
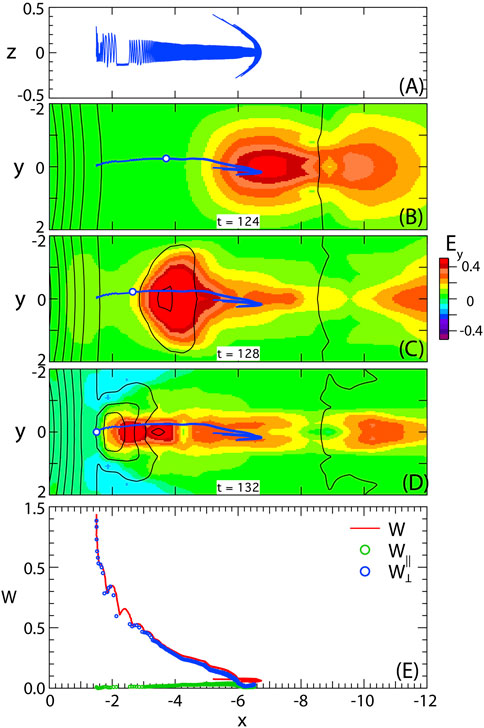
FIGURE 6. Electron drift orbit contributing to the enhanced perpendicular fluxes at the inner location (−1.5, 0, 0), (A) projection of the orbit into the x, z plane, (B–D) orbit in the x, y plane, superposed on snapshots of the color-coded electric field and particle location (white dot) at t = 124, 128, 132, (E) particle energy as function of x (red curve) together with the parallel (green circles) and perpendicular (blue circles) components.
Figure 7 contrasts the history of particles contributing to the high-energy field-aligned beams and the perpendicular fluxes in the CPS region of the DFB. These particles contribute to the peaks of the fluxes at 0, 90, and 180° described as rolling pin distributions (Liu et al., 2017). It is instructive to follow the two orbits backward in time from their final location at t = 132, focusing on the drift in the equatorial plane (Figures 7B–D). Note that the red/pink curves are close to the actual equatorial drift of the
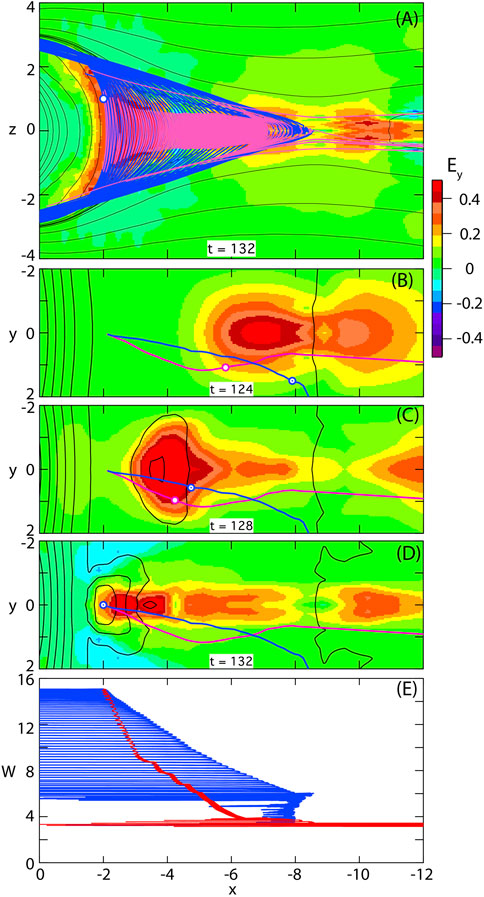
FIGURE 7. Electron orbits contributing to the enhanced CPS fluxes at (−2, 0, 1). Blue curves represent an electron contributing to the field-aligned beam, red/pink curves correspond to a
The magnetic field gradient near the final, more dipolar, location is steep, while the curvature is weak. Therefore the gradient drift is stronger than the curvature drift and
During the main acceleration, both particles satisfy the adiabaticity criterion. This breaks down in the low-field region in the vicinity of the x-line, such that both particles have undergone a number of pitch angle scatterings prior to the acceleration. Hence there is no correlation between the final pitch angle and the one in the source region. Figure 7E indicates that the particle with
Using a combined MHD/test particle approach, we have further investigated electron acceleration and energetic electron flux increases associated with dipolarization events in the region earthward of a near-tail reconnection site. In modification of earlier approaches we included a delay time from particle mirroring closer to Earth (outside the simulation box) and eliminated potential spurious parallel electric fields from an interpolation procedure. The latter, however, was found insignificant.
Our investigation focused on electron anisotropies, which can be the source of free energy driving microscopic waves and instabilities (e.g., Gary, 1993, 2015; Khotyaintsev et al., 2011), extending earlier results (Birn et al., 2014) particularly by deriving phase space distributions (PSDs) for the time right after dipolarization (that is, the increase of Bz) in three different regions, the plasma sheet boundary layer (PSBL), the inner flux pileup region (inner FPR) in the central plasma sheet (CPS), which is not reached (yet) by reconnected PSBL or lobe field lines, and the outer FPR, which is reached by such field lines. Selected orbits were shown to illustrate the findings in the velocity distributions.
We confirmed that betatron and first-order Fermi acceleration are the dominant acceleration mechanisms, operating in the regime of field collapse, consistent with earlier conclusions (e.g. Smets et al., 1999; Birn et al., 2004; Wu et al., 2006; Fu et al., 2011, 2020). This happened in the inner region where a drift orbit approximation was found to be valid, based on the conservation of the (relativistic) magnetic moment μ.
The Fermi acceleration, which dominates for small pitch angles, was found to happen at multiple neutral sheet crossings in the curved magnetic field of earthward moving field lines. This has been described as “type B” (Northrop, 1963) akin to a slingshot effect, associated with E×B drift in the direction of the field curvature vector. This, however, can equally well be described as curvature drift in the direction opposite to the cross-tail electric field (e.g., Birn et al., 2013). As the particle bounces happen on closed magnetic field lines that become shorter as the fields collapse toward Earth, this mechanism is also often described as Fermi acceleration of type A (Northrop, 1963), that is, multiple bounces between approaching mirrors. In that case the acceleration is commonly inferred from the conservation of the second adiabatic invariant. Here, we did not impose (or investigate) this conservation law, and it is an open question to what extent the two interpretations are equivalent quantitatively. The development of field-aligned anisotropy extends not only to high suprathermal energies but also to low sub-keV energies. This fact and the inferred acceleration in the collapsing field are consistent with observations at geosynchronous orbit (e.g., Moore and Arnoldy, 1982), providing a direct source of precipitating auroral electrons.
In addition, betatron acceleration was demonstrated, associated with the E×B drift in the direction of increasing magnetic field strength. This can also be described by (gradient) drift in the direction opposite to the (main) cross-tail electric field.
Our simulations yielded characteristic differences between the locations. The PSBL location was characterized by strong field-aligned anisotropy extending to high-energy beams. In contrast to the main population, these beams originated from the inner central plasma sheet, entering the acceleration by cross-tail drift, Their pitch angle was typically scattered several times during neutral sheet crossings prior to this entry. Similar beams with the same history were also found at the outer FPR locations in the CPS, however, together with strong enhancements around 90° pitch angles, causing net perpendicular anisotropies, consistent with observations by Runov et al. (2012).
At energies of a few tens of keV, the combination of the field-aligned beams with the perpendicular enhanced fluxes in the CPS resulted in the multi peak structure described as rolling pin distributions (Liu et al., 2017) and found earlier in observations (Runov et al., 2012; Wu et al., 2013) and simulations (Birn et al., 2014). Our results are consistent with conclusions by Liu et al. (2017) that these structures were restricted to energies just above 26 keV. However, Zhao et al. (2019) also observed such distributions at energies above 1.7 keV. On the basis of our simulations, this difference could be understood by different scenarios with different background parameters. Our results depend on the chosen scaling. Reducing the characteristic velocity vn by a factor λ would reduce the characteristic energy by λ2. This could substantially lower the range where the rolling pin distributions are found.
Our simulations also enabled us to identify the source regions of particles contributing to the different final distributions. Particles in the PSBL distributions originated also from the PSBL (on either side). Particles in the inner flux pileup region originated from the inner CPS, were energized primarily through the betatron effect in the compressed plasma. The field-aligned beams were absent in that region.
The origin of the particles contributing to the distributions in the outer FPR/CPS was more complicated. The distributions consisted of an inner core of weakly, more isotropically, energized (i.e, heated) particles of lobe origin, surrounded by a population of outer CPS origin, which was energized by betatron acceleration. These distributions also contained field-aligned beams, which were of inner CPS origin with the same history as the high-energy beams in the PSBL.
Finally, some general comments: The distributions, particularly in the FPR region reached by reconnected lobe field lines, show high variability with time and energy. In evaluating the effects of different acceleration mechanisms it is important not only to consider the earthward transport of particles but also the finite extent and cross-tail variation of the acceleration region.
The datasets presented in this study can be found in online repositories. The names of the repository/repositories and accession number(s) can be found in the article/supplementary material.
JB performed the simulations and prepared the body of the text. MH and AR provided background and contributions to the text.
The simulation work was performed by JB at Los Alamos under the auspices of the US Department of Energy, supported by NASA grant 80NSSC18K0834 and NSF grant 1602655. AR acknowledges support from NASA contract NAS5-02099.
The authors declare that the research was conducted in the absence of any commercial or financial relationships that could be construed as a potential conflict of interest.
All claims expressed in this article are solely those of the authors and do not necessarily represent those of their affiliated organizations, or those of the publisher, the editors and the reviewers. Any product that may be evaluated in this article, or claim that may be made by its manufacturer, is not guaranteed or endorsed by the publisher.
This work is dedicated to the memory of Peter Gary, a close friend and valued advisor, who had a keen interest in the sources of electron anisotropy. The simulation work was performed by JB at Los Alamos under a guest scientist agreement.
Arnoldy, R. L., and Chan, K. W. (1969). Particle Substorms Observed at the Geostationary Orbit. J. Geophys. Res. 74, 5019–5028. doi:10.1029/ja074i021p05019
Artemyev, A. V., Liu, J., Angelopoulos, V., and Runov, A. (2015). Acceleration of Ions by Electric Field Pulses in the Inner Magnetosphere. J. Geophys. Res. Space Phys. 120, 4628–4640. doi:10.1002/2015JA021160
Ashour-Abdalla, M., El-Alaoui, M., Goldstein, M. L., Zhou, M., Schriver, D., Richard, R., et al. (2011). Observations and Simulations of Non-local Acceleration of Electrons in Magnetotail Magnetic Reconnection Events. Nat. Phys. 7, 360–365. doi:10.1038/nphys1903
Baker, D. N., Higbie, P. R., Hones, E. W., and Belian, R. D. (1978). High-Resolution Energetic Particle Measurements at 6.6 RE, 3. Low-Energy Electron Anisotropies and Short-Term Substorm Predictions. J. Geophys. Res. 83, 4863–4868. doi:10.1029/ja083ia10p04863
Belian, R. D., Baker, D. N., Hones, E. W., Higbie, P. R., Bame, S. J., and Asbridge, J. R. (1981). Timing of Energetic Proton Enhancements Relative to Magnetospheric Substorm Activity and its Implication for Substorm Theories. J. Geophys. Res. 86, 1415. doi:10.1029/ja086ia03p01415
Birn, J., Artemyev, A. V., Baker, D. N., Echim, M., Hoshino, M., and Zelenyi, L. M. (2012). Particle Acceleration in the Magnetotail and Aurora. Space Sci. Rev. 173, 49–102. doi:10.1007/s11214-012-9874-4
Birn, J., Chandler, M., Moore, T., and Runov, A. (2017). Ion Velocity Distributions in Dipolarization Events: Beams in the Vicinity of the Plasma Sheet Boundary. J. Geophys. Res. Space Phys. 122, 8026–8036. doi:10.1002/2017JA024231
Birn, J., Drake, J. F., Shay, M. A., Rogers, B. N., Denton, R. E., Hesse, M., et al. (2001). Geospace Environmental Modeling (GEM) Magnetic Reconnection Challenge. J. Geophys. Res. 106, 3715–3719. doi:10.1029/1999ja900449
Birn, J., Hesse, M., Nakamura, R., and Zaharia, S. (2013). Particle Acceleration in Dipolarization Events. J. Geophys. Res. Space Phys. 118, 1960–1971. doi:10.1002/jgra.50132
Birn, J., Liu, Y.-H., Daughton, W., Hesse, M., and Schindler, K. (2015). Reconnection and Interchange Instability in the Near Magnetotail. Earth Planet Sp. 67, 110. doi:10.1186/s40623-015-0282-3
Birn, J., Nakamura, R., Panov, E. V., and Hesse, M. (2011). Bursty Bulk Flows and Dipolarization in MHD Simulations of Magnetotail Reconnection. J. Geophys. Res. 116, a–n. doi:10.1029/2010JA016083
Birn, J., Runov, A., and Hesse, M. (2014). Energetic Electrons in Dipolarization Events: Spatial Properties and Anisotropy. J. Geophys. Res. Space Phys. 119, 3604–3616. doi:10.1002/2013JA019738
Birn, J., Thomsen, M. F., Borovsky, J. E., Reeves, G. D., McComas, D. J., Belian, R. D., et al. (1998). Substorm Electron Injections: Geosynchronous Observations and Test Particle Simulations. J. Geophys. Res. 103, 9235–9248. doi:10.1029/97ja02635
Birn, J., Thomsen, M. F., Borovsky, J. E., Reeves, G. D., McComas, D. J., Belian, R. D., et al. (1997). Substorm Ion Injections: Geosynchronous Observations and Test Particle Orbits in Three-Dimensional Dynamic MHD Fields. J. Geophys. Res. 102, 2325–2341. doi:10.1029/96ja03032
Birn, J., Thomsen, M. F., and Hesse, M. (2004). Electron Acceleration in the Dynamic Magnetotail: Test Particle Orbits in Three-Dimensional Magnetohydrodynamic Simulation Fields. Phys. Plasmas 11, 1825–1833. doi:10.1063/1.1704641
Breuillard, H., Le Contel, O., Retino, A., Chasapis, A., Chust, T., Mirioni, L., et al. (2016). Multispacecraft Analysis of Dipolarization Fronts and Associated Whistler Wave Emissions Using MMS Data. Geophys. Res. Lett. 43, 7279–7286. doi:10.1002/2016GL069188
Büchner, J., and Zelenyi, L. M. (1989). Regular and Chaotic Charged Particle Motion in Magnetotaillike Field Reversals: 1. Basic Theory of Trapped Motion. J. Geophys. Res. 94, 11821–11842. doi:10.1029/JA094iA09p11821
Christon, S. P., Mitchell, D. G., Williams, D. J., Frank, L. A., Huang, C. Y., and Eastman, T. E. (1988). Energy Spectra of Plasma Sheet Ions and Electrons from ∼50 eV/eto ∼1 MeV during Plasma Temperature Transitions. J. Geophys. Res. 93, 2562. doi:10.1029/ja093ia04p02562
Christon, S. P., Williams, D. J., Mitchell, D. G., Frank, L. A., and Huang, C. Y. (1989). Spectral Characteristics of Plasma Sheet Ion and Electron Populations during Undisturbed Geomagnetic Conditions. J. Geophys. Res. 94, 13,409. doi:10.1029/ja094ia10p13409
Curran, D. B., and Goertz, C. K. (1989). Particle Distributions in a Two-Dimensional Reconnection Field Geometry. J. Geophys. Res. 94, 272. doi:10.1029/ja094ia01p00272
Deng, X., Ashour-Abdalla, M., Zhou, M., Walker, R., El-Alaoui, M., Angelopoulos, V., et al. (2010). Wave and Particle Characteristics of Earthward Electron Injections Associated with Dipolarization Fronts. J. Geophys. Res. 115, a–n. doi:10.1029/2009JA015107
Fu, H., Grigorenko, E. E., Gabrielse, C., Liu, C., Lu, S., Hwang, K. J., et al. (2020). Magnetotail Dipolarization Fronts and Particle Acceleration: A Review. Sci. China Earth Sci. 63, 235–256. doi:10.1007/s11430-019-9551-y
Fu, H. S., Khotyaintsev, Y. V., André, M., and Vaivads, A. (2011). Fermi and Betatron Acceleration of Suprathermal Electrons behind Dipolarization Fronts. Geophys. Res. Lett. 38, a–n. doi:10.1029/2011GL048528
Gabrielse, C., Angelopoulos, V., Runov, A., and Turner, D. L. (2012). The Effects of Transient, Localized Electric Fields on Equatorial Electron Acceleration and Transport toward the Inner Magnetosphere. J. Geophys. Res. 117, a–n. doi:10.1029/2012JA017873
Gabrielse, C., Harris, C., Angelopoulos, V., Artemyev, A., and Runov, A. (2016). The Role of Localized Inductive Electric Fields in Electron Injections Around Dipolarizing Flux Bundles. J. Geophys. Res. Space Phys. 121, 9560–9585. doi:10.1002/2016JA023061
Gary, S. P., Hughes, R. S., Wang, J., and Chang, O. (2014). Whistler Anisotropy Instability: Spectral Transfer in a Three‐dimensional Particle‐in‐cell Simulation. J. Geophys. Res. Space Phys. 119, 1429–1434. doi:10.1002/2013JA019618
Gary, S. P. (2015). Short-wavelength Plasma Turbulence and Temperature Anisotropy Instabilities: Recent Computational Progress. Phil. Trans. R. Soc. A 373, 20140149. doi:10.1098/rsta.2014.0149
Gary, S. P. (1993). “Theory of Space Plasma Microinstabilities,” in Cambridge Atmospheric and Space Science Series (Cambridge: Cambridge University Press). doi:10.1017/CBO9780511551512
Hones, E. W. (1979). Transient Phenomena in the Magnetotail and Their Relation to Substorms. Space Sci. Rev. 23, 393–410. doi:10.1007/bf00172247
Hyman, J. M. (1983). Accurate Monotonicity Preserving Cubic Interpolation. SIAM J. Sci. Stat. Comput. 4, 645–654. doi:10.1137/0904045
Khotyaintsev, Y. V., Cully, C. M., Vaivads, A., André, M., and Owen, C. J. (2011). Plasma Jet Braking: Energy Dissipation and Nonadiabatic Electrons. Phys. Rev. Lett. 106, 165001. doi:10.1103/PhysRevLett.106.165001
Le Contel, O., Nakamura, R., Breuillard, H., Argall, M. R., Graham, D. B., Fischer, D., et al. (2017). Lower Hybrid Drift Waves and Electromagnetic Electron Space-phase Holes Associated with Dipolarization Fronts and Field-Aligned Currents Observed by the Magnetospheric Multiscale Mission during a Substorm. J. Geophys. Res. Space Phys. 122, 236. doi:10.1002/2017JA024550
Le Contel, O., Roux, A., Jacquey, C., Robert, P., Berthomier, M., Chust, T., et al. (2009). Quasi-parallel Whistler Mode Waves Observed by THEMIS during Near-Earth Dipolarizations. Ann. Geophys. 27, 2259–2275. doi:10.5194/angeo-27-2259-2009
Lezniak, T. W., Arnoldy, R. L., Parks, G. K., and Winckler, J. R. (1968). Measurement and Intensity of Energetic Electrons at the Equator at 6.6Re. Radio Sci. 3, 710–714. doi:10.1002/rds196837710
Li, H., Zhou, M., Deng, X., Yuan, Z., Guo, L., Yu, X., et al. (2015). A Statistical Study on the Whistler Waves behind Dipolarization Fronts. J. Geophys. Res. Space Phys. 120, 1086–1095. doi:10.1002/2014JA020474
Li, X., Baker, D. N., Temerin, M., Reeves, G. D., and Belian, R. D. (1998). Simulation of Dispersionless Injections and Drift Echoes of Energetic Electrons Associated with Substorms. Geophys. Res. Lett. 25, 3763–3766. doi:10.1029/1998gl900001
Liu, C. M., Fu, H. S., Liu, Y. Y., Wang, Z., Chen, G., Xu, Y., et al. (2020). Electron Pitch‐Angle Distribution in Earth's Magnetotail: Pancake, Cigar, Isotropy, Butterfly, and Rolling‐Pin. J. Geophys. Res. Space Phys. 125, e2020JA027777. doi:10.1029/2020JA027777
Liu, C. M., Fu, H. S., Xu, Y., Cao, J. B., and Liu, W. L. (2017). Explaining the Rolling-Pin Distribution of Suprathermal Electrons behind Dipolarization Fronts. Geophys. Res. Lett. 44, 6492–6499. doi:10.1002/2017GL074029
Liu, J., Angelopoulos, V., Runov, A., and Zhou, X.-Z. (2013). On the Current Sheets Surrounding Dipolarizing Flux Bundles in the Magnetotail: The Case for Wedgelets. J. Geophys. Res. Space Phys. 118, 2000–2020. doi:10.1002/jgra.50092
Moore, T. E., and Arnoldy, R. L. (1982). Plasma Pitch Angle Distributions Near the Substorm Injection Front. J. Geophys. Res. 87, 265–270. doi:10.1029/JA087iA01p00265
Nakamura, R., Baumjohann, W., Klecker, B., Bogdanova, Y., Balogh, A., Réme, H., et al. (2002). Motion of the Dipolarization Front during a Flow Burst Event Observed by Cluster. Geophys. Res. Lett. 29, 1942. doi:10.1029/2002gl015763
Nakamura, R., Baumjohann, W., Mouikis, C., Kistler, L. M., Runov, A., Volwerk, M., et al. (2004). Spatial Scale of High-Speed Flows in the Plasma Sheet Observed by Cluster. Geophys. Res. Lett. 31, a–n. doi:10.1029/2004GL019558
Nakamura, R., Baumjohann, W., Panv, E., Volwerk, M., Birn, J., Artemyev, A., et al. (2012). Flow Bouncing and Electron Injection Observed by Cluster. J. Geophys. Res. 118, 2055. doi:10.1002/jgra.50134
Pan, Q., Ashour-Abdalla, M., Walker, R. J., and El-Alaoui, M. (2014). Electron Energization and Transport in the Magnetotail during Substorms. J. Geophys. Res. Space Phys. 119, 1060–1079. doi:10.1002/2013JA019508
Panov, E. V., Kubyshkina, M. V., Nakamura, R., Baumjohann, W., Angelopoulos, V., Sergeev, V. A., et al. (2013). Oscillatory Flow Braking in the Magnetotail: THEMIS Statistics. Geophys. Res. Lett. 40, 2505–2510. doi:10.1002/grl.50407
Panov, E. V., Nakamura, R., Baumjohann, W., Angelopoulos, V., Petrukovich, A. A., Retinò, A., et al. (2010a). Multiple Overshoot and Rebound of a Bursty Bulk Flow. Geophys. Res. Lett. 37, L8103. doi:10.1029/2009GL041971
Panov, E. V., Nakamura, R., Baumjohann, W., Sergeev, V. A., Petrukovich, A. A., Angelopoulos, V., et al. (2010b). Plasma Sheet Thickness during a Bursty Bulk Flow Reversal. J. Geophys. Res. 115, a–n. doi:10.1029/2009JA014743
Parks, G. K., and Winckler, J. R. (1968). Acceleration of Energetic Electrons Observed at the Synchronous Altitude during Magnetospheric Substorms. J. Geophys. Res. 73, 5786–5791. doi:10.1029/ja073i017p05786
Pontius, D. H., and Wolf, R. A. (1990). Transient Flux Tubes in the Terrestrial Magnetosphere. Geophys. Res. Lett. 17, 49–52. doi:10.1029/gl017i001p00049
Runov, A., Angelopoulos, V., Gabrielse, C., Zhou, X.-Z., Turner, D., and Plaschke, F. (2013). Electron Fluxes and Pitch-Angle Distributions at Dipolarization Fronts: THEMIS Multipoint Observations. J. Geophys. Res. Space Phys. 118, 744–755. doi:10.1002/jgra.50121
Runov, A., Angelopoulos, V., Sitnov, M. I., Sergeev, V. A., Bonnell, J., McFadden, J. P., et al. (2009). THEMIS Observations of an Earthward-Propagating Dipolarization Front. Geophys. Res. Lett. 36, L14106. doi:10.1029/2009GL038980
Runov, A., Angelopoulos, V., and Zhou, X.-Z. (2012). Multipoint Observations of Dipolarization Front Formation by Magnetotail Reconnection. J. Geophys. Res. 117, a–n. doi:10.1029/2011JA017361
Runov, A., Angelopoulos, V., Zhou, X.-Z., Zhang, X.-J., Li, S., Plaschke, F., et al. (2011). A THEMIS Multicase Study of Dipolarization Fronts in the Magnetotail Plasma Sheet. J. Geophys. Res. 116, A05216. doi:10.1029/2010JA016316
Sergeev, V. A., Angelopoulos, V., Apatenkov, S., Gosling, J. T., Cattell, C. A., and Russell, C. T. (1996). Detection of Localized, Plasma-Depleted Flux Tubes or Bubbles in the Midtail Plasma Sheet. J. Geophys. Res. 101, 10,817–10,826. doi:10.1029/96ja00460
Sergeev, V., Angelopoulos, V., Apatenkov, S., Bonnell, J., Ergun, R., Nakamura, R., et al. (2009). Kinetic Structure of the Sharp Injection/dipolarization Front in the Flow-Braking Region. Geophys. Res. Lett. 36, L21105. doi:10.1029/2009GL040658
Smets, R., Delcourt, D., Sauvaud, J. A., and Koperski, P. (1999). Electron Pitch Angle Distributions Following the Dipolarization Phase of a Substorm: Interball-Tail Observations and Modeling. J. Geophys. Res. 104, 14571–14581. doi:10.1029/1998JA900162
Tsyganenko, N. A. (1987). Global Quantitative Models of the Geomagnetic Field in the Cislunar Magnetosphere for Different Disturbance Levels. Planet. Space Sci. 35, 1347–1358. doi:10.1016/0032-0633(87)90046-8
Vasyliunas, V. M. (1968). A Survey of Low-Energy Electrons in the Evening Sector of the Magnetosphere with OGO 1 and OGO 3. J. Geophys. Res. 73, 2839–2884. doi:10.1029/ja073i009p02839
Viberg, H., Khotyaintsev, Y. V., Vaivads, A., André, M., Fu, H. S., and Cornilleau-Wehrlin, N. (2014). Whistler Mode Waves at Magnetotail Dipolarization Fronts. J. Geophys. Res. Space Phys. 119, 2605–2611. doi:10.1002/2014JA019892
Wolf, R. A., Wan, Y., Xing, X., Zhang, J.-C., and Sazykin, S. (2009). Entropy and Plasma Sheet Transport. J. Geophys. Res. 114, a–n. doi:10.1029/2009JA014044
Wu, M., Lu, Q., Volwerk, M., Vörös, Z., Zhang, T., Shan, L., et al. (2013). A Statistical Study of Electron Acceleration behind the Dipolarization Fronts in the Magnetotail. J. Geophys. Res. Space Phys. 118, 4804–4810. doi:10.1002/jgra.50456
Wu, P., Fritz, T. A., Larvaud, B., and Lucek, E. (2006). Substorm Associated Magnetotail Energetic Electrons Pitch Angle Evolutions and Flow Reversals: Cluster Observation. Geophys. Res. Lett. 33. doi:10.1029/2006GL026595
Zaharia, S., Cheng, C. Z., and Johnson, J. R. (2000). Particle Transport and Energization Associated with Substorms. J. Geophys. Res. 105, 18,741. doi:10.1029/1999ja000407
Zelenyi, L. M., Lominadze, J. G., and Taktakishvili, A. L. (1990). Generation of the Energetic Proton and Electron Bursts in Planetary Magnetotails. J. Geophys. Res. 95, 3883–3891. doi:10.1029/JA095iA04p03883
Zhang, X., Angelopoulos, V., Artemyev, A. V., and Liu, J. (2018). Whistler and Electron Firehose Instability Control of Electron Distributions in and Around Dipolarizing Flux Bundles. Geophys. Res. Lett. 45, 9380–9389. doi:10.1029/2018GL079613
Zhao, M. J., Fu, H. S., Liu, C. M., Chen, Z. Z., Xu, Y., Giles, B. L., et al. (2019). Energy Range of Electron Rolling Pin Distribution behind Dipolarization Front. Geophys. Res. Lett. 46, 2390–2398. doi:10.1029/2019GL082100
Keywords: electron anisotropies, particle acceleration, dipolarization events, magnetospheric substorms, particle sources
Citation: Birn J, Hesse M and Runov A (2022) Electron Anisotropies in Magnetotail Dipolarization Events. Front. Astron. Space Sci. 9:908730. doi: 10.3389/fspas.2022.908730
Received: 30 March 2022; Accepted: 30 May 2022;
Published: 23 June 2022.
Edited by:
Charles William Smith, University of New Hampshire, United StatesReviewed by:
Thomas Earle Moore, Third Rock Research, United StatesCopyright © 2022 Birn, Hesse and Runov. This is an open-access article distributed under the terms of the Creative Commons Attribution License (CC BY). The use, distribution or reproduction in other forums is permitted, provided the original author(s) and the copyright owner(s) are credited and that the original publication in this journal is cited, in accordance with accepted academic practice. No use, distribution or reproduction is permitted which does not comply with these terms.
*Correspondence: Joachim Birn, amJpcm5Ac3BhY2VzY2llbmNlLm9yZw==
Disclaimer: All claims expressed in this article are solely those of the authors and do not necessarily represent those of their affiliated organizations, or those of the publisher, the editors and the reviewers. Any product that may be evaluated in this article or claim that may be made by its manufacturer is not guaranteed or endorsed by the publisher.
Research integrity at Frontiers
Learn more about the work of our research integrity team to safeguard the quality of each article we publish.