- 1Birkeland Centre for Space Science, Bergen, Norway
- 2Max Planck Institute for Solar System Research, Göttingen, Germany
Discontinuities in the solar wind trigger a variety of processes in the magnetosphere-ionosphere system. A rapid increase in solar wind dynamic pressure causes compression of the magnetosphere. This manifests itself as a positive perturbation of the horizontal ground magnetic field at low/mid latitudes. In this study we present a method for detecting these discontinuities in situ solar wind data by using the random forest machine learning algorithm. Each detected event is propagated to Earth and its arrival time is aligned with a corresponding response in the low latitude ground magnetic field. A list of 3,867 events, detected between 1994 and 2019, is presented. We use the list in a superposed epoch analysis of the low/mid latitude response in the ground magnetic field at different local times, and of the high latitude response using the Polar Cap index. A dawn-dusk asymmetry is found at low/mid latitudes with weaker positive perturbations at dawn compared to any other local time sector. This suggests a stronger ring current contribution at dawn assuming the magnetopause contribution to be uniform. During northward IMF the initial response is asymmetric, but returns to symmetry after 30 min. During southward IMF the low/mid latitude response decays rapidly in all local sectors except dawn. After around 30 min the asymmetry has flipped such that the strongest positive perturbation is at dawn. This suggests an amplification of the partial ring current. In addition, a noon-midnight asymmetry is observed during southward IMF with the strongest positive perturbation on the night side suggesting a significant contribution from dipolarization of the geomagnetic field in the near tail. The complex geomagnetic response to rapid increases in solar wind dynamic pressure demonstrates a need for further statistical analyses. Event lists, such as the one presented here, are critical components in such studies.
1 Introduction
The solar wind flows radially outward from the Sun, populating the interplanetary space and carrying with it the Sun’s magnetic field referred to as the Interplanetary Magnetic Field (IMF). The magnetosphere-ionosphere-thermosphere system is heavily dependent on conditions in the solarwind and IMF. Understanding this complex system is a difficult task. Natural phenomena in the solar wind can perturb the entire system. Studying their characteristics in combination with those of the perturbed system may result in a deeper understanding of the dynamic system and its dependencies.
In this study we focus on rapid increases in solar wind dynamic pressure Pd. This type of event can have various origins. The best known of these are coronal mass ejections, a large and sudden release of plasma from the Sun. The ejecta is referred to as interplanetary coronal mass ejection when propagating through interplanetary space and can form an interplanetary shock (IS). Another well known origin is a stream interaction region which occurs in the rarefaction zone of two solar wind streams. However, ISs (of the forward type) rarely evolve in these rarefaction zones before they have passed Earth and are therefore seldom observed at Earth (Smith and Wolfe, 1976). A detailed description of ISs is given by Oliveira and Samsonov (2018).
Rapid changes in Pd can occur without the formation of a shock. In their examination of such solar wind structures Dalin et al. (2002a) found that the majority of cases occurred due to increases in solar wind number density and not solar wind speed. Additionally, they found that their occurrence rate was independent of solar cycle, unlike ISs (Oliveira and Samsonov, 2018).
Rapid increases in Pd are linked to Sudden Commencements (SC). The term SC comes from storm sudden commencement which is a pressure-induced magnetic perturbation on ground that precedes a geomagnetic storm. However, it was suspected that the phenomena could occur without being followed by a storm and thus SC was termed. In addition, the term sudden impulse was coined after the discovery of a characteristic perturbation in the H-component later shown to be caused by the same mechanism as the SC. We will use the term SC as a general expression for both storm sudden commencement and sudden impulse as suggested by Curto et al. (2007).
Following Araki (1994), we divide the ground response Dsc into a low-latitude (DL) and high-latitude (DP) response:
DL is thought to be a direct effect of magnetospheric compression which increases the magnetic flux density resulting in a positive perturbation of the horizontal magnetic field. DP is connected to vortices in the high latitude ionosphere. The vortices occur in two pairs; the first is the preliminary impulse PI and the second is the main impulse MI.
Describing these contributions and the parameters they depend on requires a large set of events to facilitate analysis of multiple sub-sets with a statistically meaningful size. This study will focus on finding suitable events and on analysis of the magnetospheric contribution. The ionospheric contribution will be addressed in a later study.
Several statistical studies of the geospace response to ISs have been made (Russell et al., 1994a,b; Russell and Ginskey, 1995). It was found that an increase in the horizontal magnetic field due to compression of the magnetosphere, at 20° latitude, is expected to be around 18.4 nT/
Our goal is to isolate the influence of dipole tilt and IMF orientation on SC development. None of the lists of events described in existing statistical studies of SCs are appropriate for our purposes, since to our knowledge these studies are tailored to ISs and/or the lists contain too few events to separate events into bins based on more than one environmental parameter without compromising the ability to yield statistically meaningful conclusions.
Before the use of in situ observations of solar wind plasma, lists of SC were made by inspection of observations from ground magnetometer stations. A historical overview of the study of SCs is given in Curto et al. (2007). Various lists from the early to mid-19th century are mentioned, one of which is still maintained and can be accessed at http://www.obsebre.es/en/rapid.
During the late 20th century in situ solar wind data became more common and the connection between SC and changes in Pd was made (Friis-Christensen et al., 1988). At the same time lists of various solar wind events were made, typically either through cumbersome manual inspection or through manual verification after applying an algorithm to the raw data. Two classic lists of interplanetary coronal mass ejections and stream interaction regions using the manual approach were presented by Richardson and Cane (1995) and Jian et al. (2006), respectively. A list of ISs was presented by Oliveira and Raeder (2015), containing 461 events spanning 1995–2013. The list is a compilation of four other lists combined with the authors own manually verified events detected by an algorithm. In addition, Boudouridis and Zesta (2021) recently presented an algorithm for automated detection of rapid pressure increases by fitting a logistic function to in situ solar wind data.
These lists are all based on measurements from the solar wind, and only a few provide the arrival time at Earth. We know only one analysis where the arrival time was determined based on ground magnetometers: Huang and Yumoto (2006) presented 160 instances of Pd enhancements between 1998 and 2005, and arrival times were determined based on a corresponding ground response. We use this concept when addressing arrival time in Section 3.2.
In Section 2, we describe the solar wind and magnetometer measurements that we use to derive our list. In Section 3, we describe our methodology for automated identification of rapid Pd increase via the random forest machine learning algorithm and the estimated arrival time at Earth. In Section 4, we discuss the resulting list of 3,867 events, which covers a 26-year period, and perform a superposed epoch analysis using various subsets of the event list to isolate the influence of controlling parameters. In Sections 5 we discuss the implications of the event detection method, a seasonal dependence of the occurrence rate, and the interpretation of a possible dawn-dusk ring current asymmetry. Section 6 concludes the paper.
2 Data
The aim of this study is two-fold; to create a list of rapid Pd increases leading to measurable magnetic ground perturbation, and to perform a statistical analysis of these magnetic ground perturbations. In order to achieve this, both in situ solar wind measurements and ground-based magnetic field measurements are required.
2.1 In Situ Solar Wind
In situ observations of the solar wind spanning 1994–2019 was provided by the Advanced Composition Explorer (ACE) and Wind missions. The two spacecraft measure solar wind plasma characteristics using the Solar Wind Experiment (SWE) (Ogilvie et al., 1995) and the Solar Wind Electron, Proton and Alpha Monitor (SWEPAM) (McComas et al., 1998). The IMF is measured using the Magnetic Fields Investigation (MFI) (Lepping et al., 1995) and magnetometer (MAG) (Smith et al., 1998) instruments. Plasma data with a temporal resolution of 3- and 64-s and IMF data with a temporal resolution of 3- and 16-s for ACE and Wind, respectively, was downloaded from the Coordinated Data Analysis Web (CDAWeb) at https://cdaweb.gsfc.nasa.gov/index.html/. All solar wind observations were up- or down-sampled to 1-min resolution after interpolating data gaps smaller than 4 min.
Measurements from Wind were provided in the GSE reference frame. A rotation into GSM was therefore carried out using the method described in Hapgood (1992). The GSM reference frame is preferred as it better describes coupling between the IMF and Earth’s magnetic field.
2.2 Indices
The SYM-H index (Iyemori et al., 2010) at 1-min resolution was used for arrival time estimates of events. The SYM-H index is closely related to the ground magnetic perturbation due to the ring current and is strongly correlated with Pd enhancements (Burton et al., 1975). This index is accessible at https://omniweb.gsfc.nasa.gov.
For the superposed epoch analysis another ring current index was used: SMR (Newell and Gjerloev, 2012) is a ring current index provided by the SuperMAG web service (https://supermag.jhuapl.edu/), based on a much larger number of magnetometers than SYM-H. This is important for the study of asymmetry as it allows for a local time dependent index SMR LT which is provided in four 6-h wide sectors centered at midnight/dawn/noon/dusk (00/06/12/18). The high latitude response was investigated using the polar cap index PC for the northern hemisphere PCN. This index is based on the Thule magnetometer station on Greenland (Willer, 2021). It is accessible at https://omniweb.gsfc.nasa.gov. Both indices are provided in a 1-min resolution.
3 Methods
In this section we introduce the method with which the list of rapid Pd increases is generated. The process is separated into two main steps. First an algorithm processes the in situ solar wind data to find events. Then the event is aligned with a corresponding response on ground. In this study an event refers to a step-like increase in Pd that provokes a measurable geomagnetic response on ground.
Section 3.1 focuses on detection of events, while Section 3.2 describes how we match the detected events with a response measured by magnetometers on ground.
3.1 Event Detection
Detection of events is done using 120 min segments of in situ solar wind measurements of Pd as input into a machine learning algorithm. The algorithm is designed to classify whether or not a rapid pressure increase (an event) is present in these segments. The algorithm is based on a set of features determined from each segment.
The training data is described in Section 3.1.1, the features are explained in detail in Section 3.1.2, and an introduction to the random forest machine learning algorithm is given in Section 3.1.3.
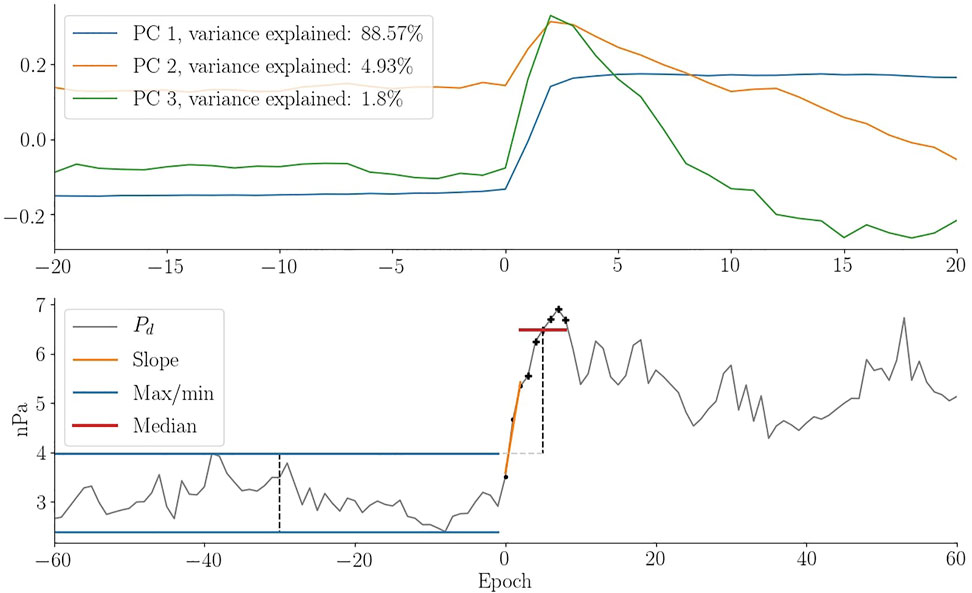
FIGURE 1. Illustration of the features used in the random forest algorithm. The top panel shows the first three principal components as a result of a PCA analysis of the data used in events. The bottom panel shows the slope in orange, the minimum and maximum before onset in blue and the median after onset in red. The Pd time series itself is an event observed May 8, 1998 at 09:20 by ACE.
3.1.1 Training Data
In this study we work with two classes: events and non-events. Our training data must contain examples of each of these classes.
The training data were compiled in two ways. The events were taken from a list of ISs provided by Oliveira and Raeder (2015). Initially, it consisted of 461 ISs. After removing events with data gaps 383 remained. In a second post-processing step the time of detection was corrected, typically not by more than a couple of minutes, to match the observed onset of the pressure jump.
The list of non-events is significantly longer with ∼1700 entries. The first 700 were determined by randomly selecting a point on the Pd time series from either ACE or Wind. This point is referred to as an Evaluation Point (EP). We determined if the EP was located at the onset of a rapid Pd increase or not by visual inspection. Segments with large data gaps were discarded. It was also enforced that the EPs should be uniformly distributed in seven groups according to background levels: 0–2, 2–3, 3–4, 4–5, 5–6, 6–7 and above 7 nPa. This was done to include information about the spread in non-events. The last 1,000 entries were determined by manually inspecting a ±60 min window around randomly chosen EPs where the subsequent data-point experienced an increase of 0.4 nPa or more (resolution between each data-point is 1-min). This group represents situations with larger Pd variance around the EP than the first group.
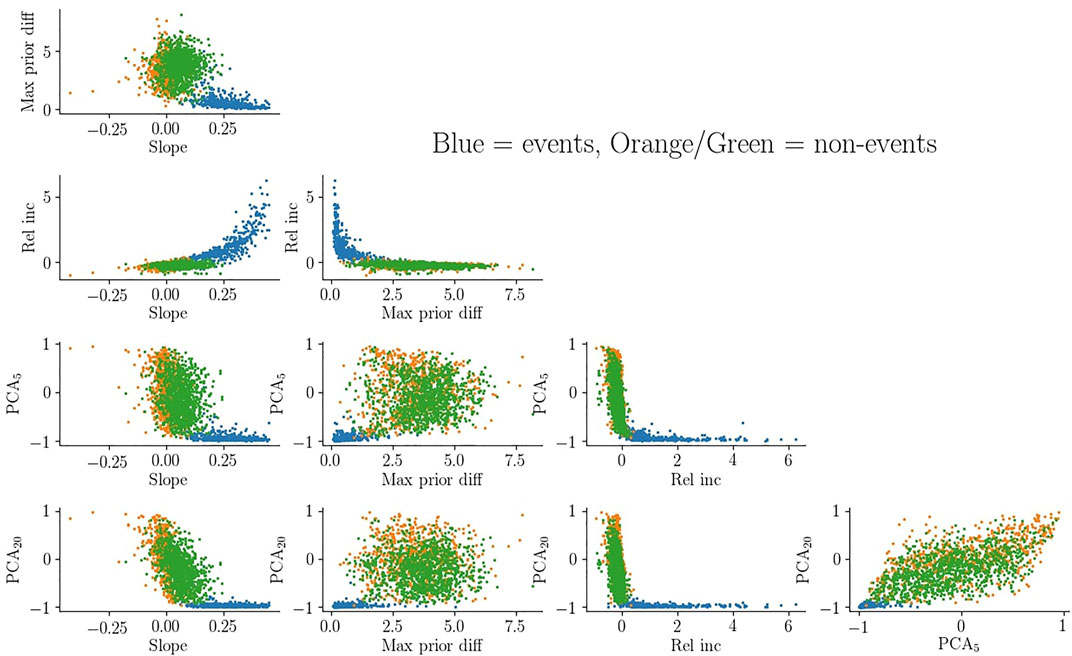
FIGURE 2. Distribution of events and non-events with respect to the features described in Section 3.1.2. The blue dots illustrate events while the orange and green dots are non-events. Data in non-events associated with more quiet conditions are orange while the ones associated with more active conditions are green.
3.1.2 Features
The algorithm is designed to predict if an EP is the onset of a rapid Pd increase. This is done by evaluating a set of features chosen to best describe the step-like behavior that we search for. We have chosen a total of five features. All features are determined on a relative scale such that events can be compared independent of the background level and size of the jump. The features are:
3.1.2.1 Slope
The gradient in the pressure jump. This is estimated by the slope of a linear regression fit based on the EP and the following two data-points. To facilitate intercomparison of events the resulting slope was divided by the largest of the three data-points. This feature is highly sensitive to data gaps and so if any of these three data-points were missing the EP was discarded.
3.1.2.2 Maximum Prior Difference
The difference between the minimum and maximum value in the 60-min interval prior to the EP. This was calculated using normalized data with mean and standard deviation determined from a ±60 min window around the EP.
3.1.2.3 Relative Increase
The relative increase from before to after the EP. This is a percentage increase between the maximum 60 min prior to and the median between 3 and 8 min after the EP.
3.1.2.4 PCA5 and PCA20
The last two features are based on a principal component analysis of the Pd measurements in the events from the training data. The first principal component shows a very clear step-like behavior (see Figure 1). The features, PCA5 and PCA20, are defined as the dot product between a candidate event and the first principal component, using time windows that are ±5 and ±20 min, respectively. When calculating the dot product, we fill in data gaps by interpolation and extrapolation.
The features are conceptually illustrated in Figure 1. In the top row the three first principal components in the events training dataset are shown. The first component has a step-like increase between epoch 0 and 2 and explains 88.57% of the variance. The second and third principal components also experience rapid increases at epoch 0 followed by a decay. These two components explain only 4.93 and 1.8% of the variance and could be related to pressure increases that last for only a short duration. The bottom row of Figure 1 shows an example event observed by ACE. Superimposed are the features when the EP is located at the onset of the jump. The calculated linear fit from which the slope is determined is illustrated in orange. The minimum and maximum prior to the EP is indicated by the blue lines, over the range from which they were determined. The median after the EP, used to calculate the percentage increase, is shown as a red line.
An active check for data gaps is only carried out during calculation of the slope. For the rest of the features, EPs were only discarded if the entire time series used for calculating a metric was missing.
The 5D space spanned by the features, commonly referred to as feature space, is illustrated for the training data in Figure 2. Events are shown in blue while the first part of non-events are shown in orange and the last part in green. It is evident that the features provide a clear distinction between the two classes which is crucial for the success of the algorithm.
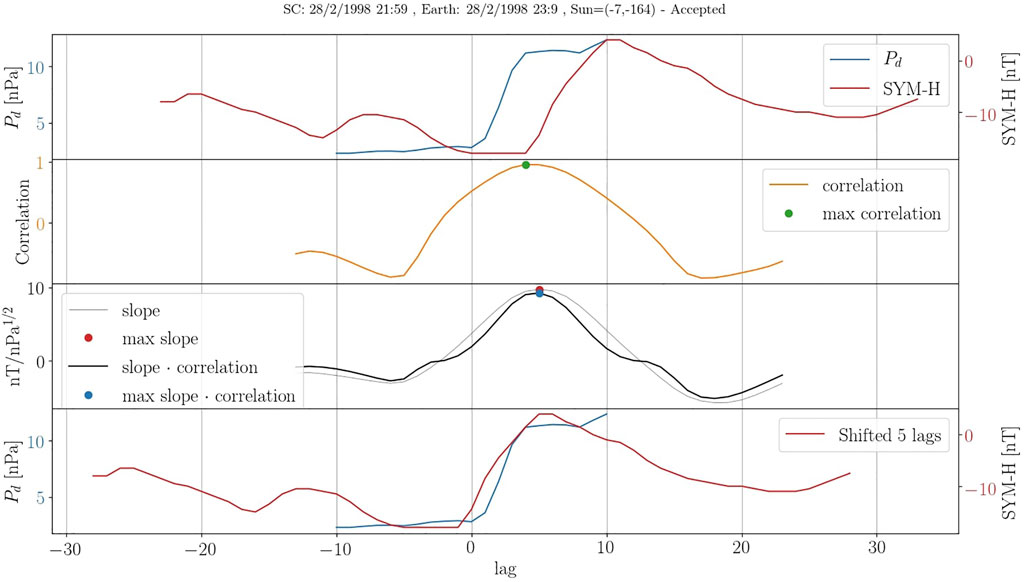
FIGURE 3. Example of the correlation analysis on event detected by ACE at 22 UT the February 28, 1998. The first panel shows Pd increase as observed by ACE along with SYM-H after around the event’s initial arrival time estimate. The second panel shows the correlation when sliding Pd over SYM-H in the first panel. The third panel shows the slope from a linear fit between SYM-H and
3.1.3 Random Forest
To separate between events and non-events we employ the random forest machine learning algorithm, a variation of the well-known supervised algorithm called decision tree. Training data are used to set up a series of binary questions (yes/no) with the purpose of separating data belonging to different classes. These binary questions are the basis for classifying events after training. If a decision tree is used in a bootstrapping format it is referred to as a random forest (Ho, 1995).
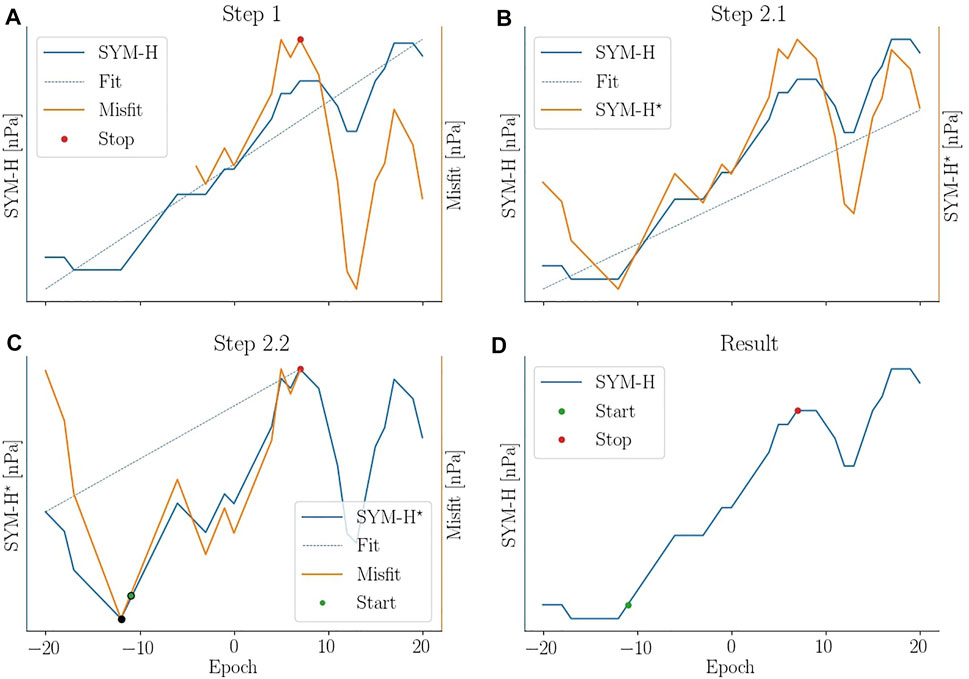
FIGURE 4. Example of algorithm used to find the onset of the response in SYM-H. In (A) the peak of the response is found. In (B) the SYM-H response is detrended. In (C) the onset if located. (D) shows the estimated onset and peak of the SYM-H response.
The random forest algorithm works by training a series of decision trees on individual data sets sampled from the training data. Each decision tree can then provide a classification when asked to predict the class of a potential event. In this way numerous decision trees can be used to calculate the probability that a given EP belongs to a particular class. Potential events are commonly assigned to whichever class has the highest probability. We used a stricter criteria by enforcing that 90% of all decision trees have to agree before a potential event can be classified as an event.
In practice the Python implementation by scikit-learn was used. In most practical implementations certain parameter choices have to be made (e.g., the number of decision trees, the maximum depth etc.). A complete description of the method used for selecting these parameters as well as illustrative plots is given in appendix.
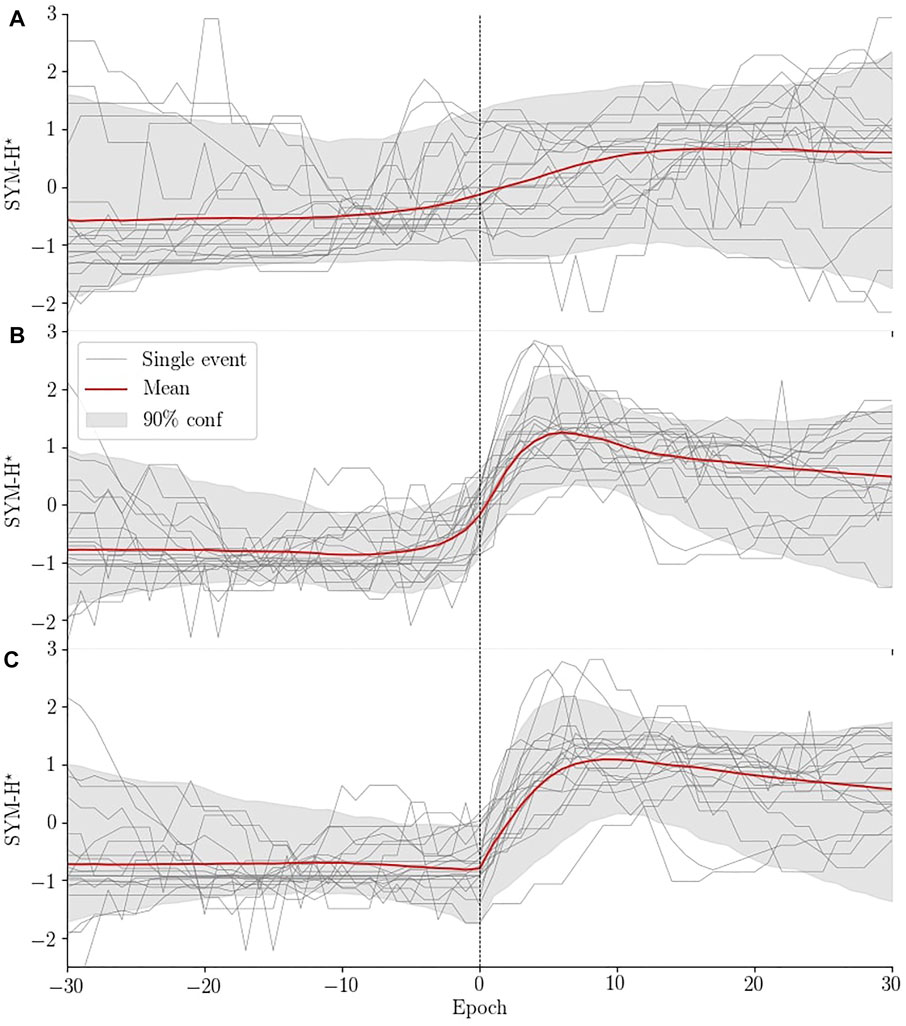
FIGURE 5. Comparison of normalized superposed SYM-H before any arrival time correction (A), after correlation analysis (B) and after aligning the onset of the SYM-H response (C). The shaded area illustrates the 90% confidence interval, the grey lines are 20 randomly selected events and the red lines are the mean of the distribution. Each event has been normalized, indicated by the asterisk in the axis label, in order to improve comparison between events.
3.1.4 Event Merging
Multiple EPs close to a Pd increase can be classified as events. In this scenario the EP with the highest classification probability was kept. During highly disturbed times multiple discontinuous Pd structures may appear resulting in events being very close in time. A minimum spacing of 1 h between events was enforced with the first come first serve principle. Events were detected with both ACE and Wind. When two events with similar arrival time estimates (discussed in the following section) arose ACE was prioritized and the Wind event discarded.
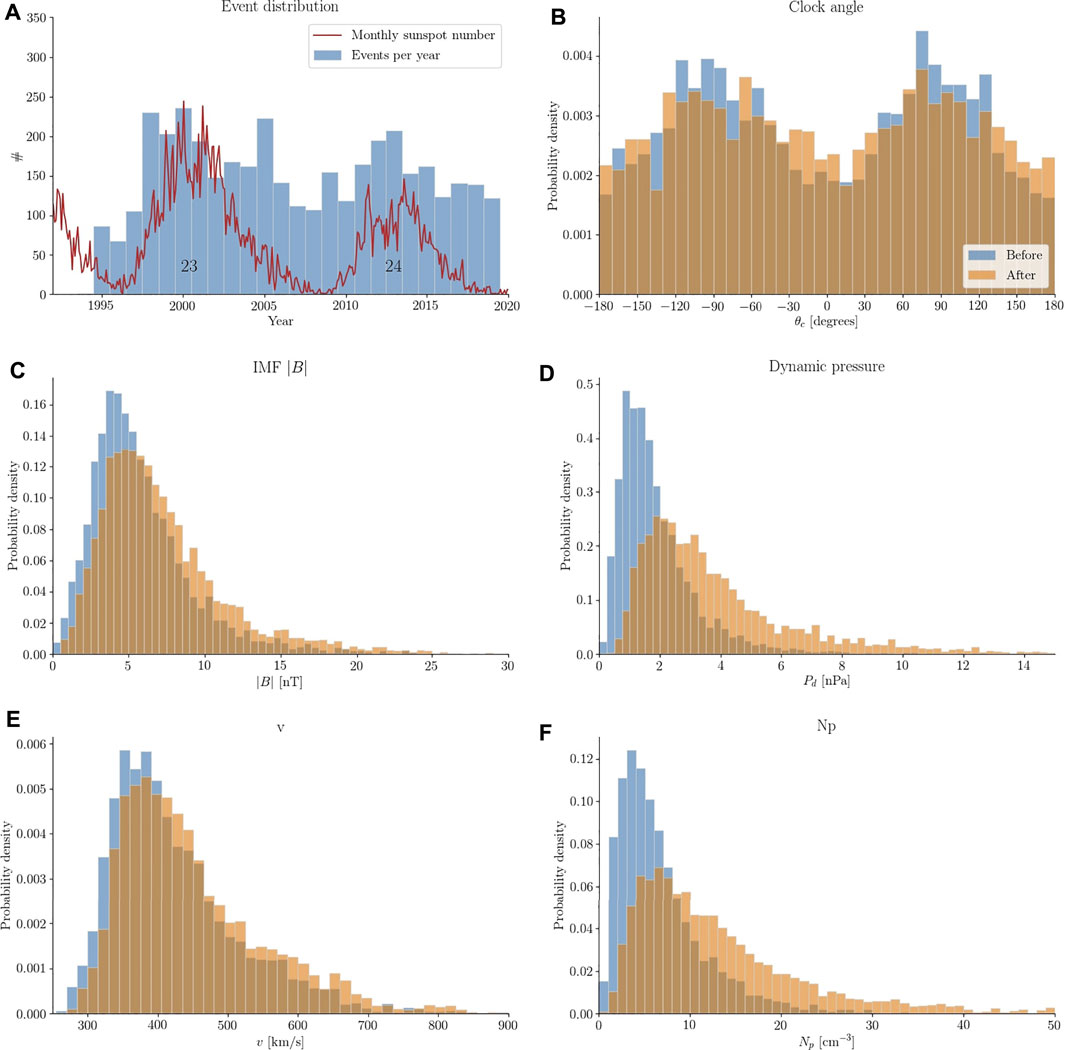
FIGURE 6. Summary of statistics related to the event list. (A) shows the number of events detected for individual years along with the monthly sunspot number. (B–F) show statistics of the upstream (orange) and downstream (blue) IMF clock angle, IMF magnitude, solar wind dynamic pressure, solar wind bulk velocity and ion number density.
3.2 Arrival Time
Our definition of arrival is when information about magnetospheric compression has propagated to Earth and is observed in SYM-H. Estimation of arrival time at Earth is done in three main steps.
Initially, arrival time at Earth was crudely estimated by propagating the events to the magnetopause, assumed to be located at 10 RE along the Sun-Earth line, using the spacecraft’s x coordinate and the measured solar wind velocity. The distribution of the normalized SYM-H responses is shown in Figure 5A for this step. Each response is normalized for better comparison as background level and jump size can vary. It is clear that the alignment is quite poor resulting in a gradual increase starting several minutes prior to epoch zero. This is because we do not take into account the location of the magnetopause given the preexisting solar wind conditions or the orientation of the solar wind structure (Weimer et al., 2003; Mailyan et al., 2008). In addition, the delay between impact with the magnetopause and observing a response on ground is not trivial, resulting in additional uncertainty.
A comprehensive correction of the initial arrival time estimate was done using a correlation analysis between Pd and SYM-H. Figure 3 showcases an example of the analysis. In the first row we show a ±10 min window of Pd (blue line) around the time of detection along with a ±40 min window of SYM-H (red line) around the crudely estimated arrival time. The second row shows the correlation resulting from sliding Pd over SYM-H. In the third row the slope from a fit between
Figure 3 suggests that the arrival time for all events can be shifted ±30 min. However, a custom threshold is determined for each event as a combination of uncertainty in the propagation ɛ1 and the magnetospheric-ionospheric coupling ɛ2. Ridley (2000) investigated the uncertainty in using various propagation techniques and found propagation along the Sun-Earth line had an average uncertainty of ɛmean = 0.219DYZ + 1.63 min when the spacecraft’s euclidean distance DYZ to the Sun-Earth line is given in Earth radii. We used a slightly more conservative estimate to allow for scenarios outside the norm by defining ɛ1 = 2ɛmean. An additional delay due to propagation through the magnetosphere and rise time of the response was accounted for by setting ɛ2 = 10 min. The maximum allowed correction of any event is thus [ − ɛ1, ɛ1 + ɛ2] which is a function of the spacecraft position. ACE and Wind have a maximum DYZ around 50 and 100 Earth radii leading to an ɛ1 of around 20–45 min, respectively.
The step-like increase in Pd is often more rapid than the SYM-H response. It is therefore clear that their correlation can exhibit a maximum somewhere between the SYM-H onset and the following plateau. In order to ensure the best possible alignment we perform a minor correction to the result of the correlation analysis using an algorithm to estimate the onset and plateau of the SYM-H response and then change the arrival time estimate to match that of the estimated onset.
The algorithm for finding the onset is divided into two steps as illustrated in Figure 4. The first step, Figures 4A, is to determine when the increase begins to plateau. First a linear fit (dashed blue) to the SYM-H (blue) is made. Then the misfit (orange) between the two is determined. The end of the rise time (red dot) is then determined as the maximum misfit after epoch −5.
The second step is separated into two sub-steps for illustration. First, Figure 4B, the SYM-H time series is detrended (indicated by the asterisk) by subtracting a linear fit (dashed blue) to the first 15 min from the entire time series. The next part, Figures 4C, is done on the detrended time series (blue). Epoch −20 and the red dot from 4a are connected by a straight line (dashed blue). From this the misfit (orange) between the detrended SYM-H and the linear fit is determined. The onset of the SYM-H response is then determined as the first misfit value, going from right to left, that falls below the 5% quantile of the misfit. Here two point fulfill the requirement, but the rightmost (green) is chosen. It is easy to tell from Figure 4D that the onset is not aligned with epoch 0. Using the newly determined onset the estimated arrival time is shifted accordingly.
The effect of this last response correction is evident when comparing Figures 5B,C. The onset is no longer observed as a gradual increase prior to epoch 0. The 90% confidence interval after onset has however become broader which makes sense given the varying rise time between events.
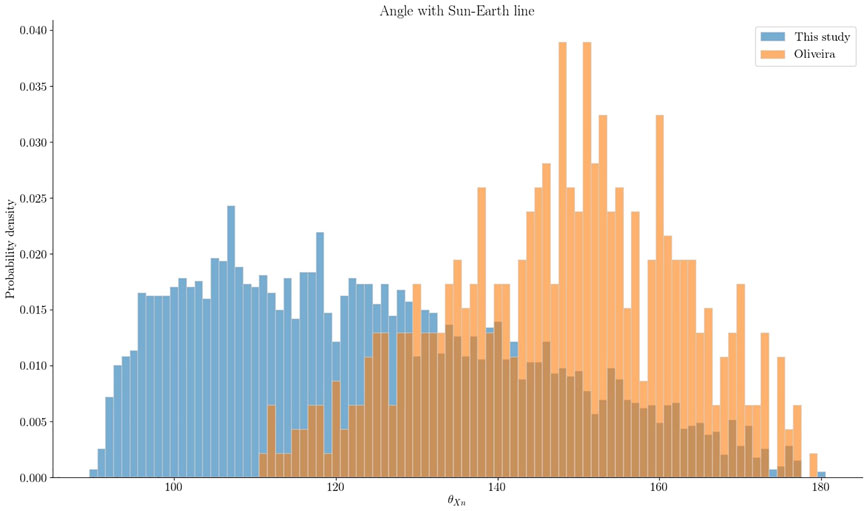
FIGURE 7. Comparison of
4 Results
This section presents the results of the study. The first part will focus on the list of events while the second part will showcase a superposed epoch analysis of the low and high latitude geomagnetic response to rapid increases in Pd as observed in various indices.
4.1 Event List
The event detection algorithm described in Section 3 was applied to the Pd series in a sliding window fashion evaluating all data points as potential events. The resulting event list contains 3,867 rapid increases in Pd between the year 1994 and 2019. A detailed description of the method used to make the list is given in Section 3. It is important to reiterate that the focus of this study is rapid increases in Pd regardless of origin.
Classifications by the event detection algorithm are made entirely based on Pd measurements. It is therefore interesting to see how the events in the list are characterized with respect to other solar wind parameters and thus how they distinguish themselves from other space weather phenomena. A summary of various solar wind parameters, before and after onset, is given in Figure 6. The statistics in Figures 6B–F were calculated from two 12-min windows offset 3 min to either side of the Pd onset. The median is shown for most variables. The exceptions are downstream Pd, the solar wind velocity and number density, for which the maximum is shown.
The number of detected events per year is shown in Figure 6A along with the monthly sunspot number downloaded from SILSO World Data center at http://www.sidc.be/silso/. The ratio between events detected at solar max (cycle 23) and solar min (between cycle 23 and 24) for our list is ∼2.2 while it is ∼5.5 for the IS list in Oliveira and Raeder (2015). Our events are determined solely on Pd and don’t necessarily uphold the Rankine-Hugoniot jump conditions. Dalin et al. (2002a) found the occurrence rate of pressure increases that are not shocks to be independent of the solar cycle. The difference in solar cycle dependence between the two lists is therefore consistent with our list containing non-shock events.
Figure 6B shows the IMF clock angle given as
where BY and BZ are the IMF components in the Y and Z (GSM) direction. The angle is thus 0° for purely northward IMF and ±180° for purely southward IMF. The distribution is bi-modal illustrating a statistically dominant BY component. The distribution after onset has slightly broadened. It is tempting to suggest from this figure that θc for individual events is similar before and after onset, but that is far from the case. Only 40% (61%) of events stay within ±22.5 (±45) degrees of the pre-onset clock angle.
The IMF magnitude, Figure 6C, has a mode around 4nT prior to onset which increases to 5 nT afterwards. Similarly, the mode of the Pd distribution, Figure 6D, changes from 1.1 to 2 nPa while the spread also is significantly increased as shown by the heavy tail. Note that the distribution shown in the figure is truncated at 15 nPa leaving 98 events outside. Figures 6E,F are distributions of solar wind bulk velocity and ion number density. Their modes are 365 km/s and 3.5 cm−3 before onset, and 380 kms/s and 6 cm−3 after. It is evident that the Pd increases are generally caused by rapid changes in solar wind ion number density consistent with Dalin et al. (2002a) who found their events to be either slow shocks or rotational discontinuities. Khabarova and Zastenker (2011) confirms that rapid increases in Pd are often caused by abrupt changes in ion number density. They likewise found that these types of event are not associated with coronal mass ejections, stream interaction regions and ISs, but are highly correlated with crossings of the heliospheric current sheet. It has later been shown that bends and kinks in the heliospheric current sheet can result in small magnetic islands that are related to ULF-variations in ion number density and IMF (Khabarova et al., 2021).
There are differences between our list and previously published IS lists. Oliveira and Samsonov (2018) have reviewed ISs and their characteristics (e.g., orientation, shock speed). Studies of ISs often investigate the importance of orientation as frontal impacts tend to be more geoeffective than those with a high inclination (Takeuchi et al., 2002; Oliveira et al., 2015; Oliveira and Raeder, 2015; Selvakumaran et al., 2016). The angle between the shock normal and Sun-Earth line can be determined as
where nx is the component along the Sun-Earth line of the shock normal. Here
Figure 7 underlines that the majority of events in our list are not IS and thus comparisons to IS studies should be done with caution. We do not attempt to distinguish between events that are IS and events that are not, although a comparison of the effectiveness between shocks and non-shocks would be interesting.
4.2 Superposed Epoch Analysis
Our motivation for creating the event list is to provide the necessary data for a statistical analysis of the geospace response to rapid increases in Pd. In the following we showcase how the event list can be used in a superposed epoch analysis of the response for different angles of IMF clock angle and dipole tilt. Dipole tilt, θd, will also be referred to as season and is positive when the dipole axis points towards the Sun in the northern hemisphere.
4.2.1 Event Groups
The effect of θc and θd can be studied by separating the event list into groups. From Figure 6B it is evident that the IMF is more prone to be oriented east/west than north/south and we therefore use slightly uneven angular ranges to achieve an approximately equal amount of events in each group. Additionally, the clock angle can change drastically from before (θc,b) to after (θc,a) onset. This can make the interpretation of the effect of the rapid pressure increase difficult as it has to be separated from the effect of changing IMF orientation. For this reason we impose constraints on either side of the onset.
All 3,867 events can be represented in a 3D space, Q, spanned by θd, θc,b and θc,a. The following criteria were imposed to group the events by dipole tilt and IMF orientation:

TABLE 1. Summary of the amount of event in each group after imposing the criteria in Eq. 4.
The clock angle distributions of these 2058 events are shown in Figure 8. Here the grey and colored bars illustrate the distributions prior to and after onset, respectively, and each grey circle signifies 10 events. Comparing the occurrence rate of BY ± events show a higher rate of BY + events during summer than during winter.
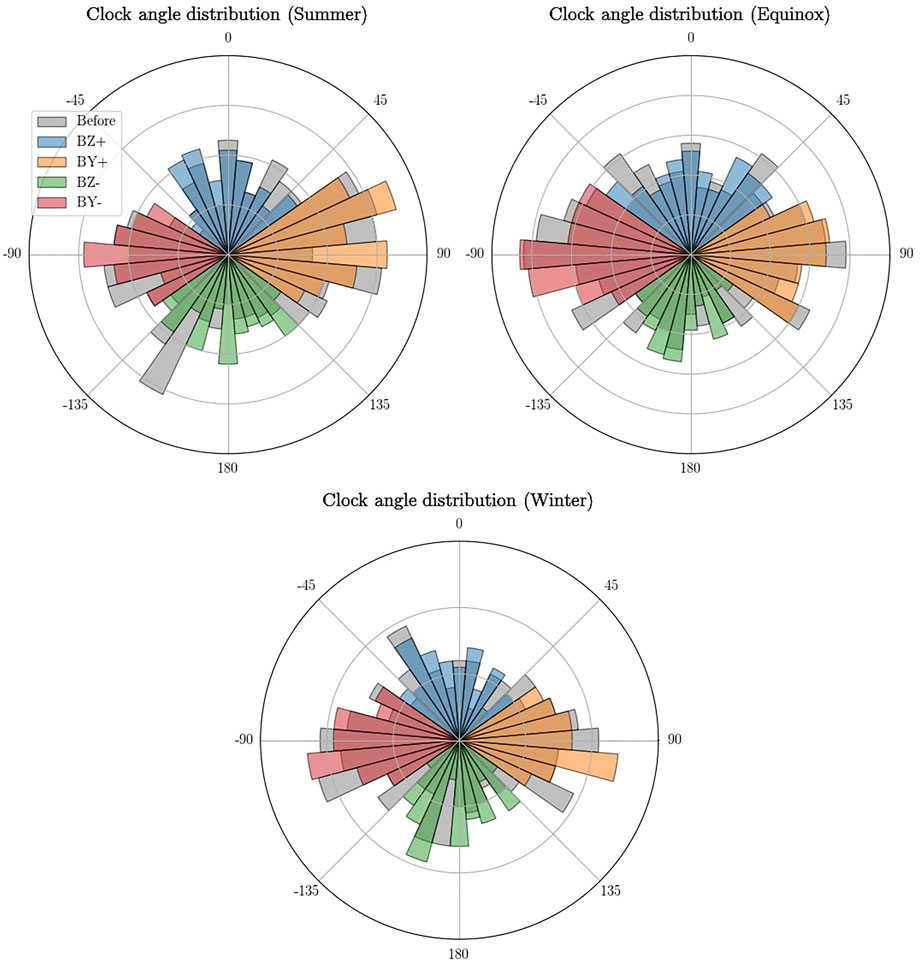
FIGURE 8. Polar histograms of the IMF clock angle distribution in each of the 12 groups. The grey bars indicate the distribution before the increase in Pd while the colored bars indicate the distribution after. Each circle represents 10 events.
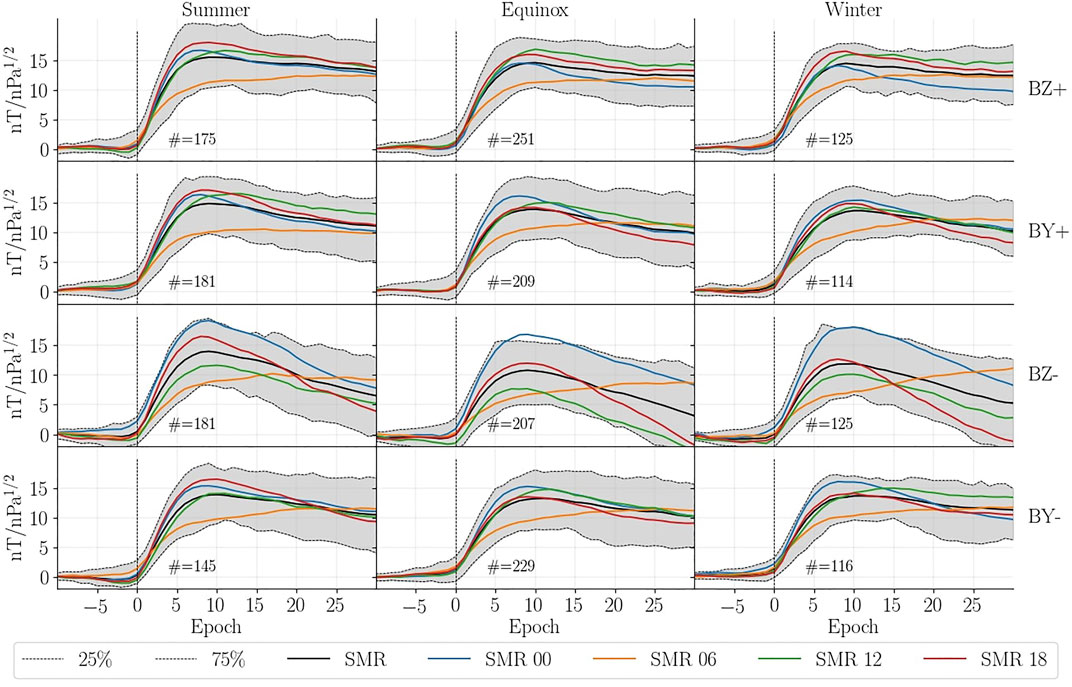
FIGURE 9. Superposed epoch analysis of the low/mid latitude response to rapid increases in Pd using the SMR index. The solid lines indicate the mean of SMR and its local time components. The dashed grey lines indicate the 25 and 75% percentile. The SMR time series for each event has been scaled with respect to the increase in
4.2.2 Low Latitude Geomagnetic Response
The general expectation of the low/mid latitude geomagnetic response to a rapid increase in Pd is a positive step-like perturbation of the horizontal magnetic field. To the first order this can be thought of as uniform and caused by compression of the magnetosphere. Magnetic indices such as SYM-H describe this well. However, the response is a superposition of multiple magnetospheric sources where the primary contributors are the magnetopause and ring current. The ring current is known to be asymmetric (Walsh et al., 2014; Ganushkina et al., 2015; Lühr et al., 2017) and responds near instantaneously to rapid increases in Pd (Shi et al., 2005). It is therefore no surprise that the low latitude magnetic perturbation would be local time dependent.
Using numerous magnetometer stations between ±50° latitude (Newell and Gjerloev, 2012) produced a local time ring current index called SMR that is provided for midnight, dawn, noon and dusk. Figure 9 summarizes the results of a superposed epoch analysis of SMR with respect to the groups defined in Section 4.2.1. The results are generated by scaling the SMR time series for each event by
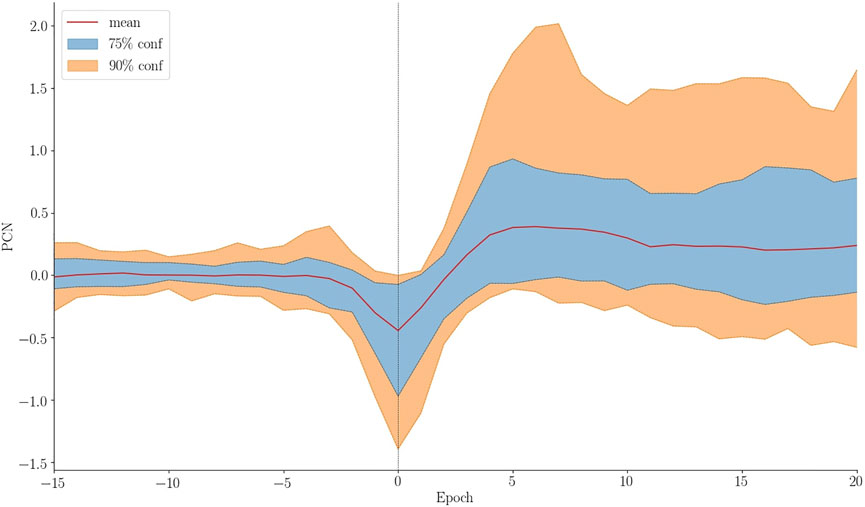
FIGURE 10. Superposed epoch analysis of the high latitude response to rapid increases in Pd during Northward IMF and negative dipole tilt using the PCN index. The analysis is based on 90 events each of which were aligned with respect to the peak of the PI and shifted to a common baseline to improve comparison. The red line shows the mean and the blue and orange shade indicates the 75 and 90% confidence interval.
4.2.2.1 Dawn-Dusk Asymmetries
It is clear that the response depends on local time. The initial peak at dawn is consistently lower than in any other sector. Two of the main contributors to ring current indices are the magnetopause and ring current (Haaland and Gjerloev, 2013) and according to Araki (1977) the main contribution to DL is the magnetopause current. The magnetopause current generates a positive perturbation while the ring current generates a negative. Assuming the magnetopause current’s contribution to be symmetric with respect to local time, the asymmetry originates from the ring current. Under this assumption the dawnside ring current must generate a stronger magnetic perturbation compared to any other sector.
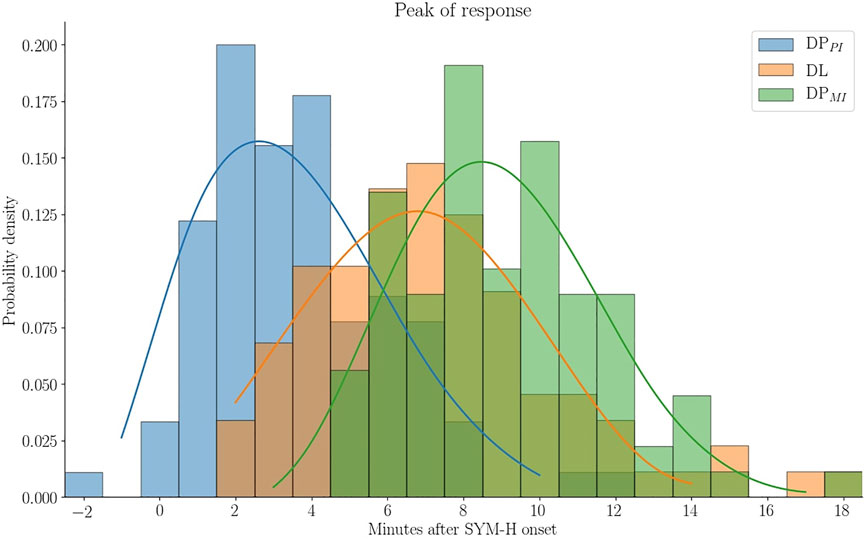
FIGURE 11. Distribution of when the peak in DL (low latitude), DPPI (high latitude preliminary impulse) and DPMI (high latitude main impulse) occur relative to onset in SYM-H (epoch 0) for northward IMF during negative dipole tilt. Cubic splines are fitted and superposed to help distinguish the distributions in areas of overlap.
Several studies report that the ring current is strongest at dusk (Newell and Gjerloev, 2012; Walsh et al., 2014; Ganushkina et al., 2015; Lühr et al., 2017). Studies on ring current asymmetry tend to investigate the effect during the main/recovery phase of geomagnetic storms. In that scenario the asymmetric ring current is caused by an intensification of the partial ring current. However what we are interested in is the initial response, the sudden commencement, which occurs before the main phase of the geomagnetic storm and evolves on a timescale of minutes while the storm evolves on a timescale of hours and days.
Ring current asymmetry is highly dependent on the geomagnetic disturbance level (Le et al., 2004). The majority of events used in this study (81%) experience SYM-H above −30 nT before onset, which is considered quiet. It is therefore interesting that Zhang et al. (2011) found higher current density on the dawn side when investigating the local time distribution of the ring current using Cluster.
Following the argumentation presented by Shi et al. (2005) an azimuthal electric field is induced (Faraday’s law) as a result of magnetospheric compression when the solar wind pressure enhancement impinges on the magnetosphere. This causes a near instantaneous adiabatic energization of ring current particles. Under the assumption that the ring current is strongest at dawn during geomagnetic quiet times, a rapid increase in Pd results in a larger negative perturbation at dawn and therefore accounts for the consistently weaker response observed in Figure 9. However, one must keep in mind that there are other sources of perturbation. A more thorough analysis that includes contributions from field aligned currents has to be made.
4.2.2.2 Decay
The trend following the initial step-like increase exhibits different behavior with respect to local time and clock angle. In all scenarios the trend at dawn is slightly positive or constant while the opposite is true for all local time sectors. During northward IMF all local time sectors appear to converge towards symmetry. However, during southward IMF the decay at noon/dusk/midnight is much more rapid resulting in the perturbation to reduce below the baseline prior to onset. This is in agreement with the higher probability of geomagnetic storms occurring during southward IMF. The ring current asymmetry remains strong, but has changed from being dominating at dawn to dominating at dusk.
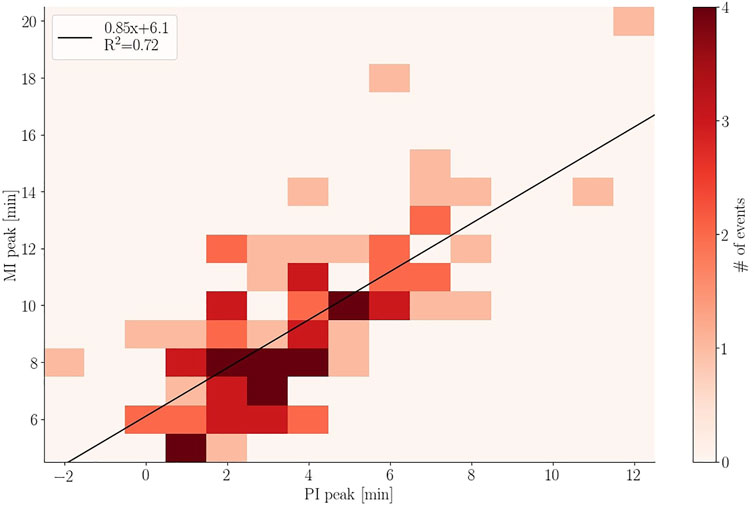
FIGURE 12. Regression analysis of the DPPI and DPMI distribution in Figure 11.
4.2.2.3 Noon-Midnight Differences
We see a noon-midnight asymmetry during southward IMF as the response in SMR-00 tends to be stronger than SMR-12 (and the other sectors). A similar result was found in case studies by Lee and Lyons (2004). They observed dipolarization of the geomagnetic field at geosynchronous orbit consistent with a reduction of the cross-tail current which will result in a positive perturbation of the horizontal magnetic field. This effect was not found for events during northward IMF. It is likely a result of acceleration of already Earthward moving plasma in the tail as part of the Dungey cycle. Boudouridis et al. (2004) found that compression of the magnetosphere enhances reconnection in the tail and increases magnetospheric convection.
4.2.3 High Latitude Response
The high latitude transient response following a rapid increase in Pd, earlier mentioned as DP, is caused by two sets of anti-sunward moving convection vortices, referred to as PI and MI (Araki, 1994). In previous studies a connection between PI/MI and the PC index were made (Lukianova, 2003; Huang, 2005; Stauning and Troshichev, 2008). PC indicates the antisunward convection in the polar cap by trying to quantify transpolar currents. All studies found that the PI and MI resulted in a negative and positive excursion of the PC index, respectively. Huang (2005) also found the magnitude of variation in PC caused by changes in IMF and substorms to be much greater than that of the pressure enhancement. For this reason we limit ourselves to the group for northward IMF during winter, which is when the background convection is weakest. We manually determine the peak of PI and MI by inspecting the PCN time series for each event. Events with noisy time series or that were otherwise difficult to interpret were discarded, leaving 90 events.
Figure 10 is a superposed epoch analysis of the PCN when realigning the time series with the PI peak. For better comparison a baseline value prior to epoch 0 has been removed. We find that the average PI amplitude is 0.44 mV/m. If alignment is done with the MI peak its average is found to be 0.50 mV/m. This is lower than results from Huang (2005), but in agreement with results by Stauning and Troshichev (2008). The average value of the MI peak cannot be read directly from Figure 10 as the PI alignment does not ensure alignment of MI.
Figure 11 shows the time of the peak of each response relative to the onset in SYM-H. The superposed lines are spline fits to help visualize the overlapping distributions. We find that the PI peaks around 2–3 min after onset while the low latitude response takes 6–7 min and the MI peak occur around 8–10 min after onset.
A regression analysis is performed between each of the distributions in Figure 11. The analysis between PI and MI, Figure 12, shows a strong relationship (R2 = 0.72) between when the two responses peak. From the intercept we see that the average time between the PI and MI peak is ∼6 min. The analysis between DL and PI/MI indicates a low level of correlation between low and high latitude response with R2 = 0.29 and 0.32.
5 Discussion
Event detection is highly relevant in space weather research. Certain events (e.g., coronal mass ejection, solar flare, stream interaction region etc.) can have a large impact on satellites and the electrical infrastructure on ground. Event detection and forecasting is the first step in handling a potential problem such that precautionary measures can be taken. Machine learning is used frequently as a means to find connections not immediately obvious as well as to remove human bias. A review of its role in space weather was given by Camporeale (2019).
The event detection approach used in this paper was designed to be as objective as possible. Nevertheless, we used a supervised algorithm meaning it is “taught” what is and is not an event. These definitions are based on the training data which is to some extent subjective. One could take an unsupervised approach in which the training data does not include a list of the varies classes and the algorithm will have to define them itself. However, this is far more complex: More data would be required as the algorithm needs to discover classes autonomously. Including variables other than Pd would introduce more difficulty as rapid pressure increases might be split into multiple sub-classes. Borovsky et al. (2019) used the unsupervised algorithm self organizing maps to analyze 10 years of ACE data leading to four classes of solar wind instead of the general two; slow and fast solar wind. One of these classes was ejecta which is related to coronal mass ejections and thereby rapid Pd increases. In the future the majority of classification might be done in a similar fashion, but for the task at hand it is a much too complex tool and the supervised approach seems to be a fair middle ground.
The non-event class contain everything that are not pressure increases. It is therefore likely that the 1700 entries do not account for all scenarios the algorithm will encounter and the outcome will therefore be unpredictable. This is one of the drawbacks when having to create training data. We tried to combat this potential problem by only accepting classifications of type event if 90% of the decision trees agreed.
Features in the training data were selected based on a comparison of numerous potential features and boiled down to the five presented here. The optimal features should be robust such that they do not depend heavily on single data-points or one risks discarding events unnecessarily. Our first feature, the slope, depends on 3 data-points and carries a lot of weight. An alternative to this could be to fit a logistic function as done by Boudouridis and Zesta (2021). The slope could be extracted from the fit and would therefore depend on a larger range of data and making it more robust when facing missing data.
The correlation analysis is a crucial part of creating the list of events as it ensures a measurable response on ground. However, when comparing two (or more) events it is important that they are aligned correctly in time; otherwise the statistics extracted when superposing multiple events will exhibit higher variance than necessary. The question is, what is the reference point that should be used for alignment? The rise time of the SYM-H response is around 2–10 min (Takeuchi et al., 2002). The exact number depends on the solar wind velocity since it dictates how much time is required for the discontinuity to pass Earth relative to the time of impact. The orientation of the discontinuity is another large factor in the variation of rise time. One extreme case with a 30 min rise time is analyzed in Takeuchi et al. (2002). We decided on using the onset of the SYM-H response as reference. Unfortunately, the precision of the correlation analysis also suffers from the variation in SYM-H rise times.
In the initial step of the superposed epoch analysis 12, groups were created based on dipole tilt and IMF clock angle, see Section 4.2.1. Unsurprisingly, there are more events around equinox than summer/winter as the dipole tilt range is larger. It is however curious that the occurrence rate is larger during summer compared to winter. The average ratio between summer and winter is ∼1.4.
The reason for this asymmetry is still not clear, but we have ruled out two possible mechanisms: 1) Huang and Yumoto (2006) studied hemispheric asymmetry during rapid Pd increases and found a significant variation between hemispheres when comparing magnetic perturbation at low latitudes. They concluded that the perturbation is stronger in the summer hemisphere than in the winter hemisphere. Coincidentally, SYM-H is based on six stations where the majority are located in the northern hemisphere. However, the higher occurrence rate during positive dipole tilt is present prior to the correlation analysis. It is also present when evaluating ACE and Wind data separately. When evaluating the individual years the ratio between summer and winter sometimes go below 1, but on average is ∼1.3. We therefore find it unlikely that it is caused by data gaps. 2) Due to the eccentricity of Earth’s orbit there will be a few percent more data with positive dipole tilt. Calculating the occurrence probability by normalizing the occurrence rate with the amount of data available does change the seasonal difference slightly, but not enough to be eliminated. One might suspect that it is related to solar cycles, but it is present when evaluating data from solar cycle 23 and 24 individually. We suspected it might be related to heliographic latitude. When repeating the analysis using latitude (heliographic inertial coordinates) we found a smaller difference between seasons. It was no surprise as the min/max in the latitude of Earth’s orbit does not overlap with the extremes in dipole tilt (summer/winter). The cause of this seasonal difference is still not clear, but we are satisfied that it is unrelated to the method with which the events were detected and propagated to Earth.
In the superposed epoch analysis we observed a dawn-dusk asymmetry in the low latitude response. Contrary to our expectation the weakest positive perturbation was observed at dawn. Under the assumption of a uniform positive perturbation from the magnetopause current the asymmetry was caused by currents in the inner magnetosphere. Plasma in the ring current is energized instantaneously by magnetospheric compression (Shi et al., 2005). In this scenario the dawn-dusk asymmetry could be caused by a pre-existing asymmetry in the ring current plasma population. Using Cluster measurement between 4–4.5 Earth radii, Zhang et al. (2011) found significantly stronger current densities on the dawn side during quiet conditions (Dst
6 Conclusion
Rapid increases in solar wind dynamic pressure result in the transient magnetospheric-ionosperic phenomena called sudden commencement, which is sometimes followed by a geomagnetic storm. In this study we develop a new method for automatic detection of these events in solar wind data. The events are propagated to Earth and paired with a corresponding response in ground magnetometers. We also use the list to conduct a superposed epoch analysis of the geomagnetic response to solar wind pressure increases. The main results are:
1. A list of 3,867 rapid pressure increases detected by ACE and Wind, between 1994–2019, including estimates of their arrival at Earth. The event list can be accessed at doi. org/10.5281/zenodo.6243103.
2. There is a clear dawn-dusk asymmetry in SMR following a compression of the magnetosphere for all seasons and IMF orientations. We suggest that an asymmetric ring current (stronger at dawn) results in weaker positive magnetic perturbation at dawn. This asymmetry is very short lived. Little asymmetry is observed after 30 min during northward IMF. During southward IMF the asymmetry changes from dawn to dusk within 30 min of the initial response in SYM-H.
3. A noon-midnight asymmetry is observed in the low latitude response for southward IMF. We believe it to be caused by dipolarization of the geomagnetic field as observed at geosynchonous orbit by Lee and Lyons (2004).
4. The geomagnetic response does not appear to have any significant dependence on IMF BY and dipole tilt and thus the main dependency is on IMF BZ.
5. The superposed epoch analysis of the PCN index for northward IMF during winter shows the average preliminary impulse (PI) causes a negative excursion of 0.44 mV/m from the baseline while the average main impulse (MI) causes a positive excursion of 0.50 mV/m from the baseline. The rise time of the low latitude response is approximately 7 min while the average PI (MI) peak occurs around 2 (8) min after the onset at low latitude. A regression analysis of the PI and MI response showed that their rise times are highly correlated, and that they differ by on average 6 min. A very low correlation between the low latitude response and PI/MI was found.
The purpose of creating this list was to provide the information for a statistical analysis. In the future we intend to conduct a more thorough analysis of the response by utilizing spherical harmonic modelling of the ground magnetic field perturbations. This would greatly increase the information extracted from the high latitude response compared to the PCN index analysis presented in this paper.
Data Availability Statement
The datasets presented in this study can be found in online repositories. The names of the repository/repositories and accession number(s) can be found in the article/Supplementary Material.
Author Contributions
MM is the primary author and developed the event detection algorithm and carried out the superposed epoch analysis. KML and JPR helped set up the overall structure of the manuscript. All co-authors contributed to the discussions and provided editorial comment thus contributing to the article and approved the submitted version.
Funding
This work was funded by the Research Council of Norway (RCN) under contract 300844/F50. KML and JPR were also funded by the RCN under contract 223252/F50. KML and SMH were also funded by the Trond Mohn Foundation.
Conflict of Interest
The authors declare that the research was conducted in the absence of any commercial or financial relationships that could be construed as a potential conflict of interest.
Publisher’s Note
All claims expressed in this article are solely those of the authors and do not necessarily represent those of their affiliated organizations or those of the publisher, the editors, and the reviewers. Any product that may be evaluated in this article, or claim that may be made by its manufacturer, is not guaranteed or endorsed by the publisher.
Supplementary Material
The Supplementary Material for this article can be found online at: https://www.frontiersin.org/articles/10.3389/fspas.2022.904620/full#supplementary-material
References
Araki, T. (1994). A Physical Model of the Geomagnetic Sudden Commencement. Geophys. Monogr. Ser. 81, 183–200. doi:10.1029/GM081p0183
Araki, T. (1977). Global Structure of Geomagnetic Sudden Commencements. Planet. Space Sci. 25, 373–384. doi:10.1016/0032-0633(77)90053-8
Borovsky, J. E., Denton, M. H., and Smith, C. W. (2019). Some properties of the solar wind turbulence at 1 au statistically examined in the different types of solar wind plasma. J. Geophys. Res. Space Phys. 124, 2406–2424. doi:10.1029/2019JA026580
Boudouridis, A., and Zesta, E. (2021). Automated Technique for the Detection of Step-like Solar Wind Dynamic Pressure Changes: Application to the Response of the Transpolar Potential to Solar Wind Dynamic Pressure Fronts. J. Geophys. Res. Space Phys. 126, e2021JA029198. doi:10.1029/2021JA029198
Boudouridis, A., Zesta, E., Lyons, L. R., Anderson, P. C., and Lummerzheim, D. (2004). Magnetospheric Reconnection Driven by Solar Wind Pressure Fronts. Ann. Geophys. 22, 1367–1378. doi:10.5194/angeo-22-1367-2004
Burton, R. K., McPherron, R. L., and Russell, C. T. (1975). An Empirical Relationship between Interplanetary Conditions andDst. J. Geophys. Res. 80, 4204–4214. doi:10.1029/JA080i031p04204
Camporeale, E. (2019). The challenge of Machine Learning in Space Weather: Nowcasting and Forecasting. Space Weather 17, 1166–1207. doi:10.1029/2018SW002061
Curto, J. J., Araki, T., and Alberca, L. F. (2007). Evolution of the Concept of Sudden Storm Commencements and Their Operative Identification. Earth Planet. Sp 59, i–xii. doi:10.1186/BF03352059
Dalin, P. A., Zastenker, G. N., Paularena, K. I., and Richardson, J. D. (2002a). A Survey of Large, Rapid Solar Wind Dynamic Pressure Changes Observed by Interball-1 and Imp 8. Ann. Geophys. 20, 293–299. doi:10.5194/angeo-20-293-2002
Dalin, P. A., Zastenker, G. N., and Richardson, J. D. (2002b). Orientation of Middle-Scale Structures in the Solar Wind Plasma. Cosmic Res. 40, 319–323. doi:10.1023/a:1019838226629
Friis-Christensen, E., McHenry, M. A., Clauer, C. R., and Vennerstrøm, S. (1988). Ionospheric Traveling Convection Vortices Observed Near the Polar Cleft: A Triggered Response to Sudden Changes in the Solar Wind. Geophys. Res. Lett. 15, 253–256. doi:10.1029/GL015i003p00253
Ganushkina, N. Y., Liemohn, M. W., Dubyagin, S., Daglis, I. A., Dandouras, I., De Zeeuw, D. L., et al. (2015). Defining and Resolving Current Systems in Geospace. Ann. Geophys. 33, 1369–1402. doi:10.5194/angeo-33-1369-2015
Haaland, S., and Gjerloev, J. (2013). On the Relation between Asymmetries in the Ring Current and Magnetopause Current. J. Geophys. Res. Space Phys. 118, 7593–7604. doi:10.1002/2013JA019345
Hapgood, M. A. (1992). Space Physics Coordinate Transformations: A User Guide. Planet. Space Sci. 40, 711–717. doi:10.1016/0032-0633(92)90012-D
Huang, C.-S. (2005). Variations of Polar Cap index in Response to Solar Wind Changes and Magnetospheric Substorms. J. Geophys. Res. 110, 10616. doi:10.1029/2004JA010616
Huang, C.-S., and Yumoto, K. (2006). Quantification and Hemispheric Asymmetry of Low-Latitude Geomagnetic Disturbances Caused by Solar Wind Pressure Enhancements. J. Geophys. Res. 111, 11831. doi:10.1029/2006JA011831
Iyemori, T., Takeda, M., Nose, M., and Toh, H. (2010). “Mid-latitude Geomagnetic Indices Asy and Sym for 2009 (Provisional),” in Internal Report of Data Analysis Center for Geomagnetism and Space Magnetism (Japan: Kyoto University).
Jian, L., Russell, C. T., Luhmann, J. G., and Skoug, R. M. (2006). Properties of Stream Interactions at One AU during 1995 - 2004. Sol. Phys. 239, 337–392. doi:10.1007/s11207-006-0132-3
Khabarova, O., Malandraki, O., Malova, H., Kislov, R., Greco, A., Bruno, R., et al. (2021). Current Sheets, Plasmoids and Flux Ropes in the Heliosphere. Space Sci. Rev. 217. doi:10.1007/s11214-021-00814-x
Khabarova, O., and Zastenker, G. (2011). Sharp Changes of Solar Wind Ion Flux and Density within and outside Current Sheets. Sol. Phys. 270, 311–329. doi:10.1007/s11207-011-9719-4
Kikuchi, T., Tsunomura, S., Hashimoto, K., and Nozaki, K. (2001). Field-aligned Current Effects on Midlatitude Geomagnetic Sudden Commencements. J. Geophys. Res. 106, 15555–15565. doi:10.1029/2001JA900030
Kuhn, M., and Johnson, K. (2013). Remedies for Severe Class Imbalance. Appl. Predictive Model. 2013, 419–443. doi:10.1007/978-1-4614-6849-3_16
Le, G., Russell, C. T., and Takahashi, K. (2004). Morphology of the Ring Current Derived from Magnetic Field Observations. Ann. Geophys. 22, 1267–1295. doi:10.5194/angeo-22-1267-2004
Lee, D.-Y., and Lyons, L. R. (2004). Geosynchronous Magnetic Field Response to Solar Wind Dynamic Pressure Pulse. J. Geophys. Res. 109, 10076. doi:10.1029/2003JA010076
Lepping, R. P., Acũna, M. H., Burlaga, L. F., Farrell, W. M., Slavin, J. A., Schatten, K. H., et al. (1995). The Wind Magnetic Field Investigation. Space Sci. Rev. 71, 207–229. doi:10.1007/BF00751330
Lühr, H., Xiong, C., Olsen, N., and Le, G. (2017). Near-earth Magnetic Field Effects of Large-Scale Magnetospheric Currents. Space Sci. Rev. 206, 521–545. doi:10.1007/s11214-016-0267-y
Lukianova, R. (2003). Magnetospheric Response to Sudden Changes in Solar Wind Dynamic Pressure Inferred from Polar Cap index. J. Geophys. Res. 108. doi:10.1029/2002JA009790
Mailyan, B., Munteanu, C., and Haaland, S. (2008). What Is the Best Method to Calculate the Solar Wind Propagation Delay? Ann. Geophys. 26, 2383–2394. doi:10.5194/angeo-26-2383-2008
McComas, D. J., Bame, S. J., Barker, P., Feldman, W. C., Phillips, J. L., Riley, P., et al. (1998). Solar Wind Electron Proton Alpha Monitor (Swepam) for the Advanced Composition Explorer. Space Sci. Rev. 86, 563–612. doi:10.1007/978-94-011-4762-0_20
Newell, P. T., and Gjerloev, J. W. (2012). Supermag-based Partial Ring Current Indices. J. Geophys. Res. 117, a–n. doi:10.1029/2012JA017586
Ogilvie, K. W., Chornay, D. J., Fritzenreiter, R. J., Hunsaker, F., Keller, J., Lobell, J., et al. (1995). Swe, a Comprehensive Plasma Instrument for the Wind Spacecraft. Space Sci. Rev. 71, 55–77. doi:10.1007/BF00751326
Oliveira, D. M., and Raeder, J. (2015). Impact Angle Control of Interplanetary Shock Geoeffectiveness: A Statistical Study. J. Geophys. Res. Space Phys. 120, 4313–4323. doi:10.1002/2015JA021147
Oliveira, D. M., Raeder, J., Tsurutani, B. T., and Gjerloev, J. W. (2015). Effects of Interplanetary Shock Inclinations on Nightside Auroral Power Intensity. Braz. J. Phys. 46, 97–104. doi:10.1007/s13538-015-0389-9
Oliveira, D. M., and Samsonov, A. A. (2018). Geoeffectiveness of Interplanetary Shocks Controlled by Impact Angles: A Review. Adv. Space Res. 61, 1–44. doi:10.1016/j.asr.2017.10.006
Riazantseva, M. O., Dalin, P. A., Zastenker, G. N., and Richardson, J. (2003). Orientation of Sharp Fronts of the Solar Wind Plasma. Cosmic Res. 41, 382–391. doi:10.1023/a:1025061711391
Richardson, I. G., and Cane, H. V. (1995). Regions of Abnormally Low Proton Temperature in the Solar Wind (1965-1991) and Their Association with Ejecta. J. Geophys. Res. 100, 23397–23412. doi:10.1029/95JA02684
Richardson, J. D., and Paularena, K. I. (1998). The Orientation of Plasma Structure in the Solar Wind. Geophys. Res. Lett. 25, 2097–2100. doi:10.1029/98GL01520
Ridley, A. J. (2000). Estimations of the Uncertainty in Timing the Relationship between Magnetospheric and Solar Wind Processes. J. Atmos. Solar-Terrestrial Phys. 62, 757–771. doi:10.1016/S1364-6826(00)00057-2
Russell, C. T., Ginskey, M., and Petrinec, S. M. (1994b). Sudden Impulses at Low Latitude Stations: Steady State Response for Southward Interplanetary Magnetic Field. J. Geophys. Res. 99, 13403–13408. doi:10.1029/94JA00549
Russell, C. T., Ginskey, M., and Petrinec, S. M. (1994a). Sudden Impulses at Low-Latitude Stations: Steady State Response for Northward Interplanetary Magnetic Field. J. Geophys. Res. 99, 253–261. doi:10.1029/93JA02288
Russell, C. T., and Ginskey, M. (1995). Sudden Impulses at Subauroral Latitudes: Response for Northward Interplanetary Magnetic Field. J. Geophys. Res. 100, 23695–23702. doi:10.1029/95JA02495
Selvakumaran, R., Veenadhari, B., Ebihara, Y., Kumar, S., and Prasad, D. S. V. V. D. (2017). The role of interplanetary shock orientation on sc/si rise time and geoeffectiveness. Adv. Space Res. 59, 1425–1434. doi:10.1016/j.asr.2016.12.010
Shi, Y., Zesta, E., Lyons, L. R., Boudouridis, A., Yumoto, K., and Kitamura, K. (2005). Effect of Solar Wind Pressure Enhancements on Storm Time Ring Current Asymmetry. J. Geophys. Res. 110, 11019. doi:10.1029/2005JA011019
Smith, C. W., L'Heureux, J., Ness, N. F., Acuña, M. H., Burlaga, L. F., and Scheifele, J. (1998). The Ace Magnetic fields experiment. Space Sci. Rev. 86, 613–632. doi:10.1023/A:1005092216668
Smith, E. J., and Wolfe, J. H. (1976). Observations of interaction regions and corotating shocks between one and five au: Pioneers 10 and 11. Geophys. Res. Lett. 3, 137–140. doi:10.1029/GL003i003p00137
Stauning, P., and Troshichev, O. A. (2008). Polar Cap Convection and Pc index during Sudden Changes in Solar Wind Dynamic Pressure. J. Geophys. Res. 113, a–n. doi:10.1029/2007JA012783
Takeuchi, T., Russell, C. T., and Araki, T. (2002). Effect of the Orientation of Interplanetary Shock on the Geomagnetic Sudden Commencement. J. Geophys. Res. 107, 6–1. doi:10.1029/2002JA009597
Tin Kam Ho, T. H. (1995). Random Decision Forests. Proc. 3rd Int. Conf. Document Anal. Recognition 1, 278–282. doi:10.1109/ICDAR.1995.598994
Walsh, A. P., Haaland, S., Forsyth, C., Keesee, A. M., Kissinger, J., Li, K., et al. (2014). Dawn-dusk Asymmetries in the Coupled Solar Wind-Magnetosphere-Ionosphere System: a Review. Ann. Geophys. 32, 705–737. doi:10.5194/angeo-32-705-2014
Weimer, D. R., Ober, D. M., Maynard, N. C., Collier, M. R., McComas, D. J., Ness, N. F., et al. (2003). Predicting Interplanetary Magnetic Field (Imf) Propagation Delay Times Using the Minimum Variance Technique. J. Geophys. Res. 108. doi:10.1029/2002JA009405
[Dataset] Willer, A. N. (2021). The Polar Cap North (PCN) index (Definitive) [Data Set]. PCN index. doi:10.11581/DTU:00000057
Keywords: solar wind dynamic pressure, rapid pressure increase, magnetospheric compression, sudden commencement, machine learning, superposed epoch analysis, ring current asymmetry
Citation: Madelaire M, Laundal KM, Reistad JP, Hatch SM, Ohma A and Haaland S (2022) Geomagnetic Response to Rapid Increases in Solar Wind Dynamic Pressure: Event Detection and Large Scale Response. Front. Astron. Space Sci. 9:904620. doi: 10.3389/fspas.2022.904620
Received: 25 March 2022; Accepted: 08 April 2022;
Published: 05 May 2022.
Edited by:
Olga V. Khabarova, Institute of Terrestrial Magnetism Ionosphere and Radio Wave Propagation (RAS), RussiaReviewed by:
Zdenek Nemecek, Charles University, CzechiaVladimir Parkhomov, Baikal State University, Russia
Copyright © 2022 Madelaire, Laundal, Reistad, Hatch, Ohma and Haaland. This is an open-access article distributed under the terms of the Creative Commons Attribution License (CC BY). The use, distribution or reproduction in other forums is permitted, provided the original author(s) and the copyright owner(s) are credited and that the original publication in this journal is cited, in accordance with accepted academic practice. No use, distribution or reproduction is permitted which does not comply with these terms.
*Correspondence: Michael Madelaire, bWljaGFlbC5tYWRlbGFpcmVAdWliLm5v
 Michael Madelaire
 Karl M. Laundal
 Jone P. Reistad
 Spencer M. Hatch
 Anders Ohma
 Stein Haaland1,2