 Fusa Miyake1*
 Masataka Hakozaki2
 Katsuhiko Kimura3Fuyuki Tokanai4Toshio Nakamura1Mirei Takeyama4Toru Moriya4
- 1Institute for Space-Earth Environmental Research, Nagoya University, Nagoya, Japan
- 2National Museum of Japanese History, Sakura, Japan
- 3Faculty of Symbiotic Systems Science, Fukushima University, Fukushima, Japan
- 4Faculty of Science, Yamagata University, Yamagata, Japan
Cosmogenic nuclides such as 14C from tree rings and 10Be and 36Cl from ice cores are excellent proxies for the past extremely large solar energetic particle (SEP) events, which are dozens of times larger than the largest SEP event in the history of observation. So far, several rapid 14C increases have been discovered, which are considered to have originated from extreme SEP events (or set of successive SEP events) from verifications using multiple cosmogenic nuclide analyses in natural archives. Although these events are characterized by a rapid increase in cosmogenic nuclide concentrations, 14C data recorded worldwide do not always show similar variations, especially during the 993 CE event, where a rapid increase was recorded in either 992–993 CE or 993–994 CE in several records. We present new 14C data of the Japanese cedar sample for the 993 CE event. Although the latest data show no significant increase in 1 year, an overall increase pattern is consistent with the previously reported 14C data of the Japanese cedar, which supports that a significant 14C increase occurred from 993 to 994 CE in the Japanese sample. Given the dominant 14C production in high latitudes by SEPs, the difference in timing of increase may be a transport effect in the atmosphere. Moreover, the difference in the timing of the 14C increase can cause a 1-year age-determination error using the 993 CE radiocarbon spike. Compared with the 14C data between tree samples from high latitude and midlatitude, including Japan, high-latitude data can capture 14C changes originating from SEP events more quickly and clearly and may be more suitable for a SEP event exploration in the past.
Introduction
Solar flares and coronal mass ejections emit solar energetic particles (SEPs), which can be observed using artificial satellites near the Earth. Sometimes, abrupt increases in SEP flux are detected, which are known as SEP events. Large-scale SEP events can pose severe threats in the current space exploration era, for example, the destruction of artificial satellites, exposure to astronauts, and communication failures. The observational history of SEPs started in the 1940s using ground-based ionization chambers, which were later taken over by neutron monitors. Large-scale SEP events evoking significant enhancements of count rates of at least two neutron monitors on the ground (at least one of them should be near sea level) are known as ground-level enhancements (GLEs: the formal definition of GLEs can be found in the GLE database, https://gle.oulu.fi). After the 1970s, several artificial satellites have accumulated observational data for SEPs. These data of modern observations are insufficient to understand the long-term characteristics of SEPs (or SEP events), such as an occurrence rate of extreme SEP events and the upper limit of SEP events. As a proxy of extreme SEP events that especially occurred in the last few thousand years, cosmogenic nuclides in natural archive samples have been used (Miyake et al., 2019a).
Cosmogenic nuclides are many types of isotopes produced by high-energy particles (cosmic rays). SEPs are also contributing to the production of cosmogenic nuclides (e.g., Webber et al., 2007; Miyake et al., 2019a). Typical cosmogenic nuclides with a long half-life are 14C (half-life: 5,730 years), 10Be (∼1.4 × 10⁶ years), and 36Cl (∼3 × 10⁵ years). A part of these cosmogenic nuclides produced in the atmosphere is stored in natural archive samples, such as tree rings (14C) and ice cores (10Be and 36Cl). Because these archive samples enable a high-temporal-resolution analysis with 1 year or less, it is excellent for capturing past SEP events that occur on a short time scale of a few days.
So far, several candidates of SEP-driven 14C spikes have been reported: 774 CE, 993 CE, ∼660 BCE, 7176 BCE, 1052 CE, 1279 CE, 5259 BCE, and 5411 BCE (Miyake et al., 2012, 2013, 2021; Park et al., 2017; Sakurai et al., 2020; Brehm et al., 2021; Brehm et al., 2022; Miyahara et al., 2022). The first four events have also been detected in 10Be and 36Cl data in ice cores, and the consistency of the origin of large-scale SEP events (Mekhaldi et al., 2015; Miyake et al., 2015, Miyake et al., 2019b; O’Hare et al., 2019; Paleari et al., 2022), whose scale has been estimated to be 30–100 times larger than the largest GLE (Usoskin and Kovaltsov 2021), has been confirmed. Compared with the 774 CE event, recently reported events such in 1052 CE, 1279 CE, and 5411 BCE are less than half (Brehm et al., 2021; Miyake et al., 2021; Miyahara et al., 2022) and attract attention as a part of the possible events that fill the significant gap between the SEP events (GLE) found in modern observations and the 774 CE events (Usoskin and Kovaltsov 2021).
The SEP-driven 14C changes are detected as large 14C increases in 1 year, allowing isolation from 14C variability due to other factors. On the other hand, data from tree samples sometimes show different variabilities across the globe (Büngten et al., 2018; Uusitalo et al., 2018), for example, the age of the 14C increases differs at the 993 CE event. The 993 CE event was first confirmed as a rapid 14C increase from 992 to 993 CE using a Japanese cedar sample (Miyake et al., 2013). The event was also evaluated using a Japanese cypress sample, and the rapid 14C change from 993 to 994 CE was confirmed (Miyake et al., 2014). By validating the age of the Japanese cedar sample used for the first finding of the 993 CE event, we found a misrecognition in ring-counting around 946 CE; accordingly, the age of the rapid 14C increase in the Japanese cedar sample was corrected from 993 to 994 CE (Miyake et al., 2013 corrected version, 2014). Subsequently, the event was verified via several independent measurements. Fogtmann-Schltz et al. (2017) measured a Danish oak with a resolution of earlywood–latewood-separated, and a clear 14C increase was confirmed from the earlywood of 994 CE to the latewood of 994 CE. From the measured results of the Danish oak and Japanese trees, the event could have occurred between the growing season of earlywood and latewood in 994 CE. In addition, Büntgen et al. (2018) collected 10 more datasets from both hemispheres and observed significant 14C increases from 992 to 993 CE in some series. These 14C variations cannot be explained by the event that occurred in 994, and Büntgen et al. (2018) concluded that the event occurred in April ±2 months of 993 CE using the mean 14C series of northern and southern hemispheres. However, 14C data from other studies do not show a significant difference from 992 to 993 CE, despite increasing trends (Rakowski et al., 2018; Hakozaki et al., 2020). In addition, the Douglas-fir data series in Büntgen et al. (2018) also showed an increasing trend with no significant increase, and the series was not used to calculate the northern hemisphere mean due to the difference in variations.
Such differences observed in the 14C data reported so far have not been fully understood, hindering a consistent understanding of the event shown in 14C data and affecting a 14C spike-based dating (spike matching), which is rapidly advancing recently (Wacker et al., 2014; Oppenheimer et al., 2017; Hakozaki et al., 2018; Kuitems et al., 2021; Philippsen et al., 2021). In this study, we reinvestigated the Japanese cedar data around the 993 CE event by collecting new 14C data and discussed the observed differences.
Methods
Sample and Age Determination by Dendrochronology
We prepared a new piece of wood of the same individual as the one used in Miyake et al. (2012) and Miyake et al. (2013) (Figure 1 upper). The age of the Japanese cedar sample was confirmed using two independent dendrochronological methods to eliminate dating uncertainties. Particularly, the age of the sample was determined by 1) cross-dating of ring widths with a master chronology (ITRDB, https://www.ncdc.noaa.gov/paleo-search/study/15215) and 2) cross-dating of annual δ18O series with a master chronology (Nakatsuka et al., 2020; ITRDB, https://www.ncei.noaa.gov/access/paleo-search/study/28832). Recently, dendrochronology using oxygen isotopes has been rapidly advancing in Japan, and a master chronology of δ18O covering the 993 CE event has been established (Nakatsuka et al., 2020). For analyzing δ18O, a plate-shaped wood (∼1 mm thick) was prepared from the wood piece, and a series of celluloses were extracted via a chemical treatment (Kagawa et al., 2015). Each annual cellulose was wrapped in a silver foil, and the δ18O of the wood piece (256 rings) was measured using a mass spectrometer (TCEA/Delta V Advantage; ThermoFisher Scientific Bremen, Germany). The cross-dating was performed using PAST 5 software.
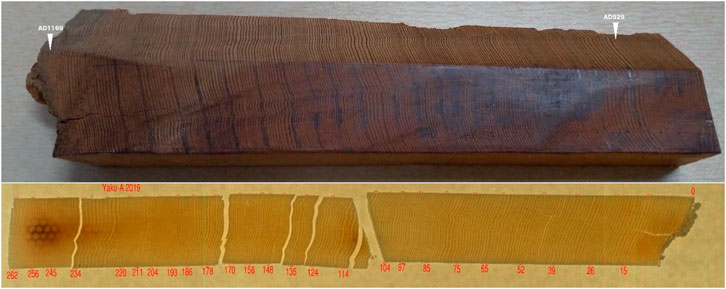
FIGURE 1. (upper) The Japanese cedar used for this study. (bottom) Plate-shaped cellulose was used for the δ18O analysis.
14C Measurement
Cellulose for 14C analysis was extracted as described in Miyake et al. (2015) using the conventional method, that is, each annual ring was separated using a cutter knife before the chemical treatment, and each separated ring was processed with acid–alkali–acid and sodium chlorite treatments to obtain celluloses. We measured 14C concentrations in annual celluloses from 983 to 998 CE at the AMS facility at Yamagata University (YU-AMS, Tokanai et al., 2013). The years for 992, 993, 994, and 995 CE were measured twice to check reproducibility.
Results
Cross-Dating of the Japanese Tree Sample
Previously, we obtained a good agreement in ring widths between the Japanese cedar sample and the master chronology of the Japanese cedar (tBP = 6.95 [Baillie–Pilcher t-value; Baillie and Pilcher, 1973]) (Miyake et al., 2014). In addition, the cross-dating using δ18O data showed a high correlation between the Japanese cedar sample and the master chronology (tBP = 6.17, Figure 2). As two different dating results show the same age, our sample age was highly reliable.
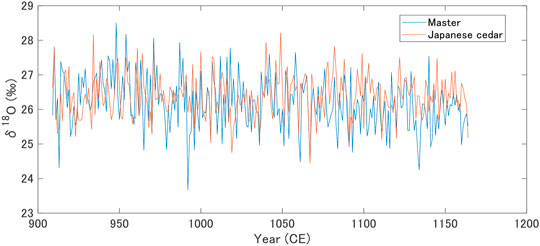
FIGURE 2. Oxygen isotope ratio (δ18O) of the master chronology (Nakatsuka et al., 2020; ITRDB, https://www.ncei.noaa.gov/access/paleo-search/study/28832) and Japanese cedar (this study, showed in cross-dated age).
14C Data of the Japanese Cedar
Figure 3A shows a measured result of 14C concentrations of the Japanese cedar sample. The duplicated data for 992–995 CE were reproduced within the errors. Figure 3B shows a comparison between the previous dataset (Miyake et al., 2013: 14C measurement was performed at the AMS in Nagoya University) and the new datasets of the Japanese cedar sample (for the duplicated data, weighted average considering the uncertainty of each data point was taken). Although the new data do not show an annual significant increase from 993 to 994 CE, the data, except for 990 CE, were reproduced well [not rejected at 95% confidence level by a chi-square test]. When the age of the rapid increase occurred in 992–993 CE, namely, the uncorrected version of the ring age reported in the first version of Miyake et al. (2013), the χ2 value–evaluated difference between the previous and new data series was 21.5 (dof = 13), which was worse than that of the increase that occurred in 993–994 CE with the corrected age (χ2 = 12.4, dof = 13). From this, the new dataset agrees well with the previous dataset whose age was corrected (i.e., when a significant increase occurred in 993–994 CE: Miyake et al., 2013; Miyake et al., 2014), and we confirmed the validity of the age correction in Miyake et al. (2013) and Miyake et al. (2014).
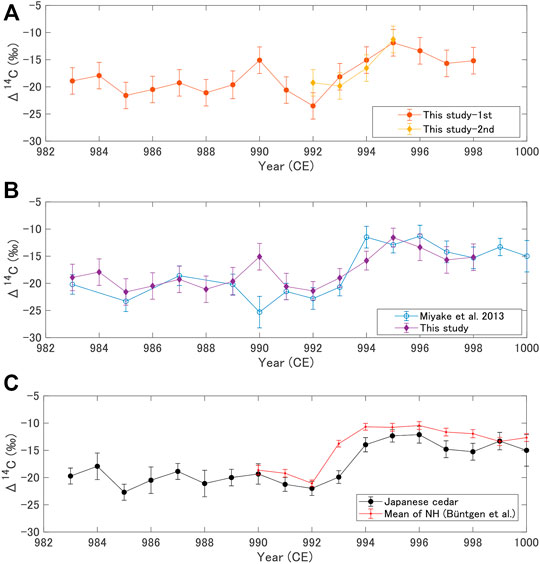
FIGURE 3. (A) The measured 14C data for this study. (B) Comparison with a previous result (open circles, Miyake et al., 2013) and this result (diamonds, weighted mean of Figure 3A). (C) Weighted mean of Japanese cedar datasets (black circles) and a mean of worldwide tree samples from the northern hemisphere (red dots, Büntgen et al., 2018).
We took a weighted average for the new and previous data (Figure 3C). In the weighted average series, a significant gap between 993 and 994 CE and no significant increase between 992 and 993 CE were observed. The increment from 993 to 994 CE was 5.9‰ (average of the data errors: ∼1.2‰).
Discussions
Comparison With Worldwide Datasets
Available datasets for the 993 CE event are listed in Table 1. Table 1 shows radiocarbon zones for each tree sample too. Radiocarbon zones were originally introduced to explain 14C differences during the bomb peak, and have been defined as four regions in the northern hemisphere, that is, NH0, NH1, NH2, and NH3 zones (Hua et al., 2013, 2021; Büntgen et al., 2018). Boundaries of the radiocarbon zones were defined as 60°N between NH0 and NH1 (Büntgen et al., 2018), Ferrel cell–Hadley cell boundaries (around 40°N) between NH1 and NH2, and the mean summer position of the ITCZ between NH2 and NH3 (Hua et al., 2013; Hua et al., 2021). Figures 4A–C shows the Δ14C series in Table 1 for radiocarbon zones NH0, NH1, and NH2. Previous studies have reported offset trends in 14C data due to differences in radiocarbon zones, that is, Δ14C differences of radiocarbon zones NH2–NH0 and NH1–NH0 were observed at ∼3‰ and ∼2‰, respectively, around 774 CE, 993 CE, and 5410 BCE (Büntgen et al., 2018; Miyake et al., 2021). Figure 4D shows a comparison of the average series of Table 1 between different radiocarbon zones. The difference between the mean values of each radiocarbon zones is 2.8 ± 0.4‰ (NH2–NH0) and 1.2 ± 0.3 ‰ (NH1–NH0), respectively (the errors were calculated via error propagation). These offsets agree with the previous results, and basically, it is considered to reflect the difference in the baseline for each radiocarbon zone as described in previous studies (Büntgen et al., 2018; Miyake et al., 2021). However, the differences in 993 CE between each zone are particularly large.
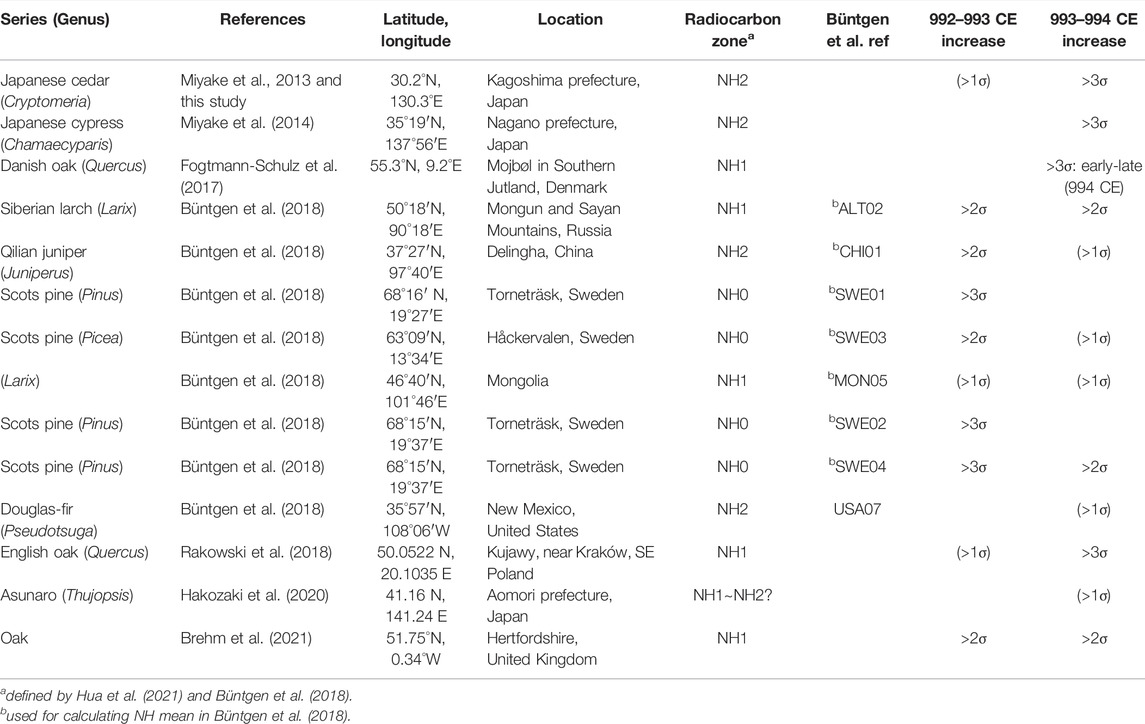
TABLE 1. Available 14C datasets for the 993 CE event (Northern Hemisphere). For columns, the 992–993 CE increase and 993–994 CE increase, σ indicates error propagation of Δ14C increase I (>1σ, >2σ, and >3σ denote 1σ < I ≤ 2σ, 2σ < I ≤ 3σ, and I > 3σ, respectively). The increases of more than 1σ (>1σ) are shown as a reference in the table, though we did not consider them as significant increases.
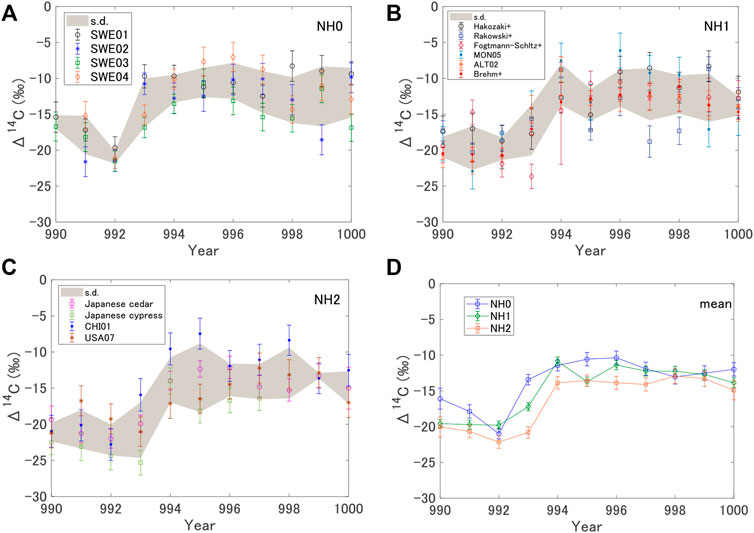
FIGURE 4. (A–C) Δ14C series and its standard deviations (s.d.) for NH0, NH1, and NH2 zones. Since the resolution of the 14C dataset of Fogtmann-Schltz et al. (2017) is earlywood–latewood-separated, averaged data are shown here (its error of age 994 CE is the standard deviation). (D) Weighted mean series of NH0, NH1, and NH2 zones.
These differences in 993 CE reflect the differences in the timing of increase, as mentioned in the introduction, that is, some series started to increase significantly from 993 to 994 CE including the Japanese cedar sample, or from 992 to 993 CE (Büntgen et al., 2018). Table 1 summarizes the ages when each series shows a significant increase in 992–993 CE and 993–994 CE. Focusing on the NH0 zone (four series) and NH2 zone (four series) in particular, the NH0 zone started to increase in 992–993 CE for all series (>2σ), whereas the NH2 zone started to increase in 993–994 CE in three series except the Qilian juniper (note that the Qilian juniper is a sample taken from 37°N and may be located near the NH1–NH2 boundary). The Japanese cedar series is consistent with the Douglas-fir series (USA07 in Figure 4C) which showed a different variation from the other series of Büntgen et al. (2018). The NH1 zone is not used to clarify the discussion because the NH1–NH2 boundaries may vary by longitude, that is, between 36°N and 42°N (Hua et al., 2013). Figure 5 shows a comparison of the average series of NH2 and NH0 zones (the Japanese cedar series is also shown for reference), where we assumed the baseline of each radiocarbon zone is the average of 990–992 CE and adjusted each average to zero on the vertical axis of Figure 5. In this comparison, the data series agree well within the error except for 993 CE. Such a precursor to the 14C increases at high latitude was also pointed out by Park et al. (2017) and Uusitalo et al. (2018) for the 774 CE event, that is, the Finnish Lapland and Yamal datasets from the NH0 zone show a significant increase from 773 to 774 CE, whereas lower latitudes data do not show the same.
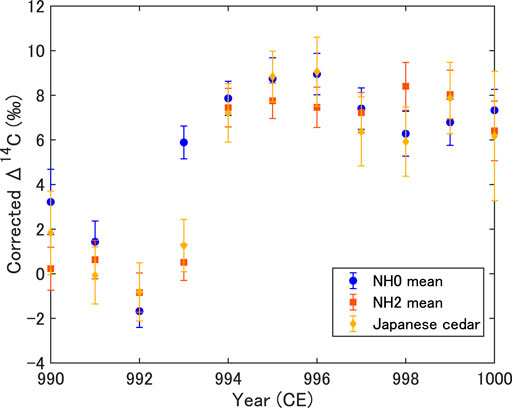
FIGURE 5. Comparison between the weighted average of NH0 and NH2 series (Japanese cedar series is also shown). The average of 990–992 CE of each series is adjusted to zero on the vertical axis.
Although differences in 14C concentrations with latitude have been discussed in previous studies, that is, the baseline offset of 14C concentrations (Büntgen et al., 2018) and the latitudinal dependence of 14C increase intensity during the event (Uusitalo et al., 2018), the difference of increase timing cannot be explained by these effects. Given that there is no large difference in tree growth between the NH0 and NH2 zones (e.g., June–August and May–September for the NH0 and NH2 zones, respectively: Büntgen et al., 2018), the timing difference in the 14C increase may reflect atmospheric transport. Originally, almost all 14C production by SEPs occurs at high latitudes (>60°) in the stratosphere, and a fraction of nuclide production in high latitude to the global is much higher for SEPs than galactic cosmic rays (Poluianov et al., 2016; Miyake et al., 2019a). Subsequently, 14C produced in the stratosphere is taken up by trees in the troposphere through the stratosphere–troposphere exchange (STE). Generally, it is considered that the STE dominantly occurred in the midlatitudes (e.g., 30–70°N: Stohl et al., 2003; Liang et al., 2009). If the observed difference in the timing of 14C increases reflects the effect of atmospheric transport, it would suggest that the STE of stratospheric high-latitude atmosphere occurs mainly in high latitudes (NH0 zone) and an atmosphere with a high 14C concentration is transported from high latitudes to low latitudes in the troposphere, or the STE in high latitudes (NH0) occurs earlier than that in low latitudes (NH2).
Carbon cycle box models used in the past are unsuitable for discussing atmospheric transport as the box of the atmosphere is only divided into the stratosphere and troposphere (e.g., Güttler et al., 2015). Therefore, the development of a three-dimensional transport model and using it for evaluation will be crucial in the future. However, the 14C data of 993 CE show a significant difference between NH0 and NH2 zones. This can be explained by a few months’ delay (<∼half a year) of the NH2 zone with respect to the NH0 zone because an occurrence of the SEP event of 993 CE was estimated in April 993 CE using 14C data of tree samples in both hemispheres (Büntgen et al., 2018), and trees finish carbon fixation in around September. Considering that it takes up to 6 months for the hemispheric troposphere to become uniform (Miyake et al., 2019a), the few months’ delay is considered a reasonable explanation.
As described, most differences in the timing of the increase in reported 14C data may be explained by such an atmospheric transport effect. However, from the timescale that the hemisphere becomes uniform (∼6 months: Miyake et al., 2019a), the 14C concentration should be increased in 994 CE, which cannot explain the low concentration of the earlywood of the Danish oak in 994 CE (Fogtmann-Schltz et al., 2017). This may be explained by the characteristics of the tree species. Most data in Table 1 are conifers; in addition, three series used hard woods (Danish oak and English oak: Fogtmann-Schltz et al., 2017; Rakowski et al., 2018; Brehm et al., 2021). The earlywood formation in deciduous broad-leaved trees with ring-porous wood begins before bud burst and is completed before the leaves are fully expanded (Ladefoged 1952; Kozlowski 1992; Catesson and Lachaud 1993; Pilcher 1995). Such earlywood formation originated from the stored carbon (before the previous year) and has also been shown by isotope analysis (Helle and Schleser, 2004). Earlywood data of the Danish oak series may also show such a difference in the carbon fixation time. Further studies on tree species and the fixation time of carbon will be required. Although we considered a simple delay effect due to atmospheric transport above, a dilution effect of the ocean may differ from region to region even if the latitude is the same (i.e., the closer to the ocean, the more affected by the ocean with a low 14C concentration: e.g., Nakamura et al., 2013). For example, in a comparison of the Qilian juniper (inland in China) and Asunaro (Japan: close to the ocean), which are located around the NH1–NH2 boundary, the Qilian juniper shows a 14C increase from 992 to 993 (relatively sharp change); on the other hand, the Asunaro shows a gradual change. In the future, it will be necessary to consider each of these factors affecting 14C concentrations in tree rings.
Spike Matching
The 993 CE event was detected as a significant 14C increase in most trees and can be dated by 14C spike matching. However, as mentioned above, there are differences in the absolute value and timing of an increase in 14C concentration depending on the region (or tree species) of using the tree sample, namely, a 1-year age-determination error may occur in the case of the spike matching using the 993 CE event. Therefore, it is crucial to understand and apply the regional characteristics of the trees used for dating. That said, the 993 CE spikes can be dated in ±1 year, so it is definitely a breakthrough compared with conventional radiocarbon dating.
Conclusion
In this study, we reinvestigated the 14C data of Japanese cedar from the Yaku-island in southern Japan for the 993 CE event by using the sample which was dated using two dendrochronological methods (tree-rings and stable oxygen isotope). Although, newly obtained 14C data series does not show a significant increase from 993 to 994 CE, it agrees with the previous data (Miyake et al., 2013; Miyake et al., 2014). The mean of the previous and current results shows a significant increase in 993–994 CE. Compared with the tree data reported so far globally, lower latitude data show a delay in the timing of 14C increases. Comparing the NH0 and NH2 zones, 14C concentrations agreed well between 990 and 1000 CE except in 993 CE where a significantly large difference was observed. This could be explained by considering the atmospheric transport effect. In the future, evaluation using a GCM-based model that considers air transport will be relevant. Obvious differences in the timing of the rapid increase in the 993 CE event can result in a 1-year dating error in radiocarbon spike matching, which should be mentioned for many potential dating cases in the future.
From our analysis of the Japanese cedar, we obtained a consistent result with the result of the Douglas-fir, which was excluded from the northern hemisphere mean in Büntgen et al. (2018). Compared with the NH0 zone, the 14C data in the NH2 zone may be delayed by several months after the occurrence of the SEP event and be diluted due to the transportation. In addition, depending on the area where the trees grow, differences may occur due to the susceptibility to dilution, for example, the influence of lower 14C concentrations of the ocean may differ depending on whether it is close to the ocean or inland. Differences in tree species could result in large seasonal 14C data differences during radiocarbon spikes. In the future, it will be crucial to verify such regional or species differences in 14C concentration in more detail. From the perspective of past SEP event exploration, trees living in the NH0 zone, which can clearly capture the 14C increase, may be desirable.
Data Availability Statement
The original contributions presented in the study are included in the article/Supplementary Material; further inquiries can be directed to the corresponding author.
Author Contributions
FM and MH designed the research. MH and KK prepared and dated the tree sample. FM, FT, MT, and TM prepared and conducted the 14C analysis. FM and MH analyzed the data. All authors contributed to the discussions.
Funding
FM’s work was supported by the JSPS Kakenhi Grant Numbers JP26887019, JP16K13802, JP16H06005, and JP20H05643.
Conflict of Interest
The authors declare that the research was conducted in the absence of any commercial or financial relationships that could be construed as a potential conflict of interest.
Publisher’s Note
All claims expressed in this article are solely those of the authors and do not necessarily represent those of their affiliated organizations, or those of the publisher, the editors, and the reviewers. Any product that may be evaluated in this article, or claim that may be made by its manufacturer, is not guaranteed or endorsed by the publisher.
Acknowledgments
We would like to thank T. Spiegl for very useful discussions. We also thank the ISSI international team 510 (SEESUP).
Supplementary Material
The Supplementary Material for this article can be found online at: https://www.frontiersin.org/articles/10.3389/fspas.2022.886140/full#supplementary-material
References
Baillie, M. G. L., and Pilcher, J. R. (1973). A Simple Crossdating Program for Tree-Ring Research. Tree-Ring Bull. 33, 7–14.
Brehm, N., Bayliss, A., Christl, M., Synal, H.-A., Adolphi, F., Beer, J., et al. (2021). Eleven-year Solar Cycles over the Last Millennium Revealed by Radiocarbon in Tree Rings. Nat. Geosci. 14, 10–15. doi:10.1038/s41561-020-00674-0
Brehm, N., Christl, M., Knowles, T. D. J., Casanova, E., Evershed, R. P., Adolphi, F., et al. (2022). Tree-rings Reveal Two Strong Solar Proton Events in 7176 and 5259 BCE. Nat. Commun. 13, 1196. doi:10.1038/s41467-022-28804-9
Büntgen, U., Wacker, L., Galván, J. D., Arnold, S., Arseneault, D., Baillie, M., et al. (2018). Tree Rings Reveal Globally Coherent Signature of Cosmogenic Radiocarbon Events in 774 and 993 CE. Nat. Commun. 9 (1), 3605. doi:10.1038/s41467-018-06036-0
Catesson, A.-M., and Lachaud, S. (1993). Le cambium, structure, fonctionnement et contrôle de l'activité saisonnière. Acta Bot. Gallica 140, 337–350. doi:10.1080/12538078.1993.10515605
Fogtmann-Schulz, A., Østbø, S. M., Nielsen, S. G. B., Olsen, J., Karoff, C., and Knudsen, M. F. (2017). Cosmic Ray Event in 994 C.E. Recorded in Radiocarbon from Danish Oak. Geophys. Res. Lett. 44, 8621–8628. doi:10.1002/2017GL074208
GLE database. Available at: https://gle.oulu.fi.
Güttler, D., Adolphi, F., Beer, J., Bleicher, N., Boswijk, G., Christl, M., et al. (2015). Rapid Increase in Cosmogenic 14C in AD 775 Measured in New Zealand Kauri Trees Indicates Short-Lived Increase in 14C Production Spanning Both Hemispheres. Earth Planet. Sci. Lett. 411, 290–297. doi:10.1016/j.epsl.2014.11.048
Hakozaki, M., Miyake, F., and Nakamura, T. (2020). 775 and 994 14C Events in the Tree-Rings of Northern Japanese Trees. in Proceedings of EA-AMS 8 & JAMS-22, Jun, 2020, 89–90.
Hakozaki, M., Miyake, F., Nakamura, T., Kimura, K., Masuda, K., and Okuno, M. (2018). Verification of the Annual Dating of the 10th Century Baitoushan Volcano Eruption Based on an AD 774-775 Radiocarbon Spike. Radiocarbon 60 (1), 261–268. doi:10.1017/rdc.2017.75
Helle, G., and Schleser, G. H. (2004). Beyond CO2-fixation by Rubisco - an Interpretation of 13C/12C Variations in Tree Rings from Novel Intra-seasonal Studies on Broad-Leaf Trees. Plant Cell Environ. 27, 367–380. doi:10.1111/j.0016-8025.2003.01159.x
Hua, Q., Barbetti, M., and Rakowski, A. Z. (2013). Atmospheric Radiocarbon for the Period 1950-2010. Radiocarbon 55 (4), 2059–2072. doi:10.2458/azu_js_rc.v55i2.16177
Hua, Q., Turnbull, J. C., Santos, G. M., Rakowski, A. Z., Ancapichún, S., De Pol-Holz, R., et al. (2021). Atmospheric Radiocarbon for the Period 1950-2019. Radiocarbon, 1–23. doi:10.1017/RDC.2021.95
Kagawa, A., Sano, M., Nakatsuka, T., Ikeda, T., and Kubo, S. (2015). An Optimized Method for Stable Isotope Analysis of Tree Rings by Extracting Cellulose Directly from Cross-Sectional Laths. Chem. Geol. 393-394, 16–25. doi:10.1016/j.chemgeo.2014.11.019
Kozlowski, T. T. (1992). Carbohydrate Sources and Sinks in Woody Plants. Bot. Rev. 58, 107–222. doi:10.1007/bf02858600
Kuitems, M., Wallace, B. L., Lindsay, C., Scifo, A., Doeve, P., Jenkins, K., et al. (2021). Evidence for European Presence in the Americas in Ad 1021. Nature 601, 388–391. doi:10.1038/s41586-021-03972-8
Liang, Q., Douglass, A. R., Duncan, B. N., Stolarski, R. S., and Witte, J. C. (2009). The Governing Processes and Timescales of Stratosphere-To-Troposphere Transport and its Contribution to Ozone in the Arctic Troposphere. Atmos. Chem. Phys. 9, 3011–3025. doi:10.5194/acp-9-3011-2009
Mekhaldi, F., Muscheler, R., Adolphi, F., Aldahan, A., Beer, J., McConnell, J. R., et al. (2015). Multiradionuclide Evidence for the Solar Origin of the Cosmic-Ray Events of AD 774/5 and 993/4. Nat. Commun. 6 (1), 8611. doi:10.1038/ncomms9611
Miyahara, H., Tokanai, F., Moriya, T., Takeyama, M., Sakurai, H., Ohyama, M., et al. (2022). Recurrent Large-Scale Solar Proton Events before the Onset of the Wolf Grand Solar Minimum. Geophys. Res. Lett. 49, e2021GL097201. doi:10.1029/2021gl097201
Miyake, F., Nagaya, K., Masuda, K., and Nakamura, T. (2012). A Signature of Cosmic-Ray Increase in AD 774-775 from Tree Rings in Japan. Nature 486 (7402), 240–242. doi:10.1038/nature11123
Miyake, F., Masuda, K., and Nakamura, T. (2013). Another Rapid Event in the Carbon-14 Content of Tree Rings. Nat. Commun. 4 (1), 1748. doi:10.1038/ncomms287310.1038/ncomms2783
Miyake, F., Masuda, K., Hakozaki, M., Nakamura, T., Tokanai, F., Kato, K., et al. (2014). Verification of the Cosmic-Ray Event in AD 993-994 by Using a Japanese Hinoki Tree. Radiocarbon 56 (03), 1189–1194. doi:10.2458/56.17769
Miyake, F., Suzuki, A., Masuda, K., Horiuchi, K., Motoyama, H., Matsuzaki, H., et al. (2015). Cosmic Ray Event of A.D. 774-775 Shown in Quasi-annual10Be Data from the Antarctic Dome Fuji Ice Core. Geophys. Res. Lett. 42, 84–89. doi:10.1002/2014GL062218
F. Miyake, I.G. Usoskin, and S. Poluianov (Editors) (2019a). Extreme Solar Particle Storms (ristol, United Kingdom: IOP Publishing). doi:10.1088/2514-3433/ab404a
Miyake, F., Horiuchi, K., Motizuki, Y., Nakai, Y., Takahashi, K., Masuda, K., et al. (2019b). 10 Be Signature of the Cosmic Ray Event in the 10th Century CE in Both Hemispheres, as Confirmed by Quasi‐Annual 10 Be Data from the Antarctic Dome Fuji Ice Core. Geophys. Res. Lett. 46, 11–18. doi:10.1029/2018GL080475
Miyake, F., Panyushkina, I. P., Jull, A. J. T., Adolphi, F., Brehm, N., Helama, S., et al. (2021). A Single‐Year Cosmic Ray Event at 5410 BCE Registered in 14 C of Tree Rings. Geophys. Res. Lett. 48, e2021GL093419. doi:10.1029/2021GL093419
Nakamura, T., Masuda, K., Miyake, F., Nagaya, K., and Yoshimitsu, T. (2013). Radiocarbon Ages of Annual Rings from Japanese Wood: Evident Age Offset Based on IntCal09. Radiocarbon 55, 763–770. doi:10.1017/s0033822200057921
Nakatsuka, T., Sano, M., Li, Z., Xu, C., Tsushima, A., Shigeoka, Y., et al. (2020). A 2600-year Summer Climate Reconstruction in Central Japan by Integrating Tree-Ring Stable Oxygen and Hydrogen Isotopes. Clim. Past. 16, 2153–2172. doi:10.5194/cp-16-2153-2020
O’Hare, P., Mekhaldi, F., Adolphi, F., Raisbeck, G., Aldahan, A., Anderberg, E., et al. (2019). Multiradionuclide Evidence for an Extreme Solar Proton Event Around 2,610 B.P. (∼660 BC). Proc. Natl. Acad. Sci. U.S.A. 116 (13), 5961–5966. doi:10.1073/pnas.1815725116
Oppenheimer, C., Wacker, L., Xu, J., Galván, J. D., Stoffel, M., Guillet, S., et al. (2017). Multi-proxy Dating the 'Millennium Eruption' of Changbaishan to Late 946 CE. Quat. Sci. Rev. 158, 164–171. doi:10.1016/j.quascirev.2016.12.024
Paleari, C. I., Mekhaldi, F., Adolphi, F., Christl, M., Vockenhuber, C., Gautschi, P., et al. (2022). Cosmogenic Radionuclides Reveal an Extreme Solar Particle Storm Near a Solar Minimum 9125 Years BP. Nat. Commun. 13, 214. doi:10.1038/s41467-021-27891-4
Park, J., Southon, J., Fahrni, S., Creasman, P. P., and Mewaldt, R. (2017). Relationship between Solar Activity and Δ14C Peaks in AD 775, AD 994, and 660 BC. Radiocarbon 59 (4), 1147–1156. doi:10.1017/RDC.2017.59
Philippsen, B., Feveile, C., Olsen, J., Sindbæk, S. M., and Sindbæk, S. M. (2021). Single-year Radiocarbon Dating Anchors Viking Age Trade Cycles in Time. Nature 601, 392–396. doi:10.1038/s41586-021-04240-5
Pilcher, J. R. (1995). “Biological Considerations in the Interpretation of Stable Isotope Ratios in Tree Rings,” in Problems of Stable Isotopes in Tree Rings, Lake Sediments and Peat Bogs as Climatic Evidence for the Holocene. Editors B. Frenzel, B. Stauffer, and M.M. Weiss (Stuttgart, Jena, New York: Gustav Fischer Verlag), Paläoklimaforschung-Palaeoclimate Research. 15, 157–161.
Poluianov, S. V., Kovaltsov, G. A., Mishev, A. L., and Usoskin, I. G. (2016). Production of Cosmogenic Isotopes 7Be, 10Be, 14C, 22Na, and 36Cl in the Atmosphere: Altitudinal Profiles of Yield Functions. J. Geophys. Res. Atmos. 121, 8125–8136. doi:10.1002/2016JD025034
Rakowski, A. Z., Krąpiec, M., Huels, M., Pawlyta, J., and Boudin, M. (2018). Increase in Radiocarbon Concentration in Tree Rings from Kujawy Village (Se Poland) Around Ad 993-994. Radiocarbon 60, 1249–1258. doi:10.1017/RDC.2018.74
Sakurai, H., Tokanai, F., Miyake, F., Horiuchi, K., Masuda, K., Miyahara, H., et al. (2020). Prolonged Production of 14C during the ∼660 BCE Solar Proton Event from Japanese Tree Rings. Sci. Rep. 10, 660. doi:10.1038/s41598-019-57273-2
Stohl, A., Bonasoni, P., Cristofanelli, P., Collins, W., Feichter, J., Frank, A., et al. (2003). Stratosphere-troposphere Exchange: A Review, and what We Have Learned from STACCATO. J. Geophys. Res. 108, 8516. doi:10.1029/2002JD002490
Tokanai, F., Kato, K., Anshita, M., Sakurai, H., Izumi, A., Toyoguchi, T., et al. (2013). Present Status of YU-AMS System. Radiocarbon 55 (2), 251–259. doi:10.1017/S0033822200057350
Usoskin, I. G., and Kovaltsov, G. A. (2021). Mind the Gap: New Precise 14 C Data Indicate the Nature of Extreme Solar Particle Events. Geophys Res. Lett. 48, e2021GL094848. doi:10.1029/2021GL094848
Uusitalo, J., Arppe, L., Hackman, T., Helama, S., Kovaltsov, G., Mielikäinen, K., et al. (2018). Solar Superstorm of AD 774 Recorded Subannually by Arctic Tree Rings. Nat. Commun. 9 (1), 3495. doi:10.1038/s41467-018-05883-1
Wacker, L., Güttler, D., Goll, J., Hurni, J. P., Synal, H.-A., and Walti, N. (2014). Radiocarbon Dating to a Single Year by Means of Rapid Atmospheric 14C Changes. Radiocarbon 56 (2), 573–579. doi:10.2458/56.17634
Keywords: SEP event, cosmogenic nuclides, tree ring, dendrochronology, solar activity, radiocarbon dating
Citation: Miyake F, Hakozaki M, Kimura K, Tokanai F, Nakamura T, Takeyama M and Moriya T (2022) Regional Differences in Carbon-14 Data of the 993 CE Cosmic Ray Event. Front. Astron. Space Sci. 9:886140. doi: 10.3389/fspas.2022.886140
Received: 28 February 2022; Accepted: 11 May 2022;
Published: 04 July 2022.
Edited by:
Fadil Inceoglu, National Centers for Environmental Information (NCEI) at National Atmospheric and Oceanographic Administration (NOAA), United StatesReviewed by:
Bernd Kromer, Curt Engelhorn Centre Archaeometry, GermanyFlorian Mekhaldi, Lund University, Sweden
Copyright © 2022 Miyake, Hakozaki, Kimura, Tokanai, Nakamura, Takeyama and Moriya. This is an open-access article distributed under the terms of the Creative Commons Attribution License (CC BY). The use, distribution or reproduction in other forums is permitted, provided the original author(s) and the copyright owner(s) are credited and that the original publication in this journal is cited, in accordance with accepted academic practice. No use, distribution or reproduction is permitted which does not comply with these terms.
*Correspondence: Fusa Miyake, Zm1peWFrZUBpc2VlLm5hZ295YS11LmFjLmpw