- 1Center for the Utilization of Biological Engineering in Space (CUBES), Berkeley, CA, United States
- 2Department of Chemical and Biomolecular Engineering, University of California, Berkeley, Berkeley, CA, United States
- 3Department of Bioengineering, University of California, Berkeley, Berkeley, CA, United States
- 4Department of Electrical Engineering and Computer Sciences, University of California, Berkeley, Berkeley, CA, United States
- 5Climate and Ecosystems Sciences Division, Lawrence Berkeley National Laboratory, Berkeley, CA, United States
- 6Department of Earth and Planetary Sciences, University of California, Berkeley, Berkeley, CA, United States
- 7Environmental Genomics and Systems Biology Division, Lawrence Berkeley National Laboratory, Berkeley, CA, United States
- 8Molecular Biophysics and Integrated Bioimaging Division, Lawrence Berkeley National Laboratory, Berkeley, CA, United States
A central question surrounding possible human exploration of Mars is whether crewed missions can be supported by available technologies using in situ resources. Here, we show that photovoltaics-based power systems would be adequate and practical to sustain a crewed outpost for an extended period over a large fraction of the planet’s surface. Climate data were integrated into a radiative transfer model to predict spectrally-resolved solar flux across the Martian surface. This informed detailed balance calculations for solar cell devices that identified optimal bandgap combinations for maximizing production capacity over a Martian year. We then quantified power systems, manufacturing, and agricultural demands for a six-person mission, which revealed that photovoltaics-based power generation would require
Introduction
Long-duration space missions or continuously-occupied extraterrestrial outposts require Earth-independent power and chemical supply. Mars has an abundance of in situ resources, including (sub)surface water ice (Wilson et al., 2018) and carbon and nitrogen in atmospheric CO2 and N2 (Webster et al., 2013). Efficient conversion of these resources to reduced forms of hydrogen, nitrogen, and carbon would represent an enabling step towards sustaining a permanent human presence in space. In analogy to the proposed terrestrial “Hydrogen Economy”, molecular hydrogen (H2) can be used as a platform molecule for energy storage, on-demand power supply, and as a reactant driving CO2 and N2 (bio)chemical reduction on Mars (Marbán and Valdés-Solís, 2007; Chen et al., 2018; Berliner et al., 2021). Water electrolysis with selective catalysts can drive water reduction to H2 on cathode surfaces. This technology is attractive for space manufacturing applications since reactions can proceed at high rates at room temperature, enabling the use of low-weight, 3D-printable plastic reactors (Berliner et al., 2021). Commercial electrolyzerscan evolve H2 from water with up to ∼80% energy efficiency (Ursua et al., 2011). Directly solar-powered (i.e., photoelectrochemical (PEC)) devices have also received significant attention, with solar-to-chemical efficiencies reaching
The primary alternatives for powering life support systems and chemical production facilities on Mars are miniaturized nuclear fission reactors (Drake et al., 2010) and photovoltaic (PV) arrays. While fission reactors are expected to behave similarly regardless of their location, the productivity limits of PV and photoelectrochemical devices are not well-characterized for the Martian surface mainly due to differences in the surface temperature and solar intensity and spectrum from typical conditions on Earth or in space.
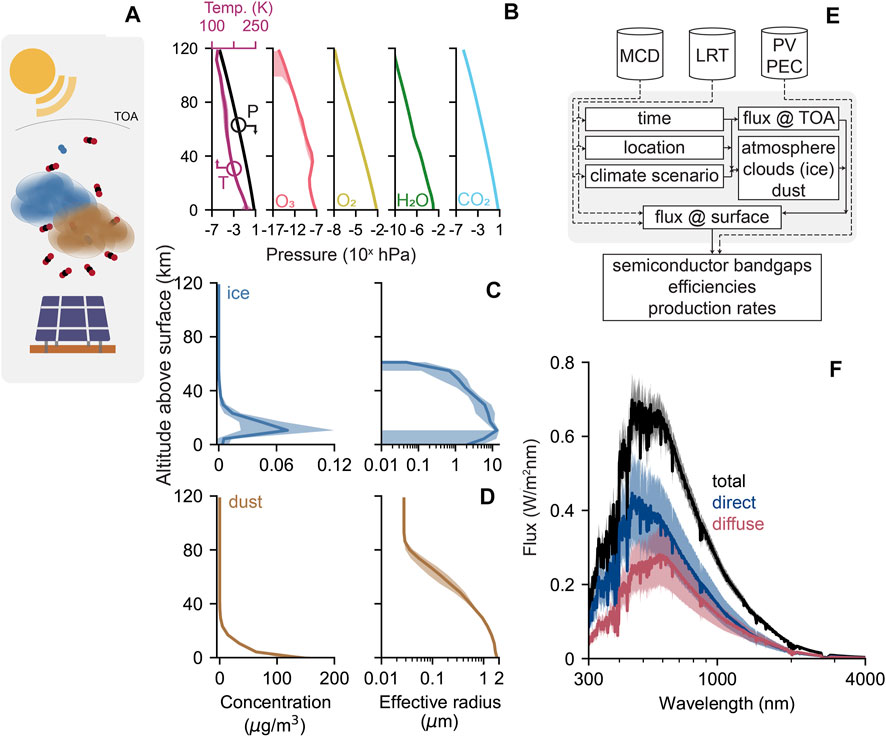
In an effort to determine the potential of PV and PEC devices to support a crewed mission to Mars, we integrated relevant climate data from the Mars Climate Database (Read et al., 1997) into a radiative transfer model, libRadtran (Mayer and Kylling, 2005), to predict spectrally-resolved solar flux across the Martian surface over the course of a year. The modeling overview and sample calculations for Jezero Crater are provided in Figure 1. Sunlight incident on the surface originating from the top of the atmosphere (TOA) is mediated by orbital geometry and local atmospheric composition of gases, ice, and dust for a given location (Figure 1A). We determined the partial pressures of constituent gases (Figure 1B) and the concentrations and effective radii of ice (Figure 1C) and dust (Figure 1D) particles as a function of altitude above the surface and provided these data as inputs to a downstream radiative transfer model (diagrammed in Figure 1E). We then calculated the spectrally-resolved solar flux (Figure 1F). At short wavelengths (

FIGURE 1. Overview and calculation of spectral flux using atmospheric data. (A) Sunlight incident on the solar cells is mediated by orbital geometry and local atmospheric composition of gases, ice, and dust. (B,C, and D) Temperature, partial pressure of atmospheric gases and concentration and effective radii of ice and dust particles as a function of altitude above the surface. (E) Information flow in the calculation scheme. Dotted lines represent functions used for calculations; solid lines represent data used as parameters. MCD, Mars Climate Database; LRT, LibRadtran. (F) Total (black), direct (blue), and diffuse (red) solar flux at Jezero Crater at solar noon averaged over the course of a typical Martian year. In (B), (C), (D), and (F), solid lines represent yearly averages and shaded regions represent the standard deviation due to seasonal variation.
Results
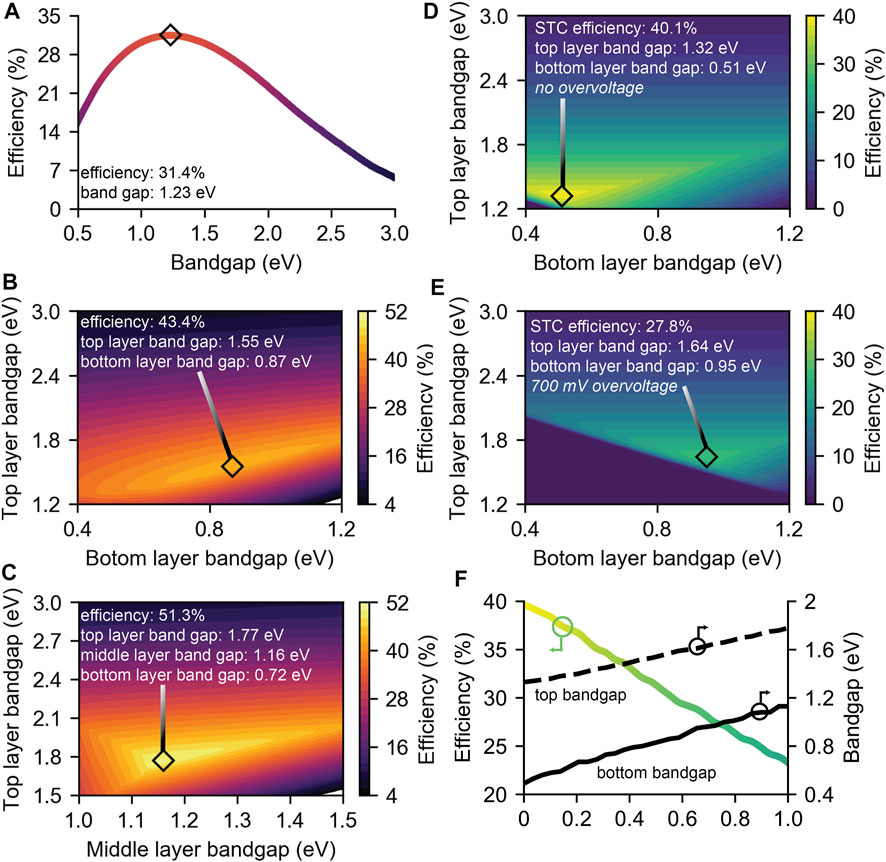
The modeling results were used to inform efficiency calculations for PV and PEC devices producing electricity and H2. Detailed balance calculations (section 4 in the Supplementary Information) (Döscher et al., 2014; Hanna and Nozik, 2006) revealed ideal current-voltage characteristics for optically-thick devices consisting of 1-, 2-, and 3- junction PV and 1- and 2-junction PEC absorbers dependent on the bandgaps associated with each absorber (Figure 2). Absorber numbers were selected to represent historical choices for PV devices on Martian rovers (Landis, 2005; Stella et al., 2005) and state-of-the-art PEC devices (Jia et al., 2016; Young et al., 2017; Cheng et al., 2018). For PEC devices, we assumed an electrical load consisting of the thermodynamic redox potential and a variable overvoltage term that incorporates loss mechanisms inevitable to a practical PEC device beyond radiative recombination already considered in the detailed balance (Hanna and Nozik, 2006; Döscher et al., 2014).

FIGURE 2. Theoretical efficiencies of PV and PEC devices. Detailed-balance efficiency limits as a function of bandgap energies for (A) single-junction, (B) two-junction, (C) three-junction photovoltaic devices. (D and E) Solar-to-chemical (STC) efficiency for two-junction water splitting PEC devices producing molecular hydrogen with 0 mV (D) and 700 mV (E) overvoltage. (F) STC efficiency and optimal bandgaps for two-junction H2-generating PEC devices as a function of overvoltage. Coloring in (A) and (F) correspond to contour coloring in (B,C) and (D,E) respectively. Average flux at solar noon at Jezero Crater is used as the reference solar spectrum.
The maximum efficiency for PV devices increases from 31.4% (1-junction; Eg = 1.23 eV) to 51.3% (3-junction; Eg, 1 = 1.77 eV, Eg,2 = 1.16 eV, Eg,3 = 0.72 eV) with judicious choice of bandgaps (Figures 2A–C). For PEC devices, optimal bandgap choice and efficiency are strongly dependent on system losses (Figures 2D–F), reflecting the importance of careful device construction and catalyst selection (Hu et al., 2013). For a realistic overvoltage loss of 700 mV (Hanna and Nozik, 2006; Hu et al., 2013; Döscher et al., 2014), a maximum solar-to-chemical conversion (SCC) efficiency of 27.8% is feasible for H2 production.
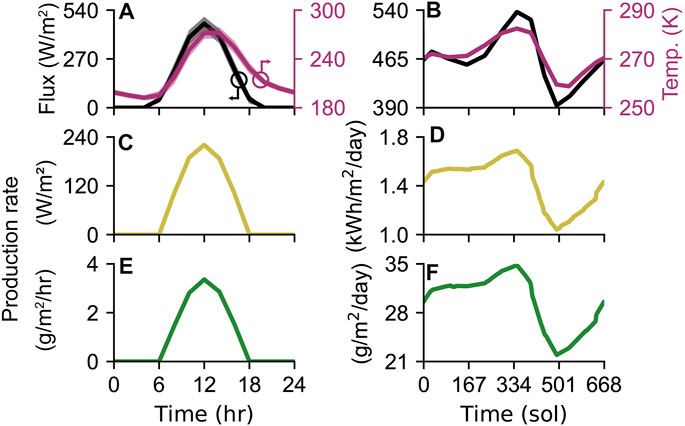
To evaluate the potential for solar cells to supply power and commodity chemicals, we determined the maximum practical production capacity for 3-junction PV (operating at 80% of the detailed balance limit) and 2-junction PEC devices (with a 700-mV overvoltage) over the course of a Martian year (Figure 3). Daily and seasonal variation in solar flux and temperature (Figures 3A,B) cause substantial (∼27% deviation from the yearly average) changes in production rates (Figures 3C,D). We defined solar day (sol) 0 at a solar longitude (Ls) of 0° (vernal equinox) and assumed the solar cell operating temperature was equal to the surface temperature at all points. Dust storm season begins at sol ∼372 (Ls

FIGURE 3. PV and PEC production rates. (A) Average and (B) daily maximum solar flux (black, left axis) and surface temperature (purple, right axis) as function of (A) time of day and (B) time of year. (C,E) average and (D,F) daily maximum production capacity of power (C,D) and H2 (E,F) using 3-junction PV and 2-junction PEC cells as described in the main text. Solid lines in (A,C,E) correspond to averages; shaded areas represent the standard deviation due to seasonal variation. Jezero Crater is used as the location for plots.
Bandgap combinations that maximize production over the course of a year are 5–15% different from those that optimize efficiency at solar noon (Supplementary Table S7). For both PV and PEC devices, the top junction bandgap shifted up (for H2-generating PEC devices, from 1.64 to 1.77 eV), while the bottom junction bandgap shifted down (from 0.95 to 0.83 eV). Hence, the photon absorption window for the bottom junction is broadened (by ∼35% for the PEC device). This likely works to maximize productivity during the less dusty season (higher solar flux, Figure 3B) by accounting for the relative blue-shift of surface-incident light (Figure 1F) due to reduced scattering.
Discussion
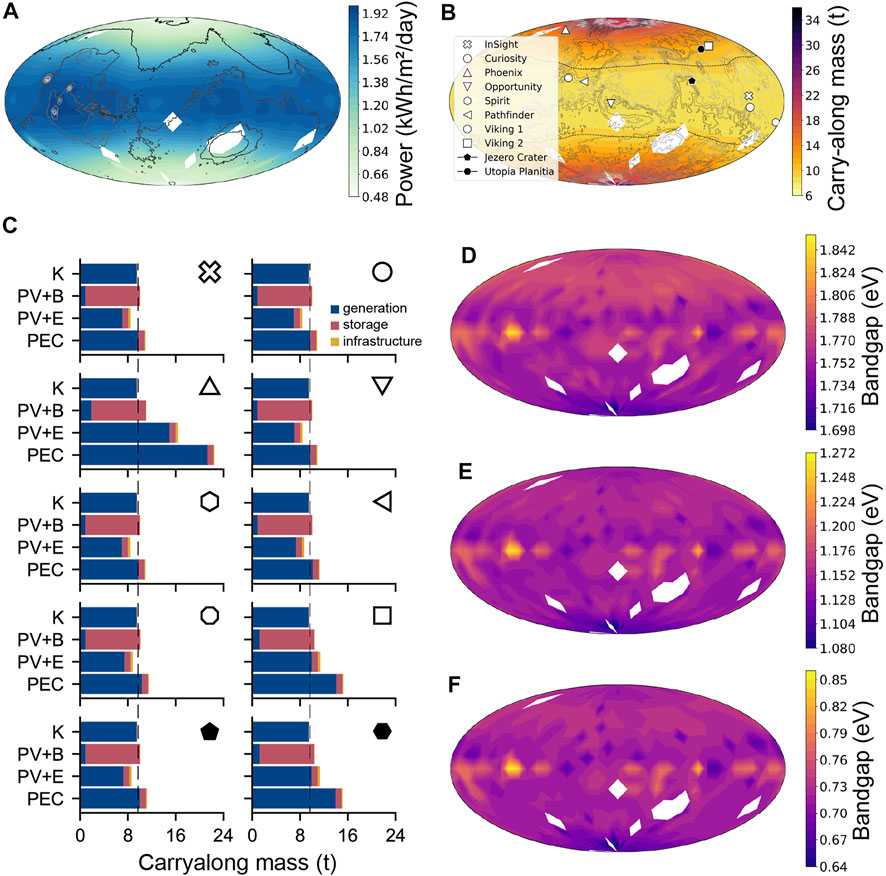
Production capacity of power and commodity chemicals must compare favorably to the demand necessary to sustain a Martian habitat and depends on the outpost location on the planet surface (Figure 4A). Moreover, energy storage capacity is crucial for solar-powered production systems because the Sun sets daily. We therefore developed a detailed process model to account for power systems demands, including habitat maintenance (for example, habitat temperature control and pressurization), fertilizer production for agriculture, methane production for ascent propellant, and bioplastics production for spare parts manufacturing (Supplementary Figure S12). We considered four different power generation scenarios: 1) nuclear power generation with the miniaturized nuclear fission Kilopower system; 2) PV power generation with battery energy storage (PV + B); 3) PV power generation with compressed H2 energy storage produced via electrolysis (PV + E); and 4) PEC H2 generation with compressed H2 energy storage (PEC). In our calculations, we assumed a capacity factor of 75% to account for the solar flux deviation throughout the Martian year (Figure 3) and sized energy storage systems (batteries or compressed H2) to enable 1 full day of operations from reserve power. We then calculated the carry-along mass requirements for each of the power generation systems considered.

FIGURE 4. Solar productivity across the Martian surface. (A) Average daily solar power production capacity across the Martian surface. (B) Total carry-along mass required for power production using the PV + E generation system. Black dashed line corresponds to breakeven location with nuclear power generation. (C) Carry-along mass breakdown for locations in (B) for each power generation option. Black dashed line corresponds to breakeven with nuclear power generation. Optimal (D) top, (E) middle, (F) bottom bandgaps for the 3-junction PV array.
Of the three solar-driven power generation options, only the PV + E system outcompetes the nuclear system based on carry-along mass (Figures 4B,C; Supplementary Figure S13). For the PV + E system, the total carry-along mass increases from ∼8.3 t near the equator to ∼22.4 t near the South Pole (Figure 4B), corresponding to the reduced average daily power generation of the PV array as the latitude is adjusted away from 0° (Figure 4A). The nuclear power system is predicted to require ∼9.5 t; hence, the PV + E system out-performs this option across ∼50% of the planet’s surface (Figure 4B).
In addition to predicting production capacity and carry-along mass, our model provides design rules for optimal solar cell design. Optimal absorber bandgaps for the PV array are strongly dependent on the location on the surface of Mars (Figures 4D–F). Several factors cause this variation: the total depth of the air column above a given location (i.e., the difference between the height of the atmosphere and the altitude), gradients in dust and ice concentrations and particle radii, and orbital geometry effects that cause different effective air column thicknesses for locations near the poles. Lower elevations, higher dust and/or ice concentrations, and increasing distance away from the equator (near-polar latitudes) all cause an increase in the optical depth of the air column, which enhances the fraction of light that is scattered. Because the spectrum of scattered light is slightly red-shifted with respect to direct light (Figure 1F), optimal bandgaps decrease to capture more lower-energy photons (Figures 4D–F) in regions where the optical depth is higher. For example, at equivalent latitudes, the optimal bandgaps are wider for regions with higher elevations than for those with lower elevations because the fraction of light that gets scattered is lower. Regional differences in atmospheric conditions can drive countervailing effects; because the Northern Hemisphere experiences generally lower dust concentrations than the Southern Hemisphere, the lower elevation in the Northern Hemisphere does not result in (on average) narrower optimal bandgaps. Instead, the reduced dust concentration (relative to that of the Southern Hemisphere) results in a reduced optical depth, resulting in wider optimal bandgap combinations (Figures 4D–F). In sum, optimal bandgaps for the top absorber range from ∼1.7 eV to ∼1.84 eV (Figure 4D), from ∼1.08 eV to ∼1.27 eV for the middle absorber (Figure 4E), and from ∼0.64 eV to ∼0.85 eV for the bottom absorber (Figure 4F). Optimized triple-junction solar cells could be fabricated from, for example, GaInAsP alloys on Ge substrates with minimal lattice mismatch (
In conclusion, solar cell arrays with careful attention to semiconductor choice and device construction represent a promising technology for sustaining an Earth-independent crewed habitat on Mars. Our analysis provides design rules for solar cells on the Martian surface and shows that solar cells can offer substantial reduction in carry-along mass requirements compared to alternative technology over a large fraction of the planet’s surface.
Data Availability Statement
The raw data supporting the conclusions of this article will be made available by the authors, without undue reservation.
Author Contributions
Conceptualization: AJA, AJB. Data curation: AJB, AJA. Funding acquisition: AJB, AJA, APA, DSC. Methodology: AJA, AJB, WDC. Software: AJB, AJA, MM. Supervision: WDC, APA, DSC. Visualization: AJA, AJB. Writing original draft: AJA, AJB. Writing review; editing: AJA, AJB, MM, WDC, APA, DSC.
Funding
Funding was provided by the National Aeronautics and Space Administration (grant NNX17AJ31G for AJB, APA, DC) and National Science Foundation graduate research fellowship program (grant DGE1752814 for AJA, AJB).
Conflict of Interest
The authors declare that the research was conducted in the absence of any commercial or financial relationships that could be construed as a potential conflict of interest.
Publisher’s Note
All claims expressed in this article are solely those of the authors and do not necessarily represent those of their affiliated organizations, or those of the publisher, the editors and the reviewers. Any product that may be evaluated in this article, or claim that may be made by its manufacturer, is not guaranteed or endorsed by the publisher.
Acknowledgments
We thank Henning Döscher (Fraunhofer ISI) and Todd Deutsch (NREL) for advice on solar cell device modeling, Marisa Watanabe for advice on data representation, Aymeric Spiga (LMD) for assistance with the Mars Climate Database, Claudia Emde (LMU) for assistance with the libRadtran library. This research used the Savio computational cluster resource provided by the Berkeley Research Computing program at UC Berkeley (supported by the UC Berkeley Chancellor, Vice Chancellor for Research, and Chief Information Officer).
Supplementary Material
The Supplementary Material for this article can be found online at: https://www.frontiersin.org/articles/10.3389/fspas.2022.868519/full#supplementary-material
References
Berliner, A. J., Hilzinger, J. M., Abel, A. J., McNulty, M. J., Makrygiorgos, G., Averesch, N. J. H., et al. (2021). Towards a Biomanufactory on Mars. Front. Astron. Space Sci. 8, 120. doi:10.3389/fspas.2021.711550
Chen, J. G., Crooks, R. M., Seefeldt, L. C., Bren, K. L., Bullock, R. M., Darensbourg, M. Y., et al. (2018). Beyond Fossil Fuel-Driven Nitrogen Transformations. Science 360. doi:10.1126/science.aar6611
Cheng, W. H., Richter, M. H., May, M. M., Ohlmann, J., Lackner, D., Dimroth, F., et al. (2018). Monolithic Photoelectrochemical Device for Direct Water Splitting with 19% Efficiency. ACS Energ. Lett. 3, 1795–1800.
Döscher, H., Geisz, J. F., Deutsch, T. G., and Turner, J. A. (2014). Sunlight Absorption in Water - Efficiency and Design Implications for Photoelectrochemical Devices. Energy Environ. Sci. 7, 2951–2956. doi:10.1039/c4ee01753f
Drake, B. G., Hoffman, S. J., and Beaty, D. W. (2010). “Human Exploration of Mars, Design Reference Architecture 5.0,” in Aerospace Conference, 2010 IEEE (IEEE), 1–24. doi:10.1109/aero.2010.5446736
Geisz, J. F., Kurtz, S., Wanlass, M. W., Ward, J. S., Duda, A., Friedman, D. J., et al. (2007). High-efficiency GaInP∕GaAs∕InGaAs Triple-junction Solar Cells Grown Inverted with a Metamorphic Bottom junction. Appl. Phys. Lett. 91, 023502. doi:10.1063/1.2753729
Hanna, M. C., and Nozik, A. J. (2006). Solar Conversion Efficiency of Photovoltaic and Photoelectrolysis Cells with Carrier Multiplication Absorbers. J. Appl. Phys. 100, 74510. doi:10.1063/1.2356795
Hu, S., Xiang, C., Haussener, S., Berger, A. D., and Lewis, N. S. (2013). An Analysis of the Optimal Band Gaps of Light Absorbers in Integrated Tandem Photoelectrochemical Water-Splitting Systems. Energ. Environ. Sci. 6, 2984–2993. doi:10.1039/c3ee40453f
Jia, J., Seitz, L. C., Benck, J. D., Huo, Y., Chen, Y., Ng, J. W., et al. (2016). Solar Water Splitting by Photovoltaic-Electrolysis with a Solar-To-Hydrogen Efficiency over 30. Nat. Commun. 7, 13237. doi:10.1038/ncomms13237
Kidd, P., Dunstan, D. J., Colson, H. G., Louren¸o, M. A., Sacedo´n, A., Gonza´lez-Sanz, F., et al. (1996). Comparison of the Crystalline Quality of Step-Graded and Continuously Graded InGaAs Buffer Layers. J. Cryst. Growth 169, 649–659. doi:10.1016/S0022-0248(96)00665-3
Landis, G. A. (2005). “Exploring mars with Solar-Powered Rovers,” in Conference Record of the Thirty-first IEEE Photovoltaic Specialists Conference, 858–861. doi:10.1109/PVSC.2005.1488268
Marbán, G., and Valdés-Solís, T. (2007). Towards the Hydrogen Economy? Int. J. Hydrogen Energ. 32, 1625–1637. doi:10.1016/j.ijhydene.2006.12.017
Mayer, B., and Kylling, A. (2005). Technical Note: The libRadtran Software Package for Radiative Transfer Calculations - Description and Examples of Use. Atmos. Chem. Phys. 5, 1855–1877. doi:10.5194/acp-5-1855-2005
Menezes, A. A., Cumbers, J., Hogan, J. A., and Arkin, A. P. (2015). Towards Synthetic Biological Approaches to Resource Utilization on Space Missions. J. R. Soc. Interf. 12, 20140715. doi:10.1098/rsif.2014.0715
Nangle, S. N., Wolfson, M. Y., Hartsough, L., Ma, N. J., Mason, C. E., Merighi, M., et al. (2020). The Case for Biotech on Mars. Nat. Biotechnol. 38, 401–407. doi:10.1038/s41587-020-0485-4
Read, P. L., Collins, M., Forget, F., Fournier, R., Hourdin, F., Lewis, S. R., et al. (1997). A GCM Climate Database for Mars: for mission Planning and for Scientific Studies. Adv. Space Res. 19, 1213–1222. doi:10.1016/s0273-1177(97)00272-x
Stella, P. M., Ewell, R. C., and Hoskin, J. J. (2005). “Design and Performance of the MER (Mars Exploration Rovers) Solar Arrays,” in Conference Record of the Thirty-first IEEE Photovoltaic Specialists Conference, 2005, 626–630. doi:10.1109/PVSC.2005.1488209
Ursua, A., Gandia, L. M., and Sanchis, P. (2011). Hydrogen Production from Water Electrolysis: Current Status and Future Trends. Proc. IEEE 100, 410–426.
Vicente-Retortillo, Á., Valero, F., Vázquez, L., and Martínez, G. M. (2015). A Model to Calculate Solar Radiation Fluxes on the Martian Surface. J. Space Weather Space Clim. 5, A33. doi:10.1051/swsc/2015035
Webster, C. R., Mahaffy, P. R., Flesch, G. J., Niles, P. B., Jones, J. H., Leshin, L. A., et al. (2013). Isotope Ratios of H, C, and O in CO 2 and H 2 O of the Martian Atmosphere. Science 341, 260–263. doi:10.1126/science.1237961
Wilson, J. T., Eke, V. R., Massey, R. J., Elphic, R. C., Feldman, W. C., Maurice, S., et al. (2018). Equatorial Locations of Water on Mars: Improved Resolution Maps Based on Mars Odyssey Neutron Spectrometer Data. Icarus 299, 148–160. doi:10.1016/j.icarus.2017.07.028
Keywords: photovoltaics, technoeconomic analysis, human exploration mission, mars, radiative transfer, climate model
Citation: Abel AJ, Berliner AJ, Mirkovic M, Collins WD, Arkin AP and Clark DS (2022) Photovoltaics-Driven Power Production Can Support Human Exploration on Mars. Front. Astron. Space Sci. 9:868519. doi: 10.3389/fspas.2022.868519
Received: 02 February 2022; Accepted: 24 March 2022;
Published: 27 April 2022.
Edited by:
Malkeshkumar Patel, Incheon National University, South KoreaReviewed by:
Josep M. Trigo-Rodríguez, Spanish National Research Council (CSIC), SpainMohammad K Akbari, Ghent University, Belgium
Copyright © 2022 Abel, Berliner, Mirkovic, Collins, Arkin and Clark. This is an open-access article distributed under the terms of the Creative Commons Attribution License (CC BY). The use, distribution or reproduction in other forums is permitted, provided the original author(s) and the copyright owner(s) are credited and that the original publication in this journal is cited, in accordance with accepted academic practice. No use, distribution or reproduction is permitted which does not comply with these terms.
*Correspondence: William D. Collins, d2Rjb2xsaW5zQGxibC5nb3Y= Adam P. Arkin, YXBhcmtpbkBsYmwuZ292 Douglas S. Clark, ZHNjQGJlcmtlbGV5LmVkdQ==
†These authors have contributed equally to this work
 Anthony J. Abel
 Aaron J. Berliner
 Mia Mirkovic1,4
 Adam P. Arkin
 Douglas S. Clark