- Indian Institute of Geomagnetism, New Panvel, India
Several observations of electromagnetic ion cyclotron (EMIC) waves have been reported from the Earth’s magnetosphere. It is an important component of space weather research due to its efficient role in precipitating highly energetic electrons from the Earth’s radiation belt. In general, the interplanetary solar wind conditions and geomagnetic activity control the generation of EMIC waves by modifying the ambient plasma conditions in the generation region. Therefore, EMIC wave occurrence patterns observed both in space and on the ground are influenced by the variations in the parameters like auroral electrojet (AE index), solar wind dynamic pressure, and Dst, which represent the magnetospheric conditions. We present a detailed local time distribution of EMIC waves observed at the Antarctic station, Maitri (geographic 70.7oS, 11.8oE, L = 5), for 2011–2017. We have cataloged the EMIC wave occurrence in four frequency ranges (between 0.12–2 Hz) and examined their occurrence pattern for different levels of AE index and solar wind pressure. The present analysis reveals that at the ground station, Maitri, the occurrence of EMIC waves is dominated in the lower frequency range (0.12–1 Hz) with lower occurrence in the higher frequency range (
1 Introduction
The electromagnetic ion cyclotron (EMIC) waves fall into the ultralow frequency range (0.1–5 Hz) commonly referred to as Pc1–Pc2 pulsations. The EMIC waves are known for precipitating the relativistic electrons and ring current ions through pitch angle scattering (Thorne and Kennel, 1971; Summers and Thorne, 2003; Sandanger et al., 2007) and are responsible for ion heating (Horne and Thorne, 1997; Yuan et al., 2014) and proton auroras (Sakaguchi et al., 2015; Ozaki et al., 2021). These waves are generated in the equatorial regions over a wide range of L-shell due to the anisotropic distribution of ring current ions (Cornwall, 1965; Anderson et al., 1996). Different aspects of EMIC waves have been examined using both ground and satellite data to gather more information about their occurrence, characteristics, MLT-azimuthal-radial extent, etc. (Usanova et al., 2008; Posch et al., 2010; Usanova et al., 2013; Mann et al., 2014; Allen et al., 2015; Engebretson et al., 2015; Blum et al., 2017; Yu et al., 2017; Wang et al., 2021). The gyrofrequency of the ion responsible for the generation of the wave determines the frequency band (H+ or He+) of these waves. The global distribution of EMIC wave occurrence has been widely explored by several past satellite missions. The DE-1 spacecraft surveyed the inner magnetosphere (3 > L-shell
After the generation, the EMIC waves propagate along geomagnetic field lines from their source in the equatorial region to the mid- and high-latitude ionosphere. A part of EMIC wave energy can get trapped in the F-region ionospheric duct and propagate horizontally to lower or higher latitudes. Thus, EMIC wave signatures can be observed on the ground as well. However, due to ducted propagation, we do not have any information about L-shell associated with their source locations. Unlike satellite observations, it is difficult to associate the EMIC wave signatures observed on the ground to a particular band (H+ or He+) due to its propagation through ionospheric ducts. However, the EMIC wave event observed on the ground is the manifestation of the EMIC wave generation in the magnetosphere at a particular L-shell. Thus, the ground EMIC wave observations are also widely used to examine the characteristics of these waves. The diurnal distribution has been studied using the ground-based EMIC wave observations from Sodankylāics geophysical observatory (L = 5.2) for the maxima and minima of the 21st solar cycle (Mursula et al., 1991, 1996). These authors also observed two peak structures in the occurrence pattern, but the morning peak was shown by structured and the afternoon–dusk peak by unstructured pulsations. A similar study from an observatory (Davis station, geomagnetic 74.7oS 100.8oE) located in the polar cusp showed a single peak around local noon in the occurrence of the EMIC waves (Morris and Cole, 1991). A recent study by Upadhyay et al. (2020) indicated that the occurrence of EMIC wave peaks around the afternoon–dusk sector. In all the above ground-based studies, not much attention was given to the frequencies of the EMIC waves. Particularly, the local time distribution of EMIC waves in different frequency ranges has not been explored well with the ground observations.
The EMIC waves are typically generated by the temperature anisotropy (T⊥ > T‖) of medium energy (1–100 keV) ring current protons (Kennel and Petschek, 1966). There can be multiple reasons for the enhancement in the anisotropy of the ions; one of the recognized sources is the energetic particle injections into the inner magnetosphere during storms and substorms (Liu et al., 2019). The geomagnetic storms and substorms enhance the earthward convection of ring current ions in the inner magnetosphere, which leads to an increase in the anisotropic distribution of ions and eventually assist in the excitation of the EMIC waves (Criswell, 1969). Another possible source is the solar wind pressure. The compression of the magnetopause due to an increase in solar wind pressure leads to an increase in the anisotropy of the ions by the process of betatron acceleration (McCollough et al., 2010; Fu et al., 2012a,b; Park et al., 2016; Xue et al., 2021). As multiple factors control the generation of EMIC waves, many statistical studies have been conducted using satellite data to understand the role of different interplanetary parameters and magnetospheric conditions in the generation of the EMIC waves. For example, solar wind dynamic pressure pulses contribute positively to the growth of EMIC waves observed on the dayside (Usanova et al., 2012; Remya et al., 2015; Liu et al., 2019). The association of solar wind pressure and EMIC wave generation is reflected in the ground observations as well. A survey of ground EMIC waves has revealed that most of the EMIC wave events were linked with an increase in the solar wind dynamic pressure (Regi et al., 2017). On the contrary, the ion injections from the magnetotail, enhanced convection, and substorms are known to trigger the generation of EMIC waves observed in the dusk side (Jordanova et al., 2001; Kim et al., 2017; Remya et al., 2018). The auroral electrojet (AE) index is one of the proxies, which is used to identify the substorm (Davis and Sugiura, 1966). Meredith et al. (2014) studied the effect of the AE index on the occurrence of H and He band EMIC waves. Keika et al. (2013) have studied the global occurrence of EMIC waves using satellite data and attributed their excitation to two independent processes: 1) externally triggered waves on the dayside that are driven by solar wind pressure and 2) the internally excited waves in the dusk side caused by the energetic ion injections from the midnight sector. In addition, these authors reported that during the quiet time, the occurrence of EMIC waves is more likely in the morning sector. Above all studies hint that overall, the EMIC wave generation is likely in the afternoon, evening, and morning sectors, which are associated with different triggering source mechanisms. Thus, a detailed investigation of the local time distribution of EMIC waves in different frequency ranges to understand underlined physical processes is worthwhile.
In this context, we present the local time distribution of EMIC waves in different frequency ranges and their dependence on the solar wind pressure and auroral electrojet indices using long-term ground observations from the Indian Antarctic station, Maitri. The article is organized as follows: The information about the experimental setup and identification of the EMIC waves are detailed in Section 2. The results are presented in Section 3 and discussed in Section 4. The present work is summarized and concluded in Section 5.
2 Data Used and EMIC Wave Identification
In the present study, we have utilized ground induction coil magnetometer (ICM) data recorded at the Indian Antarctic station, Maitri (geographic lat. 70.7o S, geographic long. 11.8o E, L≈5) for the period of 2011–2017. The ICM consists of three magnetic coil sensors, which record the magnetic field fluctuations in N-S, E-W, and vertical directions. The data are sampled at either 64 Hz or 256 Hz. For each day, the variations in three components of the magnetic field, namely, Bx, By, and Bz are used to get the Fourier spectrogram. The power spectral density in the spectrogram of total magnetic field variation is obtained from B(f, t) = Px(f, t) + Py(f, t) + Pz(f, t). Here, Px(f, t), Py(f, t), and Pz(f, t) are the power spectral densities of individual magnetic field components Bx, By, and Bz, respectively. The spectrogram represents the magnetic field power B(f, t) in the frequency–time domain with the resolution of 0.011 Hz and 18 s, and it is in the units of nT2/Hz. We noticed that at Maitri, the observed EMIC wave frequencies predominantly lie below 2 Hz and occasionally exceed 2 Hz. Therefore, EMIC wave occurrence is noted in four frequency bins as 1) f1 = 0.12–0.5 Hz, 2) f2 = 0.5–1 Hz, 3) f3 = 1–1.5 Hz, and 4) f4 = 1.5– 2 Hz. These frequency limits are not associated with the EMIC wavebands; it is simply to separate EMIC waves into four categories based on the frequencies associated with the EMIC wave observed at ground station Maitri. For each day, we checked the average power in the spectrogram (i.e., ⟨B(f, t)⟩) corresponding to each frequency range. Using the Fourier spectrogram, one can identify the presence/absence of the wave in the Pc1–Pc2 range, and time variations of average power, ⟨B(f, t)⟩ in different frequency ranges allow us to verify whether or not the EMIC wave power is above the noise level. This way, we identified the presence/absence of EMIC waves and cataloged their details like frequency range and start and end time. In our study, we have also used hourly values of solar wind dynamic pressure, and geomagnetic activity indices like AE, Dst, and Kp from OMNIWeb. We would like to highlight the fact that, unlike the satellite observations, the frequency bins used here do not give any direct information about the source ions and generation region of EMIC waves. This is due to the fact that the propagation of EMIC waves along magnetic field lines and their ducting through the ionosphere attenuate wave frequency and amplitude (Johnson and Cheng, 1999; Kim and Johnson, 2016). All ICM data on magnetically quiet days are considered in the present study. A day is considered magnetically quiet if the Ap value for that day or the previous day is less than 20.
As an illustration, we have shown one example of EMIC waves that occurred on 30 April 2017 in Figure 1. Figure 1A shows the Fourier spectrogram of variation in total magnetic field recorded by ICM for the entire day, wherein two distinct EMIC wave events are clearly visible. We have highlighted one EMIC wave event with a dotted rectangle, which has an extended frequency range. In Figure 1B, we have shown an enlarged view of the highlighted event. For this highlighted event, Figure 1C shows the variation of the average power of the Fourier spectrogram (i.e., ⟨B(f, t)⟩) for four different frequency ranges f1 (black), f2 (red), f3 (blue), and f4 (green). The horizontal line at -100 dB represents the cutoff used to select the EMIC wave events with significant power. We have observed that in the Fourier spectrogram, the average power generally falls below -100 dB in the absence of EMIC wave activity. Therefore, we chose this limit. The horizontal dotted line indicates the EMIC wave power above -100 dB (i.e.,
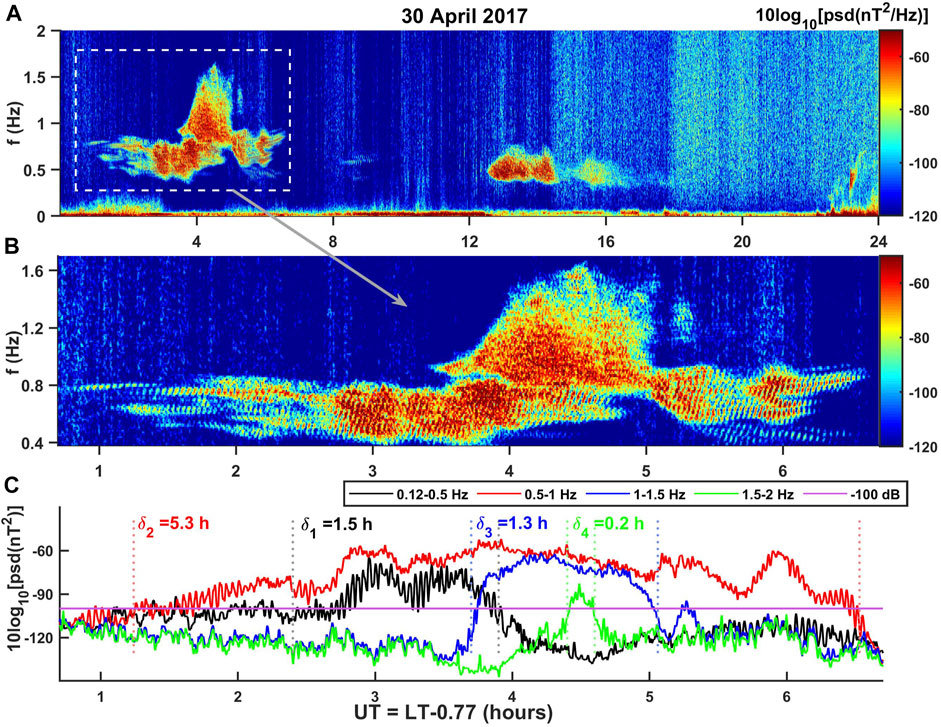
FIGURE 1. (A) Spectrogram of total magnetic field variation on 30 April 2017. The presence of EMIC waves is clearly evident. The power is expressed in dB (i.e., 10 log[psd]). The dotted box marks one EMIC wave event that occurred between 0.6 and 6.6 UT hours, and its enlarged view is depicted in (B). (C) Time variation of average spectrogram power for different frequency ranges, namely, f1, f2, f3, and f4. Here, UT = LT-0.77 h. The intervals of EMIC wave activities are marked with vertical dotted lines. δ1−4, respectively, represents the duration of the EMIC wave in different frequency ranges.

TABLE 1. Duration of EMIC wave occurrence in different frequency ranges as observed at the ground station, Maitri (geographic 70.7oS, 11.8oE, L = 5), for quiet days of 2011–2017.
3 Results
3.1 Local Time Distribution of Electromagnetic Ion Cyclotron Waves
We have examined the overall occurrence of EMIC waves in different frequency ranges at the ground station, Maitri. In this section, we have studied the local time occurrence patterns of EMIC waves for frequency ranges f1, f2, f3, and f4. In Figure 2, we have plotted the time variation of the probability of occurrence of EMIC waves in different frequency ranges. The time resolution on the x-axis is taken as one hour, and for all EMIC wave occurrences in this one hour, a time-bin is added to get the EMIC occurrence during that hour. These probability distribution functions are normalized by the total EMIC wave duration in the respective frequency ranges. It means that the summation of the probability distribution function over the entire time of 0–24 LT hours is always 100%, which corresponds to the total EMIC wave occurrence in respective frequency ranges. For example, in f1, f2, f3, and f4 frequency ranges, the 100% corresponds to 1969, 1083, 125, and 17 h, respectively. Figures 2A,B indicate that for f1 and f2 frequency ranges, the majority of EMIC waves occurred between 12–22 h and 10–18 h, with peak occurrence close to 16 and 14 h, respectively, whereas Figures 2C,D depict that for f3 and f4 frequency ranges, the EMIC wave occurrence is mainly concentrated in the early morning 2–10 h, with a peak around 6 LT hour. It may be noted that in Figure 2B apart from the major peak in EMIC wave occurrence around 14 LT, there is a second peak in occurrence around 5–10 LT. Now the question is how to explain this second peak in the occurrence. Here, the frequency limits chosen to categorize wave events are not stringent rather it is strictly based on the observed EMIC wave frequencies in the ICM data recorded at Maitri. Therefore, some overlap in the trends is expected. However, the likeliness of a shift in peak occurrence of EMIC waves from dusk to dawn sector with an increase in the EMIC wave frequency is clearly evident.
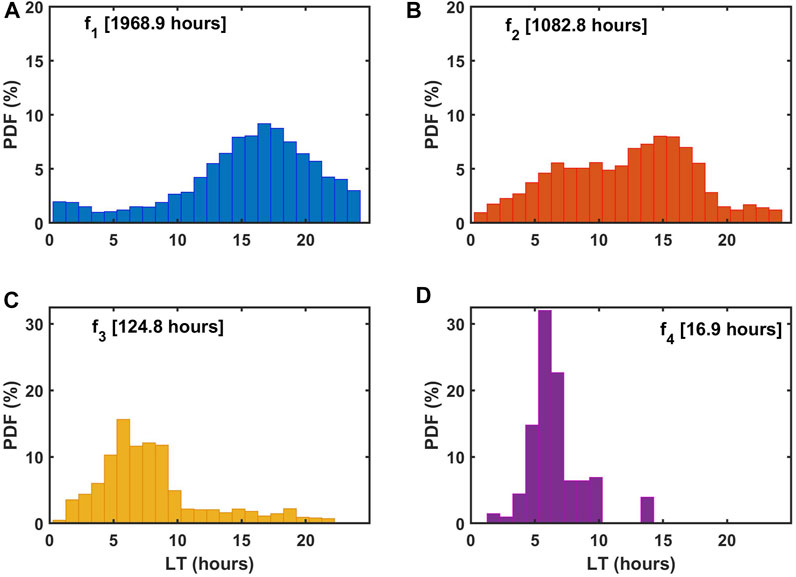
FIGURE 2. Probability distribution function of EMIC wave occurrence in the four frequency ranges: (A) f1, (B) f2, (C) f3, and (D) f4. The total duration of EMIC wave occurrence under each category is mentioned in respective subplots. The peak for maximum occurrence shifts toward morning hours as the frequency increases from f1 to f4.
This analysis suggests that there are two favorable local time regimes for the EMIC wave occurrence on the ground; one in the early morning and another is in the afternoon–evening. The frequency characteristics of the EMIC waves observed in these two preferred time sectors are different. The morning time occurrence is mainly associated with the higher frequency (i.e.,
3.2 Effect of Solar Wind Pressure and AE Index
According to previous studies, solar wind dynamic pressure and substorm activity are the potential sources for the generation of EMIC waves (Halford et al., 2010; Usanova et al., 2012; Kim et al., 2017). Increased solar wind dynamic pressure can generate the required temperature anisotropy in the source ion population and it can also change the magnetic field gradient to reduce the threshold wave amplitude needed for the growth of the EMIC wave (Omura et al., 2010). Recently, Remya et al. (2018) have highlighted the role of substorm injected ions in the generation of EMIC waves. The auroral electrojet AE index is commonly used to identify the substorm activity. Thus, to understand whether or not these parameters control the diurnal distribution of EMIC waves on the ground, we have plotted the local time distribution of EMIC wave occurrence for two levels of solar wind pressure and AE index. The solar wind pressure and AE index during the EMIC wave events are compiled and their probability distribution are shown in Figures 3A,B, respectively. We chose a threshold of 2 nPa for solar wind pressure and 150 nT for AE index to separate EMIC wave events into two categories. As seen in Figure 3, there is a sufficient number of EMIC wave events in both categories of low and high levels of solar wind pressure and AE index.
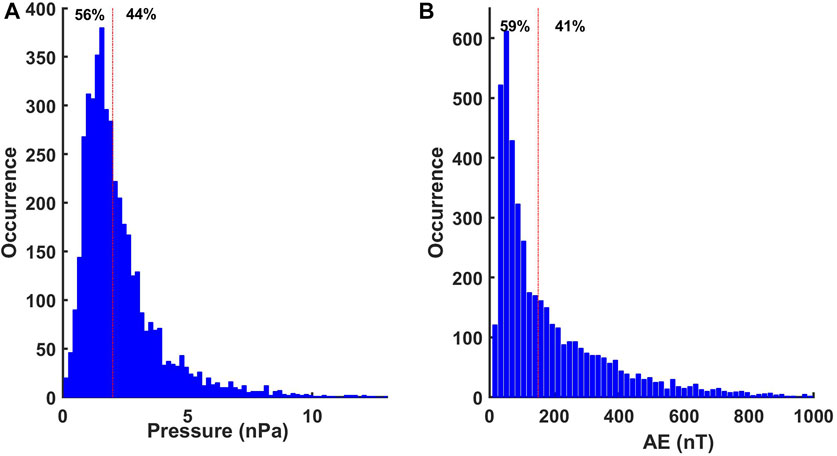
FIGURE 3. Distribution function of values of (A) solar wind pressure and (B) AE index associated with the EMIC wave occurrence. The level of 2 nPa in the solar wind pressure and 150 nT in the AE index is chosen to divide the entire data into two categories. These limits are shown by the red dashed dotted line in respective subplots.
The distribution of EMIC wave occurrence for two levels of solar wind pressure, namely, 1) ≤ 2 nPa (blue color) and 2)
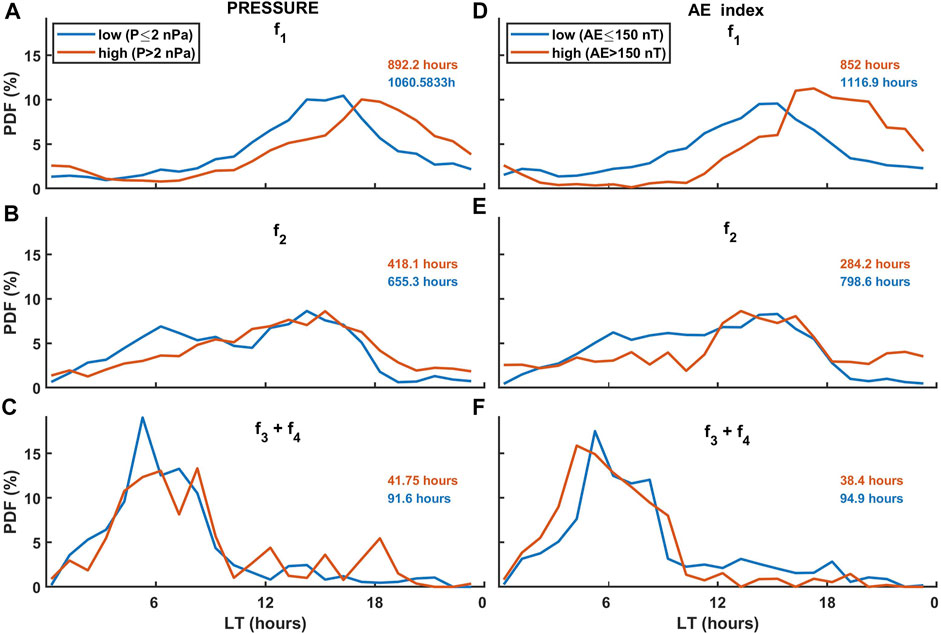
FIGURE 4. Probability distribution function of EMIC wave occurrence for two levels of solar wind pressure, namely, 1)P ≤ 2 nPa (blue color) and 2) P
It is seen that both solar wind pressure and AE index affect the diurnal occurrence of EMIC waves. However, we are dealing with two parameters, that is, solar wind pressure and AE index. In order to establish the role of either of the parameters individually, one has to verify the EMIC wave occurrence for 1) low and high solar wind pressure by imposing limits on AE, and 2) low and high AE index by imposing limits on the solar wind pressure. Since the EMIC wave occurrence in higher frequency ranges (
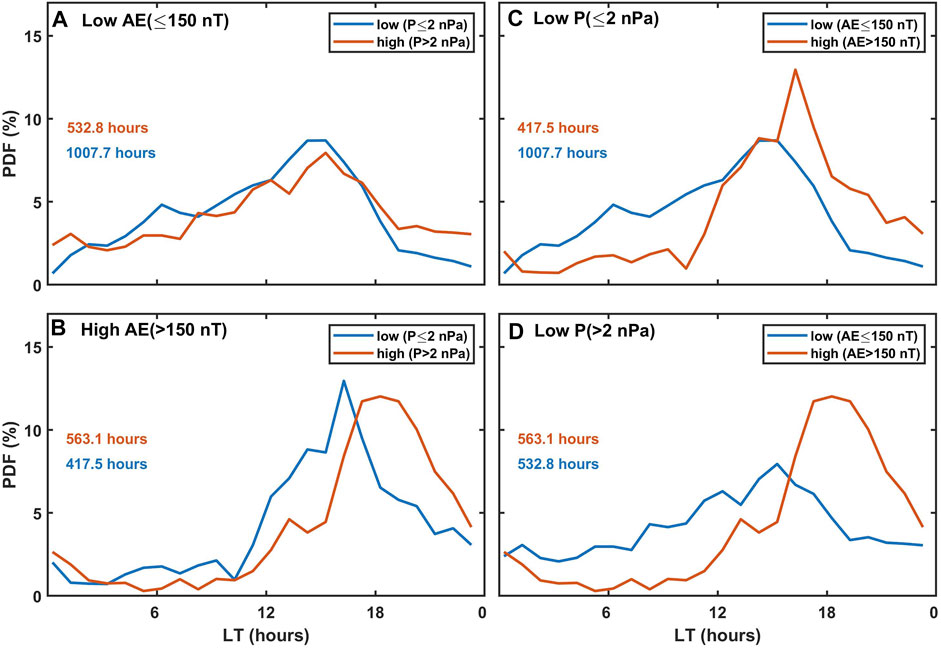
FIGURE 5. Diurnal distribution of EMIC waves is shown for high and low levels of AE by imposing a limit on solar wind pressure, and vice versa. The distribution function of EMIC waves for (A) AE ≤ 150 (B) AE > 150 nT with two levels of solar wind pressure, and the distribution function of EMIC waves for (C) P ≤ 2 nPa and (D) P > 2 nPa with two levels of AE index are plotted. Here, we have considered all EMIC waves associated with the low-frequency range f1 and f2.
Thus, one can say that AE plays a significant role in controlling the diurnal distribution of EMIC waves, and it shifts the peak EMIC wave occurrence toward nighttime. Usanova et al. (2012) have reported a similar observation using the THEMIS data. From their observations, it was seen that for low AE values, the major contribution came from the noon sector (15–21 MLT), but for higher AE values, the contribution from the evening sector (15–21 MLT) is more dominant. It is attributed to the increase in the hot ion population on the night side due to the fresh injection of ions during the increased magnetospheric convection. It has also been proposed that during the high auroral activity, the inner boundary of the ion plasma sheet moves closer to Earth, eventually bringing the drift paths of the injected ions to inner L-shells (Cao et al., 2011). This increases the likelihood of the hot ions passing through the regions of the cold plasma density inside the plasmasphere, thereby making the dusk–midnight sector favorable for the generation of EMIC waves. For the periods of low AE index, the EMIC wave occurrence is dominant in the afternoon sector (14–16 LT hours) for both high and low levels of solar wind pressure (see Figure 5A). In earlier studies, it is suggested that even with a modest pressure pulse the EMIC waves can be generated (Anderson and Hamilton, 1993; Kakad et al., 2019). This might be the reason for getting nearly similar trends of EMIC wave occurrence for low and high solar wind pressure with its peak localized in the afternoon sector.
3.3 Understanding Early Morning Occurrence of Electromagnetic Ion Cyclotron Waves
In the preceding subsection, we noticed that early morning EMIC wave occurrence in the higher frequency range is unaffected by the level of solar wind pressure and AE index. In the past, using ground observations, it was reported that EMIC wave occurrence shifts to the early morning hours in the late recovery phase of the storm, and the associated average frequency of the Pc1 waves is higher than the normal (Bortnik et al., 2008). We verified whether or not a similar tendency is reflected in our statistics of EMIC waves. For this purpose, we carried out epoch analysis and examined the time variation of Kp and Dst indices for 144 h (6 days) before the start of the EMIC wave event. An illustration for this analysis is shown in Figure 6. Spectrogram depicting the presence of EMIC waves in the early morning hours of 1 October 2017 is shown in Figure 6A. The start time, ts, of the EMIC wave event is marked with a vertical dotted line. We shifted the time axis such that Δt = t − ts. Here, Δt = 0 represents the start time of a given EMIC wave event. For 1 October 2017, the variation of Kp and Dst is plotted as a function of Δt in Figures 6B,C, respectively. The maximum in Kp and minimum in Dst prior to Δt = 0 are noted and marked with red asterisks in respective subplots. The time lag τ gives the time of maximum Kp and minimum Dst prior to the occurrence of the EMIC wave. This way we compiled data of Kpmax and Dstmin for all EMIC wave events associated with f1, f2, and f3 + f4 frequency ranges.
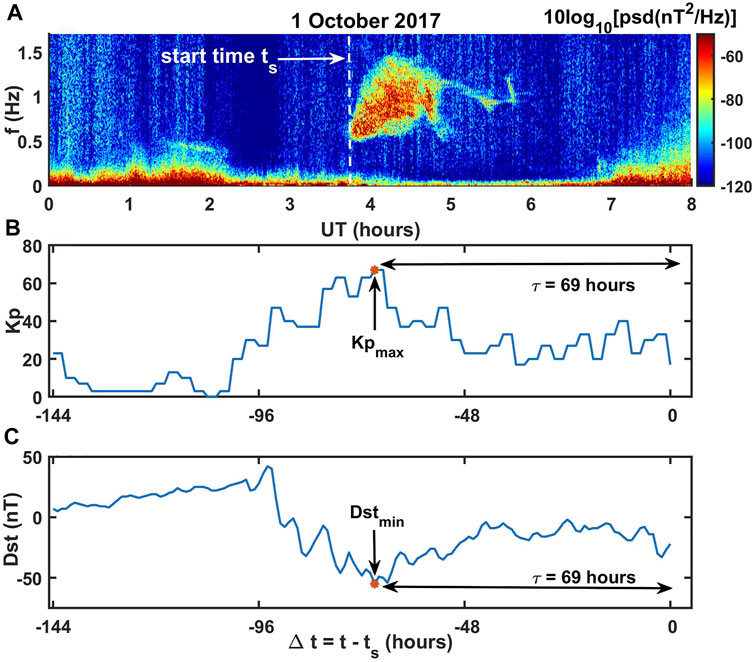
FIGURE 6. Example of the epoch analysis is illustrated. (A) Spectrogram depicts the presence of EMIC waves in the early morning hours of 1 October 2017. The start time of the event is marked as ts. The variations of (B) Kp and (C) Dst for 144 h before the start time ts are plotted as a function of Δt = t − ts. Here, Δt = 0 indicates the start of the EMIC wave event.
In Figures 7A,B the average values of Kp and Dst index as a function of Δt are plotted, respectively, for f1, f2, and f3 + f4 frequency ranges. For each EMIC wave event, we have corresponding value of Kpmax and Dstmin. Figures 7C,D show the plots of the probability distribution function of Kpmax and Dstmin, respectively, for f1, f2, and f3 + f4 frequency ranges. This epoch analysis indicates that average Kp is considerably higher for higher frequency range f3 + f4 than that of f1 and f2. Similarly, the average Dst is lower for higher frequency range f3 + f4 than that of f1 and f2. It is a clear indication that the days on which EMIC wave occurrence is observed in the higher frequency range (
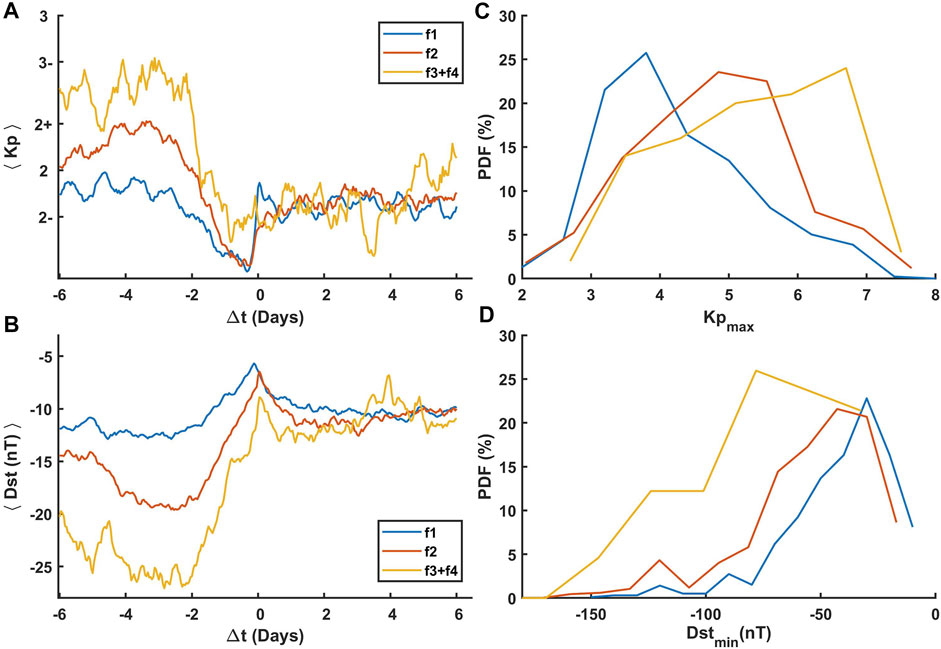
FIGURE 7. Average values of (A) Kp and (B) Dst index for 6 days before and after the EMIC wave events are plotted as a function of Δt = t − ts. Here, Δt = 0 indicates the start of the EMIC wave event. The probability distribution function of (C) maximum Kp and (D) minimum Dst occurring within 6 days prior to the occurrence of EMIC wave event are shown for f1 (blue), f2 (red), and f3 + f4 (yellow) frequency ranges.
4 Discussion
In the present study, we have shown that the EMIC waves are mainly seen during the early morning, afternoon, and evening time sectors. The afternoon and evening time EMIC waves are attributed to magnetospheric compression due to solar wind pressure and nightside particle injection, respectively. Also, these afternoon–evening time EMIC waves are found to be associated with lower frequencies (
Though we have some clue about the possible mechanism responsible for these preferred local times, however, one has to understand the difference in the frequencies for the early morning and afternoon–evening time EMIC waves. Using the AMPTE satellite Anderson et al. (1996), have observed diurnal patterns and reported differences in the characteristics of EMIC waves in the morning and afternoon time. These authors examined the generation conditions and found that actual ion temperature is low and the temperature anisotropy Ap (=T⊥/T‖) is higher during the morning hours in comparison with the afternoon. The relation of wave frequency to gyro frequency is given by Ω = Ωi[Ap/(Ap + 1)]. The value of Ap/(Ap + 1) was 0.37 for the noon event and 0.46 for the morning event. This difference in the temperature anisotropy could be a possible reason to see higher frequency waves during the morning. Moreover, during the afternoon–evening time, the cold plasma density is higher than that to dawn because of the presence of the plasmaspheric plume. High cold plasma density leads to a lower frequency of the waves during the afternoon–evening time (Horne and Thorne, 1994). There could also be a difference in the composition of the source ion population. Satellite studies (Van Allen probe) have also reported more H+ band waves at dawn and He+ band waves at dusk (Gamayunov et al., 2018).
5 Summary and Conclusion
In the present study, we have shown the diurnal distribution pattern of EMIC wave occurrence using seven years of ground observations from the Indian Antarctic station, Maitri. The EMIC waves were identified and their occurrence is noted in four different frequency ranges. Overall occurrence in different frequency ranges is summarized in Table 1. On the ground, we found two preferred local time sectors, namely, morning and afternoon–evening for the occurrence of EMIC waves. The high-frequency
1. The majority of the EMIC wave events observed at ground station Maitri are having a frequency below 1 Hz.
2. The total duration of EMIC wave occurrence in the seven years of the dataset is approximately 1969 h, 1083 h, 125 h, and 17 h in f1 = 0.12–0.5 Hz, f2 = 0.5–1 Hz, f3 = 1–1.5 Hz, and f4 = 1.5–2 Hz frequency ranges, respectively. We noticed that the EMIC wave occurrence on the ground decreases with an increase in the frequency range.
3. The diurnal distribution of EMIC wave occurrence clearly indicates that EMIC wave occurrence in the lower frequency range (
4. On the ground, both solar wind pressure and AE index affect the overall diurnal distribution of EMIC waves in the lower frequency range (f < 1 Hz). The higher AE shifts the EMIC wave occurrence toward the dusk sector. It is attributed to fresh ion injections from the midnight sector during the substorm period, which is considered one of the possible triggering sources for the EMIC waves, whereas the afternoon time occurrence of the EMIC waves is found to be associated with the solar wind pressure, and it is in general agreement with earlier studies.
5. The morning time EMIC waves are less significantly affected by the level of AE index and solar wind pressure. In fact, these morning time high-frequency EMIC wave occurrences are associated with high magnetic activity on the proceeding days.
Recently, Chen et al. (2020) have investigated the role of AE and solar wind pressure separately using satellite observations and found that there exist two local time zones (i.e., afternoon 9–15 MLT and evening 16–20 MLT) for the generation of EMIC waves. The present study clearly indicates that the preferential local time zones reported by satellite for the EMIC wave occurrence are also evident in the ground observations. The study by Mann et al. (2014) has reported that although from the ground magnetometers the wave was 18 + hours long, the satellite coverage showed the wave lasted only for 10−15 min. Satellite observations are susceptible to bias based on their locations and coverage, which can be overcome by long-term ground observations. For a comprehensive picture of EMIC wave distribution and the particle dynamics in the Earth’s magnetosphere, along with satellite studies, such a statistical study of EMIC wave observations using multi-ground stations will be useful, which is left as a future assignment.
Data Availability Statement
The original contributions presented in the study are included in the article/Supplementary Material, further inquiries can be directed to the corresponding author.
Author Contributions
The data analysis and original drafting of the manuscript were done by AU. BK helped in formulating the research problems and helped in interpretations. AK provided comments on the results and overall supervision. RR involved in technical support and data acquisition for ICM instruments.
Conflict of Interest
The authors declare that the research was conducted in the absence of any commercial or financial relationships that could be construed as a potential conflict of interest.
Publisher’s Note
All claims expressed in this article are solely those of the authors and do not necessarily represent those of their affiliated organizations, or those of the publisher, the editors, and the reviewers. Any product that may be evaluated in this article, or claim that may be made by its manufacturer, is not guaranteed or endorsed by the publisher.
Acknowledgments
We thank OMNIWeb team for solar wind data available at http://omniweb.gsfc.nasa.gov and the WDC Kyoto for Dst, Ap, and Kp indices available at http://wdc.kugi.kyoto-u.ac.jp/. We thank the Polar team, IIG, for the ICM data.
References
Allen, R. C., Zhang, J. C., Kistler, L. M., Spence, H. E., Lin, R. L., Klecker, B., et al. (2015). A Statistical Study of Emic Waves Observed by Cluster: 1. Wave Properties. J. Geophys. Res. Space Phys. 120, 5574–5592. doi:10.1002/2015ja021333
Anderson, B. J., Denton, R. E., Ho, G., Hamilton, D. C., Fuselier, S. A., and Strangeway, R. J. (1996). Observational Test of Local Proton Cyclotron Instability in the Earth's Magnetosphere. J. Geophys. Res. 101, 21527–21543. doi:10.1029/96ja01251
Anderson, B. J., Erlandson, R. E., and Zanetti, L. J. (1992). A Statistical Study of Pc 1-2 Magnetic Pulsations in the Equatorial Magnetosphere: 1. Equatorial Occurrence Distributions. J. Geophys. Res. 97, 3075–3088. doi:10.1029/91ja02706
Anderson, B. J., and Hamilton, D. C. (1993). Electromagnetic Ion Cyclotron Waves Stimulated by Modest Magnetospheric Compressions. J. Geophys. Res. 98, 11369–11382. doi:10.1029/93ja00605
Blum, L. W., Bonnell, J. W., Agapitov, O., Paulson, K., and Kletzing, C. (2017). Emic Wave Scale Size in the Inner Magnetosphere: Observations from the Dual Van allen Probes. Geophys. Res. Lett. 44, 1227–1233. doi:10.1002/2016gl072316
Bortnik, J., Cutler, J., Dunson, C., Bleier, T., and McPherron, R. (2008). Characteristics of Low-Latitude Pc1 Pulsations during Geomagnetic Storms. J. Geophys. Res. Space Phys. 113. doi:10.1029/2007ja012867
Cao, J. B., Ding, W. Z., Reme, H., Dandouras, I., Dunlop, M., Liu, Z. X., et al. (2011). The Statistical Studies of the Inner Boundary of Plasma Sheet. Ann. Geophys. 29, 289–298. doi:10.5194/angeo-29-289-2011
Chen, H., Gao, X., Lu, Q., Tsurutani, B. T., and Wang, S. (2020). Statistical Evidence for Emic Wave Excitation Driven by Substorm Injection and Enhanced Solar Wind Pressure in the Earth’s Magnetosphere: Two Different Emic Wave Sources. Geophys. Res. Lett. 47, e2020GL090275. doi:10.1029/2020gl090275
Clausen, L., Baker, J., Ruohoniemi, J., and Singer, H. (2011). Emic Waves Observed at Geosynchronous Orbit during Solar Minimum: Statistics and Excitation. J. Geophys. Res. Space Phys. 116, 16823. doi:10.1029/2011ja016823
Cornwall, J. M. (1965). Cyclotron Instabilities and Electromagnetic Emission in the Ultra Low Frequency and Very Low Frequency Ranges. J. Geophys. Res. 70, 61–69. doi:10.1029/jz070i001p00061
Criswell, D. R. (1969). Pc 1 Micropulsation Activity and Magnetospheric Amplification of 0.2- to 5.0-Hz Hydromagnetic Waves. J. Geophys. Res. 74, 205–224. doi:10.1029/ja074i001p00205
Davis, T. N., and Sugiura, M. (1966). Auroral Electrojet Activity indexAEand its Universal Time Variations. J. Geophys. Res. 71, 785–801. doi:10.1029/jz071i003p00785
Engebretson, M. J., Posch, J. L., Wygant, J. R., Kletzing, C. A., Lessard, M. R., Huang, C. L., et al. (2015). Van allen Probes, Noaa, Goes, and Ground Observations of an Intense Emic Wave Event Extending over 12 H in Magnetic Local Time. J. Geophys. Res. Space Phys. 120, 5465–5488. doi:10.1002/2015ja021227
Erlandson, R. E., and Ukhorskiy, A. J. (2001). Observations of Electromagnetic Ion Cyclotron Waves during Geomagnetic Storms: Wave Occurrence and Pitch Angle Scattering. J. Geophys. Res. 106, 3883–3895. doi:10.1029/2000ja000083
Fu, H., Cao, J., Mozer, F., Lu, H., and Yang, B. (2012a). Chorus Intensification in Response to Interplanetary Shock. J. Geophys. Res. Space Phys. 117. doi:10.1029/2011ja016913
Fu, H. S., Cao, J. B., Zong, Q.-G., Lu, H. Y., Huang, S. Y., Wei, X. H., et al. (2012b). The Role of Electrons during Chorus Intensification: Energy Source and Energy Loss. J. Atmos. solar-terrestrial Phys. 80, 37–47. doi:10.1016/j.jastp.2012.03.004
Gamayunov, K. V., Min, K., Saikin, A. A., and Rassoul, H. (2018). Generation of Emic Waves Observed by Van allen Probes at Low L Shells. J. Geophys. Res. Space Phys. 123, 8533–8556. doi:10.1029/2018ja025629
Halford, A., Fraser, B., and Morley, S. (2010). Emic Wave Activity during Geomagnetic Storm and Nonstorm Periods: Crres Results. J. Geophys. Res. Space Phys. 115, 15716. doi:10.1029/2010ja015716
Horne, R. B., and Thorne, R. M. (1994). Convective Instabilities of Electromagnetic Ion Cyclotron Waves in the Outer Magnetosphere. J. Geophys. Res. 99, 17259–17273. doi:10.1029/94ja01259
Horne, R. B., and Thorne, R. M. (1997). Wave Heating of He+by Electromagnetic Ion Cyclotron Waves in the Magnetosphere: Heating Near the H+-He+bi-ion Resonance Frequency. J. Geophys. Res. 102, 11457–11471. doi:10.1029/97ja00749
Johnson, J. R., and Cheng, C. Z. (1999). Can Ion Cyclotron Waves Propagate to the Ground? Geophys. Res. Lett. 26, 671–674. doi:10.1029/1999gl900074
Jordanova, V. K., Farrugia, C. J., Thorne, R. M., Khazanov, G. V., Reeves, G. D., and Thomsen, M. F. (2001). Modeling Ring Current Proton Precipitation by Electromagnetic Ion Cyclotron Waves during the May 14-16, 1997, Storm. J. Geophys. Res. 106, 7–22. doi:10.1029/2000ja002008
Kakad, A., Kakad, B., Omura, Y., Sinha, A. K., Upadhyay, A., and Rawat, R. (2019). Modulation of Electromagnetic Ion Cyclotron Waves by Pc5 Ulf Waves and Energetic Ring Current Ions. J. Geophys. Res. Space Phys. 124, 1992–2009. doi:10.1029/2017ja024930
Keika, K., Takahashi, K., Ukhorskiy, A. Y., and Miyoshi, Y. (2013). Global Characteristics of Electromagnetic Ion Cyclotron Waves: Occurrence Rate and its Storm Dependence. J. Geophys. Res. Space Phys. 118, 4135–4150. doi:10.1002/jgra.50385
Kennel, C. F., and Petschek, H. E. (1966). Limit on Stably Trapped Particle Fluxes. J. Geophys. Res. 71, 1–28. doi:10.1029/jz071i001p00001
Kim, E. H., and Johnson, J. R. (2016). Full‐wave Modeling of EMIC Waves Near the He + Gyrofrequency. Geophys. Res. Lett. 43, 13–21. doi:10.1002/2015gl066978
Kim, K. H., Omura, Y., Jin, H., and Hwang, J. (2017). A Case Study of Emic Waves Associated with Sudden Geosynchronous Magnetic Field Changes. J. Geophys. Res. Space Phys. 122, 3322–3341. doi:10.1002/2016ja023391
Liu, S., Xia, Z., Chen, L., Liu, Y., Liao, Z., and Zhu, H. (2019). Magnetospheric Multiscale Observation of Quasiperiodic Emic Waves Associated with Enhanced Solar Wind Pressure. Geophys. Res. Lett. 46, 7096–7104. doi:10.1029/2019gl083421
Mann, I. R., Usanova, M. E., Murphy, K., Robertson, M. T., Milling, D. K., Kale, A., et al. (2014). Spatial Localization and Ducting of Emic Waves: Van allen Probes and Ground-Based Observations. Geophys. Res. Lett. 41, 785–792. doi:10.1002/2013gl058581
McCollough, J., Elkington, S., Usanova, M., Mann, I., Baker, D., and Kale, Z. (2010). Physical Mechanisms of Compressional Emic Wave Growth. J. Geophys. Res. Space Phys. 115, 5393. doi:10.1029/2010ja015393
Meredith, N. P., Horne, R. B., Kersten, T., Fraser, B. J., and Grew, R. S. (2014). Global Morphology and Spectral Properties of Emic Waves Derived from Crres Observations. J. Geophys. Res. Space Phys. 119, 5328–5342. doi:10.1002/2014ja020064
Meredith, N. P., Thorne, R. M., Horne, R. B., Summers, D., Fraser, B. J., and Anderson, R. R. (2003). Statistical Analysis of Relativistic Electron Energies for Cyclotron Resonance with Emic Waves Observed on Crres. J. Geophys. Res. Space Phys. 108, 700. doi:10.1029/2002ja009700
Min, K., Lee, J., Keika, K., and Li, W. (2012). Global Distribution of Emic Waves Derived from Themis Observations. J. Geophys. Res. Space Phys. 117, 7515. doi:10.1029/2012ja017515
Morris, R. J., and Cole, K. D. (1991). High-latitude Day-Time Pc1-2 Continuous Magnetic Pulsations: A Ground Signature of the Polar Cusp and Cleft Projection. Planet. Space Sci. 39, 1473–1491. doi:10.1016/0032-0633(91)90076-m
Mursula, K., Anderson, B. J., Erlandson, R. E., and Pikkarainen, T. (1996). Solar Cycle Change of Pc1 Waves Observed by an Equatorial Satellite and on the Ground. Adv. Space Res. 17, 51–55. doi:10.1016/0273-1177(95)00694-a
Mursula, K., Kangas, J., Pikkarainen, T., and Kivinen, M. (1991). Pc 1 Micropulsations at a High-Latitude Station: A Study over Nearly Four Solar Cycles. J. Geophys. Res. 96, 17651–17661. doi:10.1029/91ja01374
Omura, Y., Pickett, J., Grison, B., Santolik, O., Dandouras, I., Engebretson, M., et al. (2010). Theory and Observation of Electromagnetic Ion Cyclotron Triggered Emissions in the Magnetosphere. J. Geophys. Res. 115, 15300. doi:10.1029/2010JA015300
Ozaki, M., Shiokawa, K., Horne, R. B., Engebretson, M. J., Lessard, M., Ogawa, Y., et al. (2021). Magnetic Conjugacy of Pc1 Waves and Isolated Proton Precipitation at Subauroral Latitudes: Importance of Ionosphere as Intensity Modulation Region. Geophys. Res. Lett. 48 (5) e2020GL091384. doi:10.1029/2020gl091384
Park, J. S., Kim, K. H., Shiokawa, K., Lee, D. H., Lee, E., Kwon, H. J., et al. (2016). EMIC Waves Observed at Geosynchronous Orbit under Quiet Geomagnetic Conditions ( Kp ≤ 1). J. Geophys. Res. Space Phys. 121, 1377–1390. doi:10.1002/2015ja021968
Posch, J., Engebretson, M., Murphy, M., Denton, M., Lessard, M., and Horne, R. B. (2010). Probing the Relationship between Electromagnetic Ion Cyclotron Waves and Plasmaspheric Plumes Near Geosynchronous Orbit. J. Geophys. Res. Space Phys. 115, 446. doi:10.1029/2010ja015446
Regi, M., Marzocchetti, M., Francia, P., and De Lauretis, M. (2017). A Statistical Analysis of Pc1–2 Waves at a Near-Cusp Station in antarctica. Earth, Planets and Space 69, 1–16. doi:10.1186/s40623-017-0738-8
Remya, B., Sibeck, D. G., Halford, A. J., Murphy, K. R., Reeves, G. D., Singer, H. J., et al. (2018). Ion Injection Triggered EMIC Waves in the Earth's Magnetosphere. J. Geophys. Res. Space Phys. 123, 4921–4938. doi:10.1029/2018ja025354
Remya, B., Tsurutani, B. T., Reddy, R. V., Lakhina, G. S., and Hajra, R. (2015). Electromagnetic Cyclotron Waves in the Dayside Subsolar Outer Magnetosphere Generated by Enhanced Solar Wind Pressure: Emic Wave Coherency. J. Geophys. Res. Space Phys. 120, 7536–7551. doi:10.1002/2015ja021327
Sakaguchi, K., Shiokawa, K., Miyoshi, Y., and Connors, M. (2015). Isolated Proton Auroras and Pc1/EMIC Waves at Subauroral Latitudes. Am. Geophys. Union (Agu)), 59–70. doi:10.1002/9781118978719.ch5
Sandanger, M., Søraas, F., Aarsnes, K., Oksavik, K., and Evans, D. (2007). Loss of Relativistic Electrons: Evidence for Pitch Angle Scattering by Electromagnetic Ion Cyclotron Waves Excited by Unstable Ring Current Protons. J. Geophys. Res. Space Phys. 112, 138. doi:10.1029/2006ja012138
Summers, D., and Thorne, R. M. (2003). Relativistic Electron Pitch-Angle Scattering by Electromagnetic Ion Cyclotron Waves during Geomagnetic Storms. J. Geophys. Res. Space Phys. 108. doi:10.1029/2002ja009489
Thorne, R. M., and Kennel, C. F. (1971). Relativistic Electron Precipitation during Magnetic Storm Main Phase. J. Geophys. Res. 76, 4446–4453. doi:10.1029/ja076i019p04446
Upadhyay, A., Kakad, B., Kakad, A., Omura, Y., and Sinha, A. K. (2020). Occurrence Characteristics of Electromagnetic Ion Cyclotron Waves at Sub-auroral Antarctic Station Maitri during Solar Cycle 24. Earth, Planets and Space 72, 1–16. doi:10.1186/s40623-020-01157-7
Usanova, M. E., Darrouzet, F., Mann, I. R., and Bortnik, J. (2013). Statistical Analysis of Emic Waves in Plasmaspheric Plumes from Cluster Observations. J. Geophys. Res. Space Phys. 118, 4946–4951. doi:10.1002/jgra.50464
Usanova, M., Mann, I., Bortnik, J., Shao, L., and Angelopoulos, V. (2012). Themis Observations of Electromagnetic Ion Cyclotron Wave Occurrence: Dependence on Ae, Symh, and Solar Wind Dynamic Pressure. J. Geophys. Res. Space Phys. 117, 18049. doi:10.1029/2012ja018049
Usanova, M., Mann, I., Rae, I., Kale, Z., Angelopoulos, V., Bonnell, J., et al. (2008). Multipoint Observations of Magnetospheric Compression-Related Emic Pc1 Waves by Themis and Carisma. Geophys. Res. Lett. 35, 4458. doi:10.1029/2008gl034458
Wang, H., He, Y. F., Lühr, H., and Zhang, J. (2021). Local Time and Longitudinal Differences in the Occurrence Frequency of Ionospheric Emic Waves during Magnetic Storm Periods. J. Geophys. Res. Space Phys. 126, e2020JA028878. doi:10.1029/2020ja028878
Xue, Z., Yuan, Z., and Yu, X. (2021). Prompt Emergence and Disappearance of Emic Waves Driven by the Sequentially Enhanced Solar Wind Dynamic Pressure. Geophys. Res. Lett. 48, e2020GL091479. doi:10.1029/2020gl091479
Yu, X., Yuan, Z., Huang, S., Wang, D., Li, H., Qiao, Z., et al. (2017). Emic Waves Covering Wide L Shells: Mms and Van allen Probes Observations. J. Geophys. Res. Space Phys. 122, 7387–7395. doi:10.1002/2017ja023982
Keywords: EMIC wave, geomagnetic activity, substorm, inner magnetosphere, Pc1-Pc2 pulsations
Citation: Upadhyay A, Kakad B, Kakad A and Rawat R (2022) Effect of Solar Wind Pressure and Substorm Linked Particle Injection on Local Time Distribution of Electromagnetic Ion Cyclotron Waves. Front. Astron. Space Sci. 9:866023. doi: 10.3389/fspas.2022.866023
Received: 30 January 2022; Accepted: 28 March 2022;
Published: 29 April 2022.
Edited by:
Ankush Bhaskar, Vikram Sarabhai Space Centre, IndiaReviewed by:
Huishan Fu, Beihang University, ChinaPeter Haesung Yoon, University of Maryland, College Park, United States
Copyright © 2022 Upadhyay, Kakad, Kakad and Rawat. This is an open-access article distributed under the terms of the Creative Commons Attribution License (CC BY). The use, distribution or reproduction in other forums is permitted, provided the original author(s) and the copyright owner(s) are credited and that the original publication in this journal is cited, in accordance with accepted academic practice. No use, distribution or reproduction is permitted which does not comply with these terms.
*Correspondence: Aditi Upadhyay, YWRpdGl1MTQ3QGdtYWlsLmNvbQ==
 Aditi Upadhyay
 Bharati Kakad
 Amar Kakad
 R. Rawat