- Mullard Space Science Laboratory, Department of Space and Climate Physics, University College London, Dorking, United Kingdom
Electrostatic analyzers resolve the energy-per-charge distributions of charged plasma particles. Some space plasma instruments use electrostatic analyzers among other units, such as aperture deflectors and position sensitive detectors, in order to resolve the three-dimensional energy (velocity) distribution functions of plasma particles. When these instruments do not comprise a mass analyzer unit, different species can be resolved only if there are measurable differences in their energy-per-charge distributions. This study examines the ability of single electrostatic analyzer systems in resolving co-moving plasma species with different mass-per-charge ratios. We consider examples of static plasma consisting of two species of heavy negative ions measured by a typical electrostatic analyzer design, similar to the electron spectrometer on board Cassini spacecraft. We demonstrate an appropriate modeling technique to simulate the basic features of the instrument response in the specific plasma conditions and we quantify its ability to resolve the key species as a function of the spacecraft speed and the plasma temperature. We show that for the parameter range we examine, the mass resolution increases with increasing spacecraft speed and decreasing plasma temperature. We also demonstrate how our model can analyze real measurements and drive future instrument designs.
1 Introduction
The analysis of in-situ plasma observations is almost always necessary in understanding the physical mechanisms in space. Ideally, space plasma observations allow the accurate determination of the distributions of plasma particle velocities, known as the velocity distribution functions (VDFs) of the plasma species. Further analysis of the plasma VDFs is crucial for the investigation of dynamical processes in plasmas, such as plasma heating and acceleration.
Top-hat electrostatic analyzers have been widely used for in-situ plasma observations. In principle, these analyzers resolve the energy-per-charge distributions of plasma ions or/and electrons, in directions covered by the instrument’s field of view. In some applications, electrostatic analyzers resolve the entire energy-per-charge and direction range of the plasma particles, allowing the determination of the three-dimensional (3D) VDFs of plasma particles. This is achieved by combining position sensitive detectors and aperture deflectors (e.g., McComas et al., 2013; Pollock et al., 2016; Owen et al., 2020), or by being mounted on a spinning spacecraft (e.g., McComas et al., 2008) or on a motor-driven actuator (e.g., Young et al., 2004). Some instruments comprise mass analyzer units in order to distinct plasma species with different mass-per-charge (e.g., Nilsson et al., 2007; Barabash et al., 2006; Barabash et al., 2007; Johnstone et al., 1997; McComas et al., 2013).
Electrostatic analyzers without a mass analyzer unit, can still resolve different plasma species from apparent differences in the constructed energy-per-charge distributions. For example, we can often distinguish co-moving protons and alpha particles in the solar wind, in energy-per-charge spectra obtained by electrostatic analyzers (e.g., Nilsson et al., 2007; Ebert et al., 2010; Nicolaou et al., 2014a). In these cases, both species have the same bulk velocity magnitude
In another example, observations by the electron spectrometer of Cassini Plasma Spectrometer (CAPS/ELS, Young et al., 2004) allow the detection of heavy negative ions in the vicinity of Titan (e.g., Coates et al., 2007; Desai et al., 2017; Wellbrock et al., 2013; Wellbrock et al., 2019) and Enceladus plume (e.g., Coates et al., 2010; Haythornthwaite et al., 2020). In these cases, the heavy ion plasma is quasi-static and the bulk velocity of the ions in the spacecraft frame is the spacecraft ram speed, therefore, it is the same for all plasma species. As a result, we can occasionally distinguish species with different mass-per-charge from distinct peaks in the energy-per-charge distribution obtained by the analyzer. However, the achieved mass resolution is a function of the spacecraft speed and the ion temperature. It is then useful to quantify the achieved mass resolution in order to prepare future plasma missions based on specific science requirements. Usually, an instrument’s performance is tested using forward modeling (e.g., Nicolaou et al., 2014a; b; Nicolaou et al., 2014c; Nicolaou et al., 2014b; b, Nicolaou et al., 2020a).
In this paper, we model the response of an electrostatic analyzer in plasmas of heavy negative ions. We analyze the modeled energy-per-charge distributions recorded from the concept instrument in order to quantify the achieved mass resolution as a function of the spacecraft speed and the plasma temperature. In Section 2, we describe the methods we use to simulate the instrument’s response and how we analyze the simulated observations. In Section 3, we present our model results, while in Section 4, we test and demonstrate the application of our model in reproducing flight observations of heavy ions in the plume of Enceladus. Finally, we discuss our findings in Section 5.
2 Methodology
2.1 Instrument Concept
We consider a typical top-hat electrostatic analyzer system design, similar to the CAPS/ELS on board Cassini (Young et al., 2004). Figure 1 shows a diagram of our concept instrument. The top-hat plane lies onto the x-y plane, with the x-axis pointing towards the opposite direction of the spacecraft ram velocity. The z-axis is perpendicular to the top-hat plane and aligned with the symmetry axis of the instrument, completing the right-handed orthogonal reference frame. The energy range of our concept instrument spans from 0.58 eV to 26 keV and is covered in 64 logarithmically spaced steps

FIGURE 1. Schematic of the concept instrument. (A) The top-hat electrostatic analyzer diagram showing the narrow field of view of the elevation direction, the trajectory of a charged particle through the instrument, and the position sensitive detector. The black arrow on the bottom indicates the spacecraft’s velocity direction. (B) View from the top of the eight azimuth anodes which resolve the azimuth direction of the detected particles.
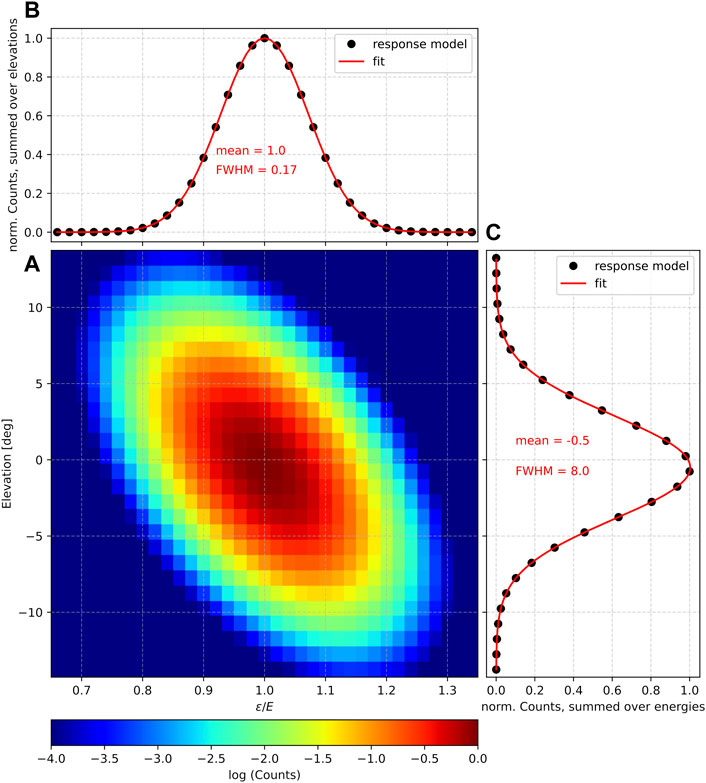
FIGURE 2. Response function of our instrument model. (A) 2D response matrix showing the logarithm of the normalized particle transmission, as a function of the particle elevation direction and as a function the particle energy over the energy setting
2.2 Simulated Observations
We first consider static plasma, consisting of OH− and H2O-OH−, similar to the negative ion plasma in the plumes of Enceladus as observed by the plasma instruments on Cassini (e.g., Coates et al., 2010). The bulk velocity of the plasma particles on the instrument frame is Vsc, resulting from the spacecraft ram motion through the plasma. We further assume that both species have the same number density n and temperature T. We model the velocity (energy) distribution function of the plasma, assuming Maxwellian distributions for both species, as these distributions have been used successfully in the past to describe the plasma in the Saturn’s magnetosphere and moons (e.g., Crary et al., 2009; Livi et al., 2014; Desai et al., 2017). Thus, the velocity distribution for OH− ions is
and for H2O-OH− ions is
In the equations above,
We then calculate the expected (average) counts
Where Aeff is the instrument’s effective aperture which depends on both its geometry and electronic detection efficiency, and Δτ is the measurement acquisition time. The integral ranges over the energy acceptance bandwidth ΔE of each energy step E, the elevation angle acceptance bandwidth ΔΘ, and the azimuth angle acceptance bandwidth ΔΦ of each azimuth sector Φ. The function
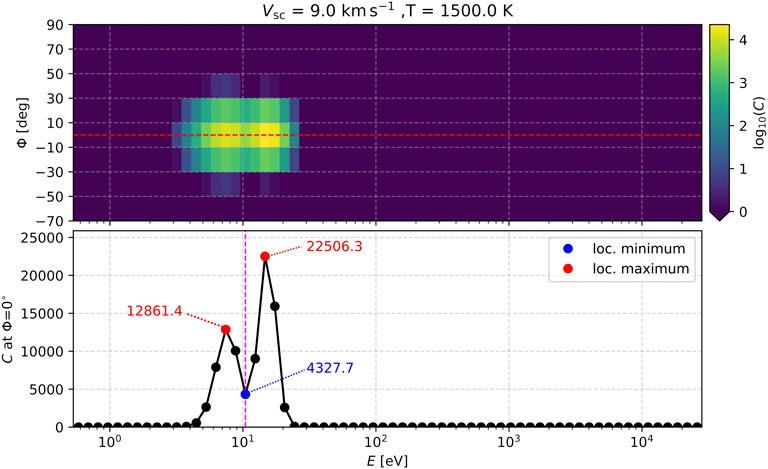
FIGURE 3. (TOP) Logarithm of simulated counts as a function of energy E and azimuth angle
2.3 Simulated Data Analysis
We detect the local maxima and minima (if any) of the simulated counts as a function of energy, obtained at the azimuth sector which observes the anti-ram direction of the spacecraft
3 Model Results
In Figure 4, we show examples of
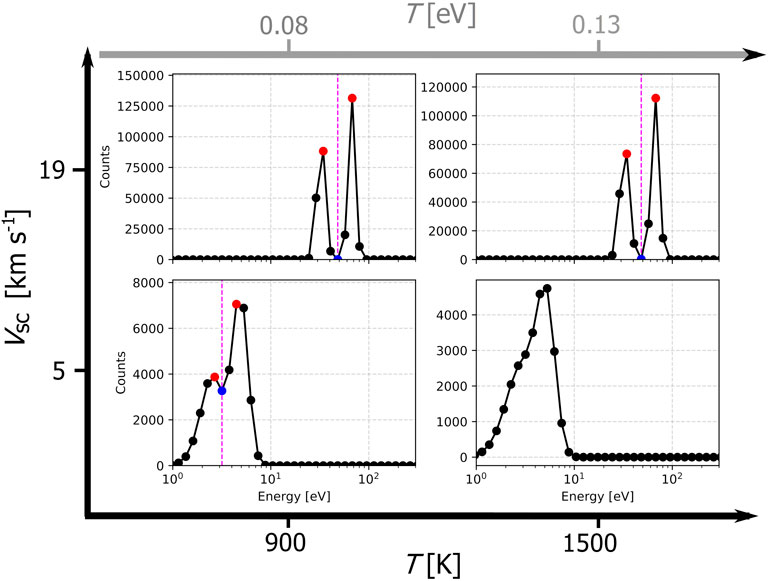
FIGURE 4. Modeled average (expected) counts per energy for the azimuth sector
In Figure 5, we show the logarithm of the relative peak-minimum difference we calculate as explained in Section 2.3, for a range of spacecraft speeds and plasma temperatures. The plot confirms that the two peaks get more prominent as the spacecraft speed increases and/or as the temperature of the two species decreases. The white color on the plot corresponds to Vsc—T combinations for which
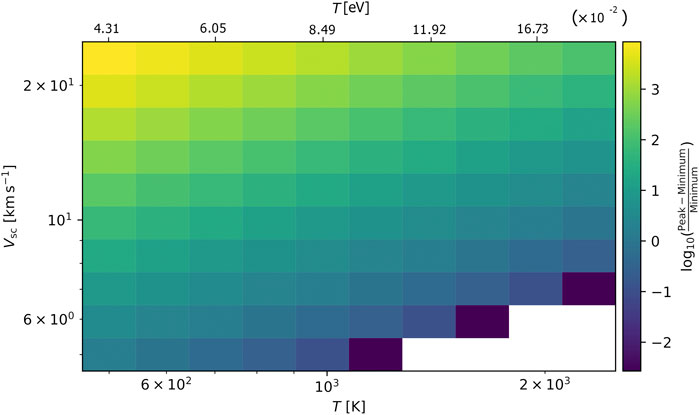
FIGURE 5. Map of the achieved mass resolution index we use in this study (see Section 2.3), as a function of the ion temperature and the spacecraft speed, assuming static plasma, consisting of OH− and H2O-OH−. The mass resolution increases with increasing spacecraft speed and decreasing plasma temperature.
For completeness, we investigate the resolution capabilities for different combinations of heavy ions. In Figure 6, we show the logarithm of the relative peak-minimum difference, for the same range of spacecraft speeds and plasma temperatures as in Figure 5, for four different ion combinations. We specifically examine mass-per-charge ratios of negative ions that are proposed to be abundant in Titan’s ionosphere (Coates et al., 2007). Panel (A) shows the achieved resolution for plasma consisting of two ion species one with mass-per-charge m1/q1 = 26 uq−1 and the other with m2/q2 = 37 uq−1, while panel (B) shows the results for m1/q1 = 26 uq−1 and the other with m2/q2 = 40 uq−1. Similarly, panel (C) shows the achieved resolution for m1/q1 = 16 uq−1 and the other with m2/q2 = 37 uq−1 and panel (D) for m1/q1 = 16 uq−1 and the other with m2/q2 = 40 uq−1. As expected, we can successfully resolve plasma species in lower Vsc and higher plasma temperatures as the mass-per-charge difference of the ions species is larger [moving from panel (A) to (D)]. With our quantitative analysis we predict how sensitive is the achieved resolution on certain parameters for given plasma composition. Although our result is indicative for an ideal instrument response, more sophisticated predictions should include statistical measurement errors and other systematic errors associated with specific sensors.
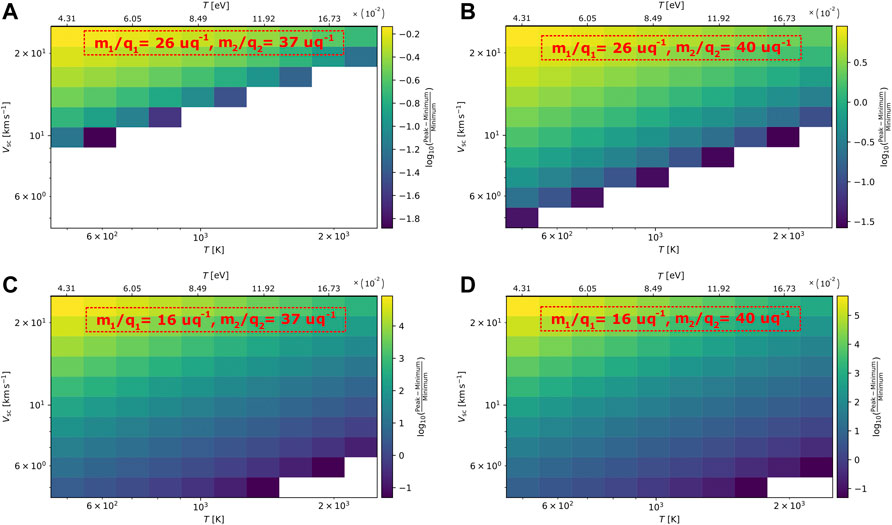
FIGURE 6. Map of the achieved mass resolution index (logarithm of the relative peak-minimum difference), as a function of the ion temperature and the spacecraft speed, assuming static plasma, consisting of two species with different mass-per-charge; (A) m1/q1 = 26 uq−1 and m2/q2 = 37 uq−1, (B) m1/q1 = 26 uq−1 and m2/q2 = 40 uq−1, (C) m1/q1 = 16 uq−1 and m2/q2 = 37 uq−1 and (D) for m1/q1 = 16 uq−1 and m2/q2 = 40 uq−1.
4 Application to Flight Data
We demonstrate how our forward model reproduces observations by the Electron Spectrometer (ELS) sensor of Cassini Plasma Spectrometer (CAPS, Young et al., 2004). The instrument observed fluxes of negative ions in the Enceladus plumes during the Enceladus encounters in 2008 (Coates et al., 2010). The analysis of the observations revealed the abundance of water group negative ions (Haythornthwaite et al., 2020). In Figure 7, we show ELS observations during the Cassini’s E3 flyby, in terms of logarithm of the count rates
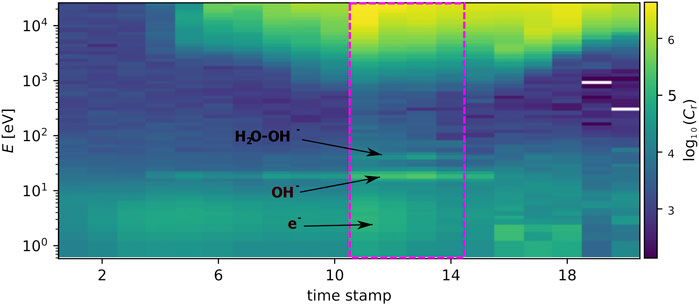
FIGURE 7. Observations of CAPS Electron Spectrometer during the Enceladus encounter on 12-03-2008. The arrows indicate signatures of electrons, OH− and H2O-OH− ions. The magenta square shows a time period in which both OH− and H2O-OH− ions are detected within the energy-per-charge range of the instrument.
In Figure 8, we show the averaged
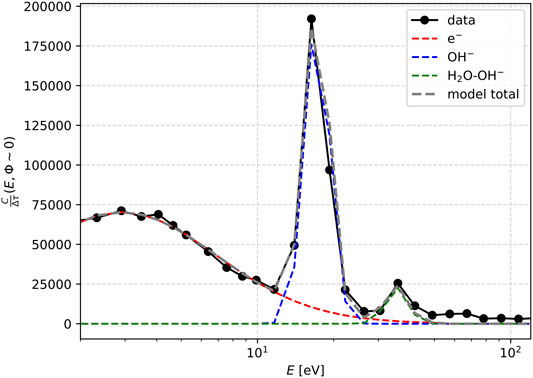
FIGURE 8. Observations by CAPS compared with our model. With black, we show count rates as a function of energy, obtained at azimuth anode 5, which is nearly along the ram direction of the spacecraft, averaged over the four spectra indicated by the magenta square in Figure 7. We show models for the plasma electrons (red), OH− (blue) and H2O-OH− (green) ions. The grey curve corresponds to the sum of the modeled count rates. We assume that all species are stationary, therefore resolved due to the spacecraft velocity.
5 Discussion
We demonstrate the use of an appropriate forward model simulating the expected response of an electrostatic analyzer in the presence of plasma of heavy, negative ions. The development of forward models is not only useful in data-analyses (e.g., Nicolaou et al., 2014b; Nicolaou et al., 2021; Wilson et al., 2008; Wilson et al., 2017, Elliott et al., 2016), but also in testing the performance of the instrument in a range of expected conditions (Kessel et al., 1989; Cara et al., 2017; Nicolaou et al., 2014c; Nicolaou et al., 2014b; Nicolaou et al., 2020a; Nicolaou et al., 2020b; Nicolaou and Livadiotis, 2016). In this study we focus on the ability to resolve key species for plasma science in the vicinity of Enceladus and Titan. For simplicity, we investigate the achieved mass resolution assuming plasma of two species at a time, having the same density n and temperature T and that their bulk kinetic energy in the planetary frame is negligible. We then quantify the mass resolution only as a function of the spacecraft speed Vsc and T. Nevertheless, future studies can use the same analysis methods we use here in order to examine the achieved mass resolution for any instrument design and for a wide range of all the relevant plasma parameters (density, temperature of both species and spacecraft velocity). Our results show that the achieved mass resolution is improved with increasing spacecraft speed and decreasing temperature of the plasma species.
The mass resolution depends on the shape of the measured counts over the energy-per-charge range of the instrument, which depends on the shape of the VDF and the mass of the ions. In our case, the total number of counts is the sum of the two detected species we consider in each example. The
By the definition of the plasma kinetic energy, we expect that the energy resolution of the analyzer is directly related to the achieved mass resolution. We would also like to discuss briefly, how the instrument’s energy resolution drives the achieved mass resolution, considering the same spacecraft speed and plasma temperature. We assume OH− and H2O-OH− plasma of T = 2100 K, measured by an electrostatic analyzer on a spacecraft moving with Vsc = 7 kms−1. We model the expected observations
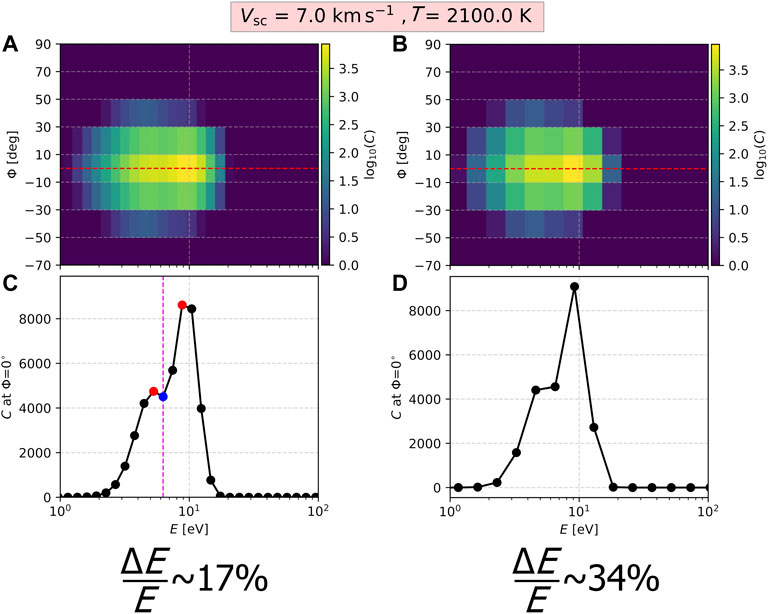
FIGURE 9. Modeled
Finally, in Section 4, we attempted to reproduce observations with clear signatures of heavy negative ions by the electron spectrometer of CAPS on board Cassini. By adjusting the ion bulk parameters, we achieved a good agreement between the model and the observations. This is an encouraging result indicating that our model is not only useful in predicting the performance of current and future instrument designs, but is also appropriate for further dedicated, scientific analysis of existing observations. However, for our demonstration here, we average four spectra together and we ignore the statistical measurement errors. We simplify further by assuming an ideal instrument response and ignoring effects due to spacecraft charging. For a future scientific analysis of the observations, we could develop a fitting algorithm that optimizes the plasma parameters for each spectrum separately, considering the detailed instrument calibration and including spacecraft potential effects which affect the location of the measured peaks (e.g., Anderson et al., 1994; Heelis and Hanson 1998; Bergman et al., 2020). Also, we should consider the statistical measurement error in our evaluation, in cases when the detected number of particles is low. Finally, for generalizing the model in future applications for other plasma environments, we can use different plasma velocity distribution functions, such as kappa distributions (e.g., Livadiotis and McComas, 2013 and references therein).
Data Availability Statement
The datasets presented in this study can be found in online repositories. For this study, we analyzed Cassini CAPS data which are available from the NASA PDS (http://pds.nasa.gov/).
Author Contributions
GN led the data analysis, simulations and paper writing. RH advised on the data analysis and provided useful information and resources. AC provided useful information and resources. All authors read the paper and approved its submission.
Funding
RH is supported by STFC studentship 2062537. AC acknowledges support from MSSL solar system consolidated grant ST/S000240/1
Conflict of Interest
The authors declare that the research was conducted in the absence of any commercial or financial relationships that could be constructed as a potential conflict of interest.
Publisher’s Note
All claims expressed in this article are solely those of the authors and do not necessarily represent those of their affiliated organizations, or those of the publisher, the editors and the reviewers. Any product that may be evaluated in this article, or claim that may be made by its manufacturer, is not guaranteed or endorsed by the publisher.
Acknowledgments
GN thanks Chris J. Owen and Andrew Fazakerley for the helpful discussions.
References
Anderson, P. C., Hanson, W. B., Coley, W. R., and Hoegy, W. R. (1994). Spacecraft Potential Effects on the Dynamics Explorer 2 Satellite. J. Geophys. Res. 99 (A3), 3985–3997. doi:10.1029/93JA02104
Barabash, S., Lundin, R., Andersson, H., Brinkfeldt, K., Grigoriev, A., Gunnel, H., et al. (2006). The Analyzer of Space Plasmas and Energetic Atoms (ASPERA-3) for the Mars Express Mission. Space Sci. Rev. 126, 113–164. doi:10.1007/s11214-006-9124-8
Barabash, S., Sauvaud, J.-A., Gunell, H., Andersson, H., Grigoriev, A., Brinkfeldt, K., et al. (2007). The Analyser of Space Plasmas and Energetic Atoms (ASPERA-4) for the Venus Express Mission. Planet. Space Sci. 55, 1772–1792. doi:10.1016/j.pss.2007.01.014
Bergman, S., Stenberg Wieser, G., Wieser, M., Johansson, F. L., and Eriksson, A. (2020). The Influence of Spacecraft Charging on Low-Energy Ion Measurements Made by Rpc-Ica on Rosetta. J. Geophys. Res. Space Phys. 125, e2019JA027478. doi:10.1029/2019ja027478
Cara, A., Lavraud, B., Fedorov, A., De Keyser, J., DeMarco, R., Marcucci, M. F., et al. (2017). Electrostatic Analyzer Design for Solar Wind Proton Measurements with High Temporal, Energy, and Angular Resolutions. J. Geophys. Res. Space Phys. 122, 1439–1450. doi:10.1002/2016ja023269
Coates, A. J., Crary, F. J., Lewis, G. R., Young, D. T., Waite, J. H., and Sittler, E. C. (2007). Discovery of Heavy Negative Ions in Titan's Ionosphere. Geophys. Res. Lett. 34, L22103. doi:10.1029/2007GL030978
Coates, A. J., Jones, G. H., Lewis, G. R., Wellbrock, A., Young, D. T., Crary, F. J., et al. (2010). Negative Ions in the Enceladus Plume. Icarus 206, 618–622. doi:10.1016/j.icarus.2009.07.013
Crary, F. J., Magee, B. A., Mandt, K., Waite, J. H., Westlake, J., and Young, D. T. (2009). Heavy Ions, Temperatures and Winds in Titan's Ionosphere: Combined Cassini CAPS and INMS Observations. Planet. Space Sci. 57, 1847–1856. doi:10.1016/j.pss.2009.09.006
Desai, R. T., Coates, A. J., Wellbrock, A., Vuitton, V., Crary, F. J., González-Caniulef, D., et al. (2017). Carbon Chain Anions and the Growth of Complex Organic Molecules in Titan's Ionosphere. Astrophys. J. Letters 844, L18. doi:10.3847/2041-8213/aa7851
Ebert, R. W., McComas, D. J., Bagenal, F., and Elliott, H. A. (2010). Location, Structure, and Motion of Jupiter's Dusk Magnetospheric Boundary From ∼625 to 2550 RJ. J. Geophys. Res. 115, A12223. doi:10.1029/2010JA015938
Elliott, H. A., McComas, D. J., Zirnstein, E. J., Randol, B. M., Delamere, P. A., and Livadiotis, G. (2019). Slowing of the Solar Wind in the Outer Heliosphere. Astrophys. J 885, 156. doi:10.3847/0067-0049/223/2/19
Haythornthwaite, R. P., Coates, A. J., Jones, G. H., and Waite, J. H. (2020). Fast and Slow Water Ion Populations in the Enceladus Plume. J. Geophys. Res. Space Phys. 125, e2019JA027591. doi:10.1029/2019ja027591
Heelis, R. A., and Hanson, W. B. (1998). “Measurements of Thermal Ion Drift Velocity and Temperature Using Planar Sensors,” in Measurement Techniques in Space Plasmas: Particles. Editors R. F. Pfaff, J. Borovsky, and D. T. Young. doi:10.1029/GM102p0061
Hill, T. W., Thomsen, M. F., Tokar, R. L., Coates, A. J., Lewis, G. R., Young, D. T., et al. (2012). Charged Nanograins in the Enceladus Plume. J. Geophys. Res. 117, A05209. doi:10.1029/2011ja017218
Johnstone, A. D., Alsop, C., Burge, S., Carter, P. J., Coates, A. J., Coker, A. J., et al. (1997). PEACE: A Plasma Electron and Current Experiment. Space Sci. Rev. 79, 351–398. doi:10.1007/978-94-011-5666-0_13
Jones, G. H., Arridge, C. S., Coates, A. J., Lewis, G. R., Kanani, S., Wellbrock, A., et al. (2009). Fine Jet Structure of Electrically Charged Grains in Enceladus' Plume. Geophys. Res. Lett. 36, L16204. doi:10.1029/2009gl038284
Kessel, R. L., Johnstone, A. D., Coates, A. J., and Gowen, R. A. (1989). Space Plasma Measurements with Ion Instruments. Rev. Sci. Instrum. 60, 3750–3761. doi:10.1063/1.1141075
Livadiotis, G., and McComas, D. J. (2013). Understanding Kappa Distributions: A Toolbox for Space Science and Astrophysics. Space Sci. Rev. 175, 183–214. doi:10.1007/s11214-013-9982-9
Livi, R., Goldstein, J., Burch, J. L., Crary, F., Rymer, A. M., Mitchell, D. G., et al. (2014). Multi-instrument Analysis of Plasma Parameters in Saturn's Equatorial, Inner Magnetosphere Using Corrections for Corrections for Spacecraft Potential and Penetrating Background Radiation. J. Geophys. Res. Space Phys. 119, 3683–3707. doi:10.1002/2013ja019616
Louarn, P., Fedorov, A., Prech, L., Owen, C. J., Bruno, R., Livi, S., et al. (2021). Multiscale Views of an Alfvénic Slow Solar Wind: 3D Velocity Distribution Functions Observed by the Proton-Alpha Sensor of Solar Orbiter. A&A 656, 10. doi:10.1051/0004-6361/202141095
Mandt, K. E., Gell, D. A., Perry, M., Hunter Waite, J., Crary, F. A., Young, D., et al. (2012). Ion Densities and Composition of Titan's Upper Atmosphere Derived from the Cassini Ion Neutral Mass Spectrometer: Analysis Methods and Comparison of Measured Ion Densities to Photochemical Model Simulations. J. Geophys. Res. 117, E10006. doi:10.1029/2012JE004139
McComas, D., Allegrini, F., Bagenal, F., Casey, P., Delamere, P., Demkee, D., et al. (2008). The Solar Wind Around Pluto (SWAP) Instrument Aboard New Horizons. Space Sci. Rev. 140, 261–313. doi:10.1007/s11214-007-9205-3
McComas, D. J., Alexander, N., Allegrini, F., Bagenal, F., Beebe, C., Clark, G., et al. (2013). The Jovian Auroral Distributions Experiment (JADE) on the Juno Mission to Jupiter. Space Sci. Rev. 213, 547–643. doi:10.1007/s11214-013-9990-9
Nicolaou, G., and Livadiotis, G. (2016). Statistical Uncertainties of Space Plasma Properties Described by Kappa Distributions. Entropy 22, 541. doi:10.3390/e22050541
Nicolaou, G., McComas, D. J., Bagenal, F., and Elliott, H. A. (2014a). Properties of Plasma Ions in the Distant Jovian Magnetosheath Using Solar Wind Around Pluto Data on New Horizons. J. Geophys. Res. Space Phys. 119, 3463–3479. doi:10.1002/2013ja019665
Nicolaou, G., Verscharen, D., Wicks, R. T., and Owen, C. T. (2014b). The Impact of Turbulent Solar Wind Fluctuations on Solar Orbiter Plasma Proton Measurements. Astrophys. J. 886, 101. doi:10.3847/1538-4357/ab48e3
Nicolaou, G., Livadiotis, G., Owen, C. J., Verscharen, D., and Wicks, R. T. (2014c). Determining the Kappa Distributions of Space Plasmas from Observations in a Limited Energy Range. Astrophys. J. Letters 864, 3. doi:10.3847/1538-4357/aad45d
Nicolaou, G., Wicks, R., Livadiotis, G., Verscharen, D., Owen, C., and Kataria, D. (2020a). Determining the Bulk Parameters of Plasma Electrons from Pitch-Angle Distribution Measurements. Entropy 22, 103. doi:10.3390/e22010103
Nicolaou, G., Wicks, R. T., Rae, I. J., and Kataria, D. O. (2020b). Evaluating the Performance of a Plasma Analyzer for a Space Weather Monitor Mission Concept. Space Weather 18, e2020SW002559.
Nicolaou, G., Wicks, R. T., Owen, C. J., Kataria, D. O., Chandrasekhar, A., Lewis, G. R., et al. (2021). Deriving the Bulk Properties of Solar Wind Electrons Observed by Solar Orbiter. A Preliminary Study of Electron Plasma Thermodynamics. A&A. Forthcom. Artic 656, A31. doi:10.1051/0004-6361/202140875
Nilsson, H., Lundin, R., Lundin, K., Barabash, S., Borg, H., Norberg, O., et al. (2007). RPC-ICA: The Ion Composition Analyzer of the Rosetta Plasma Consortium. Space Sci. Rev. 128, 671–695. doi:10.1007/s11214-006-9031-z
Owen, C. J., Bruno, R., Livi, S., Louarn, P., Al Janabi, K., Allegrini, F., et al. (2020). The Solar Orbiter Solar Wind Analyser (SWA) Suite. A&A 642, A16. doi:10.1051/0004-6361/201937259
Pollock, C., Moore, T., Jacques, A., Burch, J., Gliese, U., Saito, Y., et al. (2016). Fast Plasma Investigation for Magnetospheric Multiscale. Space Sci. Rev. 199, 331–406. doi:10.1007/s11214-016-0245-4
Wellbrock, A., Coates, A. J., Jones, G. H., Lewis, G. R., and Waite, J. H. (2013). Cassini CAPS-ELS Observations of Negative Ions in Titan's Ionosphere: Trends of Density with Altitude. Geophys. Res. Lett. 40, 4481–4485. doi:10.1002/grl.50751
Wellbrock, A., Coates, A. J., Jones, G. H., Vuitton, V., Lavvas, P., Desai, R. T., et al. (2019). Heavy Negative Ion Growth in Titan's Polar Winter. MNRAS 490, 2254–2261. doi:10.1093/mnras/stz2655
Wilson, R. J., Bagenal, F., and Persoon, A. M. (2017). Survey of Thermal Plasma Ions in Saturn's Magnetosphere Utilizing a Forward Model. J. Geophys. Res. Space Phys. 122, 7256–7278. doi:10.1002/2017ja024117
Wilson, R. J., Tokar, R. L., Henderson, M. G., Hill, T. W., Thomsen, M. F., and Pontius, D. H. (2008). Cassini Plasma Spectrometer Thermal Ion Measurements in Saturn's Inner Magnetosphere. J. Geophys. Res. 113, A12218. doi:10.1029/2008ja013486
Keywords: plasma physics, instrumentation, planetary physics, Methods, plasma modeling
Citation: Nicolaou G, Haythornthwaite RP and Coates AJ (2022) Resolving Space Plasma Species With Electrostatic Analyzers. Front. Astron. Space Sci. 9:861433. doi: 10.3389/fspas.2022.861433
Received: 24 January 2022; Accepted: 28 April 2022;
Published: 08 June 2022.
Edited by:
Konstantinos Dialynas, Academy of Athens, GreeceReviewed by:
Elias Roussos, Max Planck Institute for Solar System Research, GermanyNickolay Ivchenko, Royal Institute of Technology, Sweden
Copyright © 2022 Nicolaou, Haythornthwaite and Coates. This is an open-access article distributed under the terms of the Creative Commons Attribution License (CC BY). The use, distribution or reproduction in other forums is permitted, provided the original author(s) and the copyright owner(s) are credited and that the original publication in this journal is cited, in accordance with accepted academic practice. No use, distribution or reproduction is permitted which does not comply with these terms.
*Correspondence: Georgios Nicolaou, Zy5uaWNvbGFvdUB1Y2wuYWMudWs=
 Georgios Nicolaou
 Richard P. Haythornthwaite
 Andrew J. Coates