 Rossella Ragusa1,2*
 Marco Mirabile2,3
 Marilena Spavone1Michele Cantiello3
 Enrichetta Iodice1
 Antonio La Marca4,5Maurizio Paolillo1,2Pietro Schipani1
- 1INAF—Astronomical Observatory of Capodimonte, Naples, Italy
- 2University of Naples Federico II, C. U. Monte Sant’Angelo, Naples, Italy
- 3INAF—Astronomical Observatory of Abruzzo, Groningen, Netherlands
- 4Kapteyn Institute, University of Groningen, AD Groningen, Netherlands
- 5SRON Netherlands Institute for Space Research, AD Groningen, Netherlands
In this paper we present the deep, wide-field and multi-band imaging of the LEO I pair NGC 3379-NGC 3384, from the VST Early-type GAlaxy Survey (VEGAS). The main goal of this study is to map the intra-group baryons in the pair, in the form of diffuse light and globular clusters (GCs). Taking advantage from the large covered area, which extends for ∼ 3.9 square degrees around the pair, and the long integration time, we can map the light distribution out to ∼ 63 kpc and down to ∼ 30 mag/arcsec2 in the g band and ∼ 29 mag/arcsec2 in the r band, deeper than previous data available for this target. The map of the intra-group light (IGL) presents two very faint (μg ∼ 28-29 mag/arcsec2) streams protruding from the brightest group member NGC 3379 and elongated toward North-West and South. We estimate that the fraction of the stellar halo around NGC 3379 plus the intra-group light is
1 Introduction
It has been known for many years that in the ΛCDM model the cosmic structures are formed and evolve according to the hierarchical accretion scenario. With this paradigm, the latest and largest gravitationally bound systems in the Universe, i.e. galaxy clusters, are the result of past merging events of smaller elements, the galaxy groups (De Lucia et al., 2006), that differ from the galaxy clusters, in the local Universe, for the different values of viral masses (Mvir), which range from ∼ 1013 M⊙ for galaxy groups to ∼ 1015 M⊙ for galaxy clusters (Bower et al., 2004). In this framework, groups are interesting environments for studying the galaxy evolution, since they are the place where galaxies spend most of their evolutionary life (Miles et al., 2004; Robotham et al., 2011).
Galaxy groups are more abundant than galaxy clusters, and most galaxies in the local Universe, about 55%, are found in group environments (Eke et al., 2004). The whole scenario of groups or clusters mass assembly is tricky, involving many different physical mechanisms. During the infall of smaller system in larger ones, such as galaxies in clusters or groups, stars can be ripped out from the progenitor galaxies and some galaxies can also be totally destroyed. In addition, in a dense environment, the mutual interaction among galaxies can build up tidal structures such as tails, shells, bridges or tidal dwarf galaxies of baryonic matter stripped away from the outer parts of the interacting galaxies.
During the assembly process, the stripped baryons can be in part reabsorbed by the parent galaxies and can in part merge into the Brightest Galaxy of the Group/Cluster (BGG, BCG) or in other massive members. The remaining part of the stripped material gets trapped in the group/cluster potential well and forms the extended, diffuse and very faint (μg ≥ 26.5 mag/arcsec2) component known as intragroup or intracluster diffuse light (IGL, ICL) (Rudick et al., 2009; Cui et al., 2013; Contini et al., 2014; Montes and Trujillo, 2014; Mihos, 2015; DeMaio et al., 2018; Montes and Trujillo, 2018; Pillepich et al., 2018; Henden et al., 2019a; Contini et al., 2019; Jiménez-Teja et al., 2019; Montes and Trujillo, 2019; DeMaio et al., 2020). In groups, the dynamical timescale is longer and IGL imprint (i.e. the stripped material) remains for many Gyrs (Watkins et al., 2014). According to this scenario, the IGL, the precursor of the ICL, can be considered as a fossil record of past interaction events [e.g., (Adami et al., 2005; Mihos, 2015; Cañas et al., 2020)]. The IGL (ICL) inhabits the intragroup (intracluster) space between the galaxies and it is bound only to the group’s (cluster’s) potential well, and to none of the galaxies that build up the systems. Based on this assumption, ICL has also been used as a luminous tracer for dark matter [e.g., (Montes and Trujillo, 2018; Montes and Trujillo, 2019)].
The amount of IGL provides clear information on the dynamical evolution of the structures also because it traces the accretion history of the system and the tidal encounters (Merritt, 1984). Numerical simulations suggest that a larger amount of IGL (ICL) is expected when numerous interactions and encounters between the galaxies of the group (clusters) happen (Conroy et al., 2007; Murante et al., 2007; Purcell et al., 2007; Puchwein et al., 2010; Rudick et al., 2011; Contini et al., 2014; Cooper et al., 2015). Recent studies revealed a fraction of diffuse light in a range of 10–50% of the total cluster light, despite these estimates are affected by large uncertainties (see e.g., Montes (Montes, 2019) for a recent literaure review on the history of the ICL). The observational studies on the distribution of ICL and its physical properties (e.g., amount, color) are fundamental to set constrains for numerical simulations (Lin and Mohr, 2004; Arnaboldi and Gerhard, 2010; Contini et al., 2014; Pillepich et al., 2018; Contini and Gu, 2020), and to reduce the discrepancy between observations and cosmological simulations on the baryon component of the Universe (Buote et al., 2016).
An aspect that is still much debated in literature, both from a theoretical and observational side, regards how the ICL fraction relates to the virial mass (Mvir) of the host environment (Montes, 2019; Contini, 2021). From a theoretical point of view, Lin and Mohr (Lin and Mohr, 2004), Murante et al. (Murante et al., 2007), Purcell et al. (Purcell et al., 2007) and Henden et al. (Henden et al., 2019b) found a slight increase in the ICL fraction in systems with higher Mvir. In particular, Purcell et al. (Purcell et al., 2007) estimated that the ICL fraction increased from 20%, in halos with Mvir = 1013M⊙, to 30% in halos with Mvir = 1015M⊙. In contrast, Sommer-Larsen (Sommer-Larsen, 2006), Monaco et al. (Monaco et al., 2006), Dolag et al. (Dolag et al., 2010), Henriques and Thomas (Henriques and Thomas, 2010), Rudick et al. (Rudick et al., 2011), Contini et al. (Contini et al., 2014) found a fraction of ICL in a range between 20 and 40% for all values of Mvir ∼ 1013 − 1015M⊙. Cui et al. (Cui et al., 2013) indicated a slight decrease of the ICL fraction with increasing Mvir.
On the observational side, Sampaio-Santos et al. (Sampaio-Santos et al., 2020) for a sample of 528 clusters at 0.2 ≤ z ≤ 0.35, didn’t find an increasing dependence between the amount of ICL and Mvir. Also from observations in the local Universe (z ≤ 0.05) it seems there is no evident relationship between the ICL fraction and the Mvir [e.g., (Ragusa et al., 2021), and reference therein]. A large scatter is observed, where high ICL amount (∼ 30–45%) occurs both in groups with and in massive clusters of galaxies, like Fornax and Antlia (Ragusa et al., 2022 in preparation), as well as low ICL amount (∼ 5–10%) results both in groups and in massive clusters of galaxies, like Coma and Abell85 (Jiménez-Teja et al., 2019; Montes et al., 2021). This scatter might depend on the different concentration (i.e. compact groups vs loose groups) and on the different formation time of the particular halo in which the ICL lies [see the review of (Contini, 2021), for more details]. Indeed, more dynamically evolved systems, should host a larger fraction of ICL, as stellar stripping and mergers are more frequent [e.g. (Murante et al., 2007; Rudick et al., 2011; Martel et al., 2012; Contini et al., 2014)].
In the last 2 decades, thanks to enhancement of new deep photometric surveys, a great contribution was provided to the study of low-surface brightness (LSB) structures in galaxy groups/clusters out to the intragroup-intracluster space, and in particular to the detection of the ICL [e.g. (Pierce and Tully, 1985; Ferrarese et al., 2012; van Dokkum et al., 2014; Duc et al., 2015; Muñoz et al., 2015; Fliri and Trujillo, 2016; Merritt et al., 2016; Trujillo and Fliri, 2016; Watkins et al., 2016; Mihos et al., 2017; Huang et al., 2018; Montes and Trujillo, 2019; Zhang et al., 2019; DeMaio et al., 2020; Martinez-Delgado et al., 2021; Montes et al., 2021)]. The VST Early-type GAlaxy Survey (Capaccioli et al., 2015) takes its place in this context as a pivotal survey with an increasingly important role in the development of the deep and wide-field photometry. VEGAS1 is a multi-band u, g, r, i imaging survey, able to map the surface brightness of galaxy down to the azimuthally averaged surface brightness μg ∼ 31 mag arcsec−2 and out to ∼ 15 effective radii (Re) [see (Iodice et al., 2017; Spavone et al., 2018; Iodice et al., 2019a; Cattapan et al., 2019; Iodice et al., 2020; Raj et al., 2020; Spavone et al., 2020; Ragusa et al., 2021), and references therein]. In this work we present new deep data of the LEO I pair, NGC 3379-NGC 3384, as part of the VEGAS sample. The new multi-band images represent the deepest data available for this target. These allowed us to map the distribution of the IGL and GCs, and to study the physical properties of these tracers in the intra-group region.
This work is organized as follows. In Section 1.1 we introduce the target and the previous studies available in the literature. In Section 2 we present the observations and the data reduction. In Section 3 we describe in detail the method used for the data analysis (i.e. the surface photometry and GCs detection). In Section 4 we illustrate the results on the intra-group baryons (diffuse light and GCs) in the LEO I pair NGC 3379-NGC 3384 and compare our results with the previous studies, both on the observational and theoretical side. Finally, in Section 5 we discuss our results and draw the main conclusions of this work.
1.1 The LEO I Pair NGC 3379-NGC 3384
The galaxies NGC 3379-NGC 3384 are members of the LEO I group. This is a very loose group composed, at least, of 11 bright galaxies where seven out of the total, including NGC 3379 (BGG) and NGC 3384, are associated with the subgroup NGC 3368 (M96) centered on the BGG. The other four galaxies are members of the LEO triplet (de Vaucouleurs, 1975). In addition to both early and late morphological types of galaxies (ETGs, LTGs), a large number of dwarf galaxies have been revealed by Müller et al. (Müller et al., 2018). There is extensive literature on the LEO I group, in particular about the presence of a fragmented ring of neutral hydrogen surrounding the pair NGC 3379-NGC 3384, with a radius of about 100 kpc. The debate on the history of the formation and evolution of this HI ring is still open and controversial. To date, no optical counterpart has been detected, except for three far and near-ultraviolet small sources (Thilker et al., 2009) residing in the high density region of the HI map (Schneider et al., 1986). Schneider (Schneider, 1985) studied the kinematics of the HI gas in the ring, providing an elliptical orbit centered in the light-weighted barycenter between NGC 3379 and NGC 3384. According to this kinematic model, the rotation period of the structure should be
The most recent estimate of the IGL amount in the LEO I group is provided by Hartke et al. (Hartke et al., 2020), using photometric and kinematic data of the planetary nebulae (PNe). They derived ∼ 4% as a lower limit for the amount of IGL, updating the previous estimate of 1.6% predicted by Castro-Rodríguez et al. (Castro-Rodríguez et al., 2003), also using the PNe as discrete tracers for the diffuse intra-group light.
Other studies of the LEO I pair were conducted by Harris et al. (Harris et al., 2007), who found evidence of a transition from a metal rich stellar population to a metal poor stellar population towards the outside of the NGC 3379 stellar halo. Indeed Harris et al. (Harris et al., 2007) found a range of [Fe/H] ∼ 1.3 to 1.5 for the NGC 3379 stellar halo, more metal poor than the inner regions. This result was confirmed later by Lee and Jang (Lee and Jang, 2016), who supported the existence of two different sub-populations of GCs both in colour and metallicity in the halo of NGC 3379: a dominant, red, metal rich population and a much fainter, blue, metal poor one. The origin of the stellar halo is still much debated. The most accredited scenario proposed by Lee and Jang (Lee and Jang, 2016), foresees two phases: the red and metal rich halo was formed through in situ star formation and/or accretion via major mergers of massive progenitors, while the blue and metal poor halo occurred through dissipationless mergers and accretion events.
1.2 Deep VEGAS Images of the LEO I Pair
The LEO I pair is a target of VEGAS, a multi-band u, g, r and i imaging survey, carried out with the Very Large Telescope Survey Telescope (VST). The VST is a 2.6 m wide field optical telescope (Schipani et al., 2012) equipped with OmegaCAM, a one square degree camera with a resolution of 0.21 arcsec pixel−1. Figure 1 shows the sky-subtracted color composite g, r and i VST image obtained for LEO I pair. The bright spiral galaxy NGC 3389, also visible in the field-of-view (FOV) SW of NGC 3379, is a background source and it is not part of the group.
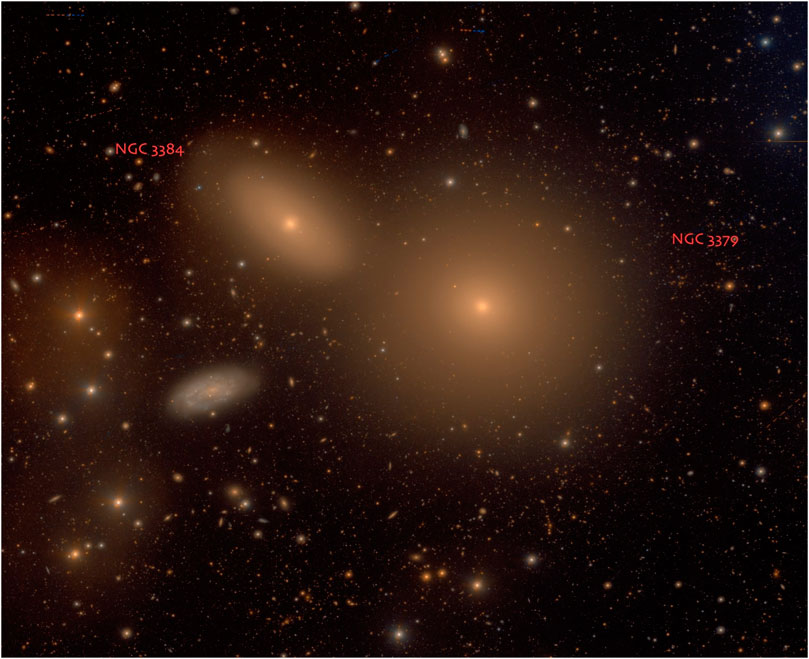
FIGURE 1. Color composite (gri) VST image of the central regions of LEO I pair. The image size is 40,×,37 arcmin. North is up and East is to the left. The two brightest group members are labelled in red on the image.
The data used in this paper were acquired in service mode (run IDs: 096. B-0582(B), 097. B-0806(A), 090. B-0414(D)), in clear conditions during the dark time, with an average seeing of FWHM ∼ 1.0 arcsec in the u band, FWHM ∼ 1.00 arcsec in the g band, FWHM ∼ 0.81 arcsec in the r band and FWHM ∼ 0.95 arcsec in the i band. The total integration times are: 2.04 h in u band, 2.13 h in g band, 2.06 h in r band and 0.35 h in i band. The surface brightness depths at 5σ over the average seeing area listed above are about μu = 24 mag/arcsec2, μg = 25 mag/arcsec2, μr = 24.5 mag/arcsec2 (Iodice et al., 2021). The point source depth at 80% completeness level is 24.38 mag, 25.04 mag, 24.85 mag, 23.44 mag, in the u, g, r and i band, respectively.
In the LSB regime, a fundamental step is the estimate of the sky background contribution. To this aim, the step-dither observing sequence is adopted. It consists of a cycle of short exposures (150 s), both on the target (science frame) and the sky (offset frame). The latter is used to estimate the sky background contribution. This turned to be the best strategy to analyze the fields with very bright galaxies, having a very extended envelope [see e.g. (Iodice et al., 2016; Spavone et al., 2017a; Iodice et al., 2019b)]. In this particular approach, the offset frame is taken as close as possible, in space and time, to the science frame (offset by ± 1°), but far enough from the central bright galaxies, to avoid taking into account the diffuse light of the extended envelope of the galaxies and IGL. The data reduction was carried out by using the VST − Tube pipeline (Grado et al., 2012), which is described in detail by Capaccioli et al. (Capaccioli et al., 2015) and Spavone et al. (Spavone et al., 2017a).
The VST mosaic covers an area of 3.65 square degrees centered on the LEO I pair. In Figure 2 we present the deep VST image in r band, of 1.34 × 1.05 square degree, centred on the LEO I pair. The main properties of the two galaxies are listed in Table 1. In this paper we adopted for LEO I pair the same average distance of the BGG, 10.23 ± 0.08 Mpc (Lee and Jang, 2016), so one arcsec corresponds to ∼ 0.05 kpc. The extinction-corrected (Schlafly and Finkbeiner, 2011) magnitudes through-out the paper are in the AB system.
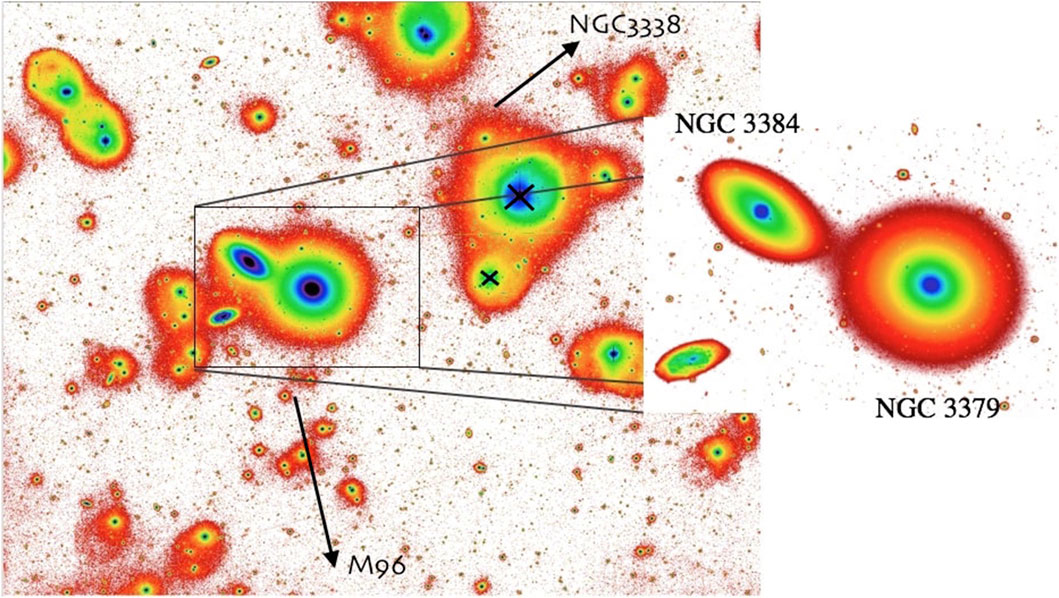
FIGURE 2. Deep VST image, of 1.34 × 1.05 square degree, in the r band centred on NGC 3379, used for the analysis described in this paper. North is up and East is to the left. The black crosses mark the center of the two brighter stars in the field. The two black arrows represent the direction of M96 and NGC 3338, being these two other brighter galaxies of the Leo I group. The two galaxies that compose the pair are indicated in the enlarged panel shown on the right.
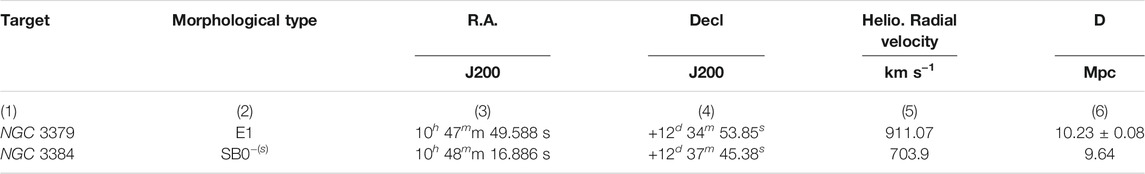
TABLE 1. Properties of the galaxies in the LEO I pair. Note. Column 1 report the name of the two LEO I pair members. In Col. Two is given the morphological type. In Cols. Three and four are listed the celestial coordinates of each group member. In Col. Five is listed the heliocentric radial velocity, and in Col. Six is reported the distances of the pair members. The distance for NGC 3384 was estimated using the relationship: D = VHe
1.3 Data Analysis: Surface Photometry and GCs Detection
The science goals of this study are to map the intra-group baryons made by diffuse light and GC systems. In particular, we aim at estimating the IGL contribution to the total luminosity of the group and to provide its g − r color. To this aim the crucial task is to separate the contribution of the IGL from that of the scattered light by the foreground/background sources and by the light belonging to the group members. The main steps we performed for the data analysis are briefly summarised below and discussed in detail in the next subsections. They have been tested and successfully applied to all VST images [see (Iodice et al., 2017; Spavone et al., 2018; Iodice et al., 2019a; Cattapan et al., 2019; Iodice et al., 2020; Raj et al., 2020; Spavone et al., 2020; Ragusa et al., 2021), and references therein], to study the LSB regime, in particular to detect the IGL. For the estimate and analysis of the IGL we use the g and r bands only, since these are the deepest images with the most efficient filters of OmegaCAM. On the sky-subtracted mosaic we proceed as follow:
• the contamination from the foreground brightest stars in the field are removed by subtracting their models from the image (see Section 3.1);
• the limiting radius of the photometry (Rlim) and the residual background fluctuations (see Section. 3.2) are estimated;
• the isophote fitting of the brightest group members out to Rlim (see Section. 3.2) are performed to obtain the azimuthally-averaged surface brightness profiles and shape parameters;
• the brightest group members have been modelled and subtracted out to their transition radius (Rtr) (see Section. 3.4).
The tools and methods adopted in each step are described in the following subsections.
1.4 Scattered Light From the Bright Stars
To account for the scattered light from the two bright foreground stars located North-West in projection of the BGG (R.A. 10:46:19.207 Decl. +12:44:47.19 with mB = 9.42 mag, and R.A. 10:47:00.015 Decl. +13:01:37.01 with mB = 10.49 mag, see Figure 2), we have modelled their light distribution and subtracted it from the parent image. To this aim we have derived a 2-dimensional (2D) fit of the light distribution (using the IRAF2 task ELLIPSE (Jedrzejewski, 1987)). Fit is made for both sources assuming a circular light distribution out to the edge of the frames (∼ 60 arcmin, see Figure 2), keeping all parameters fixed to their initial values, i.e. center (x0, y0), ellipticity (ϵ = 0.05) and position angle (P.A. = 0). Before performing the isophote fit of the stars, we accurately masked three all the foreground/background sources. The core of the group is also masked out to ∼ 20 arcmin (∼ 19 Reff) of the BGG (Capaccioli et al., 1990). Using the IRAF task BMODEL, we built up the 2D models of the stars and subtracted them from both g and r parent images.
1.5 Estimate of Rlim and Residual Background Fluctuations
Using the same method described by Ragusa et al. (Ragusa et al., 2021), the star-subtracted images are used to estimate the Rlim and the average value of the residual background level4. Since images are sky-subtracted the residual background level is close to zero. This value (and its RMS fluctuation) has been taken into account when computing the galaxies’ surface brightness and the relative uncertainties, i.e. all surface brightness profiles are corrected for such a residual value of the background. The Rlim corresponds to the outermost semi-major axis derived by the isophote fitting, with respect to the center of the target, where the galaxy’s light blends into the average residual background level. Beyond Rlim the residual background fluctuations are almost constant. Since the two galaxies in the LEO I pair are close in projection and mostly located at the image centre, the isophote fit is performed by adopting the BGG centre and, therefore, the Rlim is the same for both galaxies. As explained in Ragusa et al. (Ragusa et al., 2021), by using IRAF task ELLIPSE, light is fitted in circular annuli (i.e. the ellipticity and PA are fixed to zero), with constant step, out to the edge of the images. All the foreground/background sources and the companion NGC 3384 galaxy are accurately masked. We found that Rlim ∼ 20 arcmin in both g and r bands. For R ≥ Rlim, the residual background levels are Ig ∼ - 0.52 ± 0.02 ADU and Ir ∼ - 0.90 ± 0.03 ADU in the g and r band, respectively.
1.6 Isophote Fitting
In order to derive the amount and physical properties of the IGL, we need to account for the contribution to the light from NGC 3379 and NGC 3384.
To this aim, for both galaxies, we derived the azimuthally-averaged surface brightness profiles and then we performed the 1-dimensional multi-component fit to set the scales of the contribution to the light from the galaxy and IGL (Sec. 3.4). Firstly, we fitted the isophotes of the BGG, NGC 3379, out to Rlim. We built a detailed mask on the sky-subtracted and star-removed images, of the foreground/background sources and of NGC 3384, by using IRAF task MSKREGIONS. The fit of the isophotes was performed using the IRAF task ELLIPSE, with all parameters left free (i.e. center, ellipticity and P.A.), over elliptical annuli, by applying a median sampling and k-sigma clipping algorithm. The combination of median sampling and k-sigma clipping algorithm has been shown to perform at best the fit of the isophotes, rejecting deviant sample points at each annulus. We derived the azimuthally averaged surface brightness, color and geometrical parameters profiles in each band.
The total uncertainty on the surface brightness profile takes into account the uncertainties on the photometric calibration (i.e. on the zero points, zpg = 30.000 ± 0.005 mag and zpr = 30.000 ± 0.004 mag) and the RMS in the background fluctuations5. From the isophote fit, we derived the 2D model (using IRAF task BMODEL) of the light distribution for NGC 3379 up to Rlim in each band, and subtracted it from the parent image. On the residual images, we performed the isophote fit of the other galaxy of the pair, NGC 3384, up to Rlim in each band, following the same procedure used for NGC 3379. In the top left panels of the Figure 3 and of the Figure 4 we show the azimuthally-averaged surface brightness and g - r color profiles of the two galaxies, NGC 3379 and NGC 3384 respectively, as a function of isophote semi major-axis.
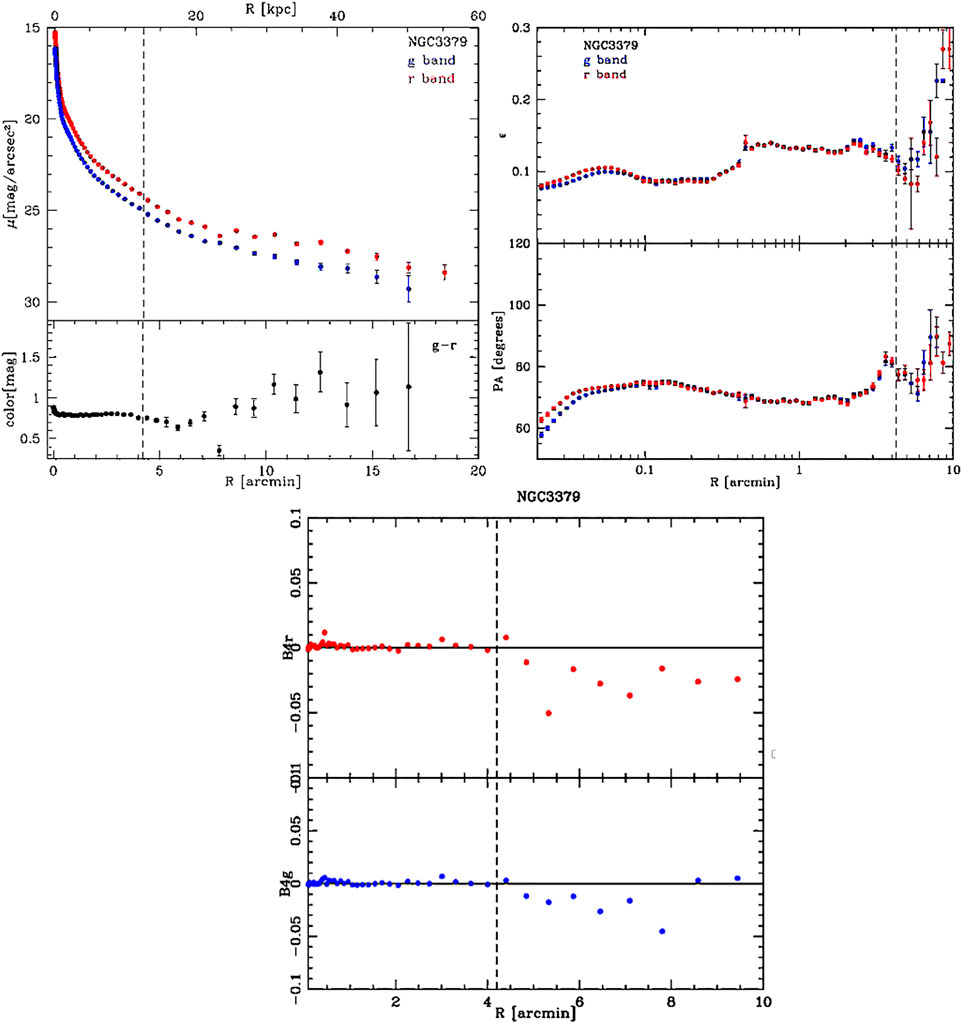
FIGURE 3. Top left panels: azimuthally-averaged surface brightness profiles of NGC 3379 in VST g (blue) and r (red) bands (top panel) and g − r color profile of NGC 3379 (bottom panel). Top right panel: azimuthally-averaged ellipticity (top panel) and position angle (bottom panel) profiles of NGC 3379 in VST g (blue) and r (red) bands. The black dashed lines correspond to the Rtr (see Section 3.4). Bottom panels: radial profiles the B4 Fourier coefficient as a function of semi-major axis in VST r (top panel) and g (bottom panel) bands for NGC 3379. The vertical dashed line corresponds to Rtr, beyond which the isophotes show a boxy shape (see details in the text in Section. 3.4.
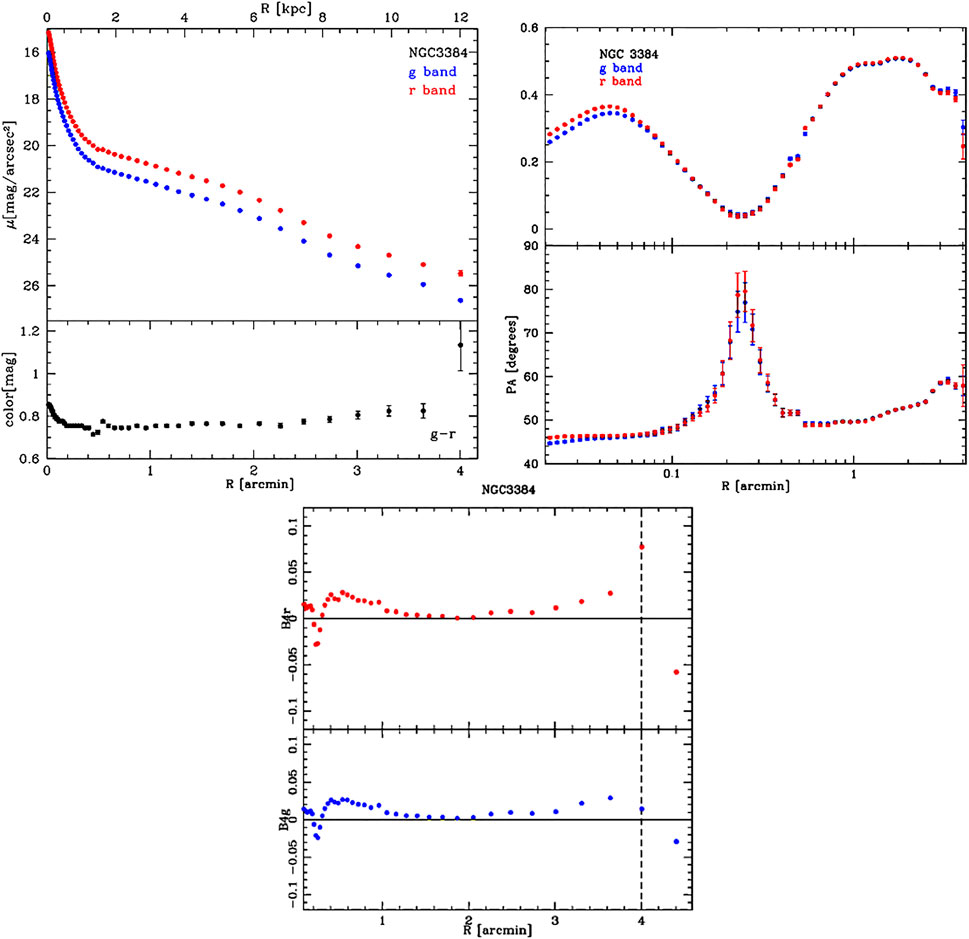
FIGURE 4. Top left panels: azimuthally-averaged surface brightness profiles of NGC 3384 in VST g (blue) and r (red) bands (top panel) and g − r color profile of NGC 3384 (bottom panel). Top right panels: azimuthally-averaged ellipticity (top panel)and position angle (bottom panel) profiles of NGC 3384 in VST g (blue) and r (red) bands. Bottom panels: radial profiles the B4 Fourier coefficient as a function of semi-major axis in VST r (top panel) and g (bottom panel) bands for NGC 3384. In this case also the coefficient B4 gives an indication of the lack of a evident accreted component (see details in the text in Section 3.4).
We are able to map the surface brightness profile of the BGG NGC 3379 down to ∼ 30 mag arcsec−2 in the g band and ∼ 29 mag arcsec−2 in the r band. We also provide the reliable g − r color profile of the galaxy out to ∼ 17 arcmin (i.e. ∼ 50 kpc) from the galaxy centre. The lower part of the top left panel in Figure 3 shows that the g − r color profile changes the trend at a radius of ∼ 4 arcmin (i.e. ∼ 12 kpc). Within this radius the color is almost constant, whit a value g − r ∼ 0.8 mag. At larger distances, the color profile has a negative gradient with a g − r value ranging from ∼ 0.8 mag, at four arcmin (∼ 12 kpc), to ∼ 0.6 mag, at six arcmin (∼ 18 kpc).
In the top right panels of the Figure 3 and the Figure 4 we show the azimuthally-averaged ellipticity and position angle profiles of the two galaxies NGC 3379 and NGC 3384, respectively, as a function of isophote semi major-axis. A break in the ellipticity and PA radial profiles is also evident, at the same radius (∼ 6 arcmin) in which the g − r color profile of NGC 3379 becomes shallower. From the isophote fit we obtained the growth curve, used to compute the total magnitude mtot for NGC 3384 and NGC 3379 in both g and r bands. From the extinction corrected magnitudes (see Table 2) we estimated: 1) the average color g − r = 0.76 mag and the total luminosity of NGC 3384, which is Lg = 1.60, ×, 1010L⊙ and Lr = 1.71 × 10¹⁰L⊙; 2) the average color g − r = 0.82 mag and the luminosity of NGC 3379, out to its transition radius (i.e. the radius beyond which the IGL plus diffuse stellar envelope of the galaxy start to dominate, see Sec. 3.4), which is Lg = 4.44 × 10¹⁰L⊙ and Lr = 4.95 × 10¹⁰L⊙.
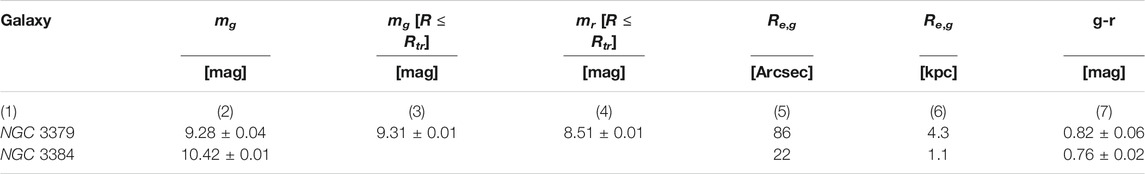
TABLE 2. Structural parameter obtained for the galaxies in the LEO I pair from the fit of the isophotes. Note. Column 1 report the name of the two pair members. In Col. Two is reported the total magnitude in the g band. In Cols. Three and four are listed the magnitude at the transition radius in g and r bands, while in Cols. Five and six are given the effective radius in the g band, in arcsec and kpc respectively. The average g − r color is listed in Col. 7. Magnitudes and colors were corrected for Galactic extinction using the extinction coefficients provided by Schlafly and Finkbeiner (Schlafly and Finkbeiner, 2011).
1.7 1-Dimensional Fit of the Light Distribution: The Contribution of the IGL
The massive galaxies at the center of clusters or groups are made by a very bright central component, fitted with one or two Sérsic law and a diffuse and very extended envelope, which is well reproduced by an exponential law [see e.g., (Seigar et al., 2007; Donzelli et al., 2011; Arnaboldi et al., 2012; Cooper et al., 2013; Huang et al., 2013; Iodice et al., 2016; Spavone et al., 2017b; Iodice et al., 2019b; Spavone et al., 2020; Ragusa et al., 2021)]. The exponential envelope takes into account both the stellar halo of the galaxy and the diffuse light component around it (i.e. IGL, ICL). Based on the deep photometric data, it is currently a challenge to unambiguously separate the extended stellar halo of the BGG (or BCG), which is gravitationally bounded to the galaxy, from the diffuse light around it. There is more than one photometric analysis used to separate the two components [see (Montes, 2019), as review]. In this work we adopted the same method described in Ragusa et al. (Ragusa et al., 2021). In short, we have derived the transition radius (Rtr) between the brightest parts of the BGG and the galaxy outskirts by fitting the 1D azimuthally-averaged surface brightness profiles, adopting the fitting procedure introduced by Spavone et al. (Spavone et al., 2017b), also used in other VEGAS papers [see e.g. (Iodice et al., 2016; Spavone et al., 2018; Cattapan et al., 2019; Iodice et al., 2020; Spavone et al., 2020)]. For the BGG of the pair, NGC 3379 (left panel of the Figure 5), the best fit is reproduced by the combination of three components. The inner and brightest regions are well fitted by two Sérsic laws. The outskirts show an extended exponential component, for R ≥ 250 arcsec (
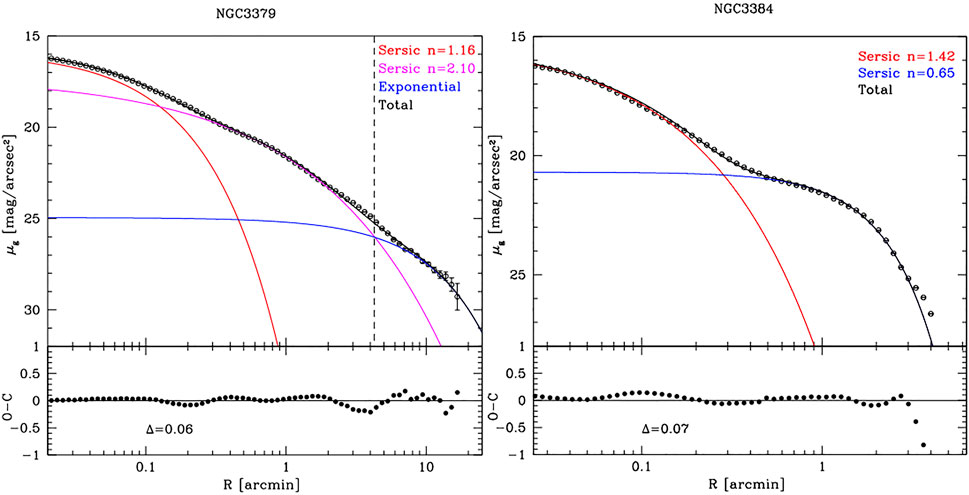
FIGURE 5. Left panel(Top panel) Three components model of the azimuthally averaged surface brightness profile of NGC 3379 out to ∼ 57 kpc in g band. The red and magenta lines indicate a fit to the inner region with a two Sérsic profiles. The blue line indicates a fit to the outer diffuse component (IGL) and the black line indicates the sum of the components in each fit. The vertical dashed line shows the estimated value for Rtr (∼ 12.5 kpc).(Bottom panel) Δrms scatter of the data minus the model (see text for details). Right panel (Top panel) Two components model of the azimuthally averaged surface brightness profile of NGC 3384 out to ∼ 12 kpc in g band. The red and blue lines indicate a fit to the inner region with a two Sérsic profiles. The black line indicates the sum of the components in each fit. (Bottom panel) Δrms scatter of the data minus the model (see text for details).
For NGC 3384 (Figure 5, right panel) the best fit is reproduced by the combination of two Sérsic components, which model the brightest regions of the galaxy and an outer disk, for R ∼ 3 arcmin. The 2D model of NGC 3384 is derived and subtracted from the parent image, where the 2D model of NGC 3379 was also subtracted. The structural parameters obtained by the 1D fit, both for NGC 3379 and NGC 3384, are listed in Table 3.
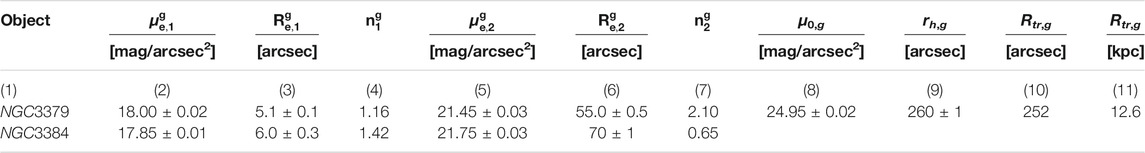
TABLE 3. Structural parameters derived from the 1D fit of the azimuthally averaged surface brightness profiles of the LEO I pair. Note. Columns 2, 3, 4, 5, 6, seven report the effective surface brightness, effective radius and Sérsic index for the two inner component of each fit, in the g band, whereas columns 8 and 9 list the central surface brightness and scale length for the outer exponential component. Columns 9 and 10 give a transition radii, in arcsec and kpc scale respectively, derived from the 1D fit of the azimuthally averaged surface brightness profiles of NGC 3379 (see Section 3.4).
The final residual images map the light in the stellar envelopes around galaxies plus the IGL component in the LEO I pair. This is one of the main results of this work and it is shown in Figure 7 for the g band. Here, the light from the background spiral galaxy NGC 3389 has also been modelled and subtracted.
1.8 Census of the Globular Clusters
Globular clusters (GCs) in massive galaxies are very old stellar systems, bright and typically fairly numerous. These characteristics, together with the many relevant properties that can be studied (radial and color distribution, luminosity function, etc.) make GCs a useful fossil record of the galaxy and its host environment (Harris, 2001; Cantiello et al., 2020). Thanks to the large area covered by the VEGAS images, and the number of available passbands, we took advantage of our VST data to study the GC population around the LEO I pair. The analysis is carried out using the same methods described on the previous papers of the Fornax Deep Survey (FDS) and VEGAS surveys [e.g., (Cantiello et al., 2015; Cantiello et al., 2018; Cantiello et al., 2020)]. Here we briefly summarize the main steps of the GC photometry, selection and analysis.
1.8.1 GCs Photometry
The photometry of point-like and background extended sources in the frame was obtained running SExtractor (Bertin and Arnouts, 1996) independently on the ugr and i galaxy-subtracted frames. The detection parameters (SExtractor’s DETECT_MINAREA, DETECT_THRESH, SEEING, weighting maps, etc.) were optimized for each passband to improve the detection of the faintest sources. In particular, we visually inspected the central galaxy-subtracted regions to verify that no obvious source is missing, or that surface brightness fluctuations (Tonry and Schneider, 1988) are identified as real sources. We adopted the 8-pixel (∼ 1.7arcses) aperture magnitude as our reference. The aperture correction to the 8-pixel magnitudes are derived using the classical curve of growth analysis on isolated and bright stars in the field (Cantiello et al., 2007a). The values of correction lie in the range of 0.3–0.6 mag (larger corrections for images with wider FWHM). The aperture and extinction corrected catalogs of each individual passbands are then matched using a 1.0 arcsec matching radius, taking the r as our reference passband, because of the better image quality. The final catalog of matched sources contains
For each detected source, SExtractor also provides other quantities that we used to identify GCs: Elongation, FWHM, Flux Radius [see (Bertin and Arnouts, 1996), for a detailed description of these quantities]. We also measured the four and six pixels aperture magnitudes, to derive the concentration index (C.I.) of the sources which we also used to sort out GCs from the full matched catalog (Peng et al., 2011).
1.8.2 GCs Selection
To identify GCs from the final ugri matched photometric catalog, we relied on the observed properties of confirmed GCs from existing studies, and on the known properties of the GCs in the area.
We built a master GCs catalog, to be used as reference for selecting GCs over the wide LEO I area, taking as reference the available catalogs of GCs identified: 1) from spectroscopic analysis (Puzia et al., 2004; Bergond et al., 2006), 64 GCs in total 2) from combined UBRI and gri photometry (Whitlock et al., 2003; Faifer et al., 2011), 51 GCs; 3) using X-ray selected sources from catalogs of LMXB (Kundu et al., 2007; Brassington et al., 2008), 11 GCs. After matching the whole set of targets from the literature, our master catalog contained 67 GCs. Table 4 contains the master GCs catalog. Figure 6 shows the GCs from the master catalog overlaid with the 2D histograms of measured properties of sources in the full matched catalog.
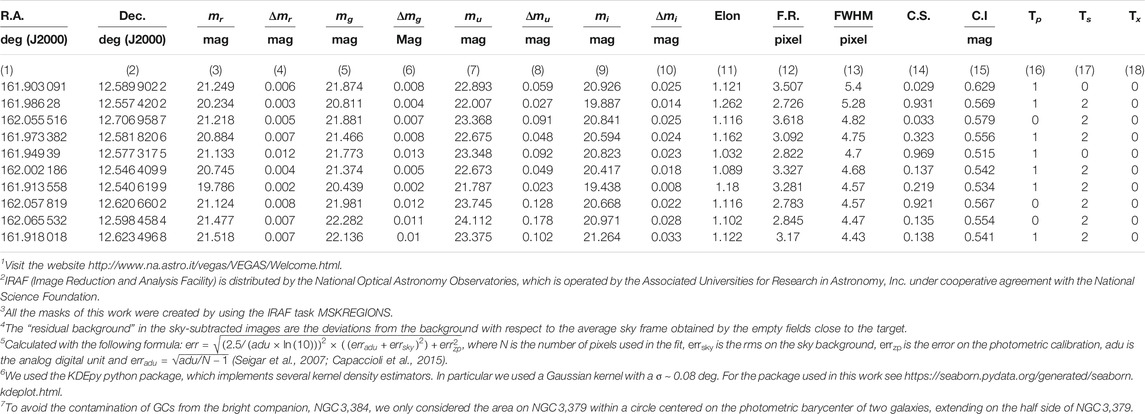
TABLE 4. Master catalog parameter: Col. (1-2) R.A and Dec. in degrees (J2000), Col. (3-4) magnitudes and uncertainties in the r band,Col. (5-6) magnitudes and uncertainties in the g band, Col. (7-8) magnitudes and uncertainties in the u, Col. (9-10) magnitudes and uncertainties in the i band, Col. 11) is the Elongation parameter from SExtractor defined as the ratio between the major and minor axis of the sources, Col. 12) is the Flux Radius parameter from SExtractor which is the radius containing half of the flux from the sources, Col. 13) is the FWHM parameter from SExtractor, Col. 14) is the Class Star parameter from SExtractor which classify sources, Col. 15) is the Concentration Index defined as the difference between magnitude at difference aperture, in particular we did the difference between 4-pixel aperture magnitude and 6-pixel one. Col. (16-18) refer to literature classifications of globular cluster, Tp stand for photometric,Ts stands for spettroscopy, Tx stand for LMXB studies. The full table is available at the VEGAS project web pages, and in the CDS repository.
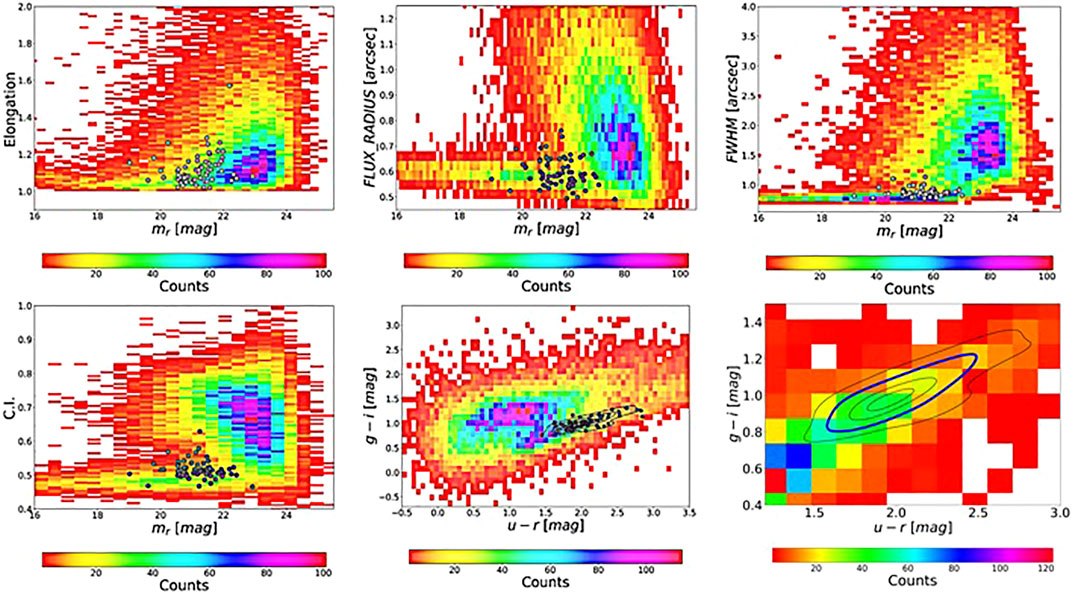
FIGURE 6. Upper panels: SExtractor output parameters in the r-band for the full sample of detected and ugri matched sources vs corrected r-band magnitude mr. Black circles show the GCs from the master catalog. Lower panels: As upper, but concentration index (C.I, left panel) vs mr and color-color planes (middle and right panel) are shown. In the middle panel, the isodensity contours of GCs from the master catalogs are also shown. In the right panel the contours, and the second isodensity contour (in blue containing ∼60% of objects of the master catalog) used for the final GCs identification, are overlaid to the 2D-color histogram.
Adopting the observed ranges of GCs properties from the master catalog, we defined the intervals to be used for identifying bona-fide GCs. The values of FWHM, concentration index, elongation, flux radius, photometric uncertainty and magnitudes adopted are reported in Table 5 These ranges are obtained from the median of the master catalog ± 3σ. GCs also show a universal luminosity function [GCLF; (Harris, 2001), which we used to define the magnitude range for GCs. The GCLF has a Gaussian shape with peak at Mg ∼ − 7.5 mag (Harris, 2001; Villegas et al., 2010), and width σGCLF that depends on the galaxy mass/luminosity. Using the empirical relations from Villegas et al. (Villegas et al., 2010), we estimated σGCLF = 1.05 mag in the g band. At the adopted distance of 10.23 ± 0.08 Mpc for LEO I, which implies GCLF peak at mg ∼ 22.5 mag, we select as GCs candidates the objects within ± 3σGCLF from the GCLF peak: 19.0 ≤ mr (mag) ≤ 26.0 mag.
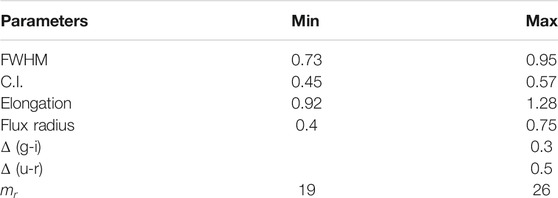
TABLE 5. Photometric and morphometric parameters adopted for source selections.
Using the parameter ranges defined as described above, 2,397 GCs candidates are pre-identified. We finally inspected the color-color properties of the selected sources to further clean the sample. Figure 6 shows the color-color selection procedures adopted: the middle lower panel shows the color-color diagram for the full sample of matched sources, and the isodensity levels of the master catalog; the right lower panel shows the parameter-selected GCs with highlighted the isodensity level we finally adopted to obtain our final catalog of GC candidates (blue contours in the panel), containing a total of 268 candidates [see also (Cantiello et al., 2020). The final list of matched and selected GCs is reported in Table 6.
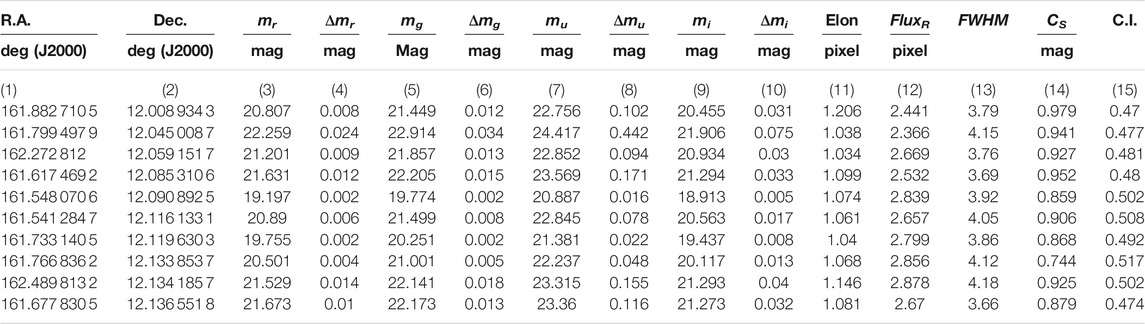
TABLE 6. Selected GCs catalog: Col. (1-2) R.A and Dec. in degrees (J2000), Col. (3-4) magnitudes and uncertainties in the r band, Col. (5-6) magnitudes and uncertainties in the g band, Col. (7-8) magnitudes and uncertainties in the u band, Col. (9-10) magnitudes and uncertainties in the i band, Col. 11) is the Elongation parameter from SExtractor defined as the ratio between the major and minor axis of the sources, Col. 12) is the Flux Radius parameter from SExtractor which is the radius containing half of the flux from the sources, Col. 13) is the FWHM parameter from SExtractor, Col. 14) is the Class Star parameter from SExtractor which classify sources, Col. 15) is the Concentration Index defined as the difference between magnitude at difference aperture, in particular we did the difference between 4-pixel aperture magnitude and 6-pixel one.
The final GCs catalog still contains unresolved contaminating sources matching with the properties of the GCs population we are interested in. Nevertheless, thanks to the large area covered by our images, and assuming that any population of contaminants is basically uniform over the inspected area, the GCs in the region will be analysed using background subtraction methods (Section 4.1).
1.9 Results: The Intra-group Diffuse Light in the LEO I Pair NGC 3379-NGC 3384
In this section we present the main properties of the IGL in the LEO I pair and the connection with the GCs population in the group, based on the deep optical images presented in this work. In addition, the photometric Rtr is compared with the kinematic transition radius found by (Hartke et al., 2020) by using PNe.
The distribution of the diffuse intra-group light in the LEO I pair NGC 3379-NGC 3,384, derived in the g band, is shown in Figure 7. As described in Sec. 3.4, this comes from the sky-subtracted image in the g band, where the brightest regions of the group members have been modelled and subtracted off. Residuals show the contribution of the stellar envelopes around the two brightest galaxies, which is symmetrical distributed around them, plus the diffuse light into the intra-group space. Here, two very faint streams are detected, emerging from the BGG. One extends to the South, towards the other bright group member of the LEO I group, M96, and the second one is protruding to the North-West, towards another bright member of the LEO I group, NGC 3338 (see Figure 7). We cannot map the whole extension of this second stream since it partly overlaps with the residuals from the subtraction of the bright star located in this area (see Section 3.1).
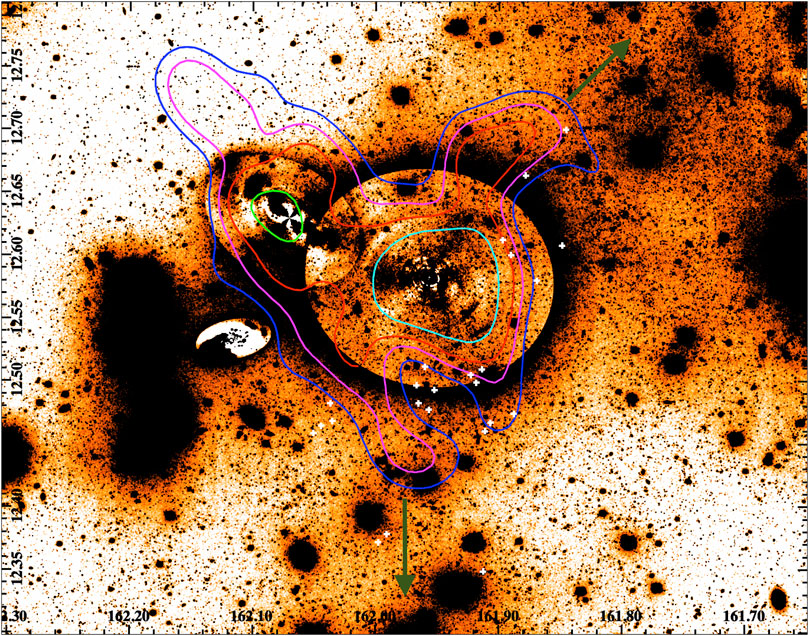
FIGURE 7. Residual image of the LEO I pair in the g band, where the brightest regions of the group members were subtracted from the parent image (see Section 3.4). The image is 0.64×0.50 degree, inside R ≤ Rlim, where the IGL is computed. The two green arrows indicate the directions of the two streams that come out of the analysis of the IGL map (for details see Section 4). The solid coloured lines indicate the iso-density contours of the GCs distribution (see Section 4.1). The white crosses mark the PNe obtained by Hartke et al. (Hartke et al., 2020), which overlap with the two streams.
To estimate the integrated magnitude of the IGL component in both g and r bands, we have used the residual image shown in Figure 7, where all the foreground and background sources are accurately masked. From this the residual image, using the IRAF task PHOT, we estimated the integrated the flux within Rlim (∼ 20 arcmin). The extinction-corrected integrated magnitude is mg = 10.72 ± 0.02 mag and mr = 9.97 ± 0.03 mag, in the g and r bands, respectively. These values correspond to the integrated magnitudes of the stellar envelope plus the IGL, which has an average color of g − r = 0.75 ± 0.04 mag. We then obtained the total luminosity of
1.10 IGL Versus GCs Distribution: Intra-group Baryons
Figure 8 shows the density distribution of the GCs, using the GCs catalog derived in Sec 3.5, obtained with a kernel density estimator6. The overdensity of GCs candidates on the LEO I pair with respect to the background contamination reveals some surprising features.
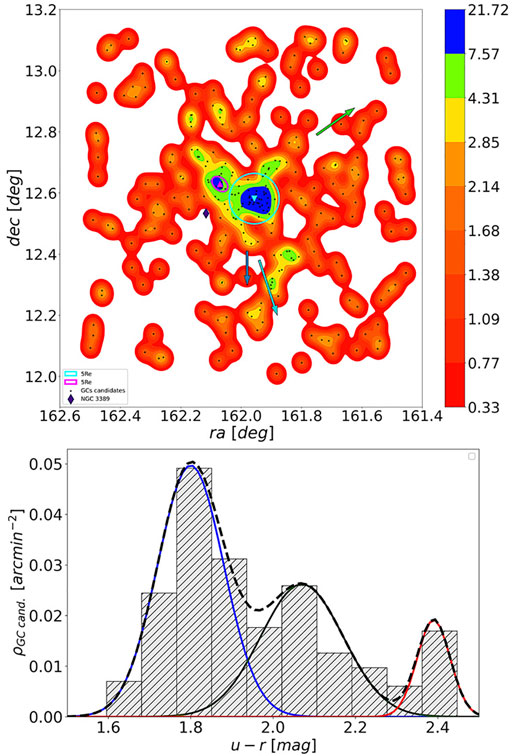
FIGURE 8. Top panel: GC candidates 2D density map. The position of NGC 3,379 and NGC 3,384 are marked with cyan and magenta symbols and lines, respectively. A dark-violet diamond shows the position of NGC 3,389. The green arrow shows the direction of the stream of GCs and diffuse light, aligned with the direction of NGC 3,338; the dark-blue arrow shows the direction of the second stream of diffuse light; the ligh-blue arrow marks the direction of M 96. Lower panel: color density distribution (corrected for background contamination, see text) over NGC 3,379. The position of the blue, “green” and red GCs, as derived with GMM, are shown with blue, green and red (solid line) gaussians, respectively, together with the combined fit to the entire population (black dashed line).
Firstly, we observe that the global GC population, with center on the pair of galaxies, stretches from North-East to South-West with an inclination that nearly matches with the line connecting NGC 3,379 and NGC 3,384 to the other bright galaxy in the group, (M 96) and, in the South-West side, overlaps with what seems to be a patch of IGL. Furthermore, nearly orthogonal to such direction, in the side opposite to the irregular NGC 3,389, we find evidence of a GCs over-density stretching along a further possible IGL patch in the same direction. The presence of these two sub-structures has been verified using different isodensity contours, or independently matched color catalogs (e.g., using the gri, the ur and the gi), and in all cases the presence of both features is confirmed, although with different numbers of GCs candidates and contaminants. In spite of the small number of GCs expected in the area, and the shallow u band images available, the 1:1 correspondence of these features with the IGL patches and with the possible links to interactions with bright companion galaxies in the field (M 96 and NGC 3,338), would actually support them as real features rather than artifacts due to size-of-the-sample effects. We also inspected the color-distribution of our GCs catalog. Although we expect a large contamination, the presence of relatively large portions of sky far from the target galaxies, and with no obvious GCs overdensity related to the LEO I pair, allowed us to characterize the color distribution of background regions (i.e. of most likely non-GCs sources). Hence, we derived the color distribution of the sources on the two galaxies within
In summary, although the field of the LEO I pair is relatively close and its GCs population has already been targeted by several other studies, the availability of the large area high-quality VST images allowed us to identify several GCs system properties previously unknown. Further spectroscopic follow-ups would be of great interest to confirm the existence of a direct link between the new features and the other galaxies in the region.
2 Discussion and Conclusion
In this work we have presented new multi-band (ugri) deep imaging data for the LEO I pair of galaxies, as part of the VEGAS project. Thanks to the large covered area (3.9 deg2 around the core of the pair) and the long integration time, we map the light distribution down to μg ∼ 30 mag/arcsec2 and out to 63 kpc from the BGG NGC 3379, and we provided a census of the GCs in this system. The main goal of this work was to derive the amount of IGL and its color, which are fundamental indicators of the formation history of the group.
The main results of this work are summarised below.
• The new map of diffuse intra-group light extends out to 63 kpc and presents two very faint (μg ∼ 28 − 29 mag/arcsec2) streams protruding from NGC 3379 and elongated toward North-West and South.
• The fraction of the diffuse light, coming from the stellar envelope plus the IGL, is
• The GCs population stretches both from North-East to South-West and from North-West to South of the pair, in the last case overlapping with the streams of IGL.
• The color distribution of the GCs appears clearly multi-modal, with two dominant peaks at (u-r) = 1.8 mag and 2.1 mag, respectively.
The IGL fraction we derived is consistent with estimates already present in other observational works derived for groups and clusters of galaxies, which ranges between ∼ 10 and 45%. This is evident from Figure 9 (left panel), where we plot the fraction of diffuse light as a function of the virial mass (Mvir) of the environment, from several observational studies. The virial mass and virial radius of LEO I group, centered on NGC 3379, are taken from Karachentsev et al. (Karachentsev et al., 2015) (Mvir= 1.26 × 10¹³ M⊙, Rvir= 467 kpc). Since our field covers ∼ 0.53 Rvir, we scaled the virial mass according to this radius (Mvir = 1.9 × 10¹² M⊙), used to derive the Mvir for the LEO I pair. As already pointed out by Ragusa et al. (Ragusa et al., 2021), given the large scatter, Figure 9 further suggests the absence of any trend between the fraction of diffuse light and Mvir. This result is consistent with theoretical predictions from Sommer-Larsen (Sommer-Larsen, 2006), Monaco et al. (Monaco et al., 2006), Henriques and Thomas (Henriques and Thomas, 2010), Rudick et al. (Rudick et al., 2011), Contini et al. (Contini et al., 2014), which provide an estimate for the ICL fraction ranging from 20 to 40% for any value of Mvir. Conversely, an increasing value of the ICL fraction with the virial mass is predicted by several other theoretical studies, also based on simulations (Lin and Mohr, 2004; Murante et al., 2007; Purcell et al., 2007; Pillepich et al., 2018).
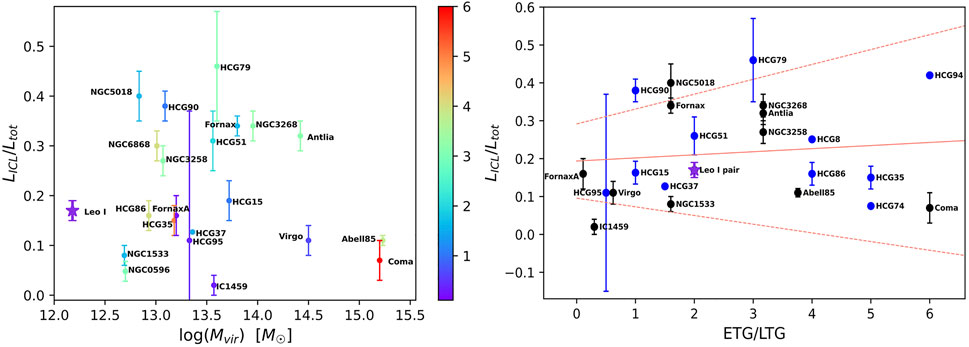
FIGURE 9. Left panel: Luminosity of the diffuse light component normalised to the total luminosity of the environment (group or cluster of galaxies) as a function of the virial mass. The value derived for LEO I pair is compared with those for several compact groups, taken from Da Rocha et al. (Da Rocha et al., 2008), Selim and Iqbal (Selim and Iqbal, 2008), Pildis et al. (Pildis et al., 1995), Poliakov et al. (Poliakov et al., 2021). The estimate for HCG 94 and HCG 37 are provided by Pildis et al. (Pildis et al., 1995) and Poliakov et al. (Poliakov et al., 2021) without an error range, respectively. In addition, values for the IGL estimated for other groups of galaxies derived using VEGAS data are also shown. These are: NGC 5018 group (Spavone et al., 2018), NGC 1533 triplet, IC 1459 group (Iodice et al., 2020), Fornax A subgroup (Raj et al., 2020), HCG 86 (Ragusa et al., 2021), and NGC 6868, NGC 3258,NGC 3,268, NGC 0596 (Ragusa et al., 2021; in preparation). The ICL fraction for the Fornax cluster is derived by Spavone et al. (Spavone et al., 2020) using FDS data. We also report the values for Virgo (Mihos et al., 2017), Coma (Jiménez-Teja et al., 2019), Abell 85 clusters (Brough et al., 2017; Montes et al., 2021) and Antlia cluster (Ragusa et al., 2021; in preparation). Although these estimates are all obtained with the same approach, it must be taken into account that some of them come from different photometric bands. The color of each point is coded according to its ETGs-to-LTGs ratio. It seems to suggest that no evident trend exists between the amount of IGL/ICL and Mvir. Right panel: Luminosity of the ICL component normalised to the total cluster or group luminosity as a function of the ETGs-to-LTGs ratio. The IGL for all HCGs available in literature are marked as blue points. Other estimates for groups and clusters of galaxies are indicated with the black points. The value found in this work for LEO I pair is marked with purple star-like point. The coral solid line corresponds to the best fit for the linear correlation and the dashed coral lines mark the 2σ significance range of the correlation. The NGC 5018 group and Fornax cluster have an ETG-to-LTG ratio similar to the NGC 1533 group and HCG 37, but former contain about the double amount of IGL-ICL respect to teh latter. The same goes for Coma and HCG 94. In contrast, Virgo and Coma clusters share about the same amount of ICL, but the first has a ETG-to-LTG ratio equal to 0.62, the second 10 times greater (ETG-to-LTG = 6). The coral solid line corresponds to the best fit for the linear correlation and the dashed coral lines mark the 2σ significance range of the correlation. The values for HCG 74, HCG 8, HCG 37, and HCG 17 (the latter overlaps to HCG 86) are from Poliakov et al. (Poliakov et al., 2021).
Based on the distribution of PNe in the halo of NGC 3379, Hartke et al. (Hartke et al., 2020) estimated a 3.8% as lower limit for the diffuse light in this group. Authors found that the PNe profile flattens at about 250 arcsec from the galaxy centre and it is well approximated by an exponential profile with a scale radius of rh = 258 ± 2 arcsec. They suggested that such an excess of PNe can maps an additional diffuse light component in the outskirts of NGC 3379, since it differs from the halo of the galaxy for its distinct α-parameter value (which is the luminosity-specific PNe number) and spatial density distribution. The transition radius of 250 arcsec, based on the PNe distribution is fully consistent with the transition radius of 250 arcsec, we derived from the multi-component fit to separate the brightest central part of the galaxy from its outskirts (i.e. stellar envelope plus IGL, see Section 3.4). Furthermore, the scale-length they derived for the exponential profile of the PNe distribution in the galaxy outskirts is fully consistent with rh = 260 ± 1 arcsec we obtained from the photometric decomposition. The consistency between the photometric and kinematic tracers suggests that the estimate of the IGL fraction we derived in this work for the LEO I pair is robust. Moreover, in a recent study, Hartke et al. (Hartke et al., 2022) present a new and extended kinematic survey of PNe around NGC 3379, inside an area of 30′ × 30′. They found three distinct kinematic regimes that are linked to different stellar population properties:
• the innermost one, i.e. the “rotating core”, extends up to ∼ 0.9 arcmin and corresponds to the stellar population formed in situ and metal rich. We identify this innermost component with the first Sérsic (red curve) presented in the left panel of Figure 3, which also extends up to ∼ 1 arcmin;
• the halo, from ∼ 0.9 arcmin to ∼ 7 arcmin, consisting of a mixture of intermediate-metallicity and metal-rich stars, formed in situ or through major merger events. The scales of this component are consistent with the second Sérsic (magenta curve) photometric component we fitted to reproduce the surface brightness profile of NGC 3379 (see Figure 3);
• the exponential envelope, beyond ∼ 7 arcmin, composed mostly of metal-poor stars, which traces the IGL component, which turns to be consistent with the exponential stellar envelope found from our three components model of NGC 3379 (see left panel of Figure 3), for R ≥ 7 arcmin.
The average color g − r = 0.75 ± 0.04 mag for the IGL in LEO I pair is comparable with the g − r color estimated for the diffuse light component in other groups and cluster of galaxies, in the nearby Universe [ ∼ 0.7 mag in the Fornax cluster, ∼ 0.8 mag in HCG 86 (Iodice et al., 2017; Raj et al., 2020; Ragusa et al., 2021). Moreover, such a value for the IGL color is also consistent with the range of g − r colors predicted for the diffuse light by Contini et al. (Contini et al., 2019), where 0.7 ≤ g − r ≤ 0.8 mag at z = 0.
In the left panel of the Figure 9 we have color-coded the fraction of diffuse light in groups and clusters based on their ETGs-to-LTGs ratio. In the right panel of the Figure 9 we present the fraction of the diffuse light with respect to the total luminosity of the environment as a function of the ETGs-to-LTGs ratio. Since the LEO I pair is made up of only one elliptical galaxy and one S0 galaxy, ETGs/LTGs = 2. In this plot, the IGL fraction estimated for the LEO I pair is consistent with the amount of diffuse light expected and observed for other environments of comparable ETGs-to-LTGs ratio, as some Hickson Compact groups of galaxies and the NGC 1533 triplet. As already noticed in previous works (Da Rocha et al., 2008; Ragusa et al., 2021), a weak trend between the amount of diffuse light and the ETGs-to-LTGs ratio in groups and clusters of galaxies seems to be present. Since the more dynamically evolved groups have the largest ETGs-to-LTGs fraction and the higher probability of tidal interactions, such as stellar stripping and mergers, a larger amount of diffuse light is expected for environments dominated by early-type galaxies.
In conclusion, the new deep photometry we have performed and presented in this work revealed an amount of IGL in the LEO I pair which is comparable with the diffuse light in other environments of similar virial mass. The estimated photometric transition between the inner and brighter region of the BGG and the diffuse envelope of stellar halo plus IGL is consistent with the kinematic one obtained for this target by Hartke et al. (Hartke et al., 2020) and Hartke et al. (Hartke et al., 2022). The VEGAS deep images have also revealed the presence of two faint stellar streams that might be associated at the IGL distribution. The 2-dimensional distribution both of the GCs found in this work and PNe found by Hartke et al. (Hartke et al., 2020) show an over-density overlapping with the two faint stellar streams. This would suggest that they are coherent structures of the intra-group baryons. Since they are elongated in the direction of the two nearby galaxies M96 and NGC 3338, they could be evidence of gravitational interactions with the pair. In particular, the stream in the direction of M96 could result from a head-on collision between LEO group members NGC 3384 and M96 (Michel-Dansac et al., 2010).
Data Availability Statement
The original contributions presented in the study are included in the article/Supplementary Material, further inquiries can be directed to the corresponding author.
Author Contributions
RR, MS, and EI worked on surface photometry and IGL propierties. MM and MC worked on the GCs detection and analysis. All other to the interpretation of results and science discussion.
Conflict of Interest
The authors declare that the research was conducted in the absence of any commercial or financial relationships that could be construed as a potential conflict of interest.
Publisher’s Note
All claims expressed in this article are solely those of the authors and do not necessarily represent those of their affiliated organizations, or those of the publisher, the editors and the reviewers. Any product that may be evaluated in this article, or claim that may be made by its manufacturer, is not guaranteed or endorsed by the publisher.
Acknowledgments
Authors acknowledge financial support from the VST project (P.I. P. Schipani). ALM acknowledges financial support from the INAF-OAC. We are grateful to M. Arnaboldi and J. Hartke for the enlightening discussions about the comparison between kinematics and photometry. This work is based on observations collected at the European Southern Observatory (ESO) La Silla Paranal Observatory within the VST Guaranteed Time Observations, Programme IDs: 096. B-0582(B), 097. B-0806(A), 090. B-0414(D).
References
Adami, C., Slezak, E., Durret, F., Conselice, C. J., Cuillandre, J. C., Gallagher, J. S., et al. (2005). Large Scale Diffuse Light in the Coma Cluster: A Multi-Scale Approach. A&A 429, 39–48. doi:10.1051/0004-6361:20041322
Arnaboldi, M., and Gerhard, O. (2010). JD2 - Diffuse Light in Galaxy Clusters. Proc. IAU 5, 97–110. doi:10.1017/S174392131000846X
Arnaboldi, M., Ventimiglia, G., Iodice, E., Gerhard, O., and Coccato, L. (2012). A Tale of Two Tails and an Off-Centered Envelope: Diffuse Light Around the cD Galaxy NGC 3311 in the Hydra I Cluster. A&A 545, A37. doi:10.1051/0004-6361/201116752
Bergond, G., Zepf, S. E., Romanowsky, A. J., Sharples, R. M., and Rhode, K. L. (2006). Wide-field Kinematics of Globular Clusters in the Leo I Group. A&A 448, 155–164. doi:10.1051/0004-6361:20053697
Bertin, E., and Arnouts, S. (1996). SExtractor: Software for Source Extraction. Astron. Astrophys. Suppl. Ser. 117, 393–404. doi:10.1051/aas:1996164
Bower, R. G., and Balogh, M. L. (2004). “The Difference between Clusters and Groups: A Journey from Cluster Cores to Their Outskirts and beyond,” in Clusters of Galaxies: Probes of Cosmological Structure and Galaxy Evolution. Editors JS. Mulchaey, A. Dressler, and A. Oemler (Cambridge), 325.
Brassington, N. J., Fabbiano, G., Kim, D. W., Zezas, A., Zepf, S., Kundu, A., et al. (2008). DeepChandraMonitoring Observations of NGC 3379: Catalog of Source Properties. Astrophysical J. Suppl. Ser. 179, 142–165. doi:10.1086/591527
Brough, S., van de Sande, J., Owers, M. S., d’Eugenio, F., Sharp, R., Cortese, L., et al. (2017). The Sami Galaxy Survey: Mass as the Driver of the Kinematic Morphology-Density Relation in Clusters. ApJ 844, 59. doi:10.3847/1538-4357/aa7a11
Buote, D. A., Su, Y., Gastaldello, F., and Brighenti, F. (2016). The Entire Virial Radius of the Fossil Cluster Rxj 1159 + 5531. Ii. Dark Matter and Baryon Fraction. ApJ 826, 146. doi:10.3847/0004-637X/826/2/146
Cañas, R., Lagos, C. d. P., Elahi, P. J., Power, C., Welker, C., Dubois, Y., et al. (2020). From Stellar Haloes to Intracluster Light: the Physics of the Intra-halo Stellar Component in Cosmological Hydrodynamical Simulations. MNRAS 494, 4314–4333. doi:10.1093/mnras/staa1027
Cantiello, M., Blakeslee, J. P., and Raimondo, G. (2007b). The Globular Cluster System in NGC 5866: Optical Observations fromHubble Space TelescopeAdvanced Camera for Surveys. ApJ 668, 209–220. doi:10.1086/521218
Cantiello, M., Capaccioli, M., Napolitano, N., Grado, A., Limatola, L., Paolillo, M., et al. (2015). VEGAS-SSS. A VST Early-type Galaxy Survey: Analysis of Small Stellar Systems. A&A 576, A14. doi:10.1051/0004-6361/201425165
Cantiello, M., D’Abrusco, R., Spavone, M., Paolillo, M., Capaccioli, M., Limatola, L., et al. (2018). VEGAS-SSS. II. Comparing the Globular Cluster Systems in NGC 3115 and NGC 1399 Using VEGAS and FDS Survey Data. A&A 611, A93. doi:10.1051/0004-6361/201730649
Cantiello, M., Raimondo, G., Blakeslee, J. P., Brocato, E., and Capaccioli, M. (2007a). Detection of Surface Brightness Fluctuations in Elliptical Galaxies Imaged with the Advanced Camera for Surveys:B‐ andI‐Band Measurements. ApJ 662, 940–951. doi:10.1086/517984
Cantiello, M., Venhola, A., Grado, A., Paolillo, M., D’Abrusco, R., Raimondo, G., et al. (2020). The Fornax Deep Survey with VST. A&A 639, A136. doi:10.1051/0004-6361/202038137
Capaccioli, M., Held, E. V., Lorenz, H., VietriPhotographic, M., and Surface, C. C. D. (1990). Photographic and CCD Surface Photometry of the Standard Elliptical Galaxy NGC 3379. AJ 99, 1813. doi:10.1086/115459
Capaccioli, M., Spavone, M., Grado, A., Iodice, E., Limatola, L., Napolitano, N. R., et al. (2015). Vegas: A VST Early-type GAlaxy Survey. A&A 581, A10. doi:10.1051/0004-6361/201526252
Castro-Rodríguez, N., Aguerri, J. A. L., Arnaboldi, M., Gerhard, O., Freeman, K. C., Napolitano, N. R., et al. (2003). Narrow Band Survey for Intragroup Light in the Leo HI Cloud. A&A 405, 803–812. doi:10.1051/0004-6361:20030588
Cattapan, A., Spavone, M., Iodice, E., Rampazzo, R., Ciroi, S., Ryan-Weber, E., et al. (2019). Vegas: A VST Early-type GAlaxy Survey. IV. NGC 1533, IC 2038, and IC 2039: An Interacting Triplet in the Dorado Group. ApJ 874, 130. doi:10.3847/1538-4357/ab0b44
Conroy, C., Wechsler, R. H., and Kravtsov, A. V. (2007). The Hierarchical Build‐Up of Massive Galaxies and the Intracluster Light Sincez= 1. ApJ 668, 826–838. doi:10.1086/521425
Contini, E., De Lucia, G., Villalobos, Á., and Borgani, S. (2014). On the Formation and Physical Properties of the Intracluster Light in Hierarchical Galaxy Formation Models. MNRAS 437, 3787–3802. doi:10.1093/mnras/stt2174
Contini, E., and Gu, Q. (2020). On the Mass Distribution of the Intracluster Light in Galaxy Groups and Clusters. ApJ 901, 128. doi:10.3847/1538-4357/abb1aa
Contini, E. (2021). On the Origin and Evolution of the Intra-cluster Light: A Brief Review of the Most Recent Developments. Galaxies 9, 60. doi:10.3390/galaxies9030060
Contini, E., Yi, S. K., and Kang, X. (2019). Theoretical Predictions of Colors and Metallicity of the Intracluster Light. ApJ 871, 24. doi:10.3847/1538-4357/aaf41f
Cooper, A. P., D'Souza, R., Kauffmann, G., Wang, J., Boylan-Kolchin, M., Guo, Q., et al. (2013). Galactic Accretion and the Outer Structure of Galaxies in the CDM Model. MNRAS 434, 3348–3367. doi:10.1093/mnras/stt1245
Cooper, A. P., Parry, O. H., Lowing, B., Cole, S., and Frenk, C. (2015). Formation Ofin Situstellar Haloes in Milky Way-Mass Galaxies. Mon. Not. R. Astron. Soc. 454, 3185–3199. doi:10.1093/mnras/stv2057
Corbelli, E., Cresci, G., Mannucci, F., Thilker, D., and Venturi, G. (2021). Heavy Elements Unveil the Non-primordial Origin of the Giant H I Ring in Leo. ApJl 908, L39. doi:10.3847/2041-8213/abdf64
Cui, W., Murante, G., Monaco, P., Borgani, S., Granato, G. L., Killedar, M., et al. (2013). Characterizing Diffused Stellar Light in Simulated Galaxy Clusters. Monthly Notices R. Astronomical Soc. 437, 816–830. doi:10.1093/mnras/stt1940
Da Rocha, C., Ziegler, B. L., and Mendes de Oliveira, C. (2008). Intragroup Diffuse Light in Compact Groups of Galaxies - II. HCG 15, 35 and 51. MNRAS 388, 1433–1443. doi:10.1111/j.1365-2966.2008.13500.x
De Lucia, G., Springel, V., White, S. D. M., Croton, D., and Kauffmann, G. (2006). The Formation History of Elliptical Galaxies. Monthly Notices R. Astronomical Soc. 366, 499–509. doi:10.1111/j.1365-2966.2005.09879.x
de Vaucouleurs, G. (1975). Nearby Groups of Galaxies. Editors Allan Sandage, Mary Sandage, and Jerome Kristian (Chicago: Gustav A. Tammann), 557.
DeMaio, T., Gonzalez, A. H., Zabludoff, A., Zaritsky, D., Aldering, G., Brodwin, M., et al. (2020). The Growth of Brightest Cluster Galaxies and Intracluster Light over the Past 10 Billion Years. MNRAS 491, 3751–3759. doi:10.1093/mnras/stz3236
DeMaio, T., Gonzalez, A. H., Zabludoff, A., Zaritsky, D., Connor, T., Donahue, M., et al. (2018). Lost but Not Forgotten: Intracluster Light in Galaxy Groups and Clusters. MNRAS 474, 3009–3031. doi:10.1093/mnras/stx2946
Dolag, K., Murante, G., and Borgani, S. (2010). Dynamical Difference between the cD Galaxy and the Diffuse, Stellar Component in Simulated Galaxy Clusters. MNRAS 405, 1544–1559. doi:10.1111/j.1365-2966.2010.16583.x
Donahue, M., Aldering, G., and Stocke, J. T. (1995). Low Surface Brightness Hα Observations of Local Intergalactic Hydrogen Clouds. ApJl 450, L45–L49. doi:10.1086/316771
Donzelli, C. J., Muriel, H., and Madrid, J. P. (2011). The Luminosity Profiles of Brightest Cluster Galaxies. ApJS 195, 15. doi:10.1088/0067-0049/195/2/15
Duc, P.-A., Cuillandre, J.-C., Karabal, E., Cappellari, M., Alatalo, K., Blitz, L., et al. (2015). The ATLAS3D Project - XXIX. The New Look of Early-type Galaxies and Surrounding fields Disclosed by Extremely Deep Optical Images. MNRAS 446, 120–143. doi:10.1093/mnras/stu2019
Eke, V. R., Baugh, C. M., Cole, S., Frenk, C. S., Norberg, P., Peacock, J. A., et al. (2004). Galaxy Groups in the 2dFGRS: the Group-Finding Algorithm and the 2PIGG Catalogue. MNRAS 348, 866–878. doi:10.1111/j.1365-2966.2004.07408.x
Faifer, F. R., Forte, J. C., Norris, M. A., Bridges, T., Forbes, D. A., Zepf, S. E., et al. (2011). Gemini/GMOS Imaging of Globular Cluster Systems in Five Early-type Galaxies★. MNRAS 416, no. doi:10.1111/j.1365-2966.2011.19018.x
Ferrarese, L., Côté, P., Cuillandre, J. C., Gwyn, S. D. J., Peng, E. W., MacArthur, L. A., et al. (2012). The Next Generation Virgo Cluster Survey (NGVS). I. Introduction to the Survey. ApJs 200, 4. doi:10.1088/0067-0049/200/1/4
Fliri, J., and Trujillo, I. (2016). The IAC Stripe 82 Legacy Project: a Wide-Area Survey for Faint Surface Brightness Astronomy. Mon. Not. R. Astron. Soc. 456, 1359–1373. doi:10.1093/mnras/stv2686
Grado, A., Capaccioli, M., Limatola, L., and Getman, F. (2012). “VST Processing Facility: First Astronomical Applications,” in Memorie Della Societa Astronomica Italiana Supplementi. (Naples), 19, 362.
Harris, W. E. (2001). “Globular Cluster Systems,” in Saas-Fee Advanced Course 28: Star Clusters. Berlin: Springer-Verlag.
Harris, W. E., Harris, G. L. H., Layden, A. C., and Wehner, E. M. H. (2007). The Leo Elliptical NGC 3379: A Metal‐Poor Halo Emerges. ApJ 666, 903–918. doi:10.1086/520799
Harris, W. E. (2009). The Globular Cluster System in M87: A Wide-Field Study with CFHT/Megacam. ApJ 703, 939–950. doi:10.1088/0004-637X/703/1/939
Hartke, J., Arnaboldi, M., Gerhard, O., Coccato, L., Merrifield, M., Kuijken, K., et al. (2022). The Halo of M105 and its Group Environment as Traced by Planetary Nebula Populations: II. Using Kinematics of Single Stars to Unveil the Presence of Intragroup Light Around the Leo I Galaxies NGC 3384 and M105. arXiv e-prints. arXiv:2201.08710.
Hartke, J., Arnaboldi, M., Gerhard, O., Coccato, L., Pulsoni, C., Freeman, K. C., et al. (2020). The Halo of M 105 and its Group Environment as Traced by Planetary Nebula Populations. A&A 642, A46. doi:10.1051/0004-6361/202038009
[Dataset] Henden, N. A., Puchwein, E., and Sijacki, D. (2019a). The Baryon Content of Groups and Clusters of Galaxies in the Fable Simulations.
Henden, N. A., Puchwein, E., and Sijacki, D. (2019b). The Redshift Evolution of X-ray and Sunyaev-Zel'dovich Scaling Relations in the Fable Simulations. MNRAS 489, 2439–2470. doi:10.1093/mnras/stz2301
Henriques, B. M. B., and Thomas, P. A. (2010). Tidal Disruption of Satellite Galaxies in a Semi-analytic Model of Galaxy Formation. MNRAS 403, 768–779. doi:10.1111/j.1365-2966.2009.16151.x
Huang, S., Ho, L. C., Peng, C. Y., Li, Z.-Y., and Barth, A. J. (2013). The Carnegie-Irvine Galaxy Survey. III. The Three-Component Structure of Nearby Elliptical Galaxies. ApJ 766, 47. doi:10.1088/0004-637X/766/1/47
Huang, S., Leauthaud, A., Greene, J., Bundy, K., Lin, Y.-T., Tanaka, M., et al. (2018). A Detection of the Environmental Dependence of the Sizes and Stellar Haloes of Massive central Galaxies. MNRAS 480, 521–537. doi:10.1093/mnras/sty1136
Iodice, E., Spavone, M., Raj, M. A., Capaccioli, M., and Cantiello, M. (2021). VEGAS Science Team. The VST Early-type GAlaxy Survey (VEGAS) Data Release 1. arXiv e-prints. arXiv:2102.04950.
Iodice, E., Capaccioli, M., Grado, A., Limatola, L., Spavone, M., Napolitano, N. R., et al. (2016). The Fornax Deep Survey with VST. I. The Extended and Diffuse Stellar Halo of NGC 1399 Out to 192 Kpc. ApJ 820, 42. doi:10.3847/0004-637X/820/1/42
Iodice, E., Sarzi, M., Bittner, A., Coccato, L., Costantin, L., Corsini, E. M., et al. (2019b). The Fornax3D Project: Tracing the Assembly History of the Cluster from the Kinematic and Line-Strength Maps. A&A 627, A136. doi:10.1051/0004-6361/201935721
Iodice, E., Spavone, M., Cantiello, M., D’Abrusco, R., Capaccioli, M., Hilker, M., et al. (2017). Intracluster Patches of Baryons in the Core of the Fornax Cluster. ApJ 851, 75. doi:10.3847/1538-4357/aa9b30
Iodice, E., Spavone, M., Capaccioli, M., Peletier, R. F., van de Ven, G., Napolitano, N. R., et al. (2019a). The Fornax Deep Survey with the VST. A&A 623, A1. doi:10.1051/0004-6361/201833741
Iodice, E., Spavone, M., Cattapan, A., Bannikova, E., Forbes, D. A., Rampazzo, R., et al. (2020). VEGAS: a VST Early-type GAlaxy Survey. A&A 635, A3. doi:10.1051/0004-6361/201936435
Jedrzejewski, R. I. (1987). CCD Surface Photometry of Elliptical Galaxies - I. Observations, Reduction and Results. Monthly Notices R. Astronomical Soc. 226, 747–768. doi:10.1093/mnras/226.4.747
Jiménez-Teja, Y., Dupke, R. A., Lopes de Oliveira, R., Xavier, H. S., Coelho, P. R. T., Chies-Santos, A. L., et al. (2019). J-PLUS: Analysis of the Intracluster Light in the Coma Cluster. A&A 622, A183. doi:10.1051/0004-6361/201833547
Karachentsev, I. D., Nasonova, O. G., and Karachentseva, V. E. (2015). Large-scale Structure and Galaxy Motions in the Leo/Cancer Constellations. Astrophys. Bull. 70, 1–15. doi:10.1134/S1990341315010010
Kissler-Patig, M., Richtler, T., Storm, J., and della Valle, M. (1997). Halo and Bulge/disk Globular Clusters in the S0 Galaxy NGC 1380. A&A 327, 503–512.
Kostov, A., and Bonev, T. (2018). Transformation of Pan-STARRS1 Gri to Stetson BVRI Magnitudes. Photometry of Small Bodies Observations. Bulgarian Astronomical J. 28, 3.
Kundu, A., Maccarone, T. J., and Zepf, S. E. (2007). Probing the Formation of Low‐Mass X‐Ray Binaries in Globular Clusters and the Field. ApJ 662, 525–543. doi:10.1086/518021
Larsen, S. S., Brodie, J. P., Huchra, J. P., Forbes, D. A., and Grillmair, C. J. (2001). Properties of Globular Cluster Systems in Nearby Early-type Galaxies. AJ 121, 2974–2998. doi:10.1086/321081
Lee, M. G., and Jang, I. S. (2016). Dual Stellar Halos in the Standard Elliptical Galaxy M105 and Formation of Massive Early-type Galaxies. ApJ 822, 70. doi:10.3847/0004-637X/822/2/70
Lin, Y. T., and Mohr, J. J. (2004). K‐band Properties of Galaxy Clusters and Groups: Brightest Cluster Galaxies and Intracluster Light. ApJ 617, 879–895. doi:10.1086/425412
Martel, H., Barai, P., and Brito, W. (2012). The Fate of Dwarf Galaxies in Clusters and the Origin of Intracluster Stars. II. Cosmological Simulations. ApJ 757, 48. doi:10.1088/0004-637X/757/1/48
Martinez-Delgado, D., Cooper, A. P., Roman, J., Pillepich, A., Erkal, D., Pearson, S., et al. (2021). Hidden Depths in the Local Universe: the Stellar Stream Legacy Survey. arXiv e-prints. arXiv:2104.06071.
Merritt, A., van Dokkum, P., Danieli, S., Abraham, R., Zhang, J., Karachentsev, I. D., et al. (2016). The Dragonfly Nearby Galaxies Survey. II. Ultra-diffuse Galaxies Near the Elliptical Galaxy NGC 5485. ApJ 833, 168. doi:10.3847/1538-4357/833/2/168
Merritt, D. (1984). Relaxation and Tidal Stripping in Rich Clusters of Galaxies. II - Evolution of the Luminosity Distribution. ApJ 276, 26–37. doi:10.1086/161590
Michel-Dansac, L., Duc, P.-A., Bournaud, F., Cuillandre, J.-C., Emsellem, E., Oosterloo, T., et al. (2010). A Collisional Origin for the Leo Ring. ApJ 717, L143–L148. doi:10.1088/2041-8205/717/2/L143
Mihos, C. (2015). Intragroup and Intracluster Light. IAU Gen. Assembly 22, 2247903. doi:10.1017/s1743921315006857
Mihos, J. C., Harding, P., Feldmeier, J. J., Rudick, C., Janowiecki, S., Morrison, H., et al. (2017). The Burrell Schmidt Deep Virgo Survey: Tidal Debris, Galaxy Halos, and Diffuse Intracluster Light in the Virgo Cluster. ApJ 834, 16. doi:10.3847/1538-4357/834/1/16
Miles, T. A., Raychaudhury, S., Forbes, D. A., Goudfrooij, P., Ponman, T. J., and Kozhurina-Platais, V. (2004). The Group Evolution Multiwavelength Study (GEMS): Bimodal Luminosity Functions in Galaxy Groups. Monthly Notices R. Astronomical Soc. 355, 785–793. doi:10.1111/j.1365-2966.2004.08356.x
Monaco, P., Murante, G., Borgani, S., and Fontanot, F. (2006). Diffuse Stellar Component in Galaxy Clusters and the Evolution of the Most Massive Galaxies at [FORMULA][F]z≲1[/F][/FORMULA]. ApJ 652, L89–L92. doi:10.1086/510236
Montes, M., Brough, S., Owers, M. S., and Santucci, G. (2021). The Buildup of the Intracluster Light of Abell 85 as Seen by Subaru’s Hyper Suprime-Cam. arXiv e-prints. arXiv:2101.08290.
Montes, M. (2019). The Intracluster Light and its Role in Galaxy Evolution in Clusters. arXiv e-prints. arXiv:1912.01616.
Montes, M., and Trujillo, I. (2018). Intracluster Light at the Frontier - II. The Frontier Fields Clusters. MNRAS 474, 917–932. doi:10.1093/mnras/stx2847
Montes, M., and Trujillo, I. (2014). Intracluster Light at the Frontier: A2744. ApJ 794, 137. doi:10.1088/0004-637X/794/2/137
Montes, M., and Trujillo, I. (2019). Intracluster Light: a Luminous Tracer for Dark Matter in Clusters of Galaxies. MNRAS 482, 2838–2851. doi:10.1093/mnras/sty2858
Müller, O., Jerjen, H., and Binggeli, B. (2018). The Leo-I Group: New dwarf Galaxy and Ultra Diffuse Galaxy Candidates. A&A 615, A105. doi:10.1051/0004-6361/201832897
Muñoz, R. P., Eigenthaler, P., Puzia, T. H., Taylor, M. A., Ordenes-Briceño, Y., Alamo-Martínez, K., et al. (2015). Unveiling a Rich System of Faint Dwarf Galaxies in the Next Generation Fornax Survey. ApJ 813, L15. doi:10.1088/2041-8205/813/1/L15
Murante, G., Giovalli, M., Gerhard, O., Arnaboldi, M., Borgani, S., and Dolag, K. (2007). The Importance of Mergers for the Origin of Intracluster Stars in Cosmological Simulations of Galaxy Clusters. Monthly Notices R. Astronomical Soc. 377, 2–16. doi:10.1111/j.1365-2966.2007.11568.x
Peng, E. W., Ferguson, H. C., Goudfrooij, P., Hammer, D., Lucey, J. R., Marzke, R. O., et al. (2011). Thehst/acs Coma Cluster Survey. Iv. Intergalactic Globular Clusters and the Massive Globular Cluster System at the Core of the Coma Galaxy Cluster. ApJ 730, 23. doi:10.1088/0004-637X/730/1/23
Pierce, M. J., and Tully, R. B. (1985). The Extragalactic H I Cloud in Leo. AJ 90, 450–453. doi:10.1086/113750
Pildis, R. A., Bregman, J. N., and Schombert, J. M. (1995). Deep Optical Observations of Compact Groups of Galaxies. AJ 110, 1498. doi:10.1086/117623
Pillepich, A., Nelson, D., Hernquist, L., Springel, V., Pakmor, R., Torrey, P., et al. (2018). First Results from the IllustrisTNG Simulations: the Stellar Mass Content of Groups and Clusters of Galaxies. MNRAS 475, 648–675. doi:10.1093/mnras/stx3112
Poliakov, D., Mosenkov, A. V., Brosch, N., Koriski, S., and Rich, R. M. (2021). Quantified Diffuse Light in Compact Groups of Galaxies. MNRAS 503, 6059–6077. doi:10.1093/mnras/stab853
Puchwein, E., Springel, V., Sijacki, D., and Dolag, K. (2010). Intracluster Stars in Simulations with Active Galactic Nucleus Feedback. MNRAS 406, no. doi:10.1111/j.1365-2966.2010.16786.x
Purcell, C. W., Bullock, J. S., and Zentner, A. R. (2007). Shredded Galaxies as the Source of Diffuse Intrahalo Light on Varying Scales. ApJ 666, 20–33. doi:10.1086/519787
Puzia, T. H., Kissler-Patig, M., Thomas, D., Maraston, C., Saglia, R. P., Bender, R., et al. (2004). VLT Spectroscopy of Globular Cluster Systems. A&A 415, 123–143. doi:10.1051/0004-6361:20031448
Ragusa, R., Spavone, M., Iodice, E., Brough, S., Raj, M. A., Paolillo, M., et al. (2021). Vegas: A VST Early-type GAlaxy Survey. A&A 651, A39. doi:10.1051/0004-6361/202039921
Raj, M. A., Iodice, E., Napolitano, N. R., Hilker, M., Spavone, M., Peletier, R. F., et al. (2020). The Fornax Deep Survey with VST. A&A 640, A137. doi:10.1051/0004-6361/202038043
Riess, A. G., Casertano, S., Yuan, W., Macri, L., Anderson, J., MacKenty, J. W., et al. (2018). New Parallaxes of Galactic Cepheids from Spatially Scanning theHubble Space Telescope: Implications for the Hubble Constant. ApJ 855, 136. doi:10.3847/1538-4357/aaadb7
Robotham, A. S. G., Norberg, P., Driver, S. P., Baldry, I. K., Bamford, S. P., Hopkins, A. M., et al. (2011). Galaxy and Mass Assembly (GAMA): the GAMA Galaxy Group Catalogue (G3Cv1). MNRAS 416, 2640–2668. doi:10.1111/j.1365-2966.2011.19217.x
Rudick, C. S., Christopher Mihos, J., Frey, L. H., and McBride, C. K. (2009). Tidal Streams of Intracluster Light. ApJ 699, 1518–1529. doi:10.1088/0004-637X/699/2/1518
Rudick, C. S., Mihos, J. C., and McBride, C. K. (2011). The Quantity of Intracluster Light: Comparing Theoretical and Observational Measurement Techniques Using Simulated Clusters. ApJ 732, 48–66. doi:10.1088/0004-637X/732/1/48
Rudick, C. S., Mihos, J. C., and McBride, C. (2006). The Formation and Evolution of Intracluster Light. ApJ 648, 936–946. doi:10.1086/506176
Sampaio-Santos, H., Zhang, Y., Ogando, R. L. C., Shin, T., Golden-Marx, J. B., Yanny, B., et al. (2020). Is Diffuse Intracluster Light a Good Tracer of the Galaxy Cluster Matter Distribution? MNRAS 501, 1300–1315. doi:10.1093/mnras/staa3680
Schipani, P., Noethe, L., Arcidiacono, C., Argomedo, J., Dall’Ora, M., D’Orsi, S., et al. (2012). Removing Static Aberrations from the Active Optics System of a Wide-Field Telescope. J. Opt. Soc. Am. A. 29, 1359. doi:10.1364/JOSAA.29.001359
Schlafly, E. F., and Finkbeiner, D. P. (2011). Measuring Reddening with sloan Digital Sky Survey Stellar Spectra and Recalibrating Sfd. ApJ 737, 103. doi:10.1088/0004-637x/737/2/103
Schneider, S. E., Salpeter, E. E., and Terzian, Y. (1986). High-resolution Observations of the Intergalactic H I Cloud in the M96 Group. AJ 91, 13–22. doi:10.1086/113975
Schneider, S. (1985). Neutral Hydrogen in the M96 Group - Evidence for a Giant Intergalactic Ring. ApJ 288, L33–L35. doi:10.1086/184416
Seigar, M. S., Graham, A. W., and Jerjen, H. (2007). Intracluster Light and the Extended Stellar Envelopes of cD Galaxies: an Analytical Description. MNRAS 378, 1575–1588. doi:10.1111/j.1365-2966.2007.11899.x
Selim, I., and Iqbal, N. (2008). Stability of Hickson Groups of Galaxies. Turkish J. Phys. 32, 133–137.
Sil’chenko, O. K., Moiseev, A. V., Afanasiev, V. L., Chavushyan, V. H., and Valdes, J. R. (2003). The Leo I Cloud: Secular Nuclear Evolution of NGC 3379, NGC 3384, and NGC 3368? ApJ 591, 185–203. doi:10.1086/375315
Sommer-Larsen, J. (2006). Properties of Intra-group Stars and Galaxies in Galaxy Groups: 'normal' versus 'fossil' Groups. MNRAS 369, 958–968. doi:10.1111/j.1365-2966.2006.10352.x
Spavone, M., Capaccioli, M., Napolitano, N. R., Iodice, E., Grado, A., Limatola, L., et al. (2017a). Unveiling the Nature of Giant Ellipticals and Their Stellar Halos with the VST. The Messenger 170, 34–39. doi:10.18727/0722-6691/5052
Spavone, M., Capaccioli, M., Napolitano, N. R., Iodice, E., Grado, A., Limatola, L., et al. (2017b). Vegas: A VST Early-type GAlaxy Survey. A&A 603, A38. doi:10.1051/0004-6361/201629111
Spavone, M., Iodice, E., Capaccioli, M., Bettoni, D., Rampazzo, R., Brosch, N., et al. (2018). Vegas: A VST Early-type Galaxy Survey. III. Mapping the Galaxy Structure, Interactions, and Intragroup Light in the NGC 5018 Group. ApJ 864, 149. doi:10.3847/1538-4357/aad6e9
Spavone, M., Iodice, E., van de Ven, G., Falcón-Barroso, J., Raj, M. A., Hilker, M., et al. (2020). The Fornax Deep Survey with VST. A&A 639, A14. doi:10.1051/0004-6361/202038015
Thilker, D. A., Donovan, J., Schiminovich, D., Bianchi, L., Boissier, S., de Paz, A. G., et al. (2009). Massive star Formation within the Leo 'primordial' Ring. Nature 457, 990–993. doi:10.1038/nature07780
Tonry, J., and Schneider, D. P. (1988). A New Technique for Measuring Extragalactic Distances. Astronomical J. 96, 807. doi:10.1086/114847
Trujillo, I., and Fliri, J. (2016). Beyond 31 Mag Arcsec−2: The Frontier of Low Surface Brightness Imaging with the Largest Optical Telescopes. ApJ 823, 123. doi:10.3847/0004-637X/823/2/123
van Dokkum, P. G., Abraham, R., and Merritt, A. (2014). First Results from the Dragonfly Telephoto Array: The Apparent Lack of a Stellar Halo in the Massive Spiral Galaxy M101. ApJ 782, L24. doi:10.1088/2041-8205/782/2/L24
Villegas, D., Jordán, A., Peng, E. W., Blakeslee, J. P., Côté, P., Ferrarese, L., et al. (2010). The ACS Fornax Cluster Survey. VIII. The Luminosity Function of Globular Clusters in Virgo and Fornax Early-type Galaxies and its Use as a Distance Indicator. ApJ 717, 603–616. doi:10.1088/0004-637X/717/2/603
Watkins, A. E., Mihos, J. C., Harding, P., and Feldmeier, J. J. (2014). Searching for Diffuse Light in the M96 Galaxy Group. ApJ 791, 38. doi:10.1088/0004-637X/791/1/38
Watkins, A. E., Mihos, J. C., and Harding, P. (2016). The Red and Featureless Outer Disks of Nearby Spiral Galaxies. ApJ 826, 59. doi:10.3847/0004-637X/826/1/59
Whitlock, S., Forbes, D. A., and Beasley, M. A. (2003). UBRIphotometry of Globular Clusters in the Leo Group Galaxy NGC 3379. MNRAS 345, 949–959. doi:10.1046/j.1365-8711.2003.07046.x
Keywords: galaxies, evolution -galaxies, surface photometry -galaxies, group, general -galaxies, interactions-intergalactic medium -galaxies, diffuse intragroup light
Citation: Ragusa R, Mirabile M, Spavone M, Cantiello M, Iodice E, La Marca A, Paolillo M and Schipani P (2022) The Intra-Group Baryons in the LEO I Pair From the VST Early-Type GAlaxy Survey. Front. Astron. Space Sci. 9:852810. doi: 10.3389/fspas.2022.852810
Received: 11 January 2022; Accepted: 15 February 2022;
Published: 21 March 2022.
Edited by:
Emanuele Contini, Nanjing University, ChinaReviewed by:
Mireia Montes, Space Telescope Science Institute (NASA), United StatesDaniela Bettoni, Osservatorio Astronomico di Padova (INAF), Italy
Copyright © 2022 Ragusa, Mirabile, Spavone, Cantiello, Iodice, La Marca, Paolillo and Schipani. This is an open-access article distributed under the terms of the Creative Commons Attribution License (CC BY). The use, distribution or reproduction in other forums is permitted, provided the original author(s) and the copyright owner(s) are credited and that the original publication in this journal is cited, in accordance with accepted academic practice. No use, distribution or reproduction is permitted which does not comply with these terms.
*Correspondence: Rossella Ragusa, cm9zc2VsbGEucmFndXNhQGluYWYuaXQ=