 Elizabeth C. Sklute
 Jill A. Mikucki
 M. Darby Dyar
 Peter A. Lee
 Ken J. T. Livi5
 Sarina Mitchell
- 1Planetary Science Institute, Tucson, AZ, United States
- 2Department of Microbiology, University of Tennessee, Knoxville, TN, United States
- 3Department of Astronomy, Mount Holyoke College, South Hadley, MA, United States
- 4Marine Laboratory, College of Charleston, Charleston, SC, United States
- 5Material Characterization and Processing Center, Department of Materials Science and Engineering, Johns Hopkins University, Baltimore, MD, United States
Aperiodic discharge of brine at Blood Falls forms a red-tinged fan at the terminus of Taylor Glacier, Antarctica. Samples from this discharge provide an opportunity for mineralogical study at a Martian analogue study site. Environmental samples were collected in the field and analyzed in the laboratory using Fourier transform infrared, Raman, visible to near-infrared, and Mössbauer spectroscopies. Samples were further characterized using microprobe and inductively coupled plasma optical emission spectroscopy for chemistry, and x-ray diffraction, scanning electron microscopy, and transmission electron microscopy for mineralogy, crystallography, and chemistry. The mineralogy of these samples is dominated by the carbonate minerals calcite and aragonite, accompanied by quartz, feldspar, halide, and clay minerals. There is no strong evidence for crystalline iron oxide/hydroxide phases, but compositionally and morphologically diverse iron- and chlorine-rich amorphous nanospheres are found in many of the samples. These results showcase the strengths and weaknesses of different analytical methods and underscore the need for multiple complementary techniques to inform the complicated mineralogy at this locale. These analyses suggest that the red color at Blood Falls arises from oxidation of dissolved Fe2+ in the subglacial fluid that transforms upon exposure to air to form nanospheres of amorphous hydroxylated mixed-valent iron-containing material, with color also influenced by other ions in those structures. Finally, the results provide a comprehensive mineralogical analysis previously missing from the literature for an analogue site with a well-studied sub-ice microbial community. Thus, this mineral assemblage could indicate a habitable environment if found elsewhere in the Solar System.
Introduction
The enigmatic rust color of Blood Falls against its glacially monochromatic backdrop (Figure 1A) has been the subject of scientific curiosity since its discovery and naming over 100 years ago during the 1910–1913 Terra Nova Expedition (Taylor, 1922). This feature forms through the episodic release of salt-rich fluid from a subglacial aquifer (Mikucki et al., 2015) that emerges at the northern terminus of the Taylor Glacier in the McMurdo Dry Valleys of Antarctica. Deep-pressurized brine flows through basal crevasses to the surface discharge site (Badgeley et al., 2017) where the outflow forms a red-orange cone, earning Blood Falls its name. This locale is a singular extraterrestrial-analogue study site in many ways: its location within a polar desert climate, salt- and iron-rich mineralogy, and the isolation of its microbial community for possibly 1000s of years or longer (Mikucki and Priscu, 2007; Mikucki et al., 2009; Campen et al., 2019), may mimic Martian subsurface “oases” (Boston et al., 1992; Mikucki et al., 2009; Carrier et al., 2020) or subsurface oceans on icy bodies (Robinson and Mikucki, 2018; Hendrix et al., 2019). Moreover, the logistical challenges of sampling in the Antarctic environment, and the resultant limitations on sample return, are parallel to those faced in remote planetary exploration. Work at analogue sites such as Blood Falls may inform challenges the Mars sample return mission will face in terms of limited sample collection and long storage times. Further, analytical approaches that leverage robotically accessible techniques can be usefully extended to many other Solar System locales.
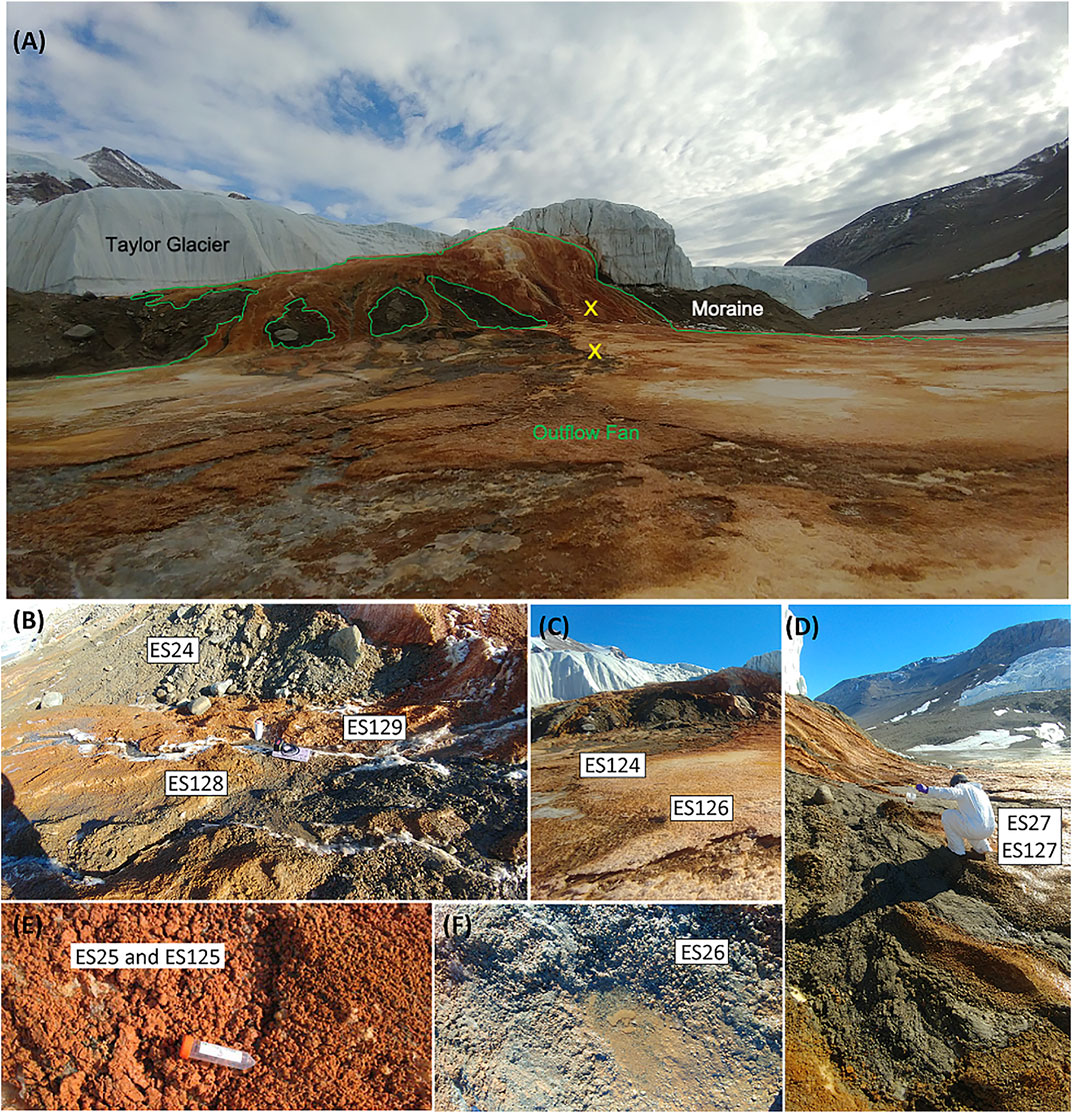
FIGURE 1. (A) The Blood Falls outflow fan (77.7167°S, 162.2667°E) at the terminus of the Taylor Glacier in November, 2018. (B–F) Diversity of samples from the Blood Falls discharge analyzed in this study. See descriptions in Table 1.
Blood Falls is sourced from brine beneath 100s of meters of ice (Hubbard et al., 2004; Mikucki et al., 2015). The brine chemistry reflects concentrated seawater (Lyons et al., 2005; 2019) and hosts a diverse microbial community that has likely evolved in isolation for 1000s of years or longer (Mikucki et al., 2009). Viscosity differences between the brine and clean ice, the latent heat of freezing of the brine as it equilibrates with the surrounding glacier, and normal glacial flow are believed to push the brine through a series of channeling, trapping, pressurizing, and depressurizing events as it migrates towards the terminus of the glacier (Badgeley et al., 2017). The advection eventually leads to an episodic discharge of hypersaline fluid at the northern snout of Taylor Glacier, near the permanently frozen surface of its proglacial lake, Lake Bonney.
The episodic outflow of this brine at Blood Falls enables the study of alteration and/or preservation of subsurface materials at the surface of a glacier. Studies that can potentially link surface features to subsurface chemistries and/or ecosystems are pivotal to the evolution of the field of remote sensing, and understanding the mineralogical signatures at the surface that indicate a habitable subsurface environment is crucial in the search for extant life, as these may be easier to detect from orbit. While investigations on the origin and mechanism of fluid flow and glacial movement that result in discharge at Blood Falls, along with the associated microbial community, have been well studied (Hubbard et al., 2004; Foley et al., 2006; Pettit et al., 2014; Mikucki et al., 2015; Badgeley et al., 2017), a detailed mineralogical analysis that contextualizes these planetary-relevant findings in the geological record is still lacking. In fact, the mineral phases in the surface features themselves have never been fully cataloged using a full suite of modern analysis and spectroscopic techniques.
The mineralogy and associated geochemistry of Blood Falls is uniquely relevant to other planets. The subsurface brine flows into one of the coldest and driest places on Earth (Keys, 1980; Doran et al., 2002; Obryk et al., 2020), the McMurdo Dry Valleys, long considered a Martian analog (Doran et al., 2010). In this polar desert, myriad geochemical processes that depend on moisture and temperature, such as weathering, deliquescence, precipitation, deaquation, and species mobility, proceed differently than anywhere else this planet (i.e., Keys and Williams 1981; Gibson et al., 1983, Campbell and Claridge, 1987; Hall et al., 2002, Head and Marchant, 2014). Cold, dry, and salt-rich environments are prime geochemical and microbiological analogue sites for planetary exploration (Murray et al., 2012; Rutishauser et al., 2018). Taylor Valley, in particular, is dominated by salts of sulfates and chlorides (Keys, 1980), making it much like Mars (Dickinson and Rosen, 2003; King and McLennan, 2010; Thomas et al., 2019). Furthermore, Taylor Valley soils have little organic matter (Campbell et al., 2013) that would produce carbonates. Instead, rare carbonates result from weathering of substrates under the ice, as well as from freeze-encapsulation of surface-sorbed atmospheric CO2 (Hallet, 1976; Keys, 1980; Lyons et al., 2021). Soil moisture and atmospheric moisture are low, and extreme (up to 50%) diurnal changes in relative humidity (RH) can lead to large RH gradients buffered by local salt content (Keys, 1980; Levy, 2021). A similar process may create locally buffered areas of higher RH on Mars (Ling and Wang, 2010; Sklute et al., 2018a). Liquid processes, like weathering, leaching, and ion migration, are dominated in Taylor Valley by the behavior of thin liquid films on individual grains, which can persist well below 0°C due to particle surface energy (Ugolini, 1976) and/or brine freezing point depression (Keys, 1980; Gibson et al., 1983). No other place in the natural world allows for such a close approximation of the Martian surface.
This study intentionally employs analytical techniques previously employed on rovers and orbiters at Mars. Mössbauer spectroscopy, used in this study to search for fine-grained iron (hydr)oxides, also confirmed the distribution of iron-bearing phases among coexisting silicates in Martian rocks and soils (Klingelhofer et al., 2004; Morris et al., 2006) on the Spirit and Opportunity Mars Exploration rovers (MER). Visible to near-infrared (VNIR) spectroscopy was used by instruments on the MERs (Squyres et al., 2003), by the compact reconnaissance imaging spectrometer for Mars (CRISM) on the Mars Reconnaissance Orbiter (Murchie et al., 2007), and the Observatoire pour la Minéralogie, l’Eau, les Glaces et l’Activité (OMEGA) instrument on the Mars Express mission (Poulet et al., 2007) to identify minerals. Mid-far infrared spectroscopy, which also detects and differentiates mineralogy, was used on the MERs (Christensen et al., 2003a), on Mars Global Surveyor (Christensen et al., 2001), and Mars Odyssey (Christensen et al., 2003b). Mars in-situ X-ray diffraction (XRD) for mineral identification was pioneered on the Curiosity rover (Blake et al., 2012; Vaniman et al., 2014), though XRD could not identify the abundant amorphous phases in the Martian soil. Finally, Raman spectroscopy as part of the SuperCam instrument on Perseverance (Maurice et al., 2021), uses subtle distinctions in structure and crystallinity (Parikh et al., 2014) for phase identification. This ensemble of techniques applied to the study of Blood Falls simulates past, present, and future exploration methods used on Mars.
Several additional techniques are used here to bridge the gap between remote and Earth-based investigations, and would likely be employed on specimens from a Mars sample return mission (c.f., Carrier et al., 2021; Tait et al., 2021; Tosca et al., 2021). Inductively coupled plasma optical emission spectroscopy (ICP-OES) derives relative concentrations of major ions. Scanning electron microscopy (SEM) with energy dispersive x-ray (EDX) analysis, transmission electron microscopy (TEM) with and without selected area electron diffraction (SAED), and electron probe microanalysis (EPMA) are used to investigate the morphological, mineralogical, and chemical composition of samples, to search for trace phases, and to contextualize bulk characterization results.
The goal of this study is a detailed characterization of 10 surficial grab samples of material from the Blood Falls “ice cone” during two different field seasons. Specifically, we seek to fully parameterize the red-orange colored precipitate that has given Blood Falls its name. Additionally, we used these results to relate the sampling and analysis challenges to our exploration of other planets.
Materials and Methods
Samples
Surficial grab samples of precipitated and weathered ice-embedded salts and sediments were collected from the Blood Falls “ice cone” once in November 2006 and twice, mid and late November, 2018 (Figure 1 and Supplementary Figure S1 and Table 1). While active discharge was not evident at the time of collection, a discharge event was recorded via time lapse photography in September, 2018 (P. Doran personal communication). The Blood Falls ice cone site is heterogenous, with precipitates, icing, salts, and minerals forming a large fan across the glacier moraine and Lake Bonney ice cover, that waxes with inputs of new subglacial discharge, and wanes from melt, ablation, or dissolution from supraglacial melt. The discharge appears to deepen in color as the summer progresses, though this has not yet been systematically studied. Samples were collected with sterile scoops and placed in either sterile centrifuge tubes or Whirl Pak® (Nasco) bags before being shipped and stored frozen (−20°C) until analyzed. Samples collected represented visually different materials including glacial moraine sediments in colored colloidal suspensions (ES24 and ES26) or a range of colored salt crusts or “flowers” mixed in ice matrices. ES27 and ES127 were materials collected in late November of 2018. Thawed and filtered samples are presented in Supplementary Figures S2A,B, respectively.
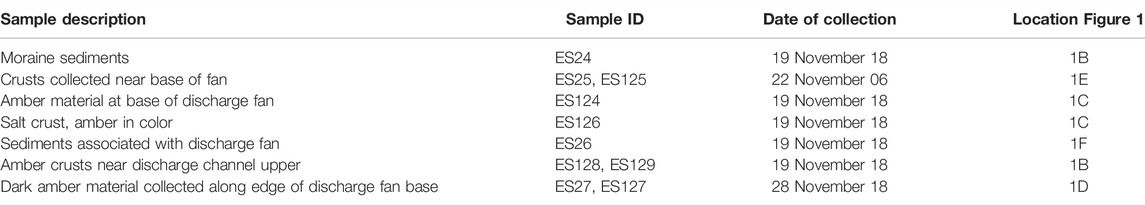
TABLE 1. Samples investigated in this study.
Analysis
XRD analysis was performed with a Rigaku Smartlab II SE XRD using Cu Kα radiation in Bragg-Brentano geometry. Patterns are the result of 5–80° or 2–80° 2θ scans with a 0.01° or 0.02° step size, respectively, and a scan rate of 2° per minute. Baseline corrections and mineral identifications were made using Rigaku Smartlab II (RSL2) software via the licensed ICSD PDF2 database (2019 version) The RSL2 Powder XRD plugin use a patented hybrid approach to matching and basic quantification, wherein both profile data and peak data (position, intensity, full-width at half maximum) are used to identify and quantify phases. Each pattern was fit with both a tight B-spline baseline and an adjusted baseline that would allow for amorphous baseline swell (Supplementary Figure S3). Final matching results were obtained by 1) allowing for RSL2 to derive best guesses using the “mineral related” sub-library with no other restriction, 2) checking each phase for prior identification on Antarctica and through visual inspection of pattern overlap, 3) setting the phases and fitting the residuals (including checks for reasonableness on any new phase matches), 4) setting any new phases and constraining residual results to phases with at least one of the unallocated peaks, 5) setting new phases and constraining residual results to include only phases with at least one of the major elements present in the sample. Any phase high on the list of matches that did not reach the auto-selection threshold was manually assessed and added where reasonable.
FTIR spectra were obtained using a Bruker ALPHA FTIR spectrometer with a platinum diamond ATR attachment. Spectra were collected from 360–4000 cm−1 at 4 or 8 cm−1 resolution. Each spectrum is an average of 128 scans. Continuum removal was performed with Bruker’s OPUS software using a concave rubberband correction.
VNIR spectra were collected on an ASD Fieldspec 4 Max spectrometer in bidirectional geometry using an Ocean Optics HL-2000 light source directed down a 1000 μm Si optical fiber at 30° and an 8° foreoptic for collection at 0° (perpendicular). Samples were leveled without packing in matt-black painted sample cups spectra were collected without ambient illumination as 3 × 240 136 ms integrations and referenced to Spectralon.
Raman spectra (300–3200 cm−1) were obtained with a Bruker BRAVO spectrometer, which uses both 758 and 852 nm excitation lasers. Each spectrum is an average of 100, 1000 ms integrations. Each sample was analyzed through the bottom of one dram glass vials. Spectra were baseline-corrected using the rubberband algorithm as implemented at http://nemo.mtholyoke.edu.
SEM and EPMA were performed on samples ES24, ES25, ES26, and ES27 (ES24-27) in the Department of Geosciences Electron Microprobe/SEM Facility at the University of Massachusetts–Amherst. For SEM, fine materials were mounted on aluminum stubs with double-stick carbon tabs and then carbon coated. SEM was acquired using a Carl Zeiss EVO50 in secondary and backscattered electron modes with qualitative compositional surveys performed using a Bruker SDD EDS system. For EPMA, fines were distributed into 25 mm diameter sample cups, which were then filled with epoxy (room temperature cured Struers EPO-FIX). Samples were cured, ground briefly with 500 grit SiC, then polished using diamond slurry in three steps, 9, 3, and 1 micron using a Struers Labopol 5 semi-automatic polisher. A 25 nm thick carbon coating was applied by vacuum evaporation for conductivity. EPMA was performed on a Cameca SX100 electron probe with four WDS spectrometers and Bruker SDD EDS (15 kV, 15 nA, with a 2 μm beam diameter). Concentrations of Na, Al, Si Ca, Fe, Mg, Mn, Ti, and S were determined using silicate and oxide standards for calibration.
Mössbauer spectroscopy was performed on samples ES24-27. Dried samples were ground lightly with sugar and secured plastic washers backed with Kapton tape. Spectra were obtained at Mount Holyoke College on a Web Research (now See-Co) W302 Mössbauer spectrometer at 295, 220, 150, 80, and 4K employing a Janus closed cycle He compressor at <295 K. Each 1024-channel spectrum was folded about the midpoint and calibrated to an α-Fe foil using the WMOSS4 program. Spectra were fit using the Mexfield program, provided by Eddie DeGrave and Toon Van Alboom of the University of Ghent, Belgium. It uses Lorentzian line shapes and solves the full hyperfine interaction Hamiltonian to minimize the chi-squared deviation between the data and the model using center shift, quadrupole splitting, linewidth, +/− hyperfine field and field broadening as free parameters (Vandenberghe et al., 1994).
TEM without SAED was performed at Mount Holyoke College on a Philips/FEI CM 100. Supernatant from samples ES24-27 was diluted with DI water in a 100:1 ratio, agitated, and pipetted onto a 200 mesh grid. TEM images were acquired at 40–100 KV. An average of 20 frames was taken per sample.
TEM with SAED and EDX was collected on ES26, ES125, ES126, and ES128 on the Johns Hopkins University Materials Characterization and Processing Center’s Thermo Fisher TF30 instrument operating at 300 kV with an EDAX windowless silicon drift energy dispersive X-ray (EDX) detector. Conventional imaging, high-resolution lattice imaging (HRTEM), selected area electron diffraction (SAED), scanning transmission electron microscopy (STEM) bright-field (BF) and high-angle annular dark-field (HAADF) imaging, and STEM EDX maps were collected for selected samples.
ICP-OES was obtained at the University of Massachusetts on Agilent 5110 ICP-OES. Each sample was agitated and then 200 μl of solid suspension was pipetted into 4 ml of doubly deionized (DDI) water and then diluted to bring ion concentrations within the calibration curve for each sample. Samples were acidified to pH < 2 using concentrated nitric acid to prevent mineral precipitation and microbial activity. Measured intensities were converted to concentrations using a nine-point calibration curve (r2 > 0.995 for all elements). Sample replicates indicate an error of 2%. Additionally, ES24-27 were agitated and allowed to settle, as in other analyses, and then 50 μl was pipetted into 1 ml of DDI water, and then further diluted to 13.58 ml, acidified, and run as above. All data are corrected to remove the effects of dilution for the final reported numbers.
Sample preparation varied by technique and sample to explore variability based on preparation technique and to search for specific information. For all analyses except Mössbauer, samples ES24-27 were thawed, agitated, and allowed to partially settle such that the most fine-grained fraction could be collected and analyzed (Supplementary Figure S2A). We refer to this as the fine fraction and/or the supernatant in the remainder of the paper. As the fine fraction was most strongly colored, this approach was to target color-causing compounds that give Blood Falls its name. For Mössbauer, samples ES24-27 were prepared both as bulk and supernatants. All samples were air dried oxically at room temperature prior to analysis. For TEM at Mt. Holyoke (ES24-27), samples were agitated and allowed to partially settle before pipetting the dilute suspension onto TEM grids.
Analyses of samples ES124, ES125, ES126, ES127, ES128, and ES129 (ES124-129) were performed on filtered material (0.2 μm GE polycarbonate filter membranes) (Supplementary Figure S2B) oxically dried at room temperature. TEM at Johns Hopkins used bulk samples carved off frozen ice-sediment mixtures and then freeze-dried using a vacuum pump attached to a vacuum oven inside a bench freezer (−20°C). The freeze-dried powders were shipped frozen to Johns Hopkins and kept in a freezer until a few minutes before examination. Samples ES26, ES125, ES126, and ES128 were first prepared dry on lacey carbon Cu grids and examined without any further modification. After first pass observations in the TEM, the presence of NaCl was noted and the same grids were triple washed in distilled water droplets to remove abundant soluble precipitates. No two analyses used the same aliquot of material; homogeneity upon agitation is assumed.
Results
X-Ray Diffraction (XRD)
XRD patterns of the fine fractions from ES24-27 were used to specifically search for the iron (hydr)oxides. Related bulk samples of ES124-129 then constrain mineralogical variability (Figure 2) based on grain size and sample preparation. Phase identifications for both default and adjusted baseline are shown in Table 2 and XRD patterns with commonly identified phases plotted in Figure 3. No sample displays a baseline swell that would indicate a substantial amorphous component (c.f., Sklute et al., 2018a), in contrast to the 42% amorphous component identified in regional Taylor Valley soils (Quinn et al., 2020), but minor baseline swell is present (Supplementary Figure S3), and peak broadening in all patterns is consistent with smaller grain sizes and poorly crystalline material (Gilbert and Banfield, 2005). Different phases and abundances were identified for the two baseline choices highlighting the inherent uncertainty in deconvolving complicated mixtures containing fine-grained components without extensive knowledge of sample composition.
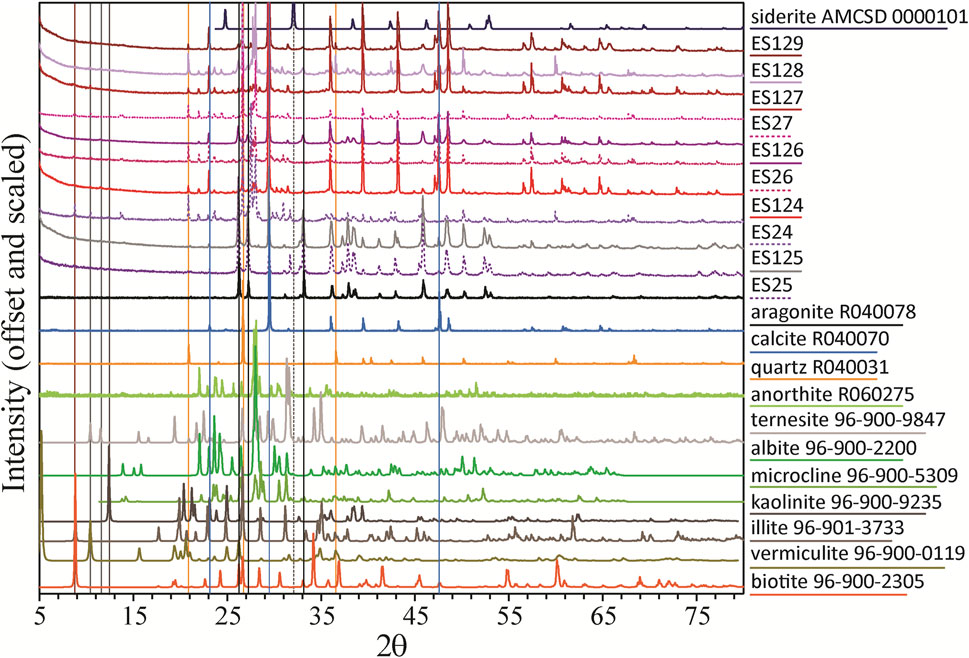
FIGURE 2. XRD patterns of Blood Falls colored sediments, reference spectra for phases identified by the RSL2 “high” and “low” baseline fitting results along with phases inferred from local mineralogy and identifiable peaks (e.g., phyllosilicates and clays). Reference patterns with R* numbers are from the RRUFF (Lafuente et al., 2015) database1, with 96- numbering from free COD library, and with “AMCSD” from the American Mineralogist Crystal Structure Database2.
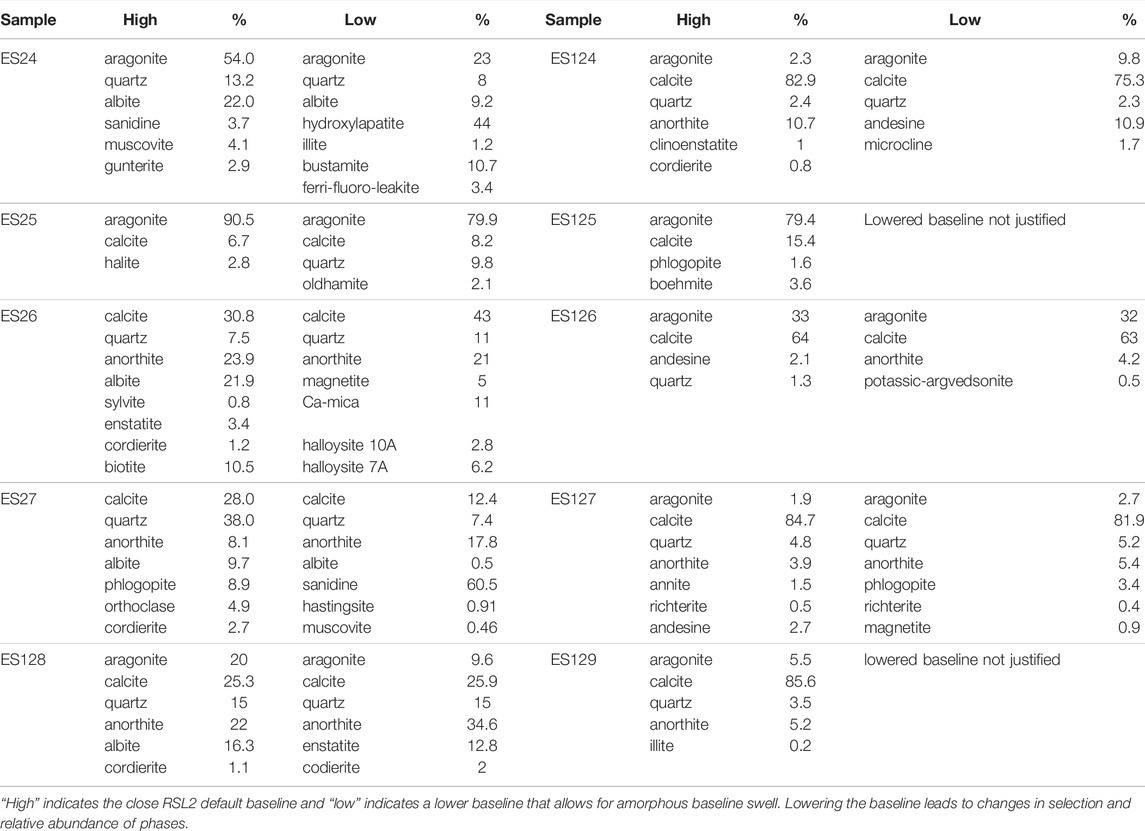
TABLE 2. Quantitative XRD matching results.
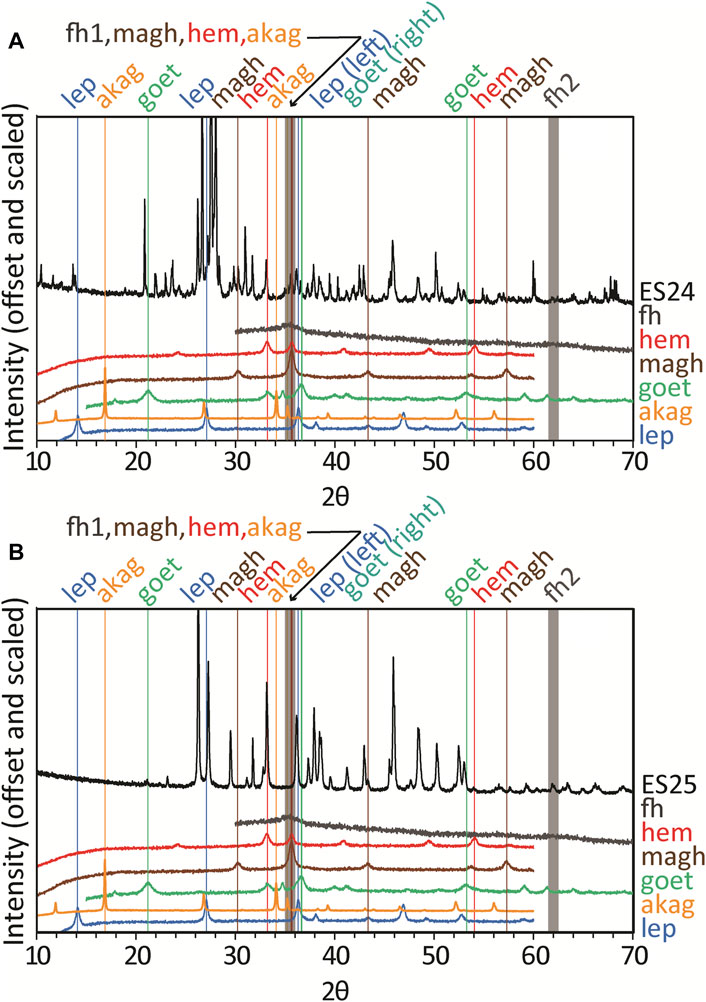
FIGURE 3. (A) XRD patterns of Blood Falls colored sediment ES24 (sample from 2018) and (B) ES25 (sample from 2006) along with XRD patterns for nanophase iron (oxyhydr)oxides from Sklute et al., 2018b). Strongest reflections of each reference are noted with vertical lines in the same color as the reference pattern and abbreviations at the top. Many (oxyhydr)oxides have a reflection ∼36° 2θ, where 2-line ferrihydrite has one of its two broad peaks. Abbreviations are hem, hematite; goet, goethite; lep, lepidocrocite; magh, maghemite; akag, akaganeite; fh, ferrihydrite.
Overall, the samples contain combinations of precipitated calcium carbonates with other phases derived from weathering of the underlying bedrock that are common to the Antarctic soils. Iron (hydr)oxides that are believed to give Blood Falls its name are conspicuously absent from XRD matches. To search for candidate iron (hydr)oxides as minor, fine-grained phases, we manually searched for the strongest reflections in order to identify or eliminate possibilities (Figure 3 and Supplementary Figure S4). While detection of nanophase iron (hydr)oxides can vary, particles down to <5 nm still display XRD peaks (c.f., de Bakker et al., 1991), although ferrihydrite displays two broad peaks (for the “two-line” variety) for particle sizes <3 nm that can be swamped by reflections from crystalline phases. Through examination of prominent reflections from iron (hydr)oxides in areas where the XRD patterns have flat baselines, ferrihydrite and maghemite are the only phases that cannot be ruled out, although hematite may also be possible in ES25. If present, all represent trace phases.
Low 2θ peaks with reflections at 8.77° 2θ (10.07Å), 10.46° 2θ (8.45Å), and 12.50° 2θ (7.07Å) occur in most of the samples. Clays are often identified and discriminated by their few low 2θ reflections (Moore and Reynolds, 1997), but this procedure is difficult in complicated mixtures. However, generally clays can be classified as 7Å clays (reflection at ∼12° 2θ): kaolinite, halloysite, nacrite, and dickite; ∼10Å clays (∼8.8° 2θ): illite and smectite group minerals (montmorillonite, nontronite, saponite, sauconite, vermiculite); and 14Å clays (∼6.2° 2θ): chlorite group minerals (chlorite, chamosite, clinochlore) (McReynolds et al., 2008). While the specific identifications made by RSL2 may not be precise for the minor amounts found, many of these clays have been identified in Antarctic sediments (Claridge, 1965). The peak at 10.46° 2θ was frequently attributed to the silicate cordierite ((Mg, Fe)2Al3(AlSi5O18)), which is common in Antarctica, but other phases, like 10Å Halloysite, were preferred by RSL2 in some fits. A definitive designation for this minor component would require further chemical analyses and assumptions as to the commonality of phases between samples. Neither phase would contribute to the color of these sediments.
Fourier-Transform Infrared Spectroscopy (FTIR)
FTIR spectra for the 10 samples are shown in Figure 4 with reference spectra corresponding to XRD matches as well as likely minor phase candidates. Spectra for ES125, ES25, and ES126 all show characteristic absorptions of CO32− vibrations in aragonite (French and Wang, 1980): a broad, combined v3 absorption feature at ∼1449 and 1465 cm−1, a narrow v2 absorption feature ∼856 cm−1, a small doublet due to v4 absorptions at 712 and 700 cm−1, and a small v1 absorption at 1082 cm−1. Positions of these absorptions are diagnostic of specific carbonate species (Jones and Jackson, 1993). Sample ES24 has v1, v2, and v4 absorptions of aragonite but the area near 1460 cm−1 is shifted to higher wavenumbers, indicating admixing of an additional phase. The spectrum for ES128 shows a mixture of aragonite and calcite. Spectra of ES26, ES27, ES124, ES127, and ES129 all have absorptions consistent with calcite. No spectrum displays a v4 shifted to 738 cm−1 that would indicate siderite or 750 cm−1 for magnesite.
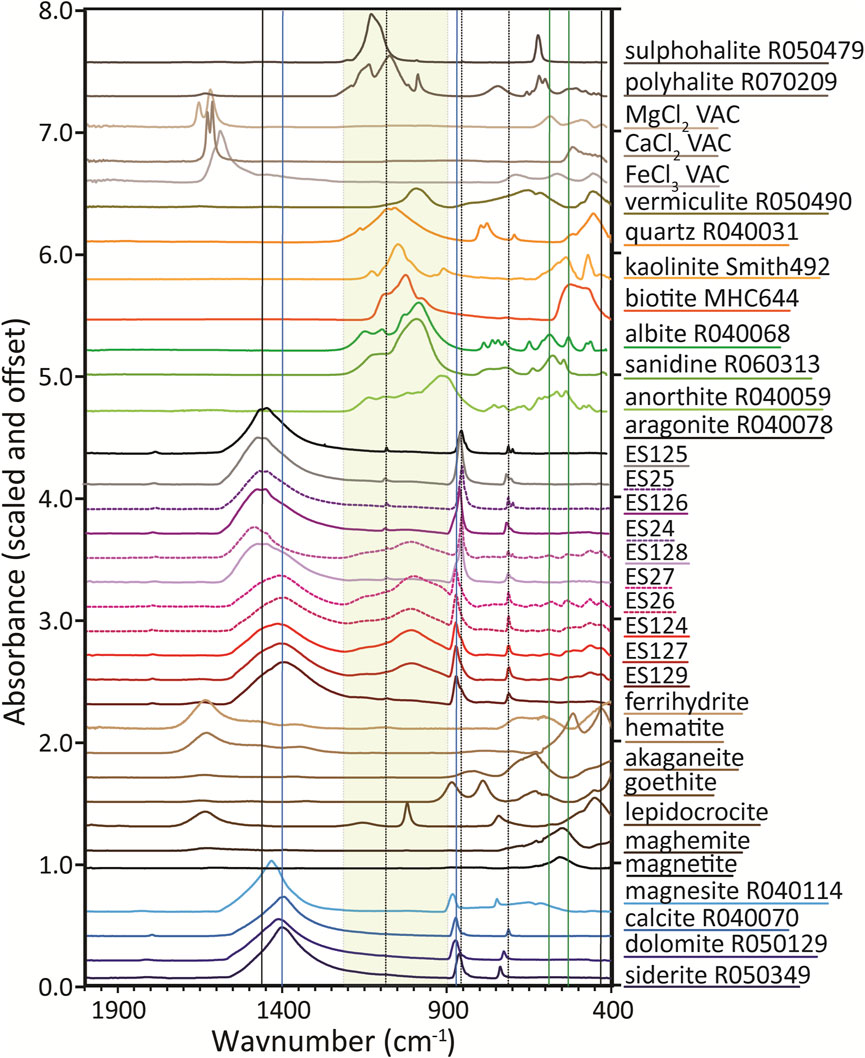
FIGURE 4. FTIR ATR spectra of Blood Falls samples along with FTIR spectra of representative identified, possible trace phases, and several conjectured phases. Note that FTIR reference spectra for several phases considered do not exist, are of insufficient quality, or were taken using a different experimental configuration (diffuse reflectance) and are therefore not directly comparable to our samples. Spectra for nanophase iron (oxyhydr)oxides are from Sklute et al., 2018b. All R* labeled samples are from the RRUFF spectral database (Lafuente et al., 2015). The “VAC” samples are from Sklute et al., 2018a). MHC and Smith samples are from Mt Holyoke and Smith Colleges’ private collections.
Si-O in silicates absorb broadly between 1200 and 900 cm−1, with additional sharper features below 900 cm−1 (Lane and Bishop, 2019) for relevant silicate species. Spectra for ES125, ES25, and ES129 display a slight bulge centered ∼1005 cm−1 that might represent feldspar, though feldspar is not seen in two of those XRD patterns. In spectra of ES128 and ES126, the slight bulge is shifted to ∼1015 cm−1 and 1021 cm−1, respectively. While ES128 shows abundant feldspar, ES126 does not. Spectra for ES24, ES27, ES26, ES124, and ES127 all display a prominent set of absorptions here. However, the prominence of the features in FTIR do not correlate with the relative percentage of feldspar and/or quartz in the XRD (Table 2), highlighting the different sensitivity of each technique towards certain phases and possible sample inhomogeneity.
FTIR data allow certain phases to be ruled out. The prominent goethite doublet at 883 and 786 cm−1 is notably absent, as are the sharp lepidocrocite peak at ∼1020 cm−1 and the distinguishing asymmetric feature from akaganeite at 634 cm−1, although, very small amounts of akaganeite cannot be ruled out in the FTIR spectra of ES26 and ES27. Magnetite and maghemite form a compositional and spectral continuum for their main feature in the 560 and 550 cm−1 region, but this region coincides with a dip in the Blood Falls spectra, making them unlikely. However, maghemite absorbs at the low wavenumber end of this range where its peak could hide under the shoulder of another feature. The distinguishing doublet of hematite at 525 and 443 cm−1 could be present in the spectra for ES24, ES124, ES26, and ES27; a slightly differently shaped set of absorptions in the spectra of ES126 (upon magnification) and ES127 could also hide hematite. The ES128 spectrum, upon magnification, has absorptions in this range, but they are more consistent with ferrihydrite than hematite. For the other samples, any possible absorptions are in the noise. Note that ferrihydrite is very difficult to distinguish in a mixture based on FTIR spectra because its broad merged doublet at ∼680 and ∼600 cm−1 is weakly absorbing compared to many more crystalline phases. Cropping and continuum removal may have inadvertently erased traces of ferrihydrite’s large absorption near 400 cm−1.
Raman Spectroscopy
Raman spectra (Figure 5) for the Blood Falls samples are shown with the same reference spectra as Figure 4, where available. Carbonate absorptions mirror IR findings. ES129 and ES128 spectra both display a sharp Raman peak at ∼464 cm−1, consistent with quartz, though both samples appear spectrally flat through the Si-O absorption region in their FTIR spectra. XRD finds quartz in both these samples, although the percentage is much higher in ES128. The differences may arise from the larger sampling size of the Raman relative to the FTIR, inhomogeneity of the sample, or the ATR attachment’s limited sampling depth.
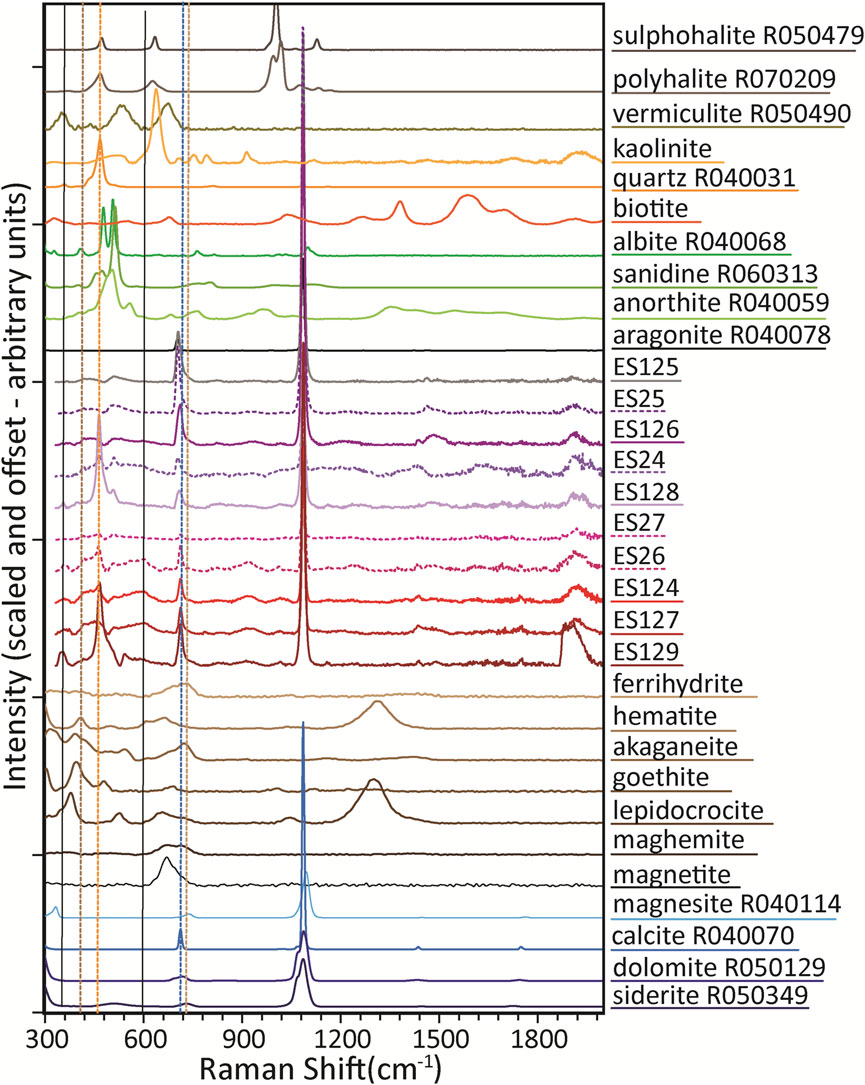
FIGURE 5. Raman spectra of Blood Falls samples along with Raman spectra of representative identified, possible trace phases, and several conjectured phases. Reference spectra are as in Figure 4, with the exception of biotite and kaolinite, which are Mt Holyoke library samples that are different from those for which IR data exist.
Shoulders to the right of the carbonate peaks near 715 cm−1 suggest potential for admixing of ferrihydrite, maghemite, or both. The main hematite peak at ∼223 cm−1 is below the wavenumber range for our instrument, so cannot be analyzed. Due to fluorescence and the potential for (hydr)oxide phases to change with the Raman laser, Raman at these standard wavelengths, laser power, and collection times is not the preferred method for detecting iron (hydr)oxides.
Visible and Near-Infrared Spectroscopy (VNIR)
VNIR spectra of the Blood Falls samples (Figure 6 and Supplementary Table S1) are all similar in overall spectral shape, appearance, and position of spectral features, with a deep absorption near 0.38 μm and a shallow absorption near 0.91 μm. These are consistent with Fe3+ spin-forbidden crystal field transitions, although contributions from other 3d elements in the structure cannot be ruled out (see Reddy et al., 2012 for a full review of crystal field energies). Fe2+ crystal field transitions can occur in the same location for minerals like pyroxene, but those minerals also display a broad absorption above 1.9 μm not seen in these spectra. Other common Fe2+-bearing minerals that do not contain prominent NIR Fe2+ features generally have absorptions centered at higher wavelengths (e.g., 1.3 μm for Fe2+ in feldspar).
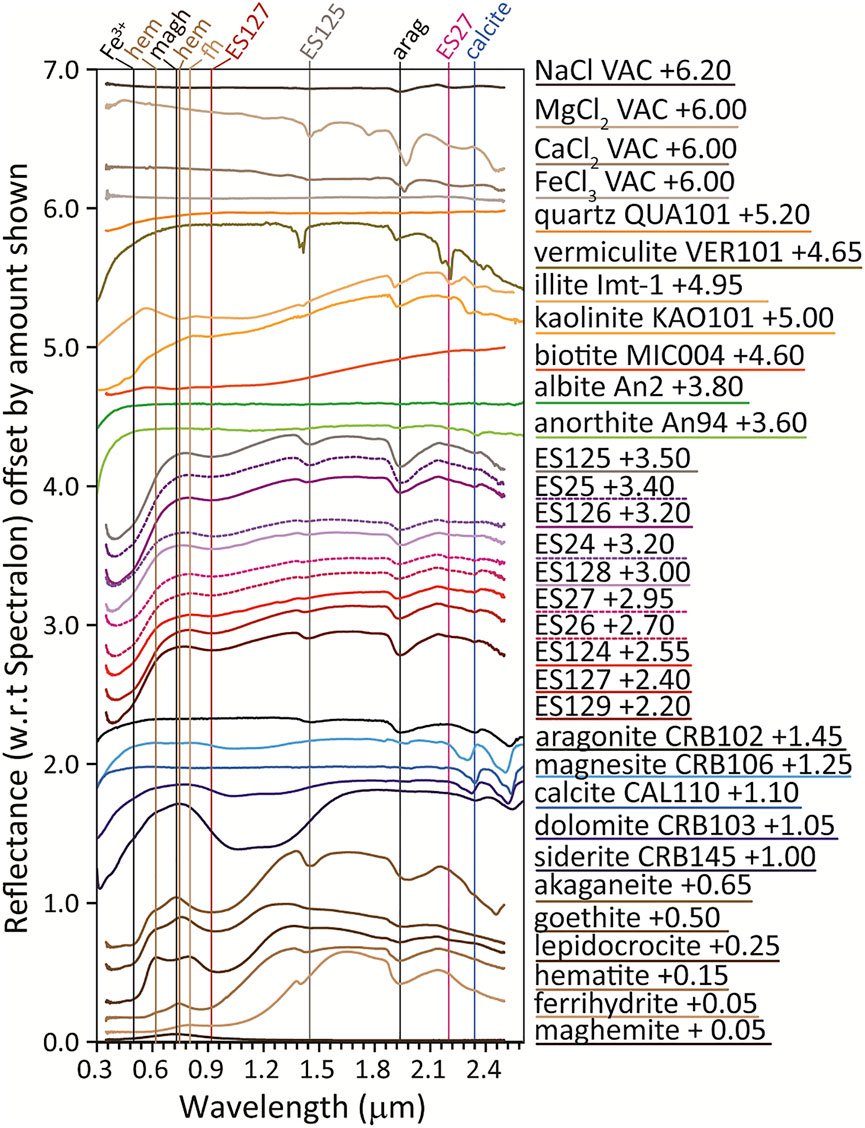
FIGURE 6. VNIR spectra of Blood Falls samples along with reference spectra. (Hydr)oxide spectra are from Sklute et al., 2018b), chloride “VAC” spectra are from Sklute et al. (2018a), all other spectra except illite (which is RELAB sample c1jb782) are downloaded from the Center for Terrestrial and Planetary Exploration (C-TAPE) public archive3.
The combination of Fe3+ absorptions in the VIS leads to the apparent maxima at ∼0.62 and 0.80 μm that allow for discrimination of several iron (hyrd)oxides when they are major phases in a mixture (Sklute et al., 2018b). The position of the VIS maxima in these samples is variable (Supplementary Table S1) and ranges from 0.760 to 0.802 μm. The longer-wavelength Fe3+ absorption ranges from ∼0.903 to 0.938 μm. Based on the positions of these features, spectrally prevalent akaganeite or lepidocrocite (which have two maxima) can be ruled out. The values are closest to those of goethite, which can have one or two maxima. Hematite’s main absorption and VIS maximum appear at 0.881 and 0.746 μm, respectively, much lower than our samples, and ferrihydrite’s are generally higher than in our sample (Supplementary Table S1).
The hydration feature near 1.4 μm is either a sharp, asymmetric feature ∼1.41 μm or a more symmetric, rounded absorption ∼1.45 μm. The sharper feature is consistent with a mixture of ferrihydrite and hematite, while the rounded one closely matches akaganeite. The hydration feature near 1.9 μm spans a range of 1.925–1.945 μm, and is consistent with several (hydr)oxides (Supplementary Table S1). Hydration features cannot definitively be used to identify these minerals but can be used to rule out phases or lend support to identifications by other techniques. Noise complicates assessment of the absorptions between 2.2 and 2.4 μm, but there appear to be up to three main absorptions. Most prominent is the consistent absorption near 2.34 μm, which matches the third overtone of the v3 vibration in carbonates (Hunt and Salisbury, 1971). Carbonates show an additional four bands in this region, but their positions cannot discriminate calcite and aragonite (Gaffey, 1987).
Mössbauer Spectroscopy
While iron (hydr)oxides in large grain sizes are easily identifiable using Mössbauer spectroscopy, parameters for nanophase samples are complicated by overlapping peak parameters and grain size effects (superparamagnetism). Mössbauer is useful in this study for investigating changing populations based upon different preparation techniques (e.g., bulk sample vs supernatant). The 295 K spectra and fit parameters for ES24-27 as both supernatant and bulk (Figure 7) show that the percentage of ferric iron (quadrupole splitting (QS) values <1.3 mm/s) is greater in the supernatant samples. The ferrous doublet parameters do not match those of carbonate, which has a center shift (CS) ≈ 1.28 mm/s and QS ≈ 1.5 mm/s in Ca(CO)3 and CS ≈ 1.23 mm/s and QS ≈ 1.8 mm/s in Mg(CO)3 (Srivastava, 1983). Attempts to force those parameters did not result in satisfactory fits. While it is unlikely that either ferrous distribution represents a single site in a single mineral, the parameters are broadly consistent with pyroxene and amphibole. For the ferric phases, the center shifts (CS) of the two distributions are generally higher and the QS values lower for the supernatant samples, particularly for the higher QS doublet. These fit results are consistent with a mixture including some ferric iron in feldspar and amphibole for the bulk samples and more consistent with clay and/or (hydr)oxide for the supernatant samples (Dyar and Sklute, 2019). Two bulk samples also contain sextet structure with parameters matching hematite, but this sextet was not observed in the supernatant samples. Perhaps the hematite is embedded larger quartz grains.
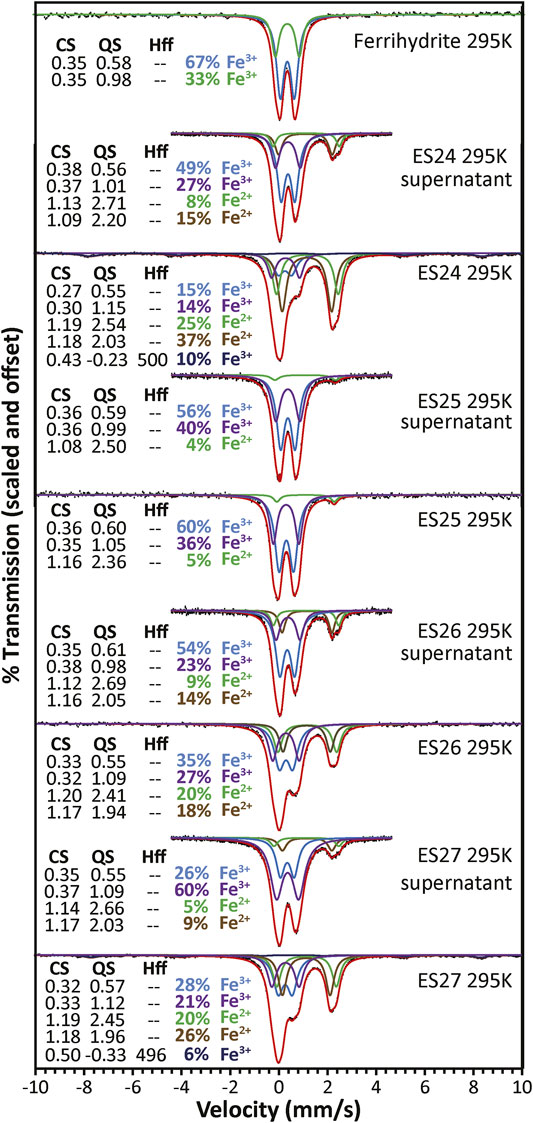
FIGURE 7. Mössbauer spectra of Blood Falls samples ES24-27 prepared as both bulk and supernatant along with a Mössbauer spectrum of ferrihydrite. Fit parameters are listed on the plot. CS, center shift in mm/s; QS, quadrupole splitting in mm/s; Hff, hyperfine field in kOe. Each doublet or sextet may represent a single iron environment or, more likely, a mixture of different iron environments across one or multiple minerals. The percentage listed for each distribution is the % area in that doublet or sextet is only the mol% in an individual iron site if 1) it is known that the distribution only represents iron in one site and 2) if the value is corrected by the recoil free fraction for that site in that mineral.
The change in Mössbauer parameters with temperature, including the temperature at which a sample magnetically orders, can help with discrimination of phases. All nanophase iron oxides whose vibrational spectra are reported in Sklute et al. (2018b), and shown in previous figures, magnetically order, at least partially, above 4 K. However, only two minerals: nanophase lepidocrocite and ferrihydrite are still doublets at 80 K. All Blood Falls samples also magnetically order below 80 K, ruling out goethite, akaganeite, magnetite, and maghemite as possible sources for the iron in these samples, unless the grain size is < 3 nm. Even hematite with a <10 nm grain size will have sextet structure near room temperature (c.f., Kim et al., 2001). However, it has been shown that impregnating small pores (pores in silica gel beads or zeolite supercages) with iron solutions and then oxidizing the resultant solid, creates nanoscopic hematite or hematite-like encapsulated nano particles. The Mössbauer spectra for these can persist as doublets far below room temperature (Morris et al., 1989; Dormann et al., 1998). Interesting to note is that the thermodynamically stable phase and dominant surface domain of such particle is maghemite (Zhang et al., 2003; Navrotsky et al., 2008).
Supplementary Figure S5 shows the 4K spectra of the Blood Falls samples compared to the ferrihydrite and lepidocrocite. Ferrihydrite is a better match to the shape of the combined sextet band envelope, although the hyperfine field values are generally lower than those for ferrihydrite. The full temperature series and Mössbauer parameters for Blood Falls samples are presented in Supplementary Figures S6–S13 and the raw data, along with data for many other minerals, are available at https://mossbauer.mtholyoke.edu, specifically at: https://mossbauer.mtholyoke.edu/group/Terrestrial+Samples.
Inductively Coupled Plasma Optical Emission Spectroscopy (ICP-OES)
Results of ICP-OES analyses are listed in Table 3. While it is understood that the absolute concentrations are dependent upon original ice content, as well as changes caused by removal of sample for other techniques, relative concentrations provide context for the mineralogical analyses. However, due to hyper-concentration, calcite fleurettes often formed on the pipette tip while extracting the sample. In these cases, repeat extractions were made to obtain the full 200 μm. It is noted, however, that there may be slight differences in final concentrations, and thus these results provide broad strokes trends rather than precise information.
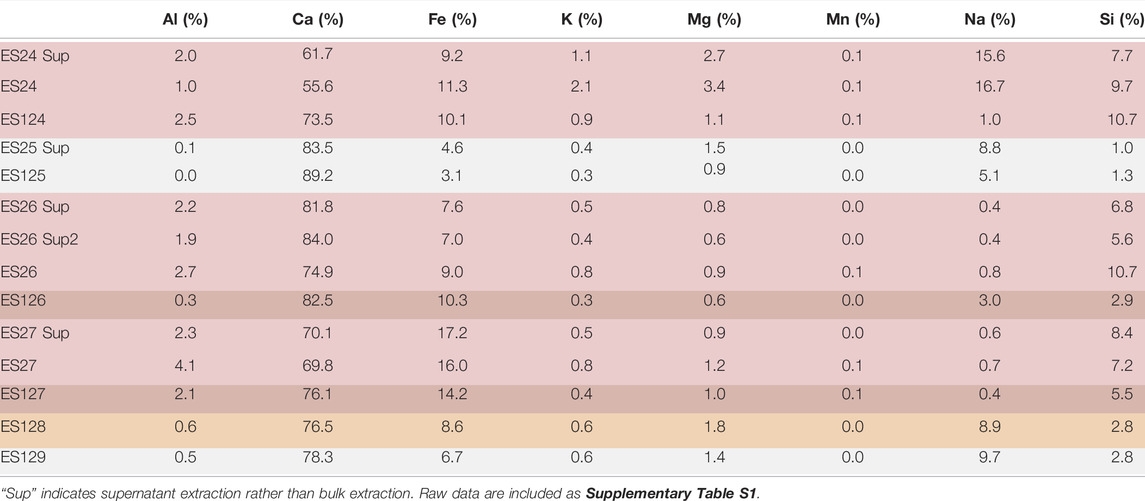
TABLE 3. ICP-OES data for Blood Falls samples converted to percent of phases analyzed.
There are no distinct correlations between any of the elements in the ICP data. However, when considering the relative amounts of iron and the spectral features in the FTIR, it is apparent that samples with >10% Fe have low wavenumber features consistent with possible hematite while those with very small amounts of Fe, like ES25 and ES125, do not. This is not a large enough dataset to conclude a trend, but these same samples generally have less calcium and more aluminum. Strangely, high calcium does not correlate with more carbonate in these samples. For example, ES128 and ES129 have similar relative amounts of calcium but ES128 is carbonate-poor by XRD while ES129 is carbonate-rich. However, the two samples with the most relative calcium, ES25 and ES125, also have high carbonate concentrations according to XRD.
Scanning Electron Microscopy (SEM)
SEM images show primarily large (>10 μm), backscatter-dark grains that have chemistries consistent with feldspars, intermediate (in size and brightness) flakes and grains consistent in morphology and/or composition with carbonate, and fine, backscatter bright, detrital agglomerates and flakes that seem to house iron (Figure 8 and Supplementary Figures S14–S17). The qualitative EDS likely samples a larger area than marked on the figure. However, elevated Fe in these samples is most often associated with elevated Al. This could be due to Al substitution in iron (hydr)oxide, which is common in nature (Schwertmann and Carlson, 1994), or it could indicate an iron-rich aluminosilicate given that Si is also elevated in some (but not all) spots analyzed. Alternatively, there may be abundant Al in the sample under the Fe-rich fragment that the beam has also sampled. This last option seems likely for at least some of the samples because in ES25, which is mostly carbonate by XRD, and has very little silicate in SEM images, there is also almost no Al in the iron-rich grains (Figure 8). However, more than one scenario could be at play in these samples.
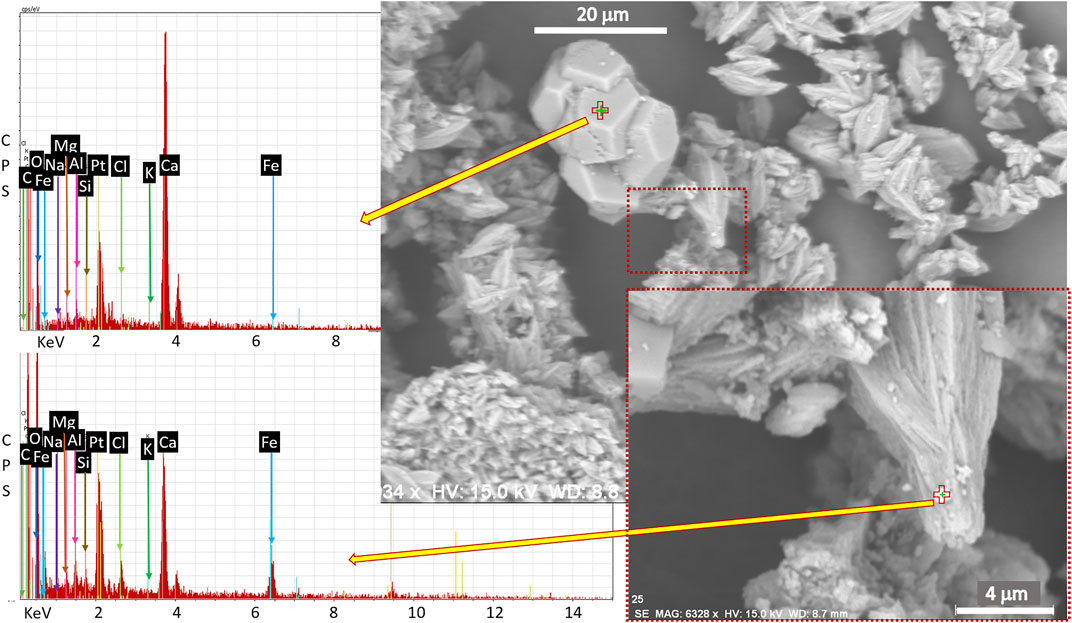
FIGURE 8. Backscatter SEM image of sample ES25 with EDS of points indicated by red and green crosses. The small, bright grain agglomerate on the tip of the aragonite crystal is enriched in iron and not enriched in aluminum with respect to the underlying phase (data not shown). The energies of both identified elements and those searched for but not identified are indicated on the plot. Pt is used to coat the sample for better conductivity.
The chemistry of the iron-rich agglomerates is variable but often consistent with amphibole, clay, and, in very rare cases, with iron (hydr)oxide. No iron is found in any of the carbonate grains at the resolution of SEM; the iron seems to be sequestered in other phases. The feldspar compositions of this limited sampling are not consistent with the XRD, showing anorthite in ES24, and orthoclase in ES26.
Electron Probe Micro-Analysis (EPMA)
EPMA provides quantitative compositional information that can clarify the distribution of cations in and between mineral grains in a sample. For Blood Falls samples ES24-27, supernatant material was analyzed for Na2O, SiO2, CaO, MnO, FeO, MgO, Al2O3, TiO2, and SO. As with SEM, the samples appear as large, backscatter dark grains with dark and bright, detrital coatings. As expected, many of the larger grains sampled have compositions consistent with calcium carbonate, with low FeO, ranging from 0.1 to 2.15 wt%. In other cases, when CaO of a spot is below ∼50 wt%, FeO is elevated, typically 10–30 wt%. Spatially related points with CaO <50 wt% and FeO near zero have Al2O3 values comparable to the surrounding FeO numbers. SiO2 values near 50% indicate an Fe-bearing silicate species that potentially forms a solid solution between Fe and Al. Some very bright grains are also found in ES25 with ilmenite composition. No point compositions indicate the presence of iron (hydr)oxides. EPMA results are included in Supplementary Data.
Transmission Electron Microscopy (TEM)
TEM has the highest spatial resolution of all the techniques presented here. It is also unique in that it can combine textural, structural, and chemical information on the nanometer scale. We did not endeavor to identify all minor and trace level constituents in these samples, thus phases identified are likely to be abundant. TEM is biased to the micrometer to nanometer size particles as larger particles will be too thick to be electron transparent. Thus, large particles easily identified by other methods (e.g., SEM, XRD) may be absent from TEM results, while the nature of nanoparticles are more clearly identified.
TEM taken at Mt. Holyoke College, without SAED, was performed on the supernatant of samples ES24-27 (Supplementary Figures S18–S21). Sample ES24 has the most variety in grain shape, displaying lathes, flakes, and grains. One interesting feature of this (and all) the samples is botryoidal concretions of small spherical grains that were found by SAED to be near XRD amorphous and variable in composition (see below). ES24 also displays very fine-grained agglomerates of semitransparent spheres that are consistent in morphology and appearance with ferrihydrite or other spherical nanophase (hydr)oxides (hematite or maghemite) (Supplementary Figure S18). TEM images of ES25 displayed large grains and some flakes as well as the agglomerates of very fine spheres (Supplementary Figure S19). Mixed into these agglomerates are slightly larger, opaque, rounded grains that may be the ilmenite sampled in EPMA. Samples ES26 and ES27 (Supplementary Figures S20, S21) are similar and have greater proportions of large, layered structures and botryoidal fragments, as well as sparse lathes. The fine-grained agglomerates of spheres are less prevalent in these samples.
High-voltage analytical electron microscopy at the Johns Hopkins MCP focused on four samples: ES26, ES125, ES126 and ES128. Here, the TEM was able to confirm many of the phases identified and inferred by other methods. Aragonite was the major phase found in ES26. Aragonite forms laths that consist of collections of nano-sized aragonite forming possibly by oriented attachment growth (Figure 9 and Supplementary Figures S22, S23). Coating the aragonite laths are amorphous Fe-rich nanospheres (AFNS) and nano clays (layered silicates, LS) (Figures 9B,C and Supplementary Figure S23). The few lattice fringe images of the LS exhibited 10Å periodicities. Calcite and albite were also identified (Figure 9D map). Other data is presented in Supplementary Figure S24.
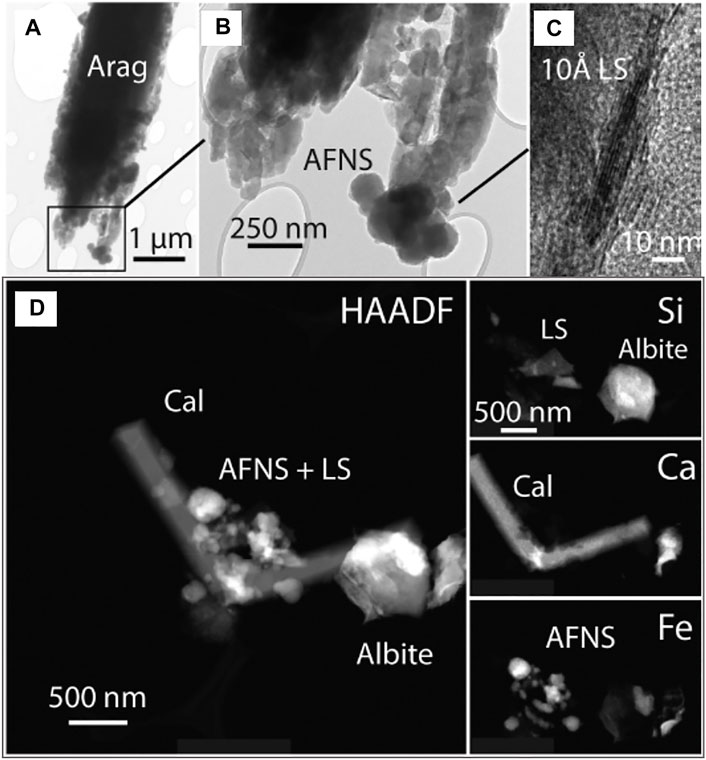
FIGURE 9. TEM Results for ES26. (A) Aragonite laths constructed from nanoaragonite in what may be an oriented attachment growth process. SAED pattern show twin orientations is given in Supplementary Figure S22. (B) Higher magnification image of lath tip containing amorphous Fe-rich nanospheres (AFNS) and nanoaragonite. (C) HRTEM lattice image of nano-sized layered silicate (LS) on the perimeter of AFNS. EDX analyses indicate that the LS is also Fe-rich. (D) Collection of phases in ES26 examined by high-angle annular dark-field (HAADF) imaging and Si Kα, Ca Kα, and Fe Kα X-ray mapping.
Sample ES125 contained aragonite in the form similar to dog tooth spar (see Supplementary Figure S25). Also found in ES125 was biotite and graphite (Supplementary Figures S26, S27). ES125 appears to have less AFNS.
ES126 had aragonite forming seed-shaped aggregates that collect into “star” mega-aggregates (Figures 10A,B). In Figure 10B, a coating of nanoparticles of amorphous Fe-rich and aragonite decorate the aragonite seeds. Figures 10C–E contain an enlargement of the AFNS, an HRTEM image exhibiting no lattice fringes, and an SAED pattern showing aragonite spot reflections and amorphous rings from the AFNS, respectively. A collection of AFNS and nanoaragonite particles were examined by STEM EDX in Figure 10F. The AFNS contained Fe, Ca, Cl, and Si in decreasing amounts. More images and data are found in Supplementary Figures S28–S32.
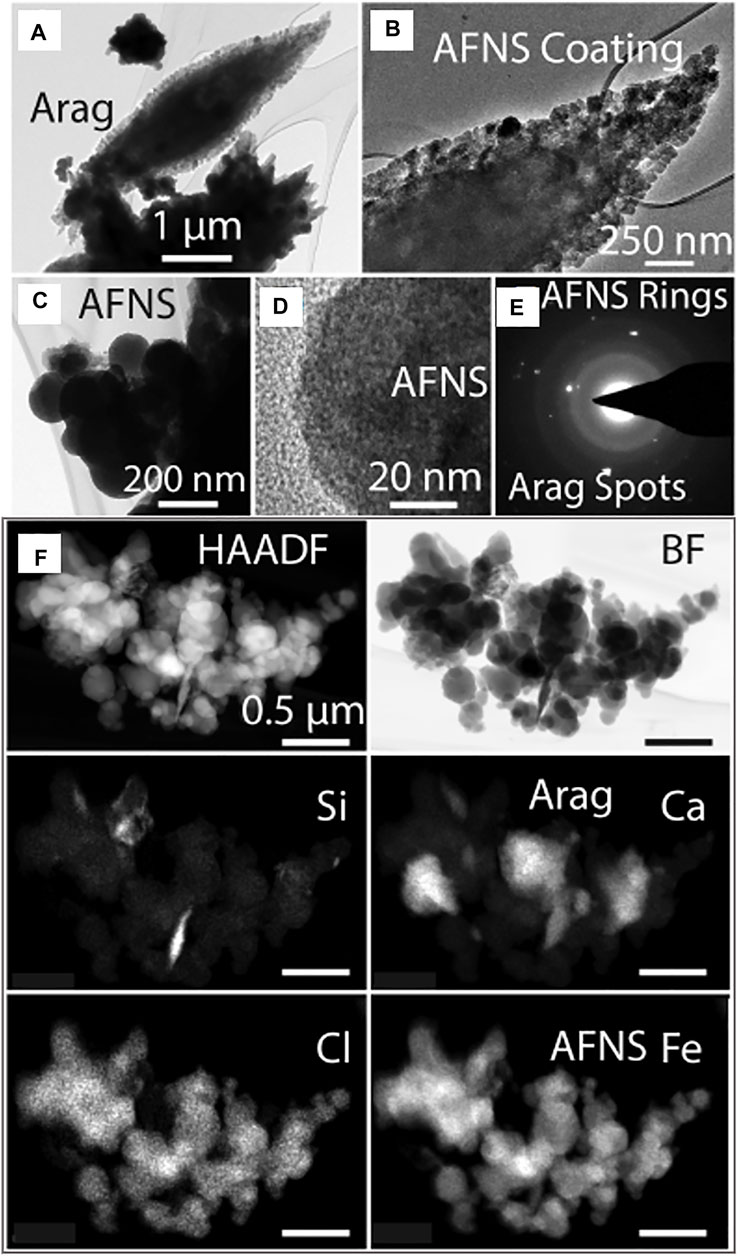
FIGURE 10. TEM Results for ES126. (A) Aragonite crystals in the “seed” and “star” habit. (See Supplementary Figures S28, S30 for more “star” aggregates). Dark particle at top is a cross section of the “seed” habit (see also Sup images for ES128). The “star” habit also is decorated by AFSN. (B) Coating of AFNS and aragonite nanoparticles on the “seeds.” (C) Small collection of AFNS attached to a larger aragonite crystal. (D) HRTEM image of a single AFNS particle showing its amorphous nature (no lattice fringes). (E) SAED pattern of collection of AFNS. The AFNS yields broad rings typical of amorphous materials. Individual spots were indexed as being from adjacent aragonite. (F) HAADF and bright-field scanning (BF) TEM images of a cluster of AFNS and aragonite particles. Images below are X-ray maps for Kα lines of Si, Cl, Ca and Fe. The AFNS particles have significant Cl, Si and Mg (not shown). The bright area in the Si map belongs to a layered silicate (K-rich).
ES128 also contained the aragonite seeds (Figure 11A) and calcite rhombs (Supplementary Figures S33–S35). The collection of AFNS in Figures 11B–H was thoroughly examined by EDX, SAED and dark-field imaging. During the course of examination, this collection of irregularly-shaped and spherical nanoparticles experienced beam damage. With continued exposure, the irregularly shaped nanoparticles began to precipitate nanocrystalline phases just a few nanometers in size. The image and SAED pair in Figures 11D,E captured the initial state of all the nanoparticles, while Figures 11F,G were taken after several minutes of electron-beam exposure. Analysis of the ring pattern indicates that the proto nanophase produced by beam damage in Figures 11F,G had peaks that fit the spinel structure (magnetite or maghemite or something else; Supplementary Figure S36). Interestingly, not all the nanophase material damages to spinel. The spherical AFNS do not damage, but more irregularly shaped nanoparticle material associated with the AFNS do. This implies that there are more than one type of amorphous material in ES128, one of which was only revealed through differential beam damage. EDX analysis of several AFNS collections confirmed that Cl was a major element in AFNS (Supplementary Figure S37).
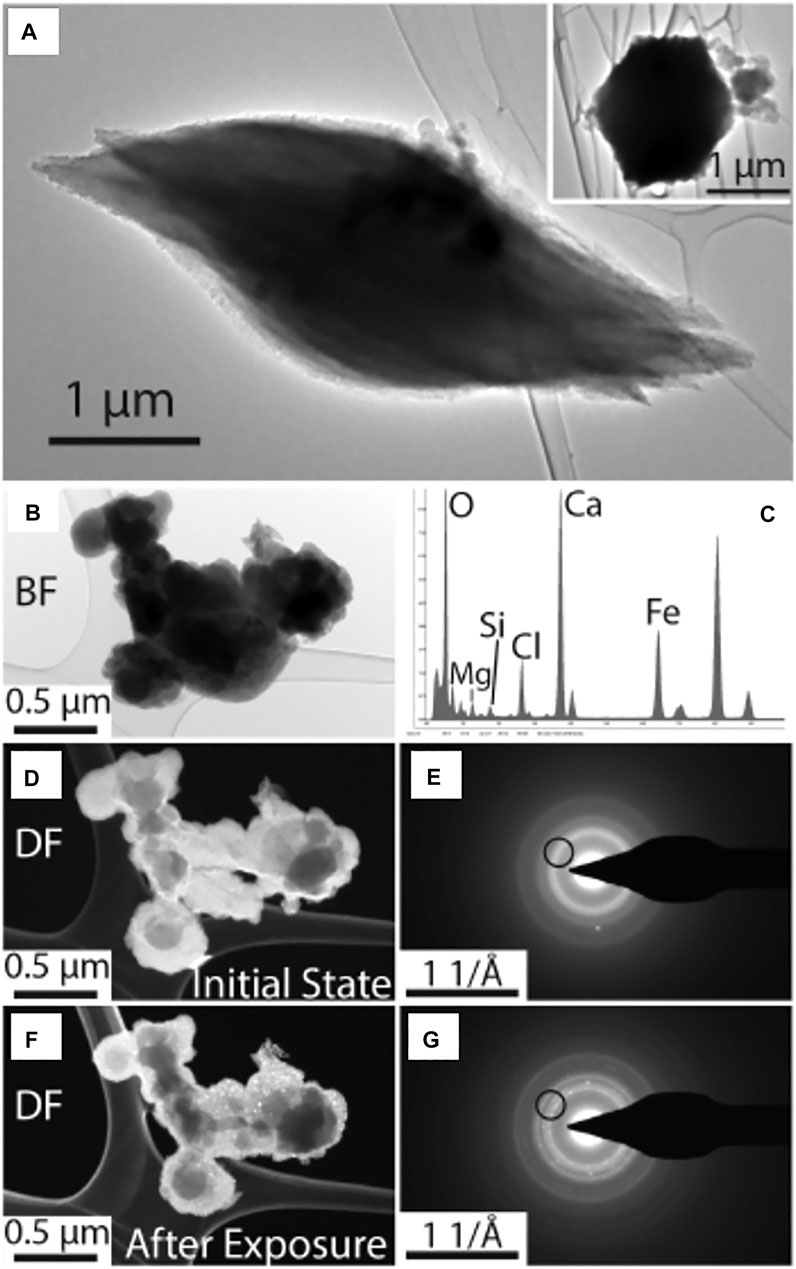
FIGURE 11. TEM Results for ES128. (A) Aragonite in the “seed” habit. The cross-section profile in included in the inset image. (B) Bright-field image of AFSN in ES128. (C) EDX analysis of entire AFNS collection. (D) Dark field image of the initial state of AFNS and it’s SAED pattern. The beam used to obtain the DF image is indicated by the black circle in (E,G). After several minutes of exposure to the electron beam, parts of the collection alter to crystalline nanoparticles. The nanoparticles are bright in (F) and yield spots in SAED in (G). AFNS that are truly spherical do not damage while more irregularly shaped amorphous material crystallize into a spinel-like structure (see Supplementary Figure S36).
Discussion
Difficulties in Matching Analyzed Samples to Source Samples
The extensive analyses in this study represent a suite of techniques that would be applied for analyzing mineralogy during Martian sample collection (c.f., Carrier et al., 2021; Tait et al., 2021; Tosca et al., 2021). Many of the spectroscopic techniques can be used in situ on other planets. Here we use them for phase identification and to provide potential reference spectra for in situ analyses. The inability to bring the spectroscopic equipment to the Antarctic field campaigns results in uncertainties comparable to those that may be faced in analyzing returned samples.
For a remote and dynamic feature like Blood Falls, and surely for Martian samples, the sample returned to the laboratory may not be the same as the sample collected. Collection of materials can bias towards what fraction of material can be aseptically retrieved with sampling instruments. Freezing and thawing, including in transport, can redistribute elements among soluble phases (freezing out; Keys, 1979) depending on element mobility and phase solubility. Dissolved ions in a saturated brine will partition into phases based on temperature, pressure, atmospheric moisture, and method and rate of water removal (Keys, 1980 and references therein).
Extraction methods for analyses can alter remaining sample concentrations and phases (Tosca et al., 2021). For instance, if the sample is thawed to homogenize the fluid before extraction, thawing conditions may change the phase distribution with respect to the original environment. Alternatively, if a solid sample is carved off a frozen mass, there is little guarantee that the sample will be representative because sediment likely settled during initial freezing or any episode of partial melting. Dry sample is required for many spectroscopic techniques. Freeze-drying a frozen sediment sample should limit the loss of dissolved ions through a filter, but the process may initiate formation of amorphous phases from crystalline phases or from solution (e.g., amorphous sulfates; Sklute et al., 2015). Filtering loses soluble ions through the filter. If the sample is air dried, should the site conditions be mimicked? If so, how long would it take a sample to dry under those conditions? Is the average temperature and relative humidity precise enough, or should they be cycled for realism? These are questions that are carefully considered for returned samples where the volume is incredibly limited (c.f., Carrier et al., 2021; Tait et al., 2021; Tosca et al., 2021).
For the Blood Falls samples, it is likely that some of the soluble salts have changed due to collection, transport, storage, and analysis preparation methods. That was an anticipated tradeoff given the scope of our investigation. The results herein significantly extend previous analyses without using overwhelming resources.
Using Complementary Techniques
Each technique used here delivers a piece of the puzzle and most techniques can be used to not only look for phases but also rule them out with varying degrees of certainty. XRD ruled out several iron (hydr)oxides, like goethite, lepidocrocite, and akaganeite above its detection limits. XRD is the gold standard for mineral identification, but struggles with minor and amorphous phases especially when there is an amorphous swell to the baseline. XRD identified major species and proportions of carbonate and feldspar minerals and identified minor phases, like micas, pyroxenes, and clays (the latter based on characteristic low 2θ reflections).
While FTIR (ATR) is not directly comparable to emissivity or reflectance MIR spectra on orbiters or rovers (Sklute et al., 2018a), results are broadly comparable to spacecraft data. FTIR in this study identified and discriminated the dominant carbonate(s), indicated the composition of the feldspar, and ruled out several iron (hydr)oxides (akaganeite, magnetite, lepidocrocite, goethite), while providing supporting evidence for others, like hematite.
VNIR spectra deliver important information about the electronic structure of transition metals in a sample and are routinely used to identify certain silicates, sulfates, and oxides (Lane and Bishop, 2019; Bishop et al., 2020). VNIR spectra are directly comparable to remote sensing spectra, however, quantitative deconvolution of VNIR spectra requires a significant effort. At Blood Falls, VNIR spectra indicate ferric iron is spectrally dominant. VNIR Fe3+ spectral features ruled out lepidocrocite and indicated that if hematite is present, it is not the only iron (hydr)oxide.
Raman spectroscopy is completely complementary to FTIR, providing valuable independent phase confirmation and identification due to the different selection rules between the two techniques (Sharma and Egan, 2019). Raman spectroscopy further validated the type and relative abundance of carbonate present and indicated significantly more quartz in one sample than seen via XRD. Raman spectra also revealed several absorptions that have not been attributed to a crystalline phase. Further analyses may reveal these absorptions belong to the amorphous Fe-rich nanospheres (AFNS) identified by TEM.
Mössbauer spectra, which only record phases containing Fe showed that the majority of the Fe3+ is in the fine fraction. Multi-temperature Mössbauer ruled out all iron (hydr)oxide species that magnetically order above 80 K, indicating a nanoscopic (<3 nm) phase that could be either ferrihydrite or lepidocrocite (the latter ruled out by other techniques). Mössbauer is likely predominantly sampling the compositionally and structurally diverse AFNS, a fact that has interesting implications for Mars.
ICP-OES constrained the total amount of iron and thus possible phase(s) in which it was contained, and was used to look for correlations between that iron and other elements. ICP data indicated no correlation between iron and the other major elements analyzed except perhaps Al, and confirmed that samples with fewer spectral features arising from iron indeed contained less iron, an important conclusion in a system with apparently significant spectral masking.
Since the bulk analyses here were equivocal, various forms of microscopy were used to look for the phases housing iron and to understand the relationship between those phases and the bulk sample. SEM with EDX showed that iron was concentrated in nanoscopic detrital fragments clinging to the surface of larger grains. It also suggested that these grains were primarily not iron (hydr)oxides, indicated a possible correlation between Fe and Al. It unequivocally resolved the chemistry of the feldspars sampled and showed the varied morphologies of the abundant carbonates.
EPMA unequivocally measured a small but detectable iron concentration in the carbonates (≤2%). EPMA confirmed that there is an inverse correlation between Fe and Al in these samples and that iron is nearly absent from phases where CaO content is >50%.
In this study, TEM revealed abundant nanospheres of variable composition consistent in morphology to ferrihydrite, but structurally amorphous. These AFNS were elevated in Cl and other cations besides iron, indicating a unique mineralogical aspect of these systems. Although electron energy-loss spectroscopy was not employed in this investigation, it would have yielded important information about the valence state of Fe in the AFNS. This would have added definition to the Mössbauer results by identifying the Fe3+/Fe 2+ ratio in AFNS.
Cause of Color at Blood Falls
One of the most intriguing aspects of Blood Falls is its color. Early work on the iron-rich effluent at Blood Falls (Hamilton et al., 1962) recorded a “yellowish brown” staining to the outflow fan. The silt recovered was “yellowish orange” and was observed (presumably by microscope) to contain calcite, gypsum, and about 2% limonite (a hydrated iron oxide concretion). Upon dissolution with HCl and reprecipitation with NH3OH, Fe(OH)3 was formed, confirming iron was indeed present in the original sample. Black et al. (1965) describes the feature at the terminus of Taylor Glacier as a “reddish-yellow ice cone.” They posited that the color was due to goethite, which was observed in laboratory samples (presumably microscopically), and also noted there were white, gray, yellow, tan, orange, and red “crystalline flowers.” Black et al. (1965) report that the insolubles in the saline fluid collected from the Taylor Glacier discharge were “mostly aragonite, quartz, and feldspar, with a little magnetite and mica.” The aragonite was identified by x-ray diffraction; it seems likely that the other phases were as well. Keys (1979) notes that “The icing is colored various shades of orange due to small amounts of hydrated iron oxides and silt.” However, both this paper and his thesis in 1980 base the identification on results from Black et al. (1965). The Black et al. paper states that the icing’s orange to brown color results from “finely divided (i.e., x-ray amorphous) goethite HFeO2 (Black et al., 1965; J.H. Johnston, Chemistry Department, VUW, pers. comm.)” with no additional detail. Stephens and Soegel, 1969 analyzed samples from the 1968–1969 field season using petrography and x-ray diffraction and found calcite and gypsum. They note that the “fine-grained orange material” and “red euhedral crystals” are colored by iron, which is found to be 0.68 wt.% in the calcite, although the chemical analysis technique is not described. Iron in the discharge, i.e., the subglacial brine that feeds Blood Falls, ranges from ∼476–3000 μM (Lyons et al., 2019), and is reported to be mostly reduced iron as Fe2+. The effluent flows out clear, but the outflow fan progressively reddens with time as saturated minerals phases precipitate, oxidize, and concentrate through ice ablation (Mikucki and Priscu, 2007; Badgeley et al., 2017). To our knowledge, no additional analyses of the mineralogy of Blood Falls has been reported; all subsequent references to the chemical composition of the deposit cite these few original articles.
Our study provides clear evidence that the original supposition that Blood Falls is colored by iron (hydr)oxides is not entirely valid. If we assume Fe is responsible for the red/brown color of Blood Falls, microanalyses identify two possible color sources: Fe in calcite and Fe in AFNS. Some spectroscopy techniques suggest the possible presence of small amounts of nanophase iron (hydr)oxides, but these phases are inconsistent with the observed VNIR spectra. Moreover, the VNIR spectra do not resemble those of Fe in carbonate and the Mössbauer spectra show no evidence for Fe in carbonate. We thus conclude that the red color at Blood Falls results from oxidation of Fe2+ dissolved in the subglacial fluid that does not readily transform to a crystalline phase. Rather, it appears to form nanospheres of a kinetically metastable hydroxylated ferric iron material. Spectroscopically, this phase is similar to hematite and ferrihydrite, but TEM results show unequivocally that the AFNS are not crystalline. It is not uncommon to have material that exhibits local bonding environments of a particular structure, but are amorphous (Livi et al., 2009).
Iron need not be the only cation responsible for the color of Blood falls. Absorptions in the VIS portion of the spectrum that cause the perceived color can be due to electronic transitions in a variety of 3d transition metal elements in addition to several other electronic processes, the most notable of which is Fe-O charge transfer (Loeffer and Burns, 1976; Hunt, 1977; Nassau, 1978). In fact, many Fe-free minerals like wulfenite (Pb(MoO4)) and Hopeite (Zn3(PO4)2•4H2O display orange hues similar to these samples. It is also interesting to note that the color of amorphous Fe-bearing solids formed from the rapid dehydration of mixed brines or brines mixed with Mars regolith analogues form in a variety of colors depending on the dominant cations in solution (Sklute et al., 2018a; Sklute et al., 2020). For instance, concentrated solutions of ferric sulfate reacted with magnesite (MgCO3) form bright red solids that are partially XRD amorphous. When NaCl is also added, the solid takes on an orange color similar to the Blood Falls sediments (Sklute et al., 2020). While these mixtures are spectrally distinct from the Blood Falls samples, they indicate that Fe may not be acting alone to color this landscape. The EDX taken during TEM seems to support this conclusion, showing that Fe is accompanied by other elements, such as Cl, Mg, and Na (ES126; Supplementary Figure S32). The amorphous Fe-rich phase persisted in the sample for several years of storage, however, it may eventually ripen to form a crystalline phase.
Relevance to Mars Exploration
The CO2-rich early atmosphere on Mars should have produced carbonates through the interaction between CO2, water, and rock (Horgan et al., 2020). While carbonates are present (Horgan et al., 2020), the “missing Martian carbonates” have been a subject of significant interest (Fonti et al., 2001; Bullock and Moore, 2007; Wray et al., 2016). The prevalent carbonates at Blood Falls, in a region of sparse carbonates outside lakebed deposits (0–4.26 wt% CaCO3 in soils of Lake Bonney basin but typically <0.33 wt %; Foley et al., 2006), is an interesting finding from an analogue perspective. It is believed that the PCO2 under Taylor Glacier is ∼0.2 atm, and that the combined drop in PCO2 with rapid fluid dehydration at the surface leads to the precipitation of carbonate (Black et al., 1965). While precipitation of carbonate through depressurization is a well-known phenomenon (c.f., Uysal et al., 2009; Della Porta, 2015; Cosmo et al., 2019), the importance of this result is that it represents a surface manifestation of a subsurface environment. A carbonate-rich outflow fan on Mars could indicate a past or present-day subsurface brine saturated with CO2. On Earth, carbonate-rich brine can also indicate a subglacial carbonate formation and provides evidence of previous glacier extent (Blackburn et al., 2020; Lipar et al., 2021). On Mars, a carbonate fan could indicate a similar subsurface carbonate source. Important to note is that in the case of Blood Falls, this brine is habitable. While the mineralogy in and of itself is not a signature of life, it does indicate a place to look.
The other fascinating feature of the Blood Falls samples is the presence of AFNS that are rich in Cl. These nanospheres were present in both the air-dried and the freeze-dried samples, indicating that they were not a product of freeze-drying. Furthermore, the freeze-dried samples were found to be saturated with NaCl, and were thus rinsed and dried again before additional analysis. AFNS were abundant in samples stored frozen since 2018, indicating that they are slow to crystallize under storage conditions, consistent with the increased long-term stability of iron (hydr)oxides stored in cold fluid at circumneutral pH (Schwertmann et al., 2004; Sklute et al., 2018b). AFNS were less prevalent in the 2006 samples (ES25; ES125) than in the 2018 samples; ICP results show that %Fe values for ES25 and ES125 were the lowest of all samples, so it is possible that the solution chemistry of the brine changes with time. The continued movement of the glacier (typical ice flow of 3 m/yr) coupled with supraglacial melt would not only have scoured some of the previously discharged material, but also the continuous process of brine convection would continuously scavenged new material. In this scenario, the brine would be in thermal disequilibrium with newly opened crevasses and brine in contact with the colder ice would freeze, but in doing so would warm the surrounding ice through latent heat of freezing (Badgeley et al., 2017). Thus, liquid brine could potentially undergo a constant process of ion depletion and enrichment as solubility driven dissolution, precipitation, and trapping progress along the freezing/warming front of the crevasse side walls. Some enrichment of ions in brine extracted from 17 m depth within a crevasse that feeds Blood Falls was measured (Lyons et al., 2019), however, the relatively consistent chemistry of discharge events (Lyons et al., 2019) seems to indicate this is not a dominant process. The carbonate-rich nature of these samples indicates that the over-pressurized CO2 that outgasses as the brine breaches the surface predominantly drive the mineralogy. This leads to two other possibilities: First, it may be that the AFNS are less prevalent in the 2006 samples due to ripening over time in storage. Second, the difference in AFNS prevalence could be due to the amount of time weathering on site between outflow and collection. A discharge event was documented earlier in the season in 2018, whereas in 2006, it is less clear if discharge occurred prior to collection. Extended time on the surface, however, may have simply depleted all iron, a theory supported by the ICP values. In either case, the ANFS are an intriguing analogue for the amorphous material on Mars and indicate that simple, end-member compositions, and single populations of amorphous materials, may not be realistic for natural environments when considering amorphous phases. The presence of amorphous and nanosized material at Blood Falls points out the importance of techniques that can identify the presence and nature of amorphous nanoparticles and the development of calibrations between those techniques and methods that can be used remotely.
Conclusions
This study applied a wide variety of bulk spectroscopic and analysis techniques as well as microscopic investigative tools to a set of 10 Blood Falls surficial grab samples from two field seasons to parameterize the mineralogy and iron distribution in those sediments. We found a calcium carbonate rich environment enriched in the weathered silicates of the underlying geological units. XRD results identified varying proportions of aragonite and subordinate calcite, quartz, feldspar and clay minerals. Iron (hydr)oxides may be present, but only in trace levels. FTIR spectra contained absorption features consistent with aragonite, calcite, and feldspar and ruled out the presence of all iron (hydr)oxides except for traces of hematite, ferrihydrite, and possibly maghemite. Raman spectra identified carbonate species, but not iron (hydr)oxides, although ferrihydrite or maghemite could not be ruled out. Raman spectra also showed peaks that are as yet unassigned. VNIR data contained Fe3+ features that are likely resulting from ferric iron in multiple environments, but which matched no Fe (hydr)oxide or Fe carbonate, although NIR carbonate bands were present. Mössbauer spectroscopy ruled out all iron (hydr)oxides except ferrihydrite and also ruled iron in carbonate. Mössbauer spectroscopy further showed that the majority of the ferric iron is in the fine fraction of the material. ICP-OES analyses were dominated by Ca and Fe. SEM/EMPA identified carbonate agglomerates with Fe and Al-rich nanoparticles. TEM analysis isolated phases identified by SEM/EMPA and obtained crystallographic and compositional data on nanoparticles, including an inverse trend between Fe and Al. TEM confirmed the presence of both calcite and aragonite, feldspar and quartz, and an abundant and compositionally diverse population of amorphous Fe-rich nanospheres (possibly the Raman unidentified peaks). Iron was not a significant component of either calcite or aragonite. Thus, it was determined the color of Blood Falls comes from amorphous Fe-rich nanospheres, not iron (hydr)oxides or red carbonates, but could also be due to other cations besides Fe. This study illustrates the importance of direct observation of correlated structure and composition of the nanoparticle fraction when surficial low temperature processes and amorphous phases are involved. Using each technique to detect and rule out phases was essential to the overall picture. Multiple XRD characterizations showed how amorphous baseline swell can lead to substantial uncertainty in trace phase composition and even major phase abundance, mirroring challenges in Martian XRD data analysis (Castle and Treiman 2019). The microscopy indicated caution in overinterpreting trace phases as the complicated relationship between composition and spectral response in amorphous and nanophase samples has not been fully parameterized.
Mars sample collection for return is underway (Farley et al., 2020). This limited number of precious samples will be the subject of rigorous study. The analyses here provide a detailed analysis of a known Mars analogue and also provide information about complementary techniques and potential uncertainties for analyzing a small set of samples far from their source. The mixtures of crystalline and amorphous/nanophase phases that may be coating other grains and the possibility that the samples have changed phase during transport and storage mimic potential challenges in dealing with returned Martian samples. Understanding how each technique can be used and its limitations is key to understanding complex environments. Techniques that can be used in tandem reduce the uncertainties in identification associated with each technique alone, and overcome the limitations of individual techniques. While this has been an extensive study, it was not an exhaustive study. Iteration remains a fundamental part of the exploration process that allows us to ask more pointed questions with each cycle to efficiently utilize our resources and samples. All data are available in the Supplement and upon request should others desire to continue this work.
Data Availability Statement
The original contributions presented in the study are included in the article/Supplementary Material, further inquiries can be directed to the corresponding author.
Author Contributions
ES performed spectroscopic analyses of all samples, processed, plotted, and interpreted (with co-authors) the data, and wrote the majority of the paper. JM collected the samples from Blood Falls, Antarctica, and contextualized the findings within the literature for that region. MD assisted in writing and revisions and provided invaluable contributions to the interpretation of the spectral data. MD also assisted with the collection of TEM from both institutions. PL assisted with writing and revisions and to contextualize the geochemical context of the sample and the site. KL performed the TEM analyses at John’s Hopkins and interpreted those data, helping to frame the paper in terms of those mineralogical findings. SM, a graduate student at the University of Tennesse, Knoxville, helped to process and prepare the samples for analysis.
Funding
This work was supported by NASA grant 80NSSC17K0243 and NSF grant ANT-1643687 to JM. PL also acknowledges support from NSF grants OCE-1428915, OCE-1436458, PLR-1644073, and PLR-1736783. XRD acquired courtesy of Kevin Kittilstved via NSF equipment grant #1726578.
Conflict of Interest
The authors declare that the research was conducted in the absence of any commercial or financial relationships that could be construed as a potential conflict of interest.
Publisher’s Note
All claims expressed in this article are solely those of the authors and do not necessarily represent those of their affiliated organizations, or those of the publisher, the editors and the reviewers. Any product that may be evaluated in this article, or claim that may be made by its manufacturer, is not guaranteed or endorsed by the publisher.
Acknowledgments
We would like to thank Mike Jercinovic and Matthew Winnick at UMass for running SEM+EPMA and ICP-OES, respectively.
Supplementary Material
The Supplementary Material for this article can be found online at: https://www.frontiersin.org/articles/10.3389/fspas.2022.843174/full#supplementary-material
Footnotes
1http://rruff.geo.arizona.edu/AMS/amcsd.php
3https://www.uwinnipeg.ca/c-tape/
References
Badgeley, J. A., Pettit, E. C., Carr, C. G., Tulaczyk, S., Mikucki, J. A., and Lyons, W. B. (2017). An Englacial Hydrologic System of Brine within a Cold Glacier: Blood Falls, McMurdo Dry Valleys, Antarctica. J. Glaciol. 63 (239), 387–400. doi:10.1017/jog.2017.16
Bishop, J. L., Gross, C., Danielsen, J., Parente, M., Murchie, S. L., Horgan, B., et al. (2020). Multiple Mineral Horizons in Layered Outcrops at Mawrth Vallis, Mars, Signify Changing Geochemical Environments on Early Mars. Icarus 341, 113634. doi:10.1016/j.icarus.2020.113634
Black, R. F., Jackson, M. L., and Berg, T. E. (1965). Saline Discharge from Taylor Glacier, Victoria Land, Antarctica. J. Geology. 73 (1), 175–181. doi:10.1086/627053
Blackburn, T., Edwards, G. H., Tulaczyk, S., Scudder, M., Piccione, G., Hallet, B., et al. (2020). Ice Retreat in Wilkes Basin of East Antarctica During a Warm Interglacial. Nature 583 (7817), 554–559. doi:10.1038/s41586-020-2484-5
Blake, D., Vaniman, D., Achilles, C., Anderson, R., Bish, D., Bristow, T., et al. (2012). Characterization and Calibration of the Chemin Mineralogical Instrument on Mars Science Laboratory. Space Sci. Rev. 170, 341–399. doi:10.1007/s11214-012-9905-1
Boston, P. J., Ivanov, M. V., and P. McKay, C. (1992). On the Possibility of Chemosynthetic Ecosystems in Subsurface Habitats on Mars. Icarus 95 (2), 300–308. doi:10.1016/0019-1035(92)90045-9
Bullock, M. A., and Moore, J. M. (2007). Atmospheric Conditions on Early Mars and the Missing Layered Carbonates. Geophys. Res. Lett. 34, L19201. doi:10.1029/2007GL030688
Campbell, I. B., and Claridge, G. C. C. (1987). Antarctica: Soils, Weathering Processes and Environment. Development Soil Sci. 16, 368. doi:10.1002/esp.3290140811
Campbell, I. B., Claridge, G. G., Campbell, D. I., and Balks, M. R. (2013). “The Soil Environment of the Mcmurdo Dry Valleys, Antarctica,” in Ecosystem Dynamics in a Polar Desert: The McMurdo Dry Valleys, Antarctica. Editor J. C. Priscu (Washington, DC: American Geophysical Union), 72. doi:10.1029/ar072p0297
Campen, R., Kowalski, J., Lyons, W. B., Tulaczyk, S., Dachwald, B., Pettit, E., et al. (2019). Microbial Diversity of an Antarctic Subglacial Community and High Resolution Replicate Sampling Inform Hydrological Connectivity in a Polar Desert. Environ. Microbiol. 21, 2290–2306. doi:10.1111/1462-2920.14607
Carrier, B. L., Beaty, D. W., Hutzler, A., Smith, A. L., Kminek, G., Meyer, M. A., et al. (2021). Science and Curation Considerations for the Design of a Mars Sample Return (MSR) Sample Receiving Facility. Astrobiology 21. doi:10.1089/ast.2021.0110
Carrier, B. L., Beaty, D. W., Meyer, M. A., Blank, J. G., Chou, L., DasSarma, S., et al. (2020). Mars Extant Life: What's Next? Conference Report. Astrobiology 20 (6), 785–814. doi:10.1089/ast.2020.2237
Castle, N., and Treiman, A. (2019). Systematic Error and the Identification of Minor Phases Using the CheMin X-Ray Diffractometer. Abstract Retrieved from Abstracts of the 50th Lunar and Planetary Science Conference. (Abstract No. 2600).
Christensen, P. R., Bandfield, J. L., Bell III, J. F., Gorelick, N., Hamilton, V. E., Ivanov, A., et al. (2003b). Morphology and Composition of the Surface of Mars: Mars Odyssey THEMIS Results. Science 300, 2056–2061. doi:10.1126/science.1080885
Christensen, P. R., Bandfield, J. L., Hamilton, V. E., Ruff, S. W., Kieffer, H. H., Titus, T. N., et al. (2001). Mars Global Surveyor Thermal Emission Spectrometer Experiment: Investigation Description and Surface Science Results. J. Geophys. Res. 106, 23823–23871. doi:10.1029/2000je001370
Christensen, P. R., Mehall, G. L., Silverman, S. H., Anwar, S., Cannon, G., Gorelick, N., et al. (2003a). Miniature Thermal Emission Spectrometer for the Mars Exploration Rovers. J.-Geophys.-Res. 108, E12–E8064. doi:10.1029/2003JE002117
Claridge, G. G. C. (1965). The Clay Mineralogy and Chemistry of Some Soils from the Ross Dependency, Antarctica. New Zealand J. Geology. Geophys. 8 (2), 186–220. doi:10.1080/00288306.1965.10428107
Cosmo, R. de P., Ressel Pereira, F. de A., Ribeiro, D. da C., Barros, W., and Martins, A. L. (2019). Estimating CO2 Degassing Effect on CcCO3 Precipitation Under Oil Well Conditions. J. Petrol. Sci. Eng. 181, 106207. doi:10.1016/j.petrol.2019.106207
de Bakker, P. M. A., de Grave, E., Vandenberghe, R. E., Bowen, L. H., Pollard, R. J., and Persoons, R. M. (1991). Mössbauer Study of the Thermal Decomposition of Lepidocrocite and Characterization of the Decomposition Products. Phys. Chem. Minerals 18, 131–143. doi:10.1007/bf00216606
Della Porta, G. (2015). Carbonate Build-Ups in Lacustrine, Hydrothermal and Fluvial Settings: Comparing Depositional Geometry, Fabric Types and Geochemical Signature. Geol. Soc. Lond. Spec. Publications 418, 17–68. doi:10.1144/sp418.4
Dickinson, W. W., and Rosen, M. R. (2003). Antarctic Permafrost: An Analogue for Water and Diagenetic Minerals on Mars. Geol. 31 (3), 199–202. doi:10.1130/0091-7613(2003)031<0199:apaafw>2.0.co;2
Doran, P. T., McKay, C. P., Clow, G. D., Dana, G. L., Fountain, A. G., Nylen, T., et al. (2002). Valley Floor Climate Observations from the McMurdo Dry Valleys, Antarctica, 1986-2000. J. Geophys. Res. 107D24, 4772. doi:10.1029/2001JD002045
Dormann, J. L., Viart, N., Rehspringer, J. L., Ezzir, A., and Niznansky, D. (1998). Magnetic Properties of Fe2O3 Particles Prepared by Sol-Gel Method. Hyperfin. Interact. 112, 89–92. doi:10.1023/A:1011088611227
Dyar, M. D., and Sklute, E. C. (2019). “Mössbauer Spectroscopy,” in Remote Compositional Analysis: Techniques for Understanding Spectroscopy, Mineralogy, and Geochemistry of Planetary Surfaces. Editors J. Bishop, J. BellIII, and J. Moersch (Cambridge, UK: Cambridge University Press), 147–167. doi:10.1017/9781316888872.009
Farley, K. A., Williford, K. H., Stack, K. M., Bhartia, R., Chen, A., de la Torre, M., et al. (2020). Mars 2020 Mission Overview. Space Sci. Rev. 216, 142. doi:10.1007/s11214-020-00762-y
Foley, K. K., Lyons, W. B., Barrett, J. E., and Virginia, R. A. (2006). “Pedogenic Carbonate Distribution within Glacial Till in Taylor Valley, Southern Victoria Land, Antarctica,” in Paleoenvironmental Record and Applications of Calcretes and Palustrine Carbonates. Editors A. M. Alonso-Zarza, and L. H. Tanner (Boulder, CO: Geological Society of America), 89–103. doi:10.1130/2006.2416(0610.1130/2006.2416(06)
Fonti, S., Jurewicz, A., Blanco, A., Blecka, M. I., and Orofino, V. (2001). Presence and Detection of Carbonates on the Martian Surface. J. Geophys. Res. 106 (E11), 27815–27822. doi:10.1029/2000JE001363
French, R., and Wang, E. C. (1980). The i.R. And Raman Spectra of CaCO3 (Aragonite). Spectrochim. Act. 36A, 915–919.
Gaffey, S. J. (1987). Spectral Reflectance of Carbonate Minerals in the Visible and Near Infrared (0.35-2.55 um): Anhydrous Carbonate Minerals. J. Geophys. Res. 92 (B2), 1429–1440. doi:10.1029/jb092ib02p01429
Gibson, E. K., Wentworth, S. J., and McKay, D. S. (1983). Chemical Weathering and Diagenesis of a Cold Desert Soil from Wright Valley, Antarctica: An Analog of Martian Weathering Processes. J. Geophys. Res. 88, A912–A928. doi:10.1029/jb088is02p0a912
Gilbert, B., and Banfield, J. F. (2005). 6. Molecular-Scale Processes Involving Nanoparticulate Minerals in Biogeochemical Systems. Rev. Mineral. Geochem. 59, 109–156. doi:10.1515/9781501509551-010
Hall, K., Thorn, C. E., Matsuoka, N., and Prick, A. (2002). Weathering in Cold Regions: Some Thoughts and Perspectives. Prog. Phys. Geogr. Earth Environ. 26 (4), 577–603. doi:10.1191/0309133302pp353ra
Hallet, B. (1976). Deposits Formed by Subglacial Precipitation of CaCO3. Geol. Soc. America Bull. 87, 1003–1015. doi:10.1130/0016-7606(1976)87<1003:dfbspo>2.0.co;2
Hamilton, W., Frost, I. C., and Hayes, P. T. (1962). “Short Papers in Geology, Hydrology, and Topography; Articles 1-59: Geological Survey Research 1962,” in Short Papers in Geology, Hydrology and Topography, Articles 1-59, U.S. Geological Survey Professional Paper 450-B (Washington, DC: US Government Printing Office), 73–75. doi:10.3133/pp450B
Head, J. W., and Marchant, D. R. (2014). The Climate History of Early Mars: Insights from the Antarctic McMurdo Dry Valleys Hydrologic System. Antartic Sci. 26 (6), 774–800. doi:10.1017/s0954102014000686
Hendrix, A. R., Hurford, T. A., Barge, L. M., Bland, M. T., Bowman, J. S., Brinckerhoff, W., et al. (2019). The NASA Roadmap to Ocean Worlds. Astrobiology 19 (1), 1–27. doi:10.1089/ast.2018.1955
Horgan, B. H. N., Johnson, J. R., Fraeman, A. A., Rice, M. S., Seeger, C., Bell, J. F., et al. (2020). Diagenesis of Vera Rubin Ridge, Gale Crater, Mars, from Mastcam Multispectral Images. J. Geophys. Res. – Planet. 125, e2019JE006322. doi:10.1029/2019JE006322
Hubbard, A., Lawson, W., Anderson, B., Hubbard, B., and Blatter, H. (2004). Evidence for Subglacial Ponding Across Taylor Glacier, Dry Valleys, Antarctica. Ann. Glaciol. 39, 79–84. doi:10.3189/172756404781813970
Hunt, G. R., and Salisbury, J. W. (1971). Visible and Near Infrared Spectra of Minerals and Rocks: II. Carbonates, Mod. Geol. 2, 23–30.
Hunt, G. R. (1977). Spectral Signatures of Particulate Minerals in the Visible and Near Infrared. Geophysics 42 (3), 501–513. doi:10.1190/1.1440721
Jones, G. C., and Jackson, B. (1993). Infrared Transmission Spectra of Carbonate Minerals. Dordrecht, Netherlands: Springer-Science+Business Media, B.V.
Keys, J. R. (1979). Saline Discharge at the Terminus of Taylor Glacier. Antarct. J. US. 14 (1), 82–85.
Keys, J. R. (1980). Salts and Their Distribution in the McMurdo Region, Antarctica. Wellington, New Zealand: Victoria University of Wellington. Dissertation/PhD thesis.
Keys, J. R., and Williams, K. (1981). Origin of Crystalline, Cold Desert Salts in the McMurdo Region, Antarctica. Geochimica et Cosmochimica Acta 45 (12), 2299–2309. doi:10.1016/0016-7037(81)90084-3
Kim, J. G., Han, K. H., Lee, C. H., Jeong, J. Y., and Shin, K. H. (2001). Crystallographic and Magnetic Properties of Nanostructures Hematite Synthesized by the Sol-Gel Process. J. Korean Phys. Soc. 38 (6), 798–802.
King, P. L., and McLennan, S. M. (2010). Sulfur on Mars. Elements 6 (2), 107–112. doi:10.2113/gselements.6.2.107
Klingelhöfer, G., Morris, R. V., Bernhardt, B., Schröder, C., Rodionov, D. S., de Souza, P. A., et al. (2004). Jarosite and Hematite at Meridiani Planum from Opportunity's Mössbauer Spectrometer. Science 306, 1740–1745. doi:10.1126/science.1104653
Lafuente, B., Downs, R. T., Yang, H., and Stone, N. (2015). “1. The Power of Databases: The RRUFF Project,” in Highlights in Mineralogical Crystallography. Editors T. Armbruster, and R. M. Danisi (Berlin, Germany: W. De Gruyter), 1–30. doi:10.1515/9783110417104-003
Lane, M. D., and Bishop, J. L. (2019). “Mid-infrared (Thermal) Emission and Reflectance Spectroscopy,” in Remote Compositional Analysis: Techniques for Understanding Spectroscopy, Mineralogy, and Geochemistry of Planetary Surfaces. Editors J. Bishop, J. BellIII, and J. Moersch (Cambridge, UK: Cambridge University Press), 42–67. doi:10.1017/9781316888872.005
Levy, J. (2021). Episodic Basin-Scale Soil Moisture Anomalies Associated with High Relative Humidity Events in the McMurdo Dry Valleys, Antarctica. Antarctic Sci. 33 (5), 533–547. doi:10.1017/S0954102021000341
Ling, Z. C., and Wang, A. (2010). A Systematic Spectroscopic Study of Eight Hydrous Ferric Sulfates Relevant to Mars. Icarus 209, 422–433. doi:10.1016/j.icarus.2010.05.009
Lipar, M., Martín-Pérez, A., Tičar, J., Pavšek, M., Gabrovec, M., Hrvatin, M., et al. (2021). Subglacial Carbonate Deposits as a Potential Proxy for a Glacier's Former Presence. The Cryosphere 15 (1), 17–30. doi:10.5194/tc-15-17-2021
Livi, K. J. T., Senesi, G. S., Scheinost, A. C., and Sparks, D. L. (2009). Microscopic Examination of Nanosized Mixed Ni−Al Hydroxide Surface Precipitates on Pyrophyllite. Environ. Sci. Technol. 43, 1299–1304. doi:10.1021/es8015606
Loeffler, B. M., and Burns, R. G. (1976). Shedding Light on the Color of Gems and Minerals: The Selective Absorption of Light According to Wavelength—The Result of Various Electronic Processes Whose Energies Correspond to Certain Wavelengths of Visible Light—Gives Minerals Their Distinctive Hues. Am. Sci. 64 (6), 636–647.
Lyons, W. B., Leslie, D. L., and Gooseff, M. N. (2021). “Chemical Weathering in the McMurdo Dry Valleys, Antarctica,” in Hydrogeology, Chemical Weathering, and Soil Formation. Editors A. Hunt, M. Egli, and B. Faybishenko (Hoboken, NJ: Wiley), 205–216. doi:10.1002/9781119563952.ch11
Lyons, W. B., Mikucki, J. A., German, L. A., Welch, K. A., Welch, S. A., Gardner, C. B., et al. (2019). The Geochemistry of Englacial Brine from Taylor Glacier, Antarctica. J. Geophys. Res. Biogeosci. 124, 633–648. doi:10.1029/2018JG004411
Lyons, W. B., Welch, K. A., Snyder, G., Olesik, J., Graham, E. Y., Marion, G. M., et al. (2005). Halogen Geochemistry of the McMurdo Dry Valleys Lakes, Antarctica: Clues to the Origin of Solutes and lake Evolution. Geochimica et Cosmochimica Acta 69, 305–323. doi:10.1016/j.gca.2004.06.040
Maurice, S., Wiens, R. C., Bernardi, P., Cais, P., Robinson, S., Nelson, T., et al. (2021). The SuperCam Instrument Suite on the Mars 2020 Rover: Science Objectives and Mast-Unit Description. Space Sci. Rev. 217, 47. doi:10.1007/s11214-021-00807-w
McReynolds, T. E., Skaggs, S. A., and Schroeder, P. A. (2008). “Feldspar and Clay Mineralogy,” in Woodland Pottery Sourcing in the Carolina Sandhills. Editors J. M. Herbert, and T. E. McReynolds (Chapel HillNC: University of North Carolina, Chapel Hill, Research Laboratories of Archaeology, United States. Army. Corps of Engineers), 108–121.
Mikucki, J. A., Auken, E., Tulaczyk, S., Virginia, R. A., Schamper, C., Sørensen, K. I., et al. (2015). Deep Groundwater and Potential Subsurface Habitats Beneath an Antarctic Dry valley. Nat. Commun. 6 (1), 6831–6839. doi:10.1038/ncomms7831
Mikucki, J. A., Pearson, A., Johnston, D. T., Turchyn, A. V., Farquhar, J., Schrag, D. P., et al. (2009). A Contemporary Microbially Maintained Subglacial Ferrous “Ocean”. Science 324, 397–400. doi:10.1126/science.1167350
Mikucki, J. A., and Priscu, J. C. (2007). Bacterial Diversity Associated with Blood Falls, a Subglacial Outflow from the Taylor Glacier, Antarctica. Appl. Environ. Microbiol. 73 (12), 4029–4039. doi:10.1128/AEM.01396-06
Moore, D. M., and Reynolds, R. C.. (1997). X-Ray Diffraction and Identification and Analysis of Clay Minerals. 2nd Edn. New York, NY: Oxford University Press, 1–376.
Morris, R. V., Agresti, D. G., Lauer, H. V., Shelfer, T. D., Murali, A. V., and Murali, A. V. (1989). Evidence for Pigmentary Hematite on Mars Based on Optical, Magnetic, and Mossbauer Studies of Superparamagnetic (Nanocrystalline) Hematite. J. Geophys. Res. 94 (B3), 2760–2778. doi:10.1029/jb094ib03p02760
Morris, R. V., Klingelhöfer, G., Schröder, C., Rodionov, D. S., Yen, A., Ming, D. W., et al. (2006). Mössbauer Mineralogy of Rock, Soil, and Dust at Gusev Crater, Mars: Spirit's Journey Through Weakly Altered Olivine Basalt on the Plains and Pervasively Altered Basalt in the Columbia Hills. J. Geophys. Res. 111, aE02S13–n. doi:10.1029/2005JE002584
Murchie, S., Arvidson, R., Bedini, P., Beisser, K., Birbing, J.-P., Bishop, J. L., et al. (2007). Compact Reconnaissance Imaging Spectrometer for Mars (CRISM) on Mars Reconnaissance Orbiter (MRO). J. Geophys. Res.-Planets 112, E5E05S03. doi:10.1029/2006JE002682
Murray, A. E., Kenig, F., Fritsen, C. H., McKay, C. P., Cawley, K. M., Edwards, R., et al. (2012). Microbial Life at −13 °C in the Brine of an Ice-Sealed Antarctic lake. Proc. Natl. Acad. Sci. U.S.A. 109 (50), 20626–20631. doi:10.1073/pnas.1208607109
Navrotsky, A., Mazeina, L., and Majzlan, J. (2008). Size-Driven Structural and Thermodynamic Complexity in Iron Oxides. Science 319 (5870), 1635–1638. doi:10.1126/science.1148614
Obryk, M. K., Doran, P. T., Fountain, A. G., Myers, M., and McKay, C. P. (2020). Climate from the McMurdo Dry Valleys, Antarctica, 1986-2017: Surface Air Temperature Trends and Redefined Summer Season. J. Geophys. Res. Atmos. 125, e2019JD032180. doi:10.1029/2019JD032180
Parikh, S. J., Goyne, K. W., Margenot, A. J., Mukome, F. N. D., and Calderón, F. J. (2014). “Soil Chemical Insights Provided Through Vibrational Spectroscopy,” in Advances in Agronomy. Editor D. Sparks (Boston, MA: Academic Press), 126, 1–148. doi:10.1016/B978-0-12-800132-5.00001-8
P. Doran, W. Lyons, and D. McKnight (Editors) (2010). Life in Antarctic Deserts and Other Cold Dry Environments: Astrobiological Analogs (Cambridge, UK: Cambridge University Press), 1–307. doi:10.1017/CBO9780511712258.001
Pettit, E. C., Whorton, E. N., Waddington, E. D., and Sletten, R. S. (2014). Influence of Debris-Rich Basal Ice on Flow of a Polar Glacier. J. Glaciol. 60 (223), 989–1006. doi:10.3189/2014jog13j161
Poulet, F., Gomez, C., Bibring, J.-P., Langevin, Y., Gondet, B., Pinet, P., et al. (2007). Martian Surface mineralogy from Observatoire pour la Minéralogie, l'Eau, les Glaces et l'Activité on board the Mars Express Spacecraft (OMEGA/MEx): Global Mineral Maps. J. Geophys. Res. 112. doi:10.1029/2006JE002840
Quinn, J. E., Graff, T., and Ming, D. W. (2020). X-Ray Amorphous Components of Antarctica Dry valley Soils: Weathering Implications for Mars. Abstract Retrieved from Abstracts of the 51st Lunar and Planetary Science Conference. (Abstract No. 2136).
Reddy, S. L., Endo, T., and Reddy, G. S. (2012). “Electronic (Absorption) Spectra of 3d Transition Metal Complexes,” in Advanced Aspects of Spectroscopy. Editor M. A. Farrukh (London, UK: IntechOpen Ltd), 43–63. doi:10.5772/50128
Robinson, J. M., and Mikucki, J. A. (2018). “Occupied and Empty Regions of the Space of Extremophile Parameters,” in Astrobiology: Exploring Life on Earth and Beyond, Habitability of the Universe Before Earth. Editors R. Gordon, and A. A. Sharov (Cambridge, MA: Academic Press), 199–230. doi:10.1016/b978-0-12-811940-2.00009-5
Rutishauser, A., Blankenship, D. D., Sharp, M., Skidmore, M. L., Greenbaum, J. S., Grima, C., et al. (2018). Discovery of a Hypersaline Subglacial Lake Complex Beneath Devon Ice Cap, Canadian Arctic. Sci. Adv. 4, 4. doi:10.1126/sciadv.aar4353
Schwertmann, U., and Carlson, L. (1994). Aluminum Influence on Iron Oxides: XVII. Unit-Cell Parameters and Aluminum Substitution of Natural Goethites. Soil Sci. Soc. America J. 58, 256–261. doi:10.2136/sssaj1994.03615995005800010039x
Schwertmann, U., Stanjek, H., and Becher, H.-H. (2004). Long-Term In Vitro Transformation of 2-Line Ferrihydrite to Goethite/Hematite at 4, 10, 15 and 25°C. Clay Miner. 39, 433–438. doi:10.1180/0009855043940145
Sharma, S. K., and Egan, M. J. (2019). “Raman Spectroscopy,” in Remote Compositional Analysis: Techniques for Understanding Spectroscopy, Mineralogy, and Geochemistry of Planetary Surfaces. Editors J. Bishop, J. BellIII, and J. Moersch (Cambridge, UK: Cambridge University Press), 120–146. doi:10.1017/9781316888872.008
Sklute, E. C., Hopkins, R. J., McKeegan, R., Dyar, M. D., Rogers, A. D., and Clark, R. L. (2020). VNIR and FTIR Spectra of Amorphous Ferric Sulfate Reacted with Martian Analogues: Spectral Differences Between Concretions and Powders. Abstract Retrieved from Abstracts of the 51st Lunar and Planetary Science Conference. (Abstract No. 2051).
Sklute, E. C., Jensen, H. B., Rogers, A. D., and Reeder, R. J. (2015). Morphological, Structural, and Spectral Characteristics of Amorphous Iron Sulfates. J. Geophys. Res. Planets 120 (4), 809–830. doi:10.1002/2014je004784
Sklute, E. C., Kashyap, S., Dyar, M. D., Holden, J. F., Tague, T., Wang, P., et al. (2018b). Spectral and Morphological Characteristics of Synthetic Nanophase Iron (Oxyhydr)oxides. Phys. Chem. Minerals 45, 1–26. doi:10.1007/s00269-017-0897-y
Sklute, E. C., Rogers, A. D., Gregerson, J. C., Jensen, H. B., Reeder, R. J., and Dyar, M. D. (2018a). Amorphous Salts Formed from Rapid Dehydration of Multicomponent Chloride and Ferric Sulfate Brines: Implications for Mars. Icarus 302, 285–295. doi:10.1016/j.icarus.2017.11.018
Squyres, S. W., Arvidson, R. E., Baumgartner, E. T., Bell, J. F., Christensen, P. R., Gorevan, S., et al. (2003). Athena Mars Rover Science Investigation. J.-Geophys.-Res. 108, 8062. doi:10.1029/2003JE002121
Srivastava, K. K. P. (1983). Mossbauer Quadrupole Splitting of Fe2+ in Carbonates. J. Phys. C: Solid State. Phys. 16, L1137–L1139. doi:10.1088/0022-3719/16/31/008
Stephens, G. C., and Soegel, F. R. (1969). Calcium Salts from Taylor Glacier, Southern Victoria Land. Antarct. J. US 4 (4), 133.
Tait, K. T., McCubbin, F. M., Smith, C. L., Beauty, D. W., Carrier, B. L., Agee, C. B., et al. (2021). Preliminary Planning for Mars Sample Return (MSR) Curation Activities in a Sample Receiving Facility (SRF). Astrobiol. 21. doi:10.1089/ast.2021.0105
Taylor, T. G. (1922). The Physiography of the McMurdo Sound and Granite Harbour Region. London: Harrison and Sons, Ltd.
Thomas, E. R., Allen, C. S., Etourneau, J., King, A. C. F., Severi, M., Winton, V. H. L., et al. (2019). Antarctic Sea Ice Proxies from Marine and Ice Core Archives Suitable for Reconstructing Sea Ice Over the Past 2000 Years. Geosciences 9, 506. doi:10.3390/geosciences9120506
Tosca, N. J., Beauty, D. W., Carrier, B. L., Agee, C. B., Cockell, C. S., Glavin, D. P., et al. (2021). Time-Sensitive Aspects of Mars Sample Return (MSR) Science. Astrobiol. 21. doi:10.1089/ast.2021.0115
Ugolini, F. C. (1976). Weathering and Mineral Synthesis in Antarctic Soils. Ant. J. US. 11 (4), 248–249.
Uysal, I. T., Feng, Y., Zhao, J. X., Isik, V., Nuriel, P., and Golding, S. D. (2009). Hydrothermal COd Degassing in Seismically Active Zones During the Late Quaternary. Chem. Geol. 265, 442–454.
Vandenberghe, R., de Grave, E., and de Bakker, P. (1994). On the Methodology of the Analysis of Mössbauer-Spectra. Hyperfine Interact 83, 29–49. doi:10.1007/BF02074257
Vaniman, D. T., Bish, D. L., Ming, D. W., Bristow, T. F., Morris, R. V., Blake, D. F., et al. (2014). Mineralogy of a Mudstone at Yellowknife Bay, Gale Crater, Mars. Science 343, 1243480. doi:10.1126/science.1243480
Wray, J. J., Murchie, S. L., Bishop, J. L., Ehlmann, B. L., Milliken, R. E., Wilhelm, M. B., et al. (2016). Orbital Evidence for More Widespread Carbonate-Bearing Rocks on Mars. J. Geophys. Res. - Planet. 121, 652–677. doi:10.1002/2015JE004972
Keywords: Blood Falls Antarctica, mars analogue, amorphous iron-rich nano spheres, visible to near-infrared, fourier transform infrared, Raman, Mössbauer, transmission electron microscopy
Citation: Sklute EC, Mikucki JA, Dyar MD, Lee PA, Livi KJT and Mitchell S (2022) A Multi-Technique Analysis of Surface Materials From Blood Falls, Antarctica. Front. Astron. Space Sci. 9:843174. doi: 10.3389/fspas.2022.843174
Received: 25 December 2021; Accepted: 08 April 2022;
Published: 30 May 2022.
Edited by:
Chandra Sivaram, Indian Institute of Astrophysics, IndiaReviewed by:
Fulvio Franchi, Botswana International University of Science and Technology,Botswana LuisGago-Duport, University of Vigo, Spain
Copyright © 2022 Sklute, Mikucki, Dyar, Lee, Livi and Mitchell. This is an open-access article distributed under the terms of the Creative Commons Attribution License (CC BY). The use, distribution or reproduction in other forums is permitted, provided the original author(s) and the copyright owner(s) are credited and that the original publication in this journal is cited, in accordance with accepted academic practice. No use, distribution or reproduction is permitted which does not comply with these terms.
*Correspondence: Elizabeth C. Sklute, ZWNza2x1dGVAbXRob2x5b2tlLmVkdQ==