- 1Department of Physical and Chemical Sciences, University of L’Aquila, L’Aquila, Italy
- 2Consorzio Area di Astrogeofisica, L’Aquila, Italy
- 3Physics Department, University of Trento, Trento, Italy
- 4INAF—Istituto di Astrofisica e Planetologia Spaziali, Rome, Italy
- 5Physics Department, The Catholic University of America, Washington, DC, United States
- 6NASA—Goddard Space Flight Center, Greenbelt, MD, United States
Several critical aspects may influence the analysis of the relationship between the solar wind (SW) and magnetospheric fluctuations, for example, the characteristics and frequency of SW fluctuations that are expected to impinge the magnetosphere may not be the same when they are observed by spacecraft located at different places in front of the magnetosphere; similarly, the choice of analytical methods adopted for the spectral analysis might influence the frequency estimate (as well as the wave identification itself) both in the SW and magnetosphere. Focusing our attention on these aspects, we present an analysis of SW compressional fluctuations (f ≈ 1–5 mHz), following two interplanetary shocks observed by two interplanetary spacecraft, regarded as two different situations in terms of spacecraft separation and distance from the magnetosphere. Our results show that some differences in the characteristics of SW fluctuations emerge when the same stream is observed at different places and confirm the critical role of analytical methods in determining fluctuation characteristics. We compared aspects of SW fluctuations with those of magnetospheric fluctuations following the sudden impulses due to the impact of interplanetary shocks. For this scope, we examined observations by two satellites at geostationary orbit and at several ground-based stations. We found that the magnetospheric fluctuations were related to compressional SW fluctuations approximately at the same frequencies, with no evidence for wave activity of internal origin or directly driven by the shock impact.
1 Introduction
An important aspect of the interaction between the solar wind (SW) and Earth’s magnetosphere concerns the relationship between SW structures/fluctuations and the onset/transmission of magnetospheric wave modes. In this context, ultralow frequency (ULF) waves (f ≈ 1–5 mHz) are particularly important because they play a significant role in resonating with particles and transferring energy in the coupled magnetospheric and ionospheric system (Zong et al., 2017). As a matter of fact, several studies reported the manifestation of ULFmagnetospheric fluctuations at discrete frequencies; their occurrence has usually been interpreted in terms of 1) field line resonances (FLRs) related to waveguide/cavity modes; 2) modes produced by the impact of SW pressure pulses at the magnetopause; 3) transmission of waves, approximately at the same frequencies, in one or the other SW parameter; and 4) surface modes at the magnetopause/plasmapause eigenfrequencies (Ruohoniemi et al., 1991; Samson et al., 1991; Samson et al., 1992; Walker et al., 1992; Ziesolleck and McDiarmid, 1995; Francia and Villante, 1997; Villante et al., 2001; Francia et al., 2002; Kepko et al., 2002; Kepko, 2003; Villante et al., 2007; Plaschke et al., 2009; Viall et al., 2009; Plaschke and Glassmeier, 2011; Archer et al., 2013; Archer et al., 2015; Villante et al., 2016; Archer et al., 2019; He et al., 2020; Archer et al., 2021). In addition, the possible existence (and stability) of favored sets of discrete frequencies for magnetospheric fluctuations [namely, f ≈ 1.3, ≈1.9, ≈2.6–2.7, and ≈3.2–3.4 mHz, known as “CMS frequencies” from the cavity modes interpretation of Samson et al. (1991)] has often been discussed with some controversial results.
On the other hand, several critical aspects may influence the results of a similar analysis. For example, the characteristics of SW structures that are expected to impinge on the magnetosphere might not be the same when they are observed at different places in front of the magnetosphere, and/or spacecraft observations might correspond to an SW parcel being off the flow streamline that hits the Earth (Borovsky, 2018; Walsh et al., 2019; Burkholder et al., 2020; Piersanti et al., 2022). These aspects are particularly important in the case of fluctuations. In practice, indeed, in the scientific literature, it is implicit to assume that the characteristics of SW fluctuations impinging on the boundary of the magnetosphere are those evidenced at the observation point in the interplanetary medium. Moreover, depending on their characteristics, the identification of SW fluctuations might be critically dependent on the parameter monitored to alert their occurrence.
In addition, the choice of analytical methods adopted for spectral analysis (and technical aspects, such as time resolution and record length) might influence the frequency estimate as well as the wave identification itself, both in the SW and magnetosphere: this feature takes on particular relevance when the events are identified by automatic criteria. Concerning these aspects, Di Matteo and Villante (2017) analyzed the results of two methods extensively adopted in the scientific literature, the Welch method (WM) and the multitaper method (MTM) and F-test, for the identification and analysis of SW fluctuations in the range of frequency f ≈ 1–5 mHz. Considering synthetic signals, they preliminarily showed that the identification of wave occurrence and the frequency estimate might be strongly influenced by signal characteristics and analytical methods, especially in the presence of multicomponent signals. Then, examining 201 high-velocity streams following interplanetary shocks (ISs) observed by ACE approximately at L1, they conducted a statistical analysis of fluctuations of the SW dynamic pressure (Psw; 64 s sampling) and highlighted that the agreement between the two spectral methods in the identification of fluctuation events was achieved only in ≈50% of cases (“common events”). The frequency distribution of these “common” events revealed evidence of higher percentages of fluctuations in frequency ranges such as f ≈ 1.7–1.9, ≈2.7–3.4, ≈3.9–4.4 mHz, and, more explicitly, at f ≈ 4.2 mHz.
A similar investigation was conducted by Di Matteo and Villante (2018) on magnetic field measurements at geostationary orbit. In this case, a simple analysis of 1-min values of the IGRF representation of the magnetospheric field revealed dramatic contamination from the (usually adopted) rotation of measurements in the mean field-aligned (MFA) coordinates. As a matter of fact, such contamination occurs when the field direction is determined, point by point, by the running averages of magnetic field components; in this system, in the absence of real signals, spurious identifications of events appear, with both WM and MTM, at frequencies strongly related to the length of the running average window. This contamination, however, does not occur in a fixed coordinate system, i.e., when the average field vector is evaluated over the entire analyzed interval. Considering these aspects, Di Matteo and Villante (2018) conducted a statistical analysis of the experimental observations performed after the occurrence of 64 sudden impulses (SIs) and confirmed that as in the SW the WM/MTM agreement was achieved for ≈50% of events, with some evidence for higher percentages of common events at f ≈ 1.5–1.7, ≈2.2–2.4, ≈3.9–4.2, and, more explicitly, at f ≈ 4.2–4.7 mHz.
In the present article, focusing attention on critical aspects that emerged in previous investigations, we present an analysis of the SW compressional fluctuations (f ≈ 1–5 mHz) following two ISs, as observed by two spacecraft at different places. We considered two different situations (in terms of spacecraft separation and distance from the magnetosphere) to examine if the characteristics of the SW fluctuations destined to impact the magnetosphere are similar/dissimilar when observed at different places. We then compared the SW observations with the magnetospheric fluctuations, following the corresponding SI, observed at the geostationary orbit by two spacecraft and at several ground-based stations.
2 Data Analysis
The PSW fluctuations occurring in the high-velocity streams following two ISs were monitored by ACE and Wind (ACE measurements are sampled at 64 s; Wind measurements, less regularly sampled at ≈90 s, have been re-sampled at 100 s). In both events, the positive north/south component of the interplanetary magnetic field (IMF) in the periods of interest guarantees the absence of reconnection aspects triggering an enhanced magnetospheric activity. This differentiates the magnetospheric wave activity discussed hereafter from the one occurring during storm-time conditions driven by either coronal mass ejection or corotating interaction regions (Borovsky and Denton, 2006). The magnetic field fluctuations following the corresponding SI were observed at geostationary orbit by GOES 8 (LT = UT–5) and GOES 9/GOES 10 (LT = UT–9) and at several ground-based stations approximately located between dawn and dusk, from low to auroral latitudes; GOES spacecraft and ground-based measurements are provided at 1 min.
The aspects of data processing, spectral analysis, and event identification have been extensively discussed by Di Matteo and Villante (2017). In brief, in the present analysis, we considered ≈68 min intervals and evaluated the power spectra (WM and MTM methods) focusing on the range f ≈ 1–5 mHz, in which most previous analyses have been conducted, with a frequency resolution of δf ≈ 0.25 mHz. Actually, due to the different record length (4,096 s at ACE, 4,000 s at Wind, and 4,080 s at GOES and ground stations), a shift smaller than 0.1 mHz may occur between the Fourier frequencies at ACE/GOES-ground (fi ≈ 1.2, ≈1.5, ≈1.7, ≈2.0, ≈2.2, ≈2.4/2.5, ≈2.7, ≈2.9, ≈3.2, ≈3.4, ≈3.7, ≈3.9, ≈4.2, ≈4.4, ≈4.6/4.7, and ≈4.9 mHz) and those at Wind (fi ≈ 1.2, ≈1.5, ≈1.8, ≈2.0, ≈2.3, ≈2.5, ≈2.8, ≈3.0, ≈3.3, ≈3.5, ≈3.8, ≈4.0, ≈4.2, ≈4.5, ≈4.8, and ≈5.0 mHz).
In order to evaluate aspects related to the automatic selection of wave events, we adopted the same criteria as in previous investigations, namely, in the WM analysis, the peaks are selected (hereafter “events”) when a power maximum at fM exceeds, by a threshold T and the power estimates at fM−2δf and fM + 2δf: consequently, the frequency separation between selected WM events is at least Δf = 3δf (in practice, at Wind, in which the lower time resolution makes the identification of the highest frequency fluctuations less confident, and the WM events cannot be selected above f ≈ 4.5 mHz); in the MTM analysis, the events are identified testing for power maxima relative to the background level at a confidence C of the Fisher statistic up to the extreme frequencies; obviously, the MTM events might also be selected in adjacent bands.
In the present investigation, for the selection of events, we adopted the thresholds T = 0.25 and C = 92.5; tested in previous analyses, they identified approximately the same number of WM and MTM events both in the SW and magnetosphere [different choices of the thresholds do not influence the conclusions of the present analysis; (Di Matteo and Villante, 2017; Di Matteo and Villante, 2018)]. However, in the following, we consider all enhancements appearing in the power spectra and discuss implications of the automatic event identification.
3 The Event of 13 June 1998
3.1 Observations in Interplanetary Space
On 13 June 1998, an IS was observed at ≈ 18:58 UT by ACE (XSE ≈ 225.7 Re; YSE ≈ 17.0 Re; Figure 1A) and at ≈ 19:18 UT by Wind (XSE ≈ 145.5 Re; YSE ≈ 58.0 Re; DT ≈ 20 min, DXSE ≈ 80.2 Re); the angular separation between spacecraft was α ≈ 17.4° (as seen from Earth), with the more distant probe better aligned with the Earth–Sun line. According to the Interplanetary Shock Database, the shock normal n was inclined at θn ≈ −8° with respect to the ecliptic plane and oriented, in this plane, at ϕn ≈ 142° with respect to the XSE axis (θnA ≈ 9.2°; ϕnA ≈ 144.5° at ACE; θnW ≈ 7.5°, ϕnW ≈ 138.4° at Wind; inclined shock). In this direction, the inferred propagation speed was VS ≈ 424 ± 47 km/s. Assuming a planar geometry, the distance of the nominal shock front from the bow shock nose, along the XSE axis, was
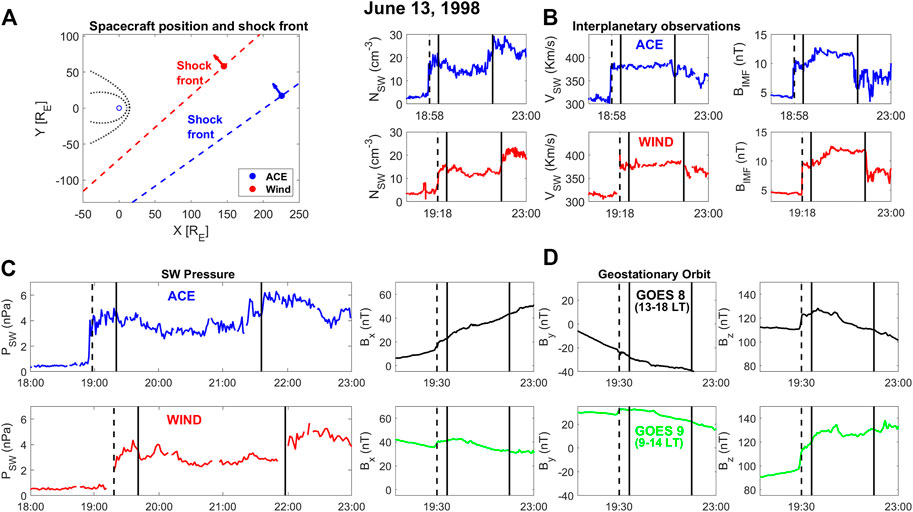
FIGURE 1. (A) Spacecraft position and shock orientation for the event of 13 June 1998. (B) SW and IMF parameters across the shock front. (C) Comparison of SW pressure (100 s sampling) at ACE and Wind. (D) Sudden impulse observed at geostationary orbit (GSM coordinates). Dashed vertical lines indicate the IS/SI, while solid lines delimit the interval in analysis.
For the scope of the present investigation, we considered ≈136 min of data (19:20–21:36 UT for ACE and 19:41–21:57 UT for Wind), well removed from the shock front to avoid aspects related to the shock itself. In this period, VSW at ACE and Wind was the same (
As single wave trains may not persist for a long time, we conducted the analysis separately for two adjacent intervals (≈68 min each; first and second hour in the following). The detrended PSW measurements (Figure 2, left panels) confirm, in both intervals, a more relevant wave activity at ACE and, in particular, at higher frequencies. The results of the WM and MTM analysis are shown in the central and right panels, respectively, where the filled circles identify the “events” automatically selected by the criteria elucidated in Section 2, and the open circles correspond to “unselected” peaks/enhancements.
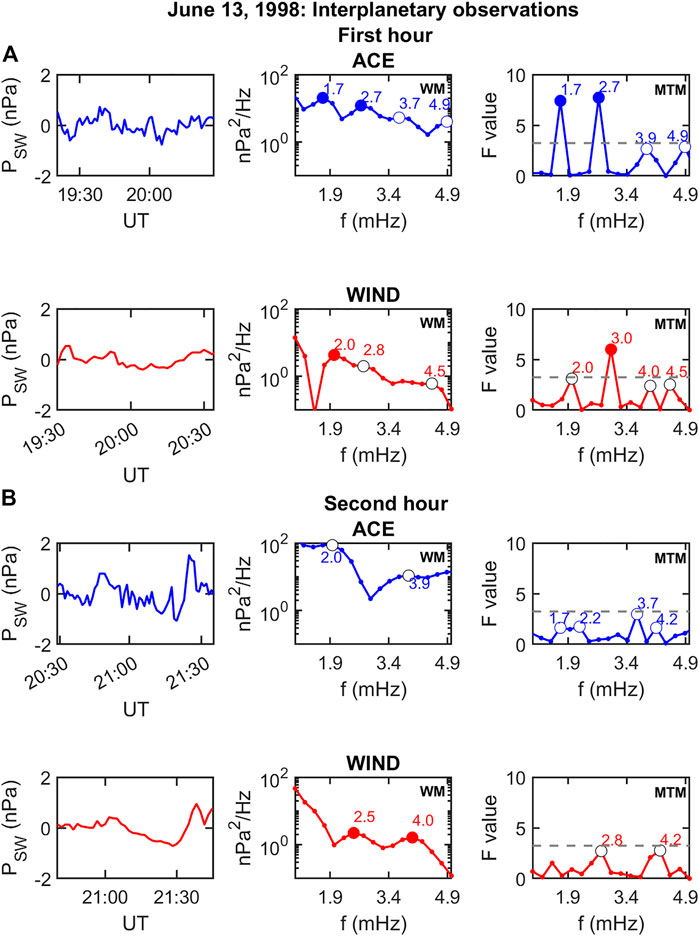
FIGURE 2. (A) Spectral analysis results for the first hour of SW pressure observations. Left panels: detrended PSW observations at ACE and Wind; central panels: results of the WM analysis; and right panels: results of the MTM analysis. (B) Same for the second hour. Filled and empty circles represent events and peaks/enhancements, respectively. The horizontal lines for MTM indicate the confidence threshold.
3.1.1 First Hour
Remarkably, in the first hour (Figure 2A), a perfect WM/MTM agreement results for ACE observations, suggesting well defined and persistent characteristics of the waveforms in the leading edge of the stream following the IS. Indeed, with both methods, the events are selected at f ≈ 1.7 and ≈2.7 mHz, and unselected enhancements appear at f ≈ 3.7 (WM, poorly pronounced)–3.9 (MTM) and ≈4.9 mHz (both methods). A substantial, less explicit correspondence between methods is achieved for Wind: here, the WM event at f ≈ 2.0 mHz finds correspondence in the MTM peak at the same frequency (unselected, just below the threshold) while a small and broad WM enhancement at f ≈ 2.8 mHz may be associated with the MTM event at f ≈ 3.0 mHz; interestingly, the MTM analysis confirms, at Wind, the occurrence of high-frequency enhancements (f ≈ 4.0 and ≈4.5 mHz). It is worth noting that, in the case of Wind, WM and MTM would not select the same events (f ≈ 2.0 mHz and f ≈ 3.0 mHz, respectively), confirming the crucial role of the automatic procedures. The comparison between spacecraft showed a general correspondence of the fluctuation activity at ACE and Wind, in particular at f ≈ 1.7–2.0 and ≈2.7–3.0 mHz, within the present spatio-temporal separation between spacecraft (note that at f ≈ 1.7 mHz, the wave period, T ≈ 9.8 min, is ≈0.5 DT, and the wavelength, λ ≈ 35RE, is
3.1.2 Second Hour
In the second hour (Figure 2B), at ACE, in the absence of selected events, the analysis reveals a high level of the low-frequency activity up to f ≈ 2.2 mHz. After a sharp decrease, the WM power progressively increases between f ≈ 3.4–3.9 mHz; MTM shows a broad power increase at f ≈ 1.7–2.2 mHz and enhancements at f ≈ 3.7 and ≈4.2 mHz. At Wind, two WM events are selected around f ≈ 2.5 and ≈4.0 mHz, with counterparts in the unselected MTM enhancements at f ≈ 2.8 and ≈4.0–4.2 mHz. In this case, the correspondence between spacecraft is less evident; nevertheless, we can conclude for a PSW activity impacting the magnetosphere approximately at f ≈ 1.7–2.5 and ≈3.7–4.2 mHz.
Globally, at ACE, two events exceeding thresholds (both in the first hour; f ≈ 1.7 and f ≈ 2.7 mHz) were commonly identified by WM and MTM. By contrast, at Wind, no correspondence emerged between the WM events (f ≈ 2.0 mHz in the first hour; f ≈ 2.5 and f ≈ 4.0 mHz in the second hour) and the MTM event (f ≈ 3.0 mHz; first hour). As a matter of fact, by selecting only sharp events identified by both methods, different conclusions can be drawn for the same stream when observed at different places.
In this context, we compared the results obtained for PSW (Figure 2) with those related to NSW (shown in Supplementary Figure S1). As expected, the power spectra are very similar and show the same peaks/enhancements at the same frequencies. Nevertheless, the automatic selection of events provides different results. At ACE, NSW events were selected at f ≈ 4.9 mHz (common, first hour) and f ≈ 3.7 (MTM)–3.9 mHz (WM, second hour). while in the PSW spectra they appear as emerging peaks just below the threshold. Similar features occur at Wind for the MTM event selected on NSW at f ≈ 2.0 mHz (first hour) and for the WM event at f ≈ 2.5 mHz (second hour). Consequently, different sets of frequencies would be proposed by the automatic procedures even for closely related parameters.
3.2 Observations at Geostationary Orbit
According to the n orientation and to the inferred Vs, the IS was expected to impact the magnetopause (likely, on the morning flank; ≈09 LT; Figure 1A) at approximately 19:30 UT. Consistently, the SI was simultaneously detected by GOES 9 at ≈ 10:30 LT (≈10:43 MLT, MLT being the magnetic local time) and by GOES 8 at ≈ 14:30 LT (≈14:45 MLT). Figure 1D shows the spacecraft observations in the GSM coordinates: as can be seen, the magnetic field jump mostly occurs along Bz, with a field change much larger at GOES 9, closer to the predicted impact point (and to the magnetopause; DBz,9 ≈ 17.1 nT; DBz,8 ≈ 12.0 nT; DB9 ≈ 17.6 nT; and DB8 ≈ 12.8 nT, after removing the orbital trend).
The spectral analysis has been conducted in the MFA coordinates in which Bμ is along the average field, as defined by the 136 min vector average; Bϕ, perpendicular to Bμ and to the spacecraft position vector, is directed eastward; and Bν completes the orthogonal system. In the period of interest, GOES 9 (green trace) and GOES 8 (black trace) spanned the subsolar (≈11:06–13:22 MLT) and the afternoon sector (≈15:08–17:24 MLT), respectively. Figure 3A (first hour), and Figure 3B (second hour) shows the results of the spectral analysis.
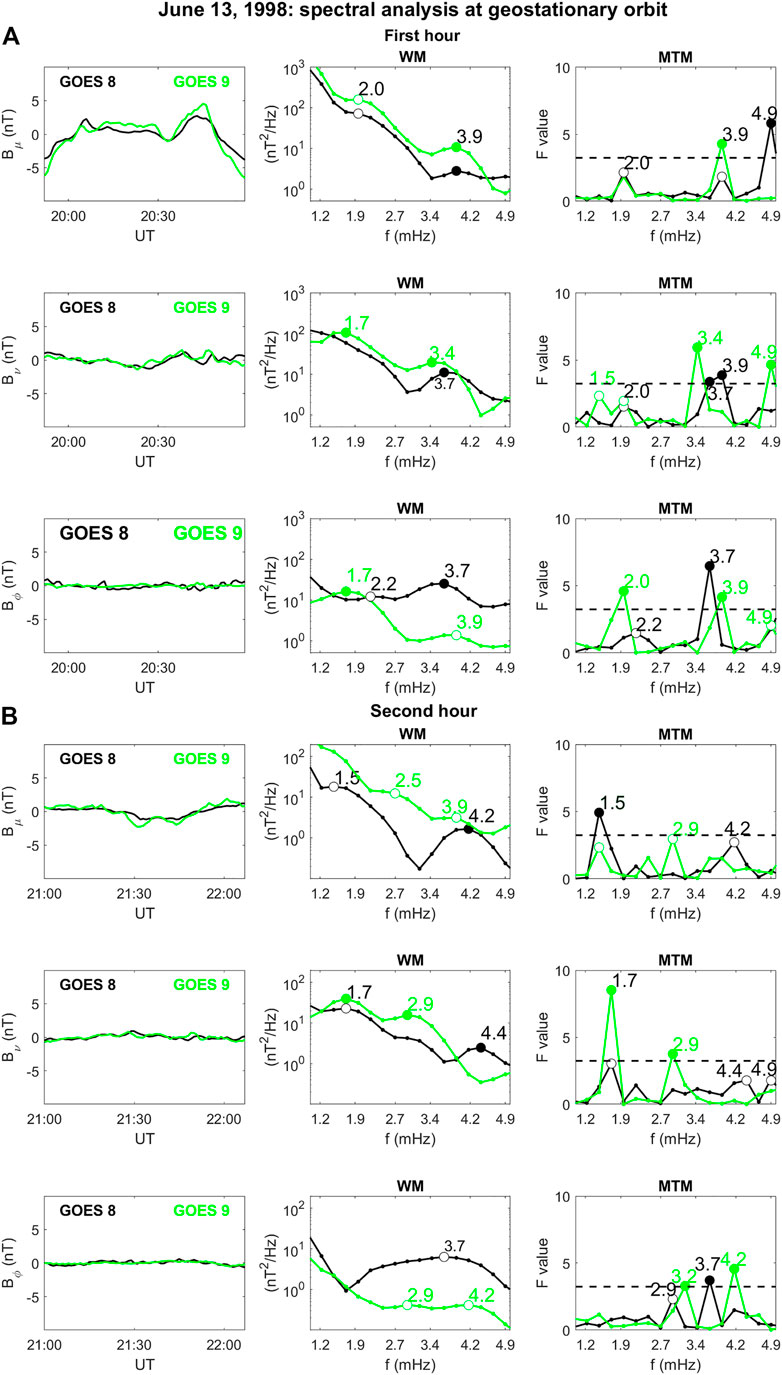
FIGURE 3. (A) Spectral analysis results for the first hour of magnetospheric field component observations at GOES 8 and GOES 9. Left panels: detrended observations; central panels: results of the WM analysis; and right panels: results of the MTM analysis. (B) Same for the second hour.
3.2.1 First Hour
As can be seen, the wave activity mostly occurs along Bμ (the small amplitude signals make the analysis on the other components uncertain). Remarkably, as in the SW, a close WM/MTM agreement is achieved at both spacecraft in the first hour, with several common events and enhancements. In particular, we obtained the following results:
• Bμ: The shapes of the WM spectra, very similar at GOES 9 and GOES 8, reveal a greater energy content closer to noon (GOES 9). Here, a common WM/MTM event is identified at f ≈ 3.9 mHz, and a common enhancement appears at f ≈ 2.0 mHz, clearer in the MTM analysis. Similar conclusions are obtained for GOES 8, with events/peaks at the same frequencies as for GOES 9. In addition, the MTM analysis also shows an event at extreme frequencies (f ≈ 4.9 mHz).
• Bν: The WM spectra of the poloidal component at GOES 9 and GOES 8 are also similar. At GOES 9, a common WM/MTM event emerges at f ≈ 3.4 mHz. Moreover, the event selected at f ≈ 1.7 mHz in the WM spectrum corresponds to the double-peaked structure appearing at f ≈ 1.5 and ≈2.0 mHz in the MTM analysis. This might be a case of fluctuations at nearby frequencies unresolved by WM (Di Matteo and Villante, 2017). Moreover, an MTM event is identified at f ≈ 4.9 mHz. At GOES 8, two contiguous MTM events emerge at f ≈ 3.7 and ≈3.9 mHz. In the WM spectrum, this event occurs at f ≈ 3.7 mHz. On the other hand, as previously remarked, events in adjacent bands cannot be selected by WM. In agreement with GOES 9, some evidence for wave activity at GOES 8 is also detected at f ≈ 2.0 mHz in the MTM analysis.
• Bϕ: In conflict with the other components, the WM spectra of the toroidal component at GOES 9 and GOES 8 (bottom panels) are dissimilar. In particular, in the afternoon sector (GOES 8), the power spectrum, above f ≈ 2.0 mHz, reveals an energy content much greater than in the subsolar region (GOES 9). Interestingly, the spectral peaks occur at the same frequencies as in the other components. At GOES 9, the events are identified at f ≈ 1.7 (WM)–2.0 mHz (MTM) and ≈3.9 mHz (MTM). At GOES 8, they manifest at f ≈ 2.2 mHz (MTM) and, more explicitly, at f ≈ 3.7 mHz (selected by both methods).
We concluded for a general correspondence between the events/enhancements in the spectra of the magnetospheric field components and those of the external PSW spectra.
3.2.2 Second Hour
In the second hour, the WM spectra tend to have lower energy in all components.
• Bμ: As reasonable (Figure 3B), the difference between the energy content of the WM spectra increases with GOES 9 in the subsolar region and GOES 8 migrating in the afternoon sector. At GOES 9, the WM/MTM agreement is poor, with WM enhancements at f ≈ 2.5 and ≈3.9 mHz and MTM peaks at f ≈ 1.5 and ≈2.9 mHz. A closer agreement occurs at GOES 8, with common enhancements/events at f ≈ 1.5 mHz and ≈4.2 mHz.
• Bν: At GOES 9, common events are identified at f ≈ 1.7 mHz and ≈2.9 mHz, revealing well-defined characteristics of these fluctuations in the subsolar region. At GOES 8, the wave activity is confirmed at f ≈ 1.7 mHz (MTM) and, less clearly, around ≈2.9 mHz (WM), while an event is selected by WM at f ≈ 4.4 mHz.
• Bϕ: The comparison of the WM spectra confirms a much higher power level above f ≈ 2.0 mHz, in the afternoon sector. Here (GOES 8), according to the MTM analysis, peaks appear at f ≈ 2.9 mHz (unselected) and ≈3.7 mHz (selected). At GOES 9, the events occur at slightly higher frequencies, namely, f ≈ 3.2 and ≈4.2 mHz.
In the ≈ 2-h interval, considering both spacecraft and all components, 11 events were selected by WM and 15 by MTM. Considering contiguous frequency values, seven common events were identified by both methods (five in the first hour).
In conclusion, GOES 9 and GOES 8 observations show a substantial agreement (more explicit in the first hour) in the identification of oscillation modes approximately at the same frequencies, with a close correspondence between spacecraft in the power spectra of the compressional and poloidal component. Along these components the energy content is greater in the subsolar region. By contrast, in the azimuthal component, it is much higher in the afternoon sector, especially above f ≈ 2.0 mHz. Compared to ACE/Wind observations, these results reveal a general correspondence between the SW and the magnetospheric activity, in particular at f ≈ 1.7–2.0 mHz and ≈3.7–4.0 mHz, in the first hour.
3.3 An Analysis of the Filtered Signals
Figure 4A compares the filtered PSW signals at ACE and Wind for a ≈68 min interval starting 22 min after the shock ramp. As can be seen, in agreement with previous results, in the band f ≈ 1.5–2.5 mHz (left panel), a good correspondence between the waveforms observed by spacecraft is initially achieved for about ≈25 min. ACE then shows a sharp signal enhancement followed by a few cycles of wave activity, not observed by Wind. A more persistent correspondence between spacecraft observations is achieved in the band f ≈ 3.5–4.2 mHz (right panel), although with a possible time shift of ≈1 min between the observed waveforms. Figure 4B confirms a substantial agreement between GOES 8 and GOES 9 observations in both frequency bands along Bμ and Bν. By contrast, particularly at higher frequencies, the filtered data confirm a greater amplitude of the Bϕ fluctuations at GOES 8. Interestingly, after ≈20:30 UT, the higher frequency waveform, at GOES 8, has comparable amplitude along Bϕ and Bν, while, at GOES 9, it has greater amplitude along Bν.
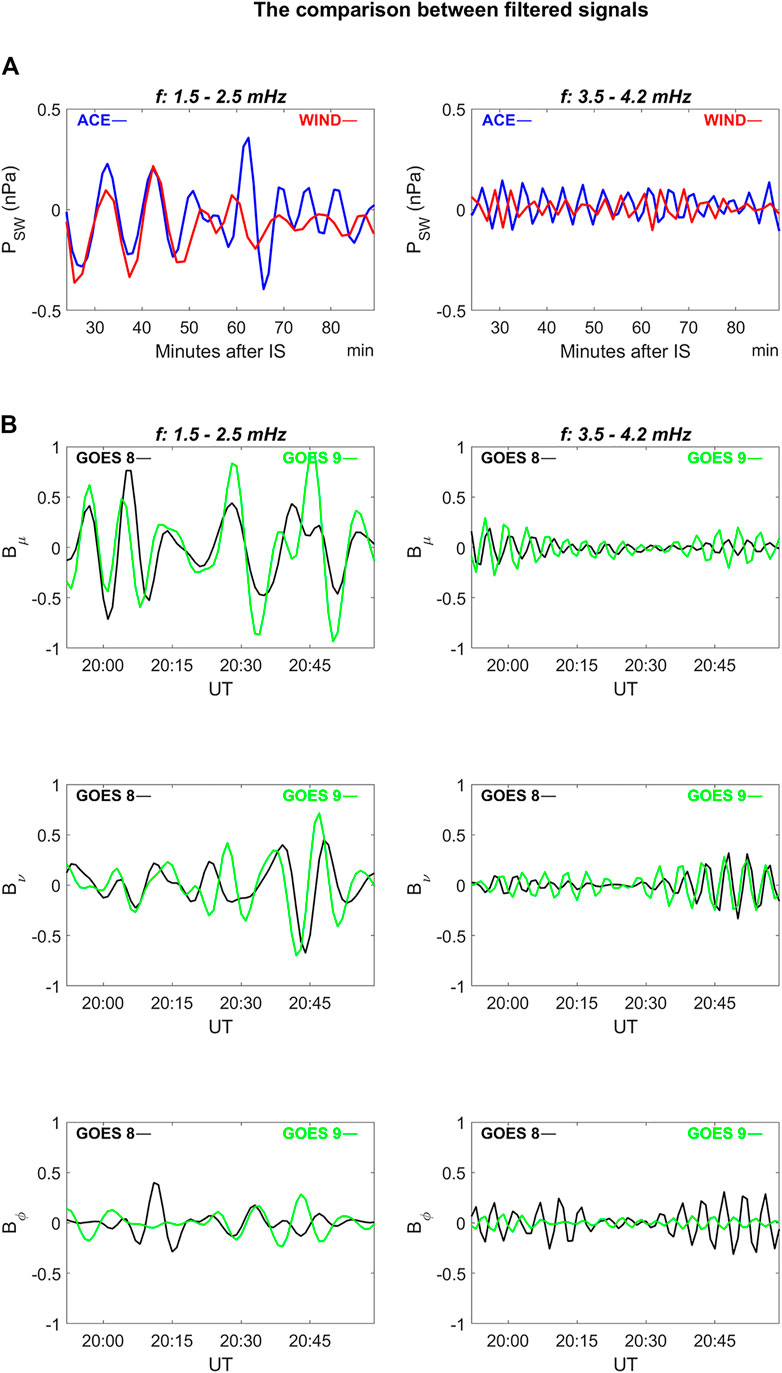
FIGURE 4. Filtered data. (A) SW pressure at ACE and Wind in the bands f ≈ 1.5–2.5 mHz (left panel) and f ≈ 3.5–4.2 mHz (right panels); (B) filtered data of the magnetospheric field components at GOES 8 and GOES 9 in the bands f ≈ 1.5–2.5 mHz (left panels) and f ≈ 3.5–4.2 mHz (right panels).
3.4 Observations at Ground-Based Stations
As at geostationary orbit, the SI occurred in the geomagnetic field elements at ≈ 19:30 UT. We examined the event at six ground-based stations (H and D component; Figure 5) located between dawn and dusk, from low to auroral latitudes (KAK, λ ≈ 27.1°, MLTSI ≈ 04:52; HON, λ ≈ 21.6°, MLTSI ≈ 08:56; YKC, λ ≈ 69.02°, MLTSI ≈ 10:52; BLC, λ ≈ 73.4°, MLTSI ≈ 12.23; GUI, λ ≈ 33.9°, MLTSI ≈ 19:00; SPT, λ ≈ 42.9°, MLTSI ≈ 20:02; λ being the magnetic latitude). The auroral stations are those usually used for more direct comparison with GOES 9 (YKC) and GOES 8 (BLC), located not far from the foot of the corresponding field lines. At these stations, the event is characterized on both components by the typical negative/positive variation [PI and MI, more pronounced on D and at higher latitudes, BLC; (Araki et al., 2013)] due to the superposition of the ionospheric vortices and magnetopause current systems contributions. At lower latitudes, the SI signature, due to the increase of the magnetopause current alone, appears on the H component (smooth in the pre-dawn hours, KAK; DHKAK ≈ 12.8 nT; DHHON ≈ 16.2 nT; DHGUI ≈ 15.4 nT; DHSTP ≈ 20.0 nT); it was accompanied by a very small change of the D component, positive in the morning and negative in the afternoon.
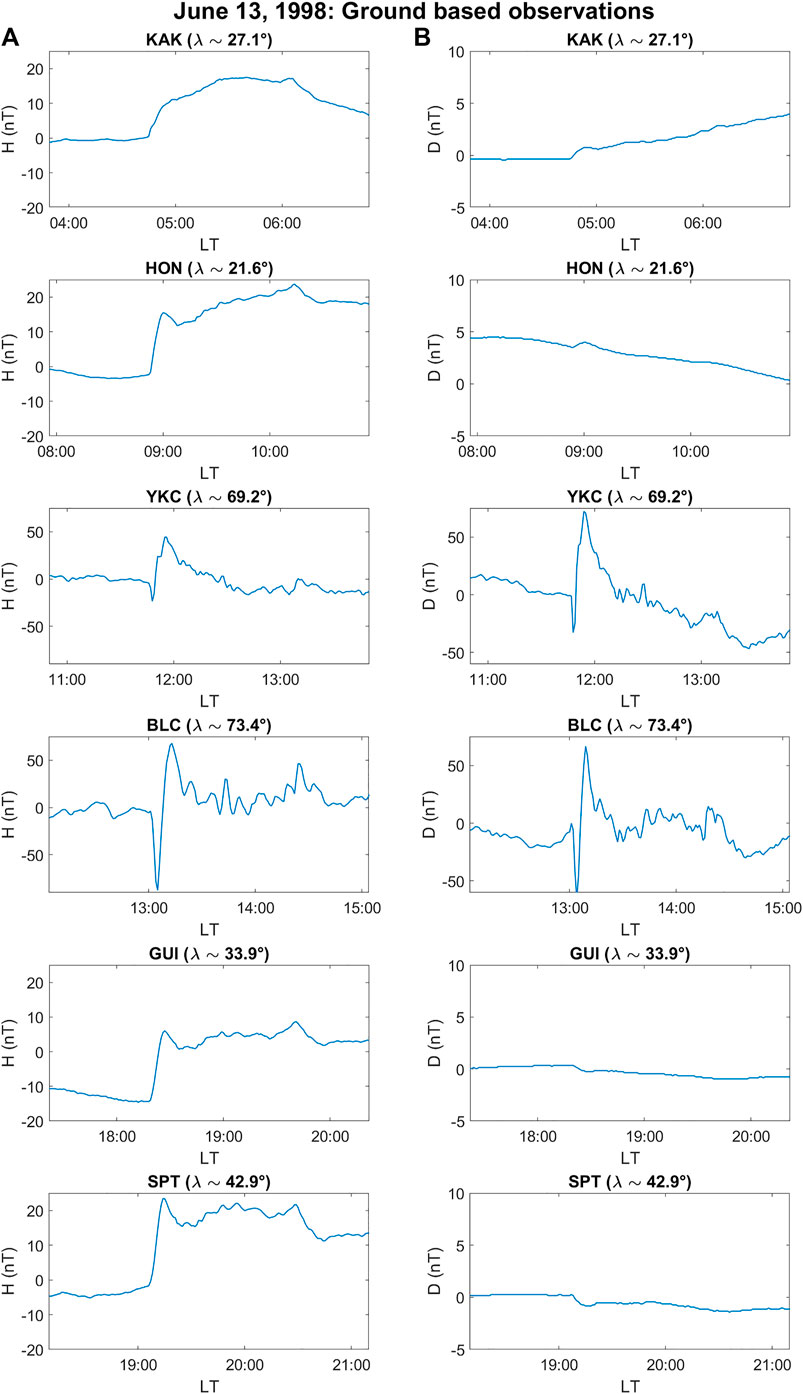
FIGURE 5. Sudden impulse observed at several ground-based stations after subtracting the average value. (A) H component. (B) D component.
Figure 6 compares the geomagnetic signals and results of the spectral analysis for the examined ≈ 2-h intervals at YKC (≈11:14–13:30 MLT) and BLC (≈12:45–15:01 MLT) and shows that, as for the SI change, the fluctuations are more intense at BLC, especially along H. In the first hour (Figure 6A), a persistent, large-amplitude waveform on the H component occurs at BLC. The spectral analysis reveals, on both components, a sharp event at f ≈ 2.0 (MTM)–2.2 mHz (WM). At YKC, the observations suggest wave activity at f ≈ 1.5 (H)–2.0 mHz (D) together with an additional enhancement at 3.7–3.9 mHz on both components. On the D component, an event emerges also at f ≈ 4.9 mHz in the MTM analysis. Remarkably, these spectral features appear approximately at the same frequencies as at GOES spacecraft. In the second hour (Figure 6B), at YKC, the wave activity occurs, on both components, at f ≈ 1.7, ≈3.2–3.4 mHz, and between ≈4.4–4.9 mHz. At BLC, some evidence for wave activity emerges, on D, at f ≈ 2.2 mHz and, on both components, at f ≈ 4.2 mHz.
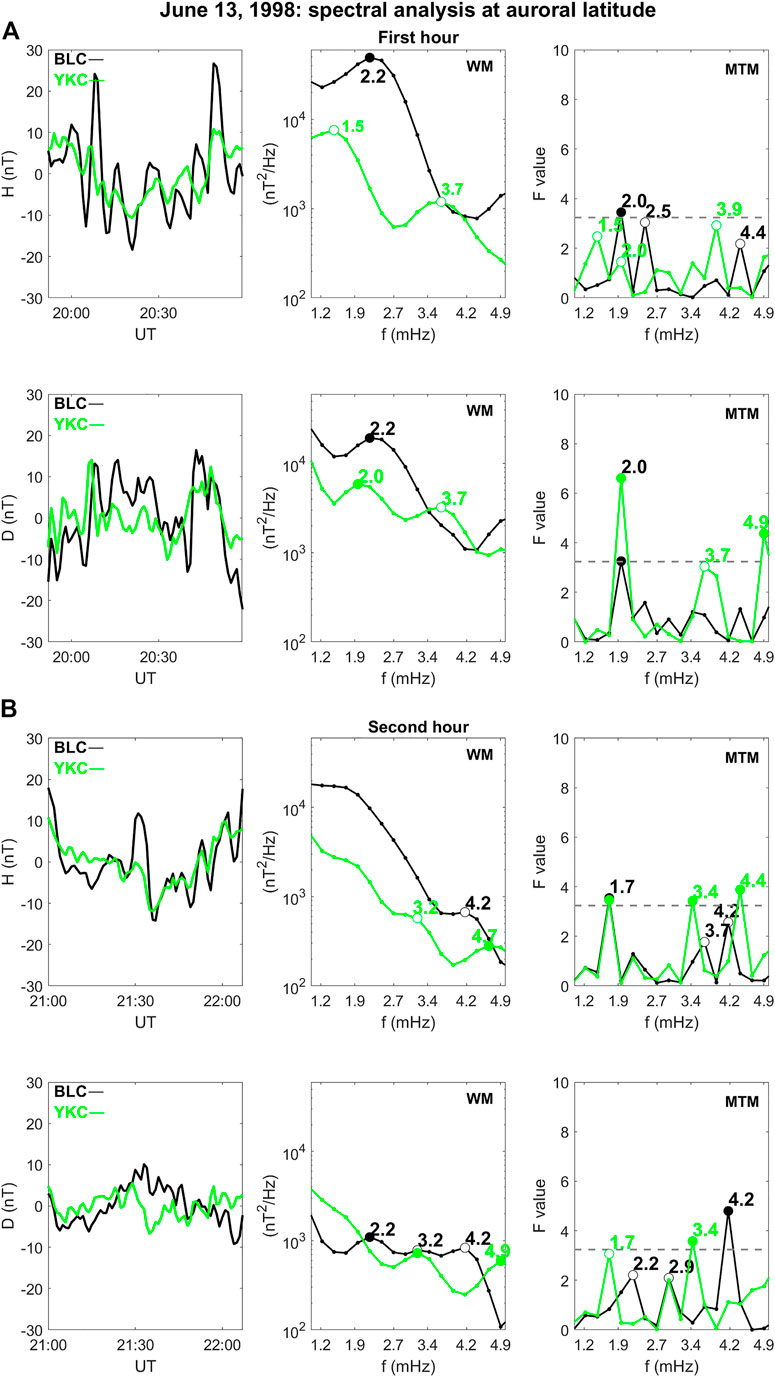
FIGURE 6. (A) Spectral analysis results for the first hour of geomagnetic field component observations at YKC and BCL. Left panels: detrended observations; central panels: results of the WM analysis; and right panels: results of the MTM analysis. (B) Same for the second hour.
In the entire ≈ 2-h interval, considering both stations and components, seven events were identified by WM and ten by MTM; considering the contiguous frequency values, five common events were identified (three in the first hour).
At lower latitudes, the wave activity is practically absent along D (not shown); along H (Figure 7), in the first hour, an event is selected by the MTM analysis at f ≈ 3.7 mHz at HON, GUI, and SPT (with an enhancement at f ≈ 3.7–4.2 mHz at KAK). In the second hour, the WM analysis reveals events at f ≈ 1.5 mHz at KAK and at f ≈ 3.2 mHz at HON. In the MTM analysis, events are selected at f ≈ 4.2 mHz (HON) and ≈4.9 mHz (GUI, SPT). Other enhancements appear at f ≈ 1.5–1.7 and ≈2.9 mHz at all stations. Globally, three WM and six MTM events were identified at low latitudes, with no common identification.
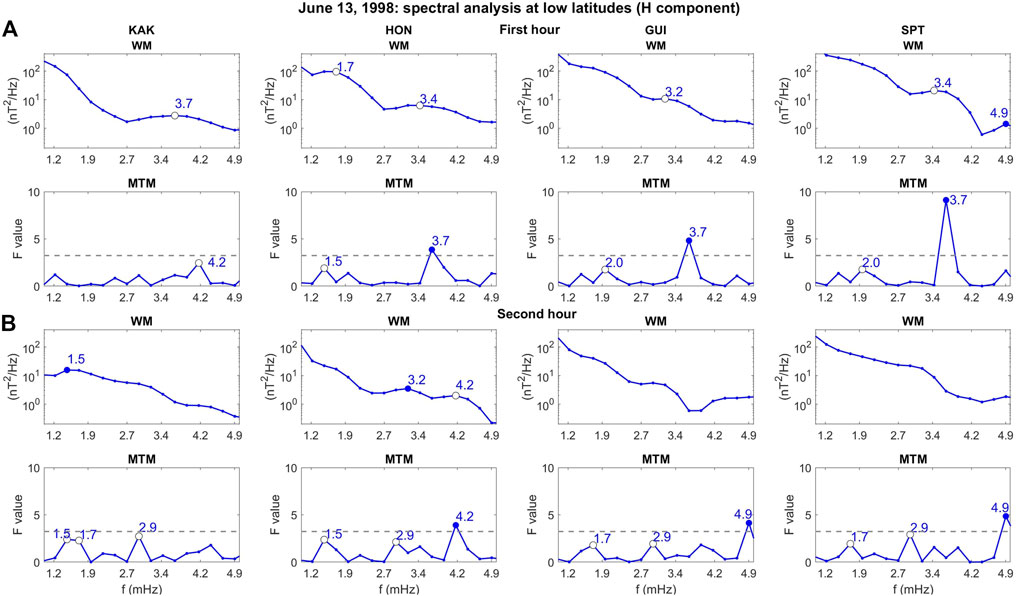
FIGURE 7. (A) Spectral analysis results for the first hour of geomagnetic field component observations at low latitude stations. First row: results of the WM analysis; and second row: results of the MTM analysis. (B) Same for the second hour.
Table 1a summarizes the results of the previous paragraphs (red characters identify less prominent signals) for the first hour and confirms that the wave activity, in all regions (SW, magnetosphere, ground), was mostly observed in two frequency bands, namely f ≈ 1.7–2.2 and ≈3.4–3.9 mHz. The correspondence between SW and magnetospheric fluctuations appears clearer at f ≈ 2.0 mHz, suggesting a better agreement when the magnetospheric observations are compared with those of Wind, closer to the magnetosphere. Although less clear, this correspondence persists in the second hour, approximately in the same frequency ranges (f ≈ 1.5–1.7 and f ≈ 3.7–4.2; Table 1b). In this case, the additional magnetospheric mode at f ≈ 2.9 mHz might be related to the SW fluctuations at f ≈ 2.5–2.7 mHz. It is worth noting that the experimental results do not reveal magnetospheric modes unrelated to SW fluctuations: all fluctuations, indeed, appear triggered by SW compressional fluctuations approximately at the same frequencies, with no evidence for wave activity of internal origin or directly driven by the shock impact.
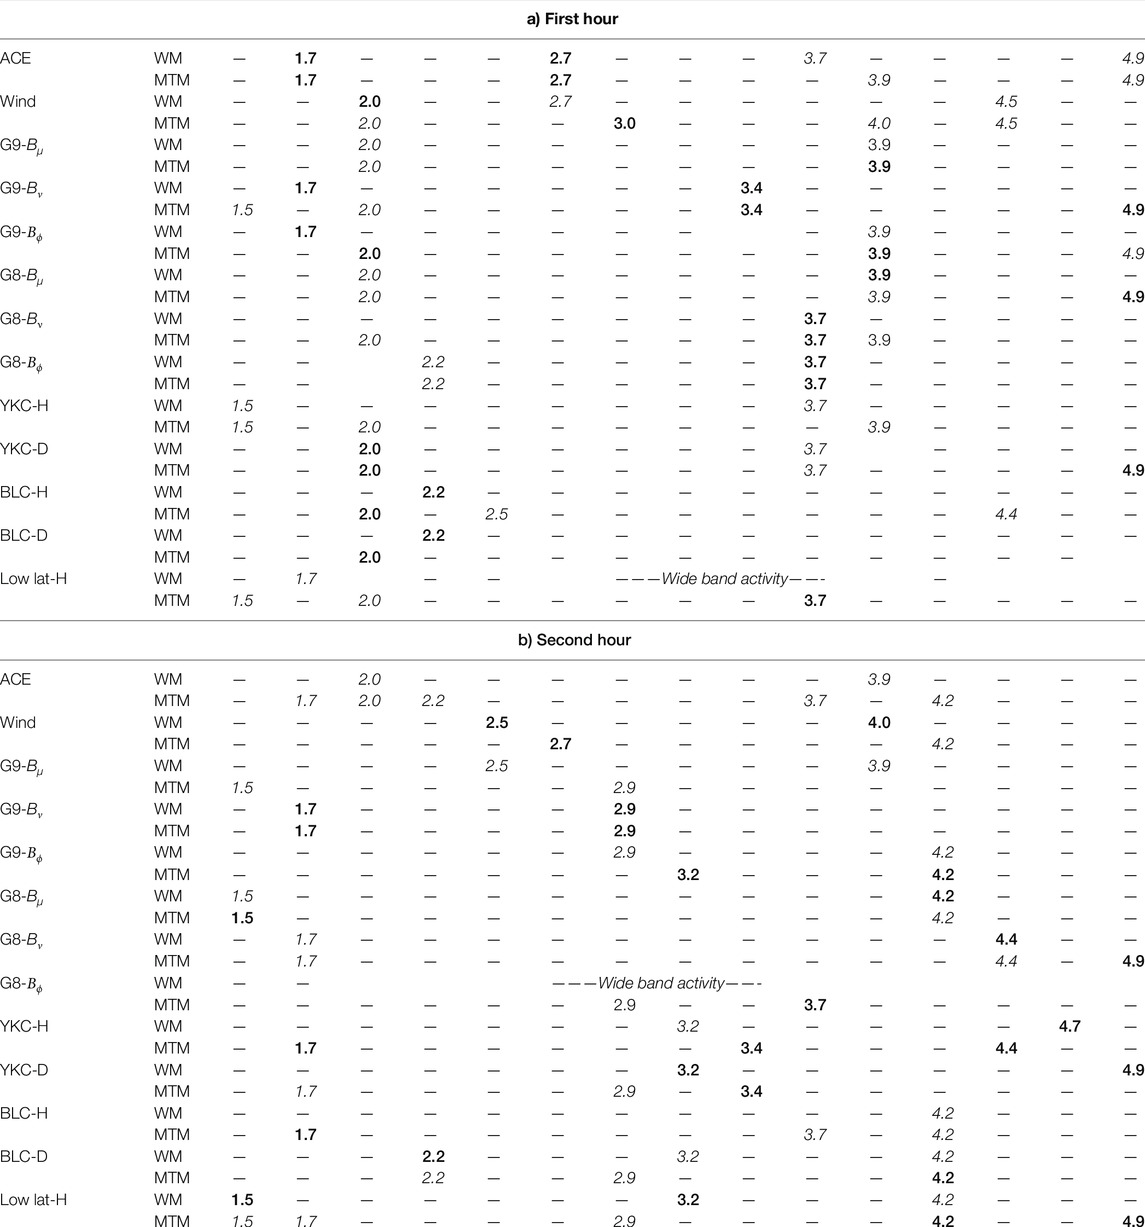
TABLE 1. Event of 13 June 1998. The frequencies of events/enhancements (BOLD and ITALICS, respectively).
4 The Event of 18 May 2002
4.1 Observations in Interplanetary Space
The second event concerns a case in which ACE and Wind were at a relevant distance from each other and from the magnetosphere (Figure 8A). The IS was observed on 18 May 2002 at ≈ 19:18 UT by ACE (XSE ≈ 236.3 Re; YSE ≈ 41.4 Re; Figure 8B) and at ≈ 19:44 UT by Wind, far from the Earth–Sun line (XSE ≈ 10.8 Re; YSE ≈ 317.2 Re): the angular separation between spacecraft was α ≈ 78.1° and their distance along the Earth–Sun line was DXSE ≈ 225.5 Re. The shock normal n was oriented at θnA ≈ −10.6°, ϕnA ≈ 190.6° at ACE and at θnW ≈ 1.0°, ϕnW ≈ 168.7° at Wind (frontal shock). The distance of the nominal shock front from the bow shock nose was ≈214 Re (ACE) and ≈60 Re (Wind), respectively. This event was much stronger than the previous one with higher jumps of the SW parameters. While the BIMF jump across the IS at ACE and Wind was similar as in the previous case (DBA ≈ 11.3 nT; DBW ≈ 10.3 nT), the PSW variation was ≈57% greater at Wind (DPA ≈ 7.9 nPa; DPW ≈ 12.4 nPa; Figure 8B). The SYM-H index ranged between ≈56 nT and ≈ −3 nT. In the ≈ 2-h interval examined hereafter, the average values of the SW parameters were:
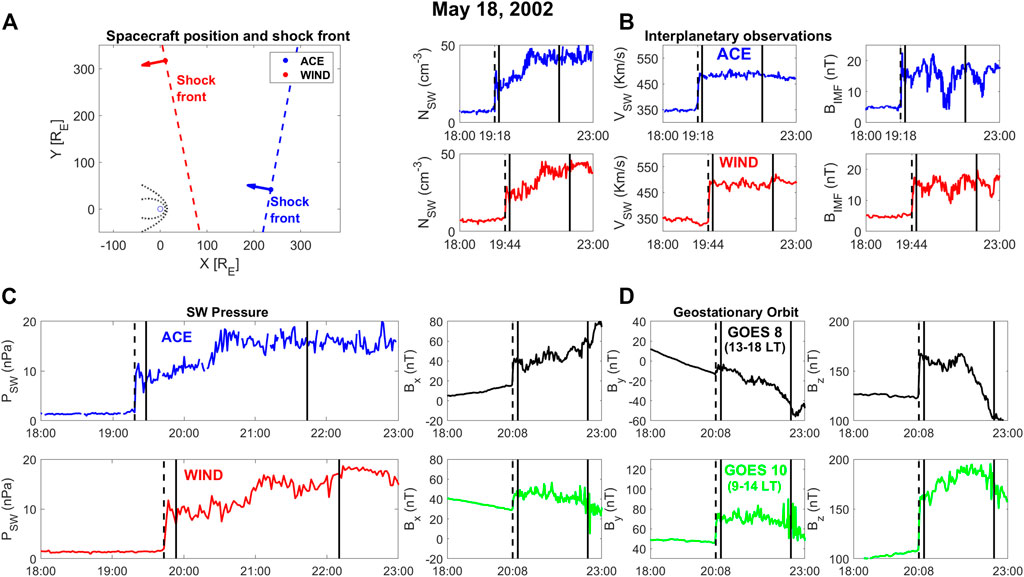
FIGURE 8. (A) Spacecraft position and shock orientation for the event of 18 May 2002. (B) SW and IMF parameters across the shock front. (C) Comparison of the SW pressure (100 s sampling) at ACE and Wind. (D) Sudden impulse observed at geostationary orbit (GSM coordinates). Vertical lines as in Figure 1.
4.1.1 First Hour
As for the previous case, in the first hour (Figure 9A), the results of the spectral analysis show a good WM/MTM agreement at both spacecraft, confirming well-defined characteristics of the SW fluctuations in the leading edge of the stream. In particular, at ACE, in both analyses, an enhancement and an event occur at f ≈ 2.0 mHz and ≈3.9 mHz, respectively. The results at Wind show a common event at f ≈ 1.2 mHz and enhancements at f ≈ 2.8 (WM event) and ≈3.8 mHz (MTM peak). An additional MTM event and a prominent WM enhancement are identified at ≈ 4.8 mHz (as previously remarked, above ≈4.5 mHz, WM enhancements, although relevant, cannot be selected as events). The comparison between spacecraft reveals, in this case, different characteristics of the fluctuations at different places (f ≈ 2.0 and ≈3.9 mHz at ACE; f ≈ 1.2, ≈2.8, and ≈4.8 mHz at Wind): it persists; however, some correspondence for fluctuations at f ≈ 3.7–3.9 mHz.
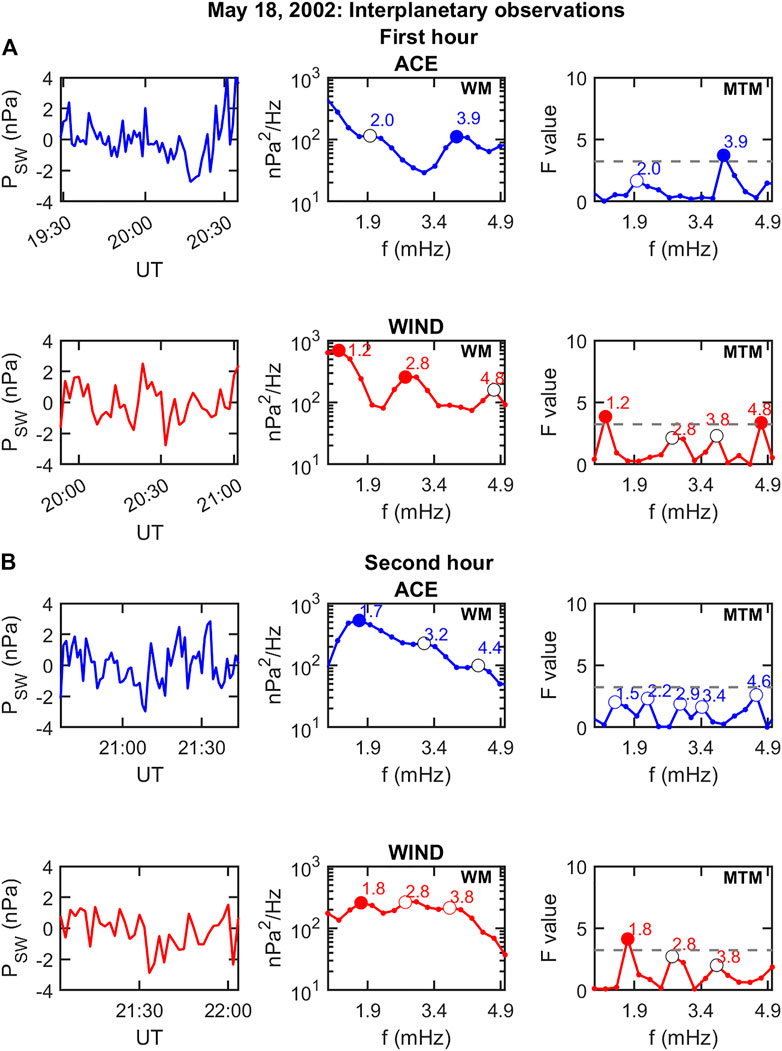
FIGURE 9. (A) Spectral analysis results for the first hour of SW pressure observations. Left panels: detrended PSW observations at ACE and Wind; central panels: results of the WM analysis; and right panels: results of the MTM analysis. (B) Same for the second hour. Circles and lines as in Figure 2.
4.1.2 Second Hour
As shown in Figure 9B, in this time interval, common peaks at ACE occur at f ≈ 1.5 (MTM)–1.7 mHz (WM event), f ≈ 2.2–3.4 mHz, f ≈ 4.4–4.6 mHz. Remarkably, in this case, Wind data reveal a close WM/MTM correspondence, with a common event at f ≈ 1.8 mHz, and peaks at f ≈ 2.8 and f ≈ 3.8 mHz. The comparison between ACE and Wind suggests the possible occurrence of fluctuations at both spacecraft at f ≈ 1.5–1.7 mHz.
In this case, globally five events were selected by WM and four by MTM; three of them were identified as common events (four, considering the event at ≈ 4.7 mHz).
4.2 Observations at Geostationary Orbit
Despite the large distance of the spacecraft from the magnetosphere, we found it interesting to compare the interplanetary and magnetospheric observations. At geostationary orbit, the SI occurred at ≈ 20:08 UT (≈11:23 MLT at GOES 10; ≈15:26 MLT at GOES 8; Figure 8D): consistent with the IS observations, the field jump was much stronger than in the previous case and attained greater value close to the subsolar point (DBz,10 ≈ 53.7 nT; DBz,8 ≈ 41.6 nT; DB10 ≈ 60.9 nT; and DB8 ≈ 44.6 nT).
Figure 10A (first hour) and Figure 10B (second hour) show the results of the spectral analysis: in the period of interest, GOES 10 (green trace) spanned the subsolar region (≈11:33–13:49 MLT) while GOES 8 (black trace) moved from the afternoon to the dusk sector (≈15:36–17:52 MLT). As shown in the left panels, in this case, the wave activity, still more relevant along Bμ, was significant also on the other components.
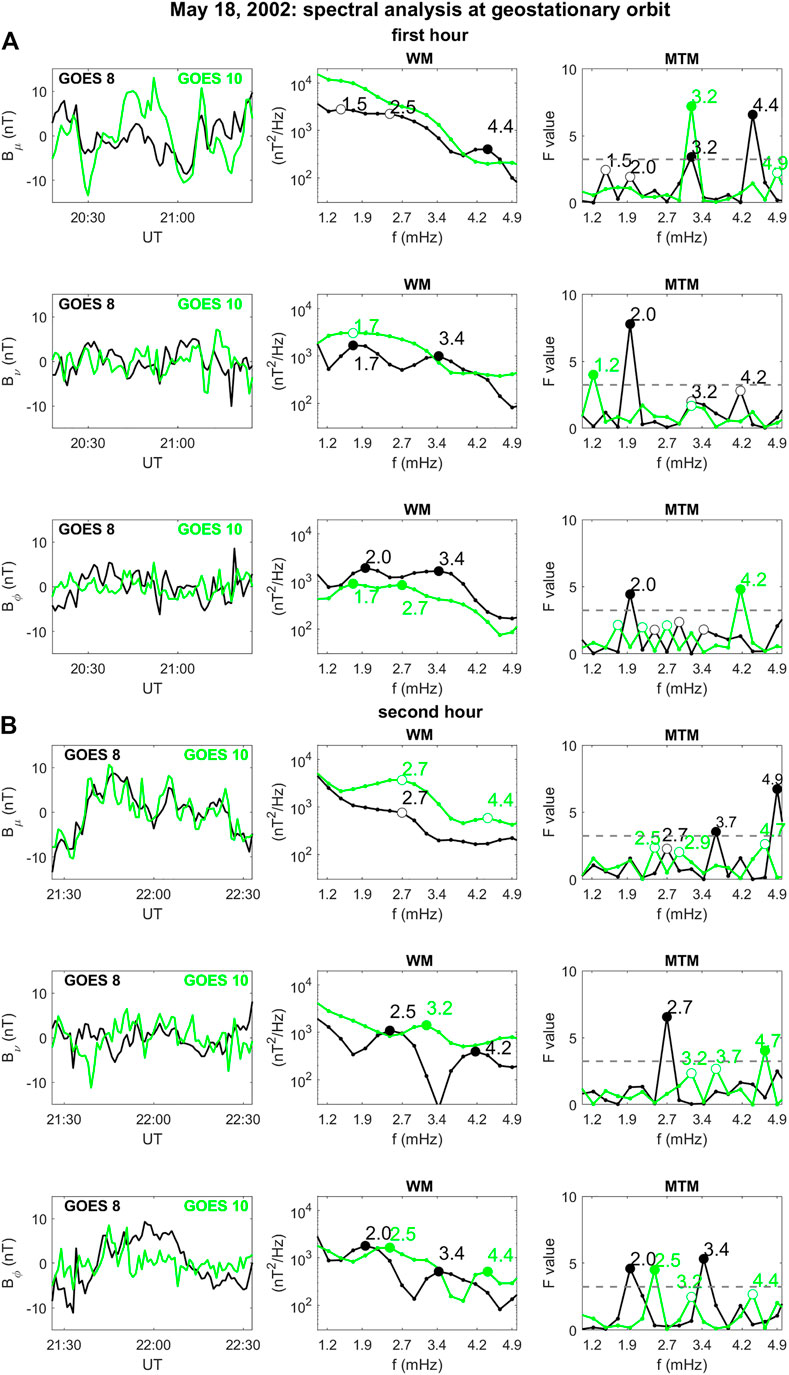
FIGURE 10. (A) Spectral analysis results for the first hour of magnetospheric field component observations at GOES 8 and GOES 9. Left panels: detrended observations; central panels: results of the WM analysis; and right panels: results of the MTM analysis. (B) Same for the second hour.
4.2.1 First Hour
• Bμ: At GOES 10, WM shows only a small enhancement at f ≈ 1.5 mHz. By contrast, MTM reveals an event at f ≈ 3.2 mHz and other peaks at f ≈ 4.4–4.9 mHz. The same signals are detected by GOES 8, which identifies wave activity at f ≈ 3.2 mHz (MTM event) and a common event at f ≈ 4.4 mHz. Other small enhancements occur at f ≈ 1.5, ≈2.0, and ≈2.5 mHz.
• Bν: The poloidal component reveals results like those of the compressional component. In this case, a comparison between WM and MTM suggests, at GOES 10, wave activity at low frequencies, with major enhancements at f ≈ 1.2 (MTM event) and ≈1.7 mHz (WM). Additional MTM enhancements occur at ≈ 3.2–3.4 mHz. At GOES 8, an event is commonly selected at f ≈ 1.7 (WM)–2.0 mHz (MTM) and other relevant enhancements occur at f ≈ 3.2–3.4 (WM event) and f ≈ 4.2 mHz (MTM).
• Bϕ: GOES 10 reveals WM enhancements at f ≈ 1.7 and ≈2.7 mHz. MTM shows several contiguous peaks in the entire frequency range and reveals an event at f ≈ 4.2 mHz. At GOES 8, the similarity with the WM spectra observed by GOES 10 seems to suggest a frequency shift of the two WM peaks at f ≈ 2.0 (MTM event) and ≈3.4 mHz. Interestingly, these peaks occur at the same frequencies as those of the poloidal component. As for the previous event, the power of the azimuthal component is greater in the afternoon sector.
4.2.2 Second Hour
• Bμ: At GOES 10, MTM suggests activity at f ≈ 2.5, ≈2.9, and ≈4.7 mHz associated with WM enhancements at f ≈ 2.7 and ≈4.4 mHz. GOES 8 shows MTM events at f ≈ 3.7 and ≈4.9 mHz, together with a small peak at f ≈ 2.7 mHz for both methods.
• Bν: At GOES 10, events are identified at f ≈ 3.2 mHz (WM) and ≈4.7 mHz (MTM), and additional MTM activity emerges at f ≈ 3.2–3.7 mHz. At GOES 8, events are selected at f ≈ 2.5–2.7 (both methods) and ≈4.2 mHz (WM).
• Bϕ: The wave activity appears well defined at both spacecraft. Common WM/MTM events are observed at f ≈ 2.5 mHz at GOES 10 (where a WM event/MTM peak occurs at f ≈ 4.4 mHz) and at f ≈ 2.0 and ≈3.4 mHz at GOES 8.
Globally, five (seven, considering contiguous frequency values) out of 14 WM events were selected by MTM (14 selected events).
In conclusion, although less evident, the correspondence between GOES 10 and GOES 8 observations occurred in this case also, and the experimental results confirm a higher energy level of the compressional and poloidal component in the subsolar region while the azimuthal component confirms a greater energy content in the afternoon sector (at least in the leading edge). Given the large distance from the magnetosphere, the comparison between external and magnetospheric fluctuations is questionable. However, the observed magnetospheric fluctuations might still find external counterparts either at ACE or at Wind.
4.3 Observations at Ground-Based Stations
At ground-based stations, the SI manifests from dawn to dusk (KAK, MLTSI ≈ 05:33; HON, MLTSI ≈ 09:37; YKC, MLTSI ≈ 11:35; BLC, MLTSI ≈ 13:06; GUI, MLTSI ≈ 19:41; SPT, MLTSI ≈ 20:43; Figure 11). At the auroral stations, the PI/MI structure is less evident than in the previous case, and the field variation is much stronger, with a huge ramp up on the D component (DDBLC ≈ 295.9 nT; DDYCK ≈ 240.1 nT), the H component being more affected by the variable ionospheric currents. At lower latitudes, the SI clearly appears on the H component, with increasing amplitude from dawn to dusk (DHKAK ≈ 21.1 nT; DHHON ≈ 28.9 nT; DHGUI ≈ 48.4 nT; and DHSTP ≈ 66.0 nT), a feature which suggests an IS impact on the afternoon side of the magnetosphere, consistent with the orientation of the shock front deduced from Wind data.
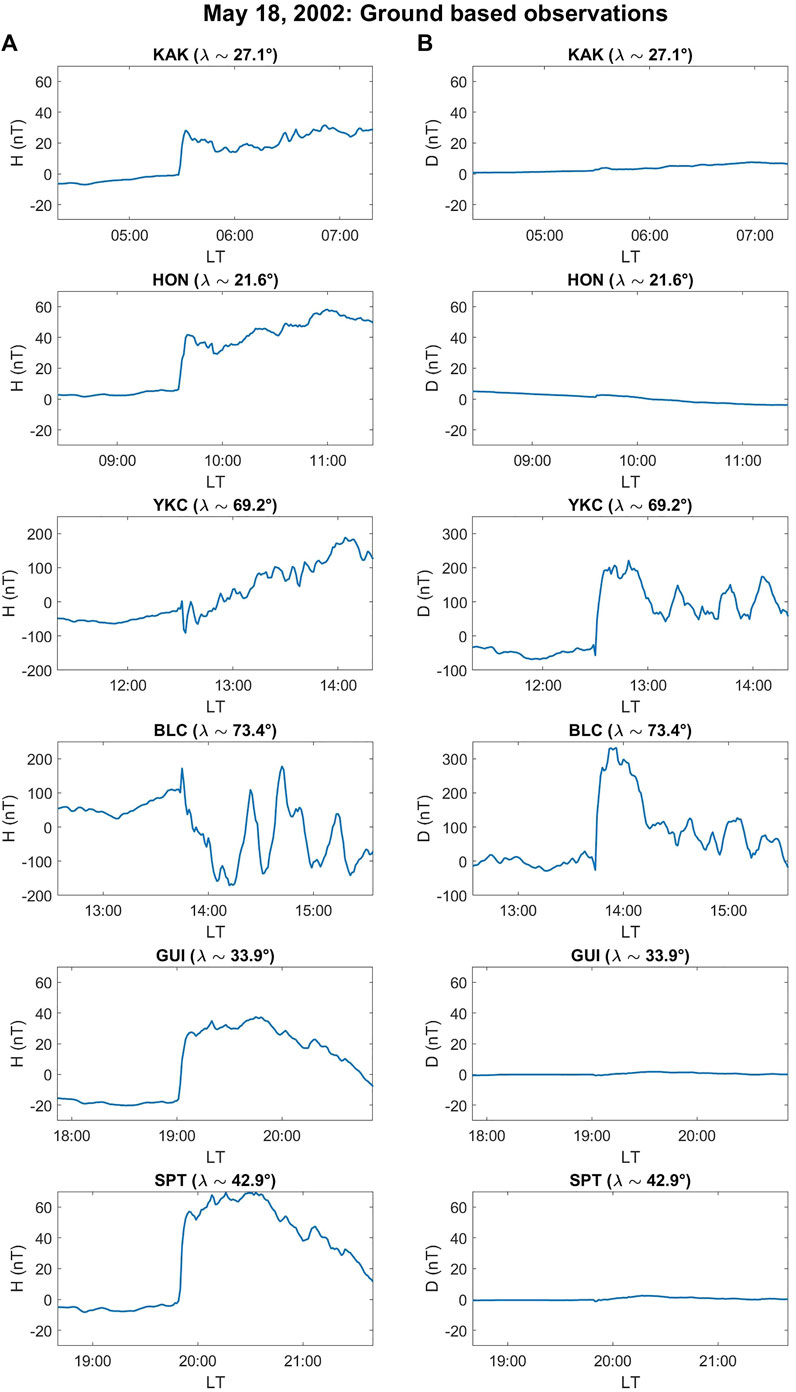
FIGURE 11. Sudden impulse observed at several ground-based stations. (A) H component. (B) D component.
As shown in Figure 12A, at high latitude stations, the field fluctuations, much larger at BLC (YKC ≈11:45–14:01 MLT; BLC ≈13:16–15:32 MLT), show a substantial correspondence with GOES 10 and GOES 8 observations, respectively. In the first hour, at YKC, the H activity emerges at f ≈ 2.0 mHz (WM event), ≈3.2 mHz (MTM event) and ≈4.4–4.7 mHz. In D, enhancements appear at f ≈ 2.7–2.9 mHz (WM event) and ≈4.4 mHz (common event). BLC observations reveal a common event on the H component at f ≈ 4.7 mHz and a corresponding MTM enhancement on the D component. The WM spectrum also shows some evidence for an H enhancement at f ≈ 3.2 mHz. In the second hour (Figure 12B), at YKC, H peaks manifest at f ≈ 2.2–2.5 mHz (common event) and ≈4.2 mHz. Along D, they occur at f ≈ 2.2 and ≈3.7 mHz. At BLC, a common event emerges on D at f ≈ 3.9 mHz. On the H component, several MTM peaks appear at f ≈ 1.2, f ≈ 2.2 mHz (also on D), ≈4.2, ≈4.9 mHz. Globally, six WM and six MTM events were identified with three (four for contiguous frequency values) common identifications.
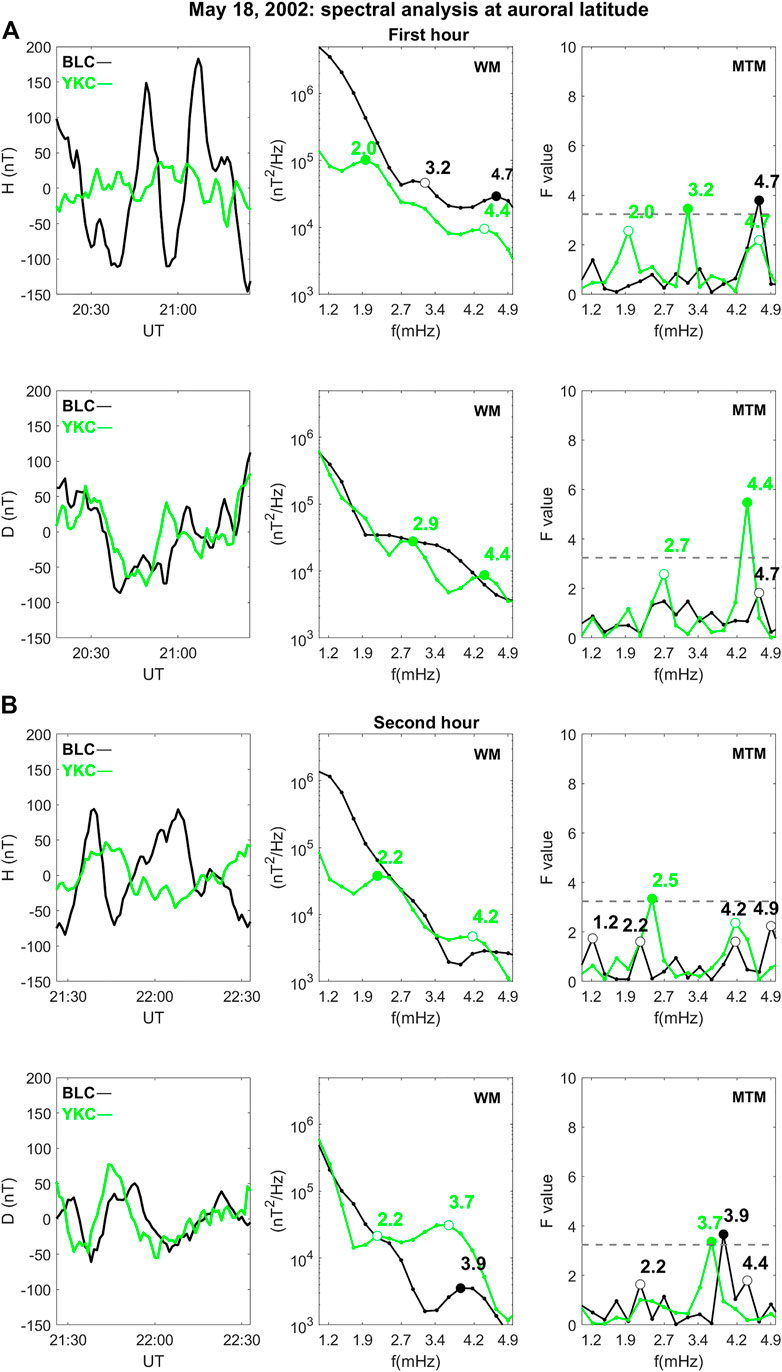
FIGURE 12. (A) Spectral analysis results for the first hour of geomagnetic field component observations at YKC and BCL. Left panels: detrended observations; central panels: results of the WM analysis; and right panels: results of the MTM analysis. (B) Same, for the second hour.
At lower latitudes, in the first hour (Figure 13A), the H peaks/events appear at f ≈ 1.7–2.0 mHz (dawn side, KAK), ≈3.2 mHz (MTM) and ≈3.9–4.7 mHz. In the second hour (Figure 13B), enhancements emerge at f ≈ 2.0–2.7 mHz (dusk). A more composite structure reveals wave activity also between f ≈ 3.4–4.7 mHz. Practically, all the ground signals find correspondence in those detected at geostationary orbit. Only one common event results from six WM and three MTM identifications.
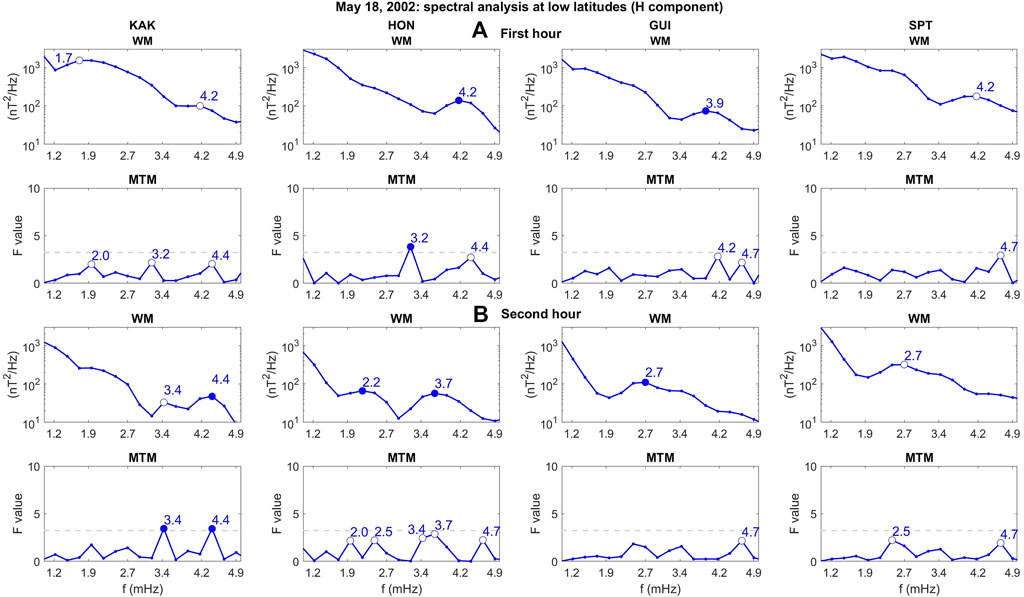
FIGURE 13. (A) Spectral analysis results for the first hour of geomagnetic field component observations at low latitude stations. First row: results of the WM analysis; and second row: results of the MTM analysis. (B) Same for the second hour.
Table 2a summarizes, for the first hour, the results of our analysis and shows that the fluctuations activity basically occurs in different ranges at ACE (mostly at f ≈ 2.0 and ≈3.9 mHz) and Wind (f ≈ 1.2, ≈2.7, and ≈4.7 mHz), evidence of a remarkable spatio-temporal difference of the fluctuations activity. In a similar situation, we may only note the occurrence of magnetospheric fluctuations at similar frequencies (f ≈ 1.7–2.0, ≈2.5–2.7, and ≈4.2–4.7 mHz). In the second hour (Table 2b), the interplanetary activity at f ≈ 1.7 (both ACE and Wind), ≈2.7 and ≈3.7 mHz (Wind), ≈4.4–4.7 mHz (ACE) might be tentatively related to the magnetospheric fluctuations occurring at f ≈ 2.0–2.2, ≈2.5–2.7, ≈3.4–3.7 and ≈4.4–4.9 mHz.
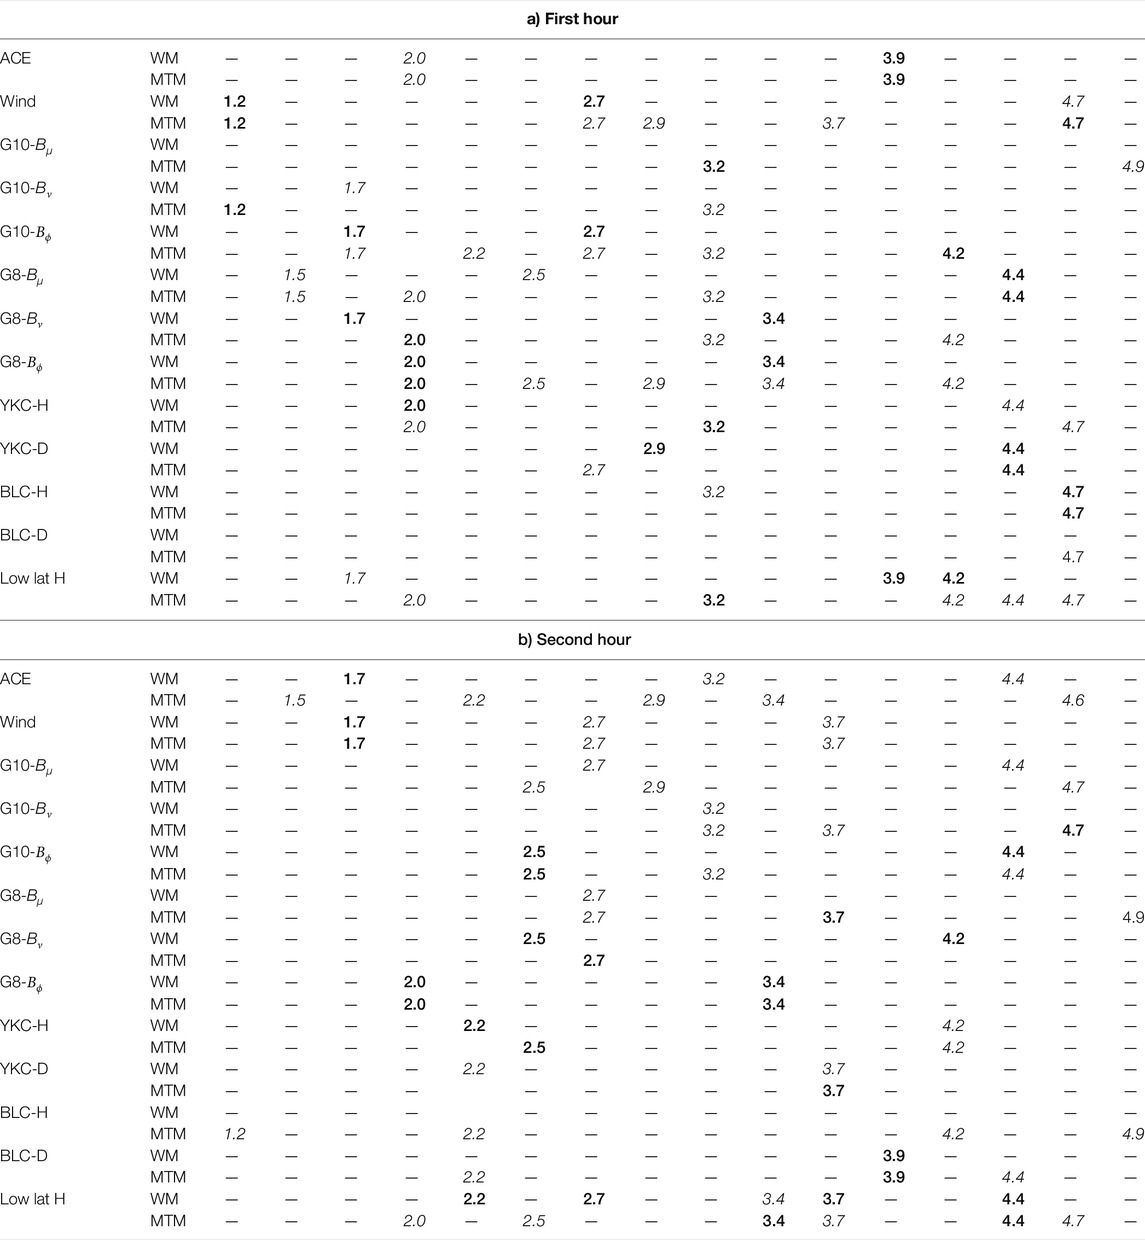
TABLE 2. Event of 18 May 2002. The frequencies of events/enhancements (BOLD and ITALICS, respectively).
5 Summary and Discussion
Since early investigations, several studies reported on the occurrence of magnetospheric waves at discrete frequencies (between f ≈ 1–5 mHz) and their relationship to the impinging on the magnetosphere of SW structures and fluctuations has often been investigated. As previously remarked, several critical aspects may influence the results of similar analysis, such as 1) the spatio-temporal differences of the characteristics of the SW structures and, more importantly, those of imbedded fluctuations between the observation point and the magnetosphere; 2) the choice of the parameter representative of the SW fluctuations; 3) the role of the analytical methods (and related parameters) adopted for the identification of the fluctuations events and their characteristics.
Focusing on these aspects, we analyzed the SW compressional fluctuations following two ISs, considering the observations of two interplanetary spacecraft and comparing the results of the WM and MTM methods (and those of the dynamic spectra). We examined two different situations (in terms of spacecraft separation and distance from the magnetosphere) and compared the interplanetary observations with those obtained by two geostationary probes and at several ground-based stations. The principal results of our investigation can be summarized in the following points.
• Within the limits of the present analysis, both in the interplanetary medium and at geostationary orbit, the WM/MTM agreement in the event identification is confirmed on the order of ≈50% (Di Matteo and Villante, 2017; Di Matteo and Villante, 2018). Nevertheless, it improves (up to 100%) in the leading edge of the region following the IS or SI, revealing well-defined characteristics of the wave modes embedded in these structures. However, even in such favorable conditions, the results of the automatic selection of events might not be the same even for closely related parameters, such as the SW density and pressure. In addition, different results can be obtained when the same SW stream is monitored at different places in the interplanetary medium. All these features confirm that the results of the statistical analysis, in which the events are automatically selected, might be strongly influenced by the adopted analytical methods, by the parameter chosen to characterize the fluctuations activity and by the position of the observing spacecraft.
• The number of selected events at ground-based stations is smaller than in the SW/magnetosphere, and the WM/MTM agreement is poor (≈10%). Eventually, these aspects might be related to the steeper f−α decrease of the ground spectra in the range of interest [α ≈ 2.0–3.0; (Lanzerotti et al., 1990; Yagova et al., 2010; Yagova, 2015)], compared to those of the interplanetary [α ≈ 1.0–1.7; (Bruno and Carbone, 2013; Treumann et al., 2019)] and, to a lesser extent, magnetospheric spectra [α ≈ 2.0–2.5; (Ozeke et al., 2012; Ozeke et al., 2014; Pokhotelov et al., 2015)] as well as to the higher noise level (determined by ionospheric currents, Sq variation, etc.), which make more difficult the event identification. On the other hand, the identification criteria adopted in the present investigation have been tested only in the SW (Di Matteo and Villante, 2017) and magnetospheric plasmas (Di Matteo and Villante, 2018). Interestingly, a preliminary long term analysis, conducted at a low latitude ground-based station (AQU; λ ≈ 36.3°; (Colonico et al., 2020)) proposed an average spectral index α ≈ 2.6 between f ≈ 1–5 mHz for both H and D and showed that, in similar conditions, the identification of events with the current criteria might be difficult at least up to f ≈ 2.5 mHz.
• For angular separation and radial distance between interplanetary spacecraft such as α ≈ 20° and DXSE ≈ 80 Re, the properties of the SW compressional fluctuations detected at ACE and Wind in the leading edge of the stream are approximately the same, allowing a confident comparison with magnetospheric observations: it showed that the periodic buffeting on the magnetopause triggered magnetospheric fluctuations, approximately at the same SW frequencies, more intense along the compressional component. These fluctuations, directly driven by the SW, occur in the entire dayside sector of the magnetosphere (with greater energy in the subsolar region), showing similar characteristics along the compressional and the poloidal component in terms of the shape of the spectra and the frequency of the power peaks (f ≈ 1.7–2.0 and ≈3.4–3.9 mHz): it suggests that they might be mostly related to fluctuations basically consistent with global poloidal cavity modes. Correspondingly, fluctuations at the same frequencies were detected close to the foot of the field lines associated with spacecraft and from dawn to dusk at low latitude ground-based stations. Unlike the other components, the azimuthal component has greater energy in the afternoon region (a feature confirmed in the second event), typically above ≈2 mHz. It is possible that such enhanced wide-band activity might result from the satellite’s position being closer to the region of coupling between compressional modes and fundamental toroidal Alfvén waves. Indeed, according to Archer et al. (Archer et al., 2015), these modes in the afternoon sector might have frequencies (a few mHz) closer to those of impacting SW fluctuations than in the noon sector (tens of mHz).
• For much greater angular separation (α ≈ 78°) and distance (DXSE ≈ 225 Re) between interplanetary spacecraft, the correspondence between the SW fluctuations becomes poor. It suggests caution before drawing general conclusions on the characteristics of the SW fluctuations destined to impinge on the magnetosphere from analysis conducted by a single interplanetary spacecraft. Note that for the second event, the impact on the magnetosphere of the frontal shock might potentially trigger ULF waves in the frequency range of interest (≈1–5 mHz) conversely to the impact of an inclined shock (Oliveira et al., 2020), as in the first event. Nevertheless, despite the relevant distance, also in this case, the magnetospheric fluctuations appear to occur approximately in the same frequency ranges as in the SW; it reinforces the conclusions that in both events most of the magnetospheric activity is directly driven and/or triggered by compressional SW fluctuations. On the other hand, in general, we did not find any evidence for magnetospheric wave activity of internal origin or directly driven by the shock impact.
• With an experimental uncertainty at least on the order of
• In both events, the BIMF jumps across the IS were similar at ACE and Wind. By contrast, those of PSW were significantly different, suggesting a PSW variation strongly related to the local shock geometry and characteristics. This aspect should be taken into account when the magnetospheric response to the SI impact is evaluated in terms of the ratio between the change in the magnetospheric field and that of the square root of PSW [(Villante and Piersanti, 2008) and studies therein referenced]; the results, indeed, might be strongly dependent on the spacecraft position in interplanetary space.
Data Availability Statement
Publicly available datasets were analyzed in this study. These data can be found at: https://cdaweb.gsfc.nasa.gov/index.html/, http://www.cfa.harvard.edu/shocks, www.intermagnet.org.
Author Contributions
All the authors listed have made a substantial, direct, and intellectual contribution to the work and approved it for publication.
Funding
The work of SD was supported under the National Aeronautics and Space Administration Heliophysics Internal Scientist Funding Model (ISFM) program and NASA Grant 80NSSC21K0459.
Conflict of Interest
The authors declare that the research was conducted in the absence of any commercial or financial relationships that could be construed as a potential conflict of interest.
Publisher’s Note
All claims expressed in this article are solely those of the authors and do not necessarily represent those of their affiliated organizations, or those of the publisher, the editors, and the reviewers. Any product that may be evaluated in this article, or claim that may be made by its manufacturer, is not guaranteed or endorsed by the publisher.
Acknowledgments
The authors thank the National Space Science Data Center of the Goddard Space Flight Center for the plasma and magnetic field data from the Wind and ACE spacecraft and the NASA CDAWeb team for making these data available (http://cdaweb.gsfc.nasa.gov/istp_public/). The authors acknowledge the Harvard–Smithsonian Center for Astrophysics for the interplanetary shock analysis (http://www.cfa.harvard.edu/shocks). The GOES magnetic field data were provided by H. Singer (National Oceanic and Atmospheric Administration Space Environment Center, Asheville, N.C.) through NASA’s National Space Science Data Center and Space Physics Data Facility (http://cdaweb.gsfc.nasa.gov/istp_public/). The results presented in this article rely on data collected at magnetic observatories. We thank the national institutes that support them and INTERMAGNET for promoting high standards of magnetic observatory practice(www.intermagnet.org).
Supplementary Material
The Supplementary Material for this article can be found online at: https://www.frontiersin.org/articles/10.3389/fspas.2022.835539/full#supplementary-material
References
Araki, T. (2013). “A Physical Model of the Geomagnetic Sudden Commencement,” in Geophysical Monograph Series. Editors MJ. Engebretson, K. Takahashi, M. Scholer, (Washington, D. C.: American Geophysical Union), 183–200. doi:10.1029/gm081p0183
Archer, M. O., Hartinger, H., Plaschke, M. D., Angelopoulos, F., and au, V. (2019). Direct Observations of a Surface Eigenmode of the Dayside Magnetopause. Nat. Commun. 10, 615. doi:10.1038/s41467-018-08134-5
Archer, M. O., Hartinger, M. D., and Horbury, T. S. (2013). Magnetospheric “Magic” Frequencies as Magnetopause Surface Eigenmodes. Geophys. Res. Lett. 40, 5003–5008. doi:10.1002/grl.50979
Archer, M. O., Hartinger, M. D., Plaschke, F., Southwood, D. J., and Rastaetter, L. (2021). Magnetopause Ripples Going against the Flow Form Azimuthally Stationary Surface Waves. Nat. Commun. 12, 5697. doi:10.1038/s41467-021-25923-7
Archer, M. O., Hartinger, M. D., Walsh, B. M., Plaschke, F., and Angelopoulos, V. (2015). Frequency Variability of Standing Alfvén Waves Excited by Fast Mode Resonances in the Outer Magnetosphere. Geophys. Res. Lett. 42, 10,150–10,159. doi:10.1002/2015GL066683
Borovsky, J. E., and Denton, M. H. (2006). Differences between CME-Driven Storms and CIR-Driven Storms. J. Geophys. Res. 111, A07S08. doi:10.1029/2005JA011447
Borovsky, J. E. (2018). The Spatial Structure of the Oncoming Solar Wind at Earth and the Shortcomings of a Solar-Wind Monitor at L1. J. Atmos. Solar-Terrestrial Phys. 177, 2–11. doi:10.1016/j.jastp.2017.03.014
Bruno, R., and Carbone, V. (2013). The Solar Wind as a Turbulence Laboratory. Living Rev. Solar Phys. 10, 2. doi:10.12942/lrsp-2013-2
Burkholder, B. L., Nykyri, K., and Ma, X. (2020). Use of the L1 Constellation as a Multispacecraft Solar Wind Monitor. J. Geophys. Res. Space Phys. 125, e2020JA027978. doi:10.1029/2020JA027978
Colonico, A., Di Matteo, S., and Villante, U. (2020). Characterization of the Pc5 Frequency Range Power Spectrum at Low Latitude in 22 Years of Geomagnetic Field Observations. Tech. rep., oral. doi:10.5194/egusphere-egu2020-4516
Di Matteo, S., and Villante, U. (2017). The Identification of Solar Wind Waves at Discrete Frequencies and the Role of the Spectral Analysis Techniques: The Identification of Solar Wind Waves. J. Geophys. Res. Space Phys. 122, 4905–4920. doi:10.1002/2017JA023936
Di Matteo, S., and Villante, U. (2018). The Identification of Waves at Discrete Frequencies at the Geostationary Orbit: The Role of the Data Analysis Techniques and the Comparison with Solar Wind Observations. J. Geophys. Res. Space Phys. 123, 1953–1968. doi:10.1002/2017JA024922
Francia, P., Lepidi, S., and Yumoto, K. (2002). Geomagnetic Field Fluctuations during the Passage at the Earth's Orbit of the Tail of the 15-16 July 2000 Ejecta. Ann. Geophys. 20, 1143–1152. doi:10.5194/angeo-20-1143-2002
Francia, P., and Villante, U. (1997). Some Evidence of Ground Power Enhancements at Frequencies of Global Magnetospheric Modes at Low Latitude. Ann. Geophys. 15, 17–23. doi:10.1007/s00585-997-0017-2
He, F., Guo, R.-L., Dunn, W. R., Yao, Z.-H., Zhang, H.-S., Hao, Y.-X., et al. (2020). Plasmapause Surface Wave Oscillates the Magnetosphere and Diffuse Aurora. Nat. Commun. 11, 1668. doi:10.1038/s41467-020-15506-3
Kepko, L. (2003). Observations of Discrete, Global Magnetospheric Oscillations Directly Driven by Solar Wind Density Variations. J. Geophys. Res. 108, 1257. doi:10.1029/2002JA009676
Kepko, L., Spence, H. E., and Singer, H. J. (2002). ULF Waves in the Solar Wind as Direct Drivers of Magnetospheric Pulsations. Geophys. Res. Lett. 29, 39-1–39-4. doi:10.1029/2001GL014405
Lanzerotti, L. J., Maclennan, C. G., and Fraser-Smith, A. C. (1990). Background Magnetic Spectra: ∼10−5 to ∼105 Hz. Geophys. Res. Lett. 17, 1593–1596. doi:10.1029/GL017i010p01593
Oliveira, D. M., Hartinger, M. D., Xu, Z., Zesta, E., Pilipenko, V. A., Giles, B. L., et al. (2020). Interplanetary Shock Impact Angles Control Magnetospheric ULF Wave Activity: Wave Amplitude, Frequency, and Power Spectra. Geophys. Res. Lett. 47, e2020GL090857. doi:10.1029/2020GL090857
Ozeke, L. G., Mann, I. R., Murphy, K. R., Jonathan Rae, I., and Milling, D. K. (2014). Analytic Expressions for ULF Wave Radiation belt Radial Diffusion Coefficients: Analytic Radial Diffusion Coefficients. J. Geophys. Res. Space Phys. 119, 1587–1605. doi:10.1002/2013JA019204
Ozeke, L. G., Mann, I. R., Murphy, K. R., Rae, I. J., Milling, D. K., Elkington, S. R., et al. (2012). ULF Wave Derived Radiation belt Radial Diffusion Coefficients. J. Geophys. Res. 117, A04222. doi:10.1029/2011JA017463
Piersanti, M., Di Matteo, S., Zhima, Z., Yang, Y., Zhang, Z., Marcucci, M. F., et al. (2022). On the Source of the Anomalous ULF Waves Detected at Both Ground and Space‐Borne Data on 23 June 2020. JGR Space Phys. 127, e2021JA030044. doi:10.1029/2021JA030044
Plaschke, F., Glassmeier, K.-H., Auster, H. U., Constantinescu, O. D., Magnes, W., Angelopoulos, V., et al. (2009). Standing Alfvén Waves at the Magnetopause. Geophys. Res. Lett. 36, L02104. doi:10.1029/2008GL036411
Plaschke, F., and Glassmeier, K.-H. (2011). Properties of Standing Kruskal-Schwarzschild-Modes at the Magnetopause. Ann. Geophys. 29, 1793–1807. doi:10.5194/angeo-29-1793-2011
Pokhotelov, D., Rae, I. J., Murphy, K. R., and Mann, I. R. (2015). The Influence of Solar Wind Variability on Magnetospheric ULF Wave Power. Ann. Geophys. 33, 697–701. doi:10.5194/angeo-33-697-2015
Ruohoniemi, J. M., Greenwald, R. A., Baker, K. B., and Samson, J. C. (1991). HF Radar Observations of Pc 5 Field Line Resonances in the Midnight/Early Morning MLT Sector. J. Geophys. Res. 96, 15697–15710. doi:10.1029/91ja00795
Samson, J. C., Greenwald, R. A., Ruohoniemi, J. M., Hughes, T. J., and Wallis, D. D. (1991). Magnetometer and Radar Observations of Magnetohydrodynamic Cavity Modes in the Earth's Magnetosphere. Can. J. Phys. 69, 929–937. doi:10.1139/p91-147
Samson, J. C., Harrold, B. G., Ruohoniemi, J. M., Greenwald, R. A., and Walker, A. D. M. (1992). Field Line Resonances Associated with MHD Waveguides in the Magnetosphere. Geophys. Res. Lett. 19, 441–444. doi:10.1029/92GL00116
Treumann, R. A., Baumjohann, W., and Narita, Y. (2019). On the Ion-Inertial-Range Density-Power Spectra in Solar Wind Turbulence. Ann. Geophys. 37, 183–199. doi:10.5194/angeo-37-183-2019
Viall, N. M., Kepko, L., and Spence, H. E. (2009). Relative Occurrence Rates and Connection of Discrete Frequency Oscillations in the Solar Wind Density and Dayside Magnetosphere. J. Geophys. Res. 114, A01201. doi:10.1029/2008JA013334
Villante, U., Di Matteo, S., and Piersanti, M. (2016). On the Transmission of Waves at Discrete Frequencies from the Solar Wind to the Magnetosphere and Ground: A Case Study. J. Geophys. Res. Space Phys. 121, 380–396. doi:10.1002/2015JA021628
Villante, U., Francia, P., and Lepidi, S. (2001). Pc5 Geomagnetic Field Fluctuations at Discrete Frequencies at a Low Latitude Station. Ann. Geophys. 19, 321–325. doi:10.5194/angeo-19-321-2001
Villante, U., Francia, P., Vellante, M., Di Giuseppe, P., Nubile, A., and Piersanti, M. (2007). Long-Period Oscillations at Discrete Frequencies: A Comparative Analysis of Ground, Magnetospheric, and Interplanetary Observations. J. Geophys. Res. 112, A04210. doi:10.1029/2006JA011896
Villante, U., and Piersanti, M. (2008). An Analysis of Sudden Impulses at Geosynchronous Orbit. J. Geophys. Res. 113, A08213. doi:10.1029/2008JA013028
Walker, A. D. M., Ruohoniemi, J. M., Baker, K. B., Greenwald, R. A., and Samson, J. C. (1992). Spatial and Temporal Behavior of ULF Pulsations Observed by the Goose Bay HF Radar. J. Geophys. Res. 97, 12187. doi:10.1029/92JA00329
Walsh, B. M., Bhakyapaibul, T., and Zou, Y. (2019). Quantifying the Uncertainty of Using Solar Wind Measurements for Geospace Inputs. J. Geophys. Res. Space Phys. 124, 3291–3302. doi:10.1029/2019JA026507
Yagova, N. V., Pilipenko, V. A., Baransky, L. N., and Engebretson, M. J. (2010). Spatial Distribution of Spectral Parameters of High Latitude Geomagnetic Disturbances in the Pc5/Pi3 Frequency Range. Ann. Geophys. 28, 1761–1775. doi:10.5194/angeo-28-1761-2010
Yagova, N. V. (2015). Spectral Slope of High-Latitude Geomagnetic Disturbances in the Frequency Range 1-5 mHz. Control Parameters inside and outside the Magnetosphere. Geomagn. Aeron. 55, 32–40. doi:10.1134/S0016793215010144
Ziesolleck, C. W. S., and McDiarmid, D. R. (1995). Statistical Survey of Auroral Latitude Pc 5 Spectral and Polarization Characteristics. J. Geophys. Res. 100, 19299. doi:10.1029/95JA00434
Keywords: ULF waves, discrete frequencies, solar wind fluctuations, solar wind-magnetosphere interaction, spectral analysis methods
Citation: Villante U, Recchiuti D and Di Matteo S (2022) The Transmission of ULF Waves From the Solar Wind to the Magnetosphere: An Analysis of Some Critical Aspects. Front. Astron. Space Sci. 9:835539. doi: 10.3389/fspas.2022.835539
Received: 14 December 2021; Accepted: 1 April 2022;
Published: 03 May 2022.
Edited by:
Kazue Takahashi, Johns Hopkins University, United StatesReviewed by:
Nickolay Ivchenko, Royal Institute of Technology, SwedenDenny Oliveira, University of Maryland, Baltimore County, United States
Copyright © 2022 Villante, Recchiuti and Di Matteo. This is an open-access article distributed under the terms of the Creative Commons Attribution License (CC BY). The use, distribution or reproduction in other forums is permitted, provided the original author(s) and the copyright owner(s) are credited and that the original publication in this journal is cited, in accordance with accepted academic practice. No use, distribution or reproduction is permitted which does not comply with these terms.
*Correspondence: U. Villante, dW1iZXJ0by52aWxsYW50ZUBhcXVpbGEuaW5mbi5pdA==
†These authors have contributed equally to this work
 U. Villante
 D. Recchiuti
 S. Di Matteo