 B. Cecconi
 O. Witasse
 C. M. Jackman3
 B. Sánchez-Cano
94% of researchers rate our articles as excellent or good
Learn more about the work of our research integrity team to safeguard the quality of each article we publish.
Find out more
ORIGINAL RESEARCH article
Front. Astron. Space Sci., 27 May 2022
Sec. Space Physics
Volume 9 - 2022 | https://doi.org/10.3389/fspas.2022.800279
This article is part of the Research TopicInterplanetary Medium Variability as Observed in the New Era of Spacecraft MissionsView all 5 articles
The Saturn Kilometric Radiation (SKR) was observed for the first time during the flyby of Saturn by the Voyager spacecraft in 1980. These radio emissions, in the range of a few kHz to 1 MHz, are emitted by electrons travelling around auroral magnetic field lines. Their study is useful to understand the variability of a magnetosphere and its coupling with the solar wind. Previous studies have shown a strong correlation between the solar wind dynamic pressure and the SKR intensity. However, up to now, the effect of an Interplanetary Coronal Mass Ejection (ICME) has never been examined in detail, due to the lack of SKR observations at the time when an ICME can be tracked and its different parts be clearly identified. In this study, we take advantage of a large ICME that reached Saturn mid-November 2014 (Witasse et al., J. Geophys. Res. Space Physics, 2017, 122, 7865–7890). At that time, the Cassini spacecraft was fortunately travelling within the solar wind for a few days, and provided a very accurate timing of the ICME structure. A survey of the Cassini data for the same period indicated a significant increase in the SKR emissions, showing a good correlation after the passage of the ICME shock with a delay of ∼13 h and after the magnetic cloud passage with a delay of 25–42 h.
The Saturn Kilometric Radiation (SKR) was observed for the first time by Kaiser et al. (1980) during the flyby of Saturn in January 1980, with the Voyager/PRA (Planetary Radio Astronomy) instrument (Warwick et al., 1977). The SKR radio emission is a low frequency non-thermal radio emission observed between a few kHz to about 1 MHz. It is emitted through the Cyclotron Maser Instability (CMI) (Wu and Lee, 1979; Lamy et al., 2010) triggered by accelerated electrons travelling around auroral field lines (Lamy et al., 2009a). SKR is thus directly related to magnetospheric dynamical activity.
The analysis of Voyager PRA data showed a strong correlation between the solar wind dynamic pressure and SKR emitted flux (Desch, 1982; Desch and Rucker, 1983). Desch (1983) even showed that the SKR disappeared while Saturn passed through the tail of the Jovian magnetosphere. Thanks to the Cassini RPWS (Radio and Plasma Waves Science) experiment (Gurnett et al., 2004) we have quasi-continuous observations of the SKR from early 2004 to the end of mission in October 2017. The radio data have the potential to be used as a remote proxy for both upstream driving and magnetospheric dynamics, and many studies have sought to explore the role of the solar wind perturbations in stimulating auroral and radio phenomena. Corotating interaction region (CIR) compressions in the solar wind have been found to intensify the SKR bursts and occasionally to disrupt their regular phasing (Badman et al., 2008; Kurth et al., 2016). Dynamic magnetotail reconnection events have also been shown to correlate well with intensifications and low frequency extensions (LFEs) of the SKR (Bunce et al., 2005; Jackman et al., 2005; Jackman et al., 2009; Reed et al., 2018).
The link between enhanced solar wind parameters and intense planetary auroral activity has been known for many years at Saturn (e.g., Kaiser et al., 1980; Desch and Rucker, 1983; Rucker, 1984; Crary et al., 2005; Taubenschuss et al., 2006; Lamy et al., 2018), and has also been studied in the context of Jupiter (Prangé et al., 2004; Hess et al., 2012; Kita et al., 2019) or Uranus (Lamy et al., 2012), using modelled solar wind parameters when in-situ observations were not available. In the case of Saturn, the solar wind dynamic pressure has been identified as the main driver of enhanced SKR activity (Kaiser et al., 1980; Rucker, 1984). The effect of Interplanetary Coronal Mass Ejections (ICME) [see, e.g., Zurbuchen and Richardson (2006) for detailed descriptions of ICME properties] on SKR activity has never been described in detail, due to the lack of SKR observations at the time when an ICME impact can be clearly identified. In this study, we take advantage of a large ICME that reached Saturn in November 2014 (Witasse et al., 2017). The solar wind feature was tracked from the Sun up to Voyager 2 as well as simulated with the WSA-ENLIL + Cone model. A snapshot of this model at Saturn is shown in Figure 1. One of the major challenges for interpreting remote sensing observations is the lack of an upstream monitor to provide context for the observations and a quantitative measure of the solar wind driving conditions. However, for this rare example, the Cassini spacecraft was situated upstream of the bow shock, sampling the solar wind for a few days. Thus, it has been possible to use in situ data from the Cassini magnetometer (MAG) (Dougherty et al., 2004) and energetic particle instrument (MIMI) (Krimigis et al., 2004) to provide accurate timing for the ICME arrival. The ICME impacted Cassini on 12 November 2014. A survey of the RPWS data for the same period indicated a significant increase in the SKR emissions. This article reports on the correlation between this solar wind disturbance and SKR emissions.
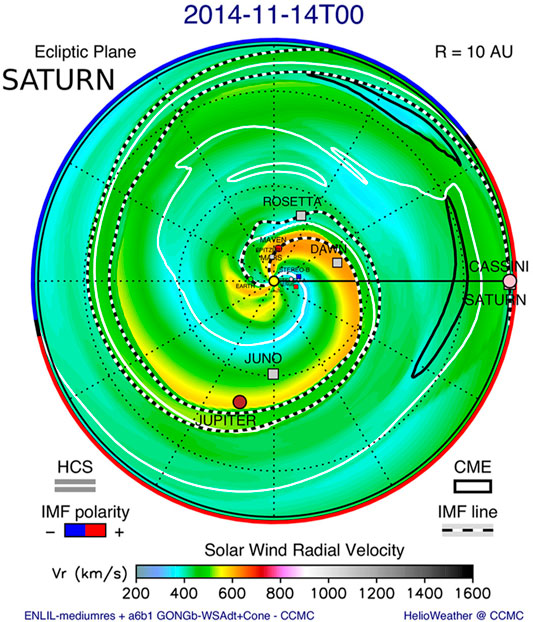
FIGURE 1. Solar wind velocity in the ecliptic plane from a WSA-ENLIL + Cone model simulation showing the ICME propagation at Saturn. The ICME is marked as a black contour on the right side before Saturn. Time is given in the format YYYY-MM-DDThh. The full simulation is available at (Witasse et al., 2017) and http://ccmc.gsfc.nasa.gov under run ID Leila_Mays_092716_SH_1.
In this study, we use several datasets from various instruments: radio frequency data from the High Frequency Receiver (HFR) of Cassini/RPWS (Gurnett et al., 2004); magnetic field data from the Cassini/MAG (Magnetometer) (Dougherty et al., 2004); and particle observations from Cassini/MIMI (Magnetosphere Imaging Instrument) (Krimigis et al., 2004). The trajectory data is provided by the CDPP (Centre de Données de la Physique des Plasmas) through their AMDA (Automated Multi-Dataset Analysis) and 3Dview tools (Génot et al., 2017; Génot et al., 2021).
The Cassini/RPWS/HFR instrument records radio electric signals from 3.5 kHz to 16 MHz, using three electric antennas. This instrument allows for reconstruction of the absolute flux density and polarization of the observed radio waves (Cecconi and Zarka, 2005). In this study, we make use of two datasets from HFR: 1) the Cassini/RPWS/HFR Level 3e (N3e) dataset (Cecconi et al., 2017), i.e., the “Circular Polarization Mode” goniopolarimetric inversion as described in Section 2.1.3.2 of Cecconi and Zarka (2005); and 2) the Cassini/RPWS/HFR SKR dataset (Lamy et al., 2009b) as described in Lamy et al.(2008).
The Cassini/MIMI instrument is designed for energetic neutral and charged particle detection. MIMI consists of three sensors of which we use the Low Energy Magnetospheric Measurement System (LEMMS) sensor (Krimigis et al., 2004). LEMMS is a charged particle telescope with two units separated by 180° in pointing that use solid state detectors and coincidence logic to determine the type of particle (electron or ion) and its energy, as well as magnetic deflection to better separate ions from low energy (≤800 keV) electrons (Roussos et al., 2018). In this study, we use data from the electron channels E4 with energy between 0.8 and 4.7 MeV, with a 1-h average window and non-background subtracted. This channel shows MeV electron with a background level modulated by penetrating GCRs (Galactic Cosmic Rays). It was used to identify the Forbush decrease as a clear identification of the ICME (see, Witasse et al., 2017). The LEMMS data are available at NASA/PDS (Vandegriff and Kusterer, 2018).
The data have been studied during a 30-day interval (2014-11-06 00:00:00 to 2014-12-06 00:00:00), that includes the predicted ICME arrival times at Saturn (see next sections). Figure 2 shows an overview of the magnetospheric configuration, using 3DView (Génot et al., 2017), and a dynamic magnetospheric model (Kanani et al., 2010) implemented in this tool. The input solar wind dynamic pressure is based on an MHD simulation propagation of OMNI data (Tao et al., 2005), and is described in the next section (and Figure 6). Figure 3 shows the Cassini trajectory together with two models: a magnetopause model (Arridge et al., 2006) and a bowshock model (Went et al., 2011), using a typical solar wind pressure of 0.05 nPa, which corresponds to an average solar wind dynamic pressure, intermediate between compressed and rarefied conditions. Those figures illustrate the geometrical configuration involved in this study: The Cassini spacecraft is outside of the Kronian magnetosphere at the beginning of the interval, on the Northern dawn side; it then travels in the solar wind, while moving along the morning flank of the magnetosphere; it reenters the equatorial magnetosphere in the late morning local time at the end of the interval.
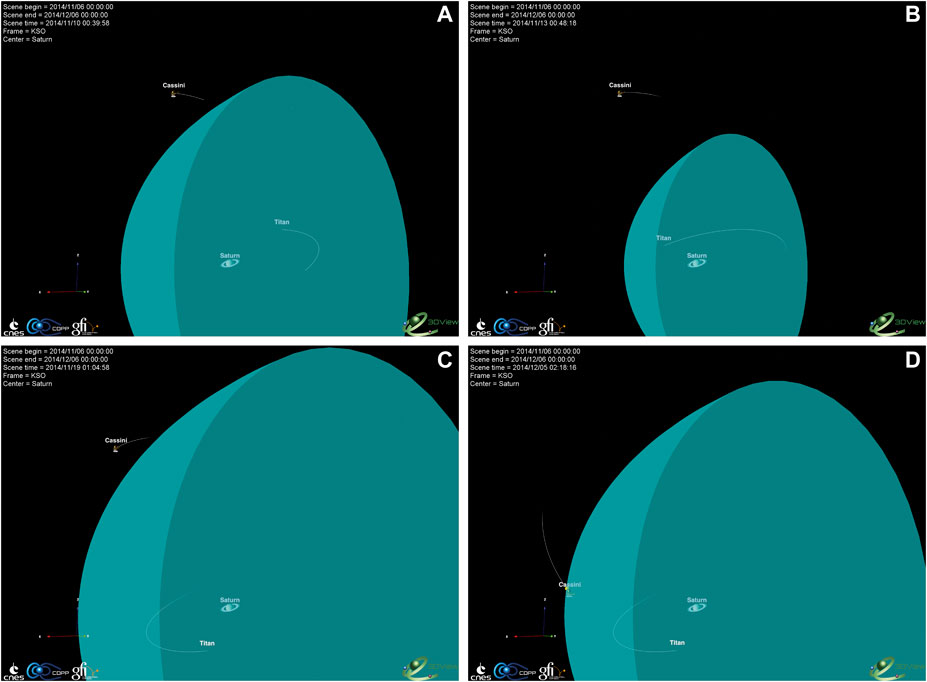
FIGURE 2. Cassini trajectory with Saturn’s Magnetopause model (Kanani et al., 2010). Snapshots from 3Dview, at 00:00 on days 2014-11-10, 2014-11-13, 2014-11-19 and 2014-12-05, from (A–D), respectively. On panel (D) a marker shows the modelled reentry into the magnetosphere.
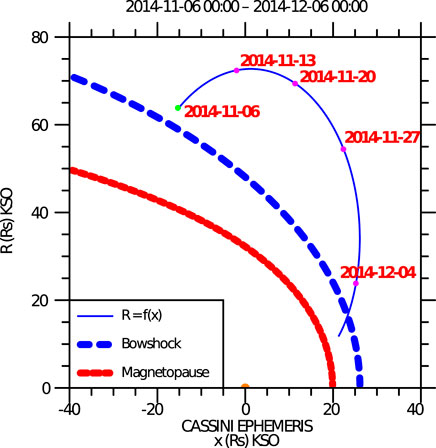
FIGURE 3. Overview of the Cassini spacecraft trajectory on KSO (Kronian Solar Orbital) coordinates, as provided by AMDA. The radial distance R is displayed as a function of xKSO, for the Cassini trajectory and models of the magnetopause and bowshock. The modelled boundaries have been computed with a solar wind dynamic pressure of 0.05 nPa. We expect this value to have increased significantly during the ICME passage, which might explain why the boundary positions shown here don’t necessarily reflect the observed position of the boundaries. The pink and green dots along the trajectory are the location of Cassini at the labelled dates, the green location being the starting point.
Figure 4 shows the radio electric and the in-situ particle and magnetic field observations for the selected 30 days. The flux density and circular polarization degree spectrograms, and the SKR integrated flux time series are showing an intense SKR activity episode, including LFEs, from Nov. 11th to 29th, 2014:
• Before Nov. 11th, 12:00: The SKR is present with moderate intensity, as expected for observations from early morning local time (<6h LT, see, e.g., Figure 4 of Lamy et al., 2009a).
• From Nov. 11th, 12:00 to Nov. 15th 00:00: A more intense SKR episode is observed, with a pair of intense outburst accompanied with LFEs on Nov. 13th at 12:00 and 19:30 (see Figures 5, 7). The LFE event is clear on the Integrated SKR Power panel, since the dashed line (wide-band integration, 10 kHz to 1 MHz) is significantly higher than the solid line (medium-band integration, 100–400 kHz). This is also visible on the upper panel, where strong continuous emissions are observed between 10 and 100 kHz.
• From Nov. 15th to Nov. 20th: An SKR dropout is observed, with an isolated burst around Nov. 17th 00:00.
• From Nov. 20th to Nov. 24th: Another intense SKR episode is observed with strong and long lasting LFEs (see Figures5, 8).
• From Nov. 24th to Nov. 29th: The LFE component is going on, with moderate intensity SKR bursts.
• From Nov. 29th to Dec. 1st: The SKR is dropping out and resumes to expected levels at the end of the interval.
• From Nov. 29th to the end of the studied interval: A periodic very low frequency signal (∼5 kHz) is observed, and mostly visible on the polarization panel. This feature corresponds to the 5 kHz Saturn narrow-band emission, so called n-SMR (Louarn et al., 2007) or n-SKR (Wang et al., 2010).
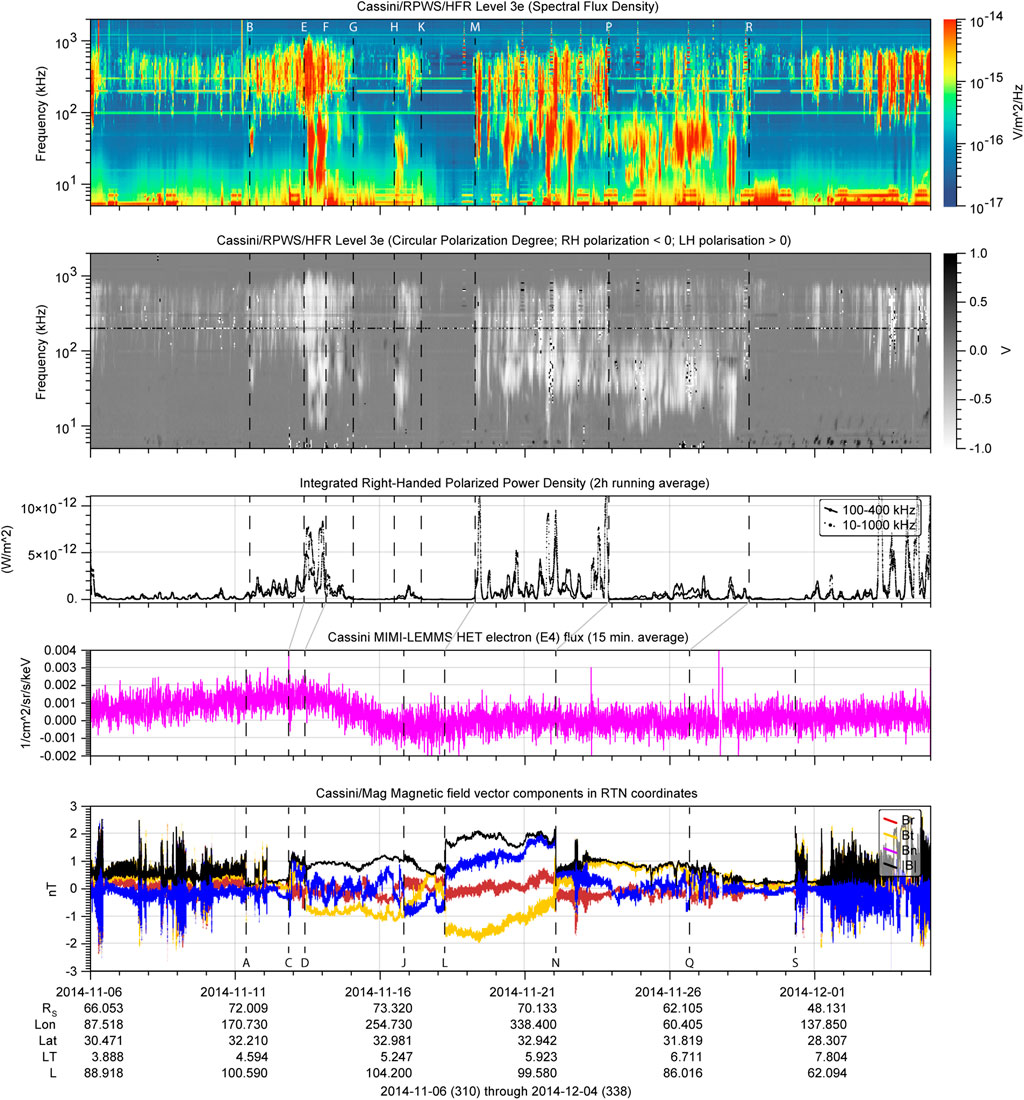
FIGURE 4. The from top to bottom: Radio electric flux density spectrogram; Radio electric circular polarization degree spectrogram; SKR integrated flux (plain line: 100–400 kHz range; dotted line: 10–1000 kHz range), with a 2 h running average; energetic particle fluxes for electrons (magenta line) in units of cm–2sr–1s–1keV–1; and magnetic field components in RTN coordinate system (Br in blue, Bt in orange, Bn in red, and
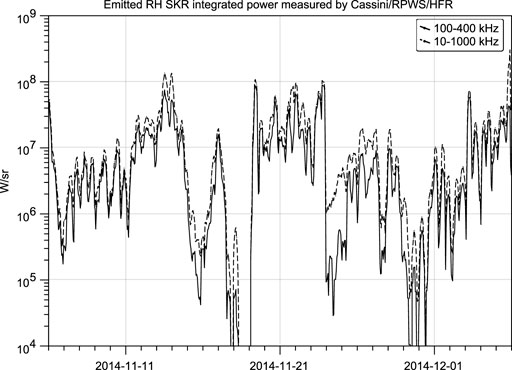
FIGURE 5. Right Handed polarized emitted SKR power integrated on 100–400 kHz (plain line) and 10–1000 kHz (dashed line), as measured by Cassini/RPWS/HFR. The data has been averaged over 15 min.
The SKR dropouts observed in the morning sector of the magnetosphere is unusual, since this is the main activity LT sector of SKR (Galopeau et al., 1995; Lamy et al., 2009a). Furthermore, one must keep in mind that the SKR modulation at or close to the planetary rotation period makes it difficult to accurately determine the actual onset of SKR events. The n-SMR feature observed at the end of the interval is typical of energetic magnetospheric events, as described in detail in Louarn et al. (2007). Their Figure 1 shows similar LFEs followed by n-SMR pulsed emissions. The in-situ data (magnetic field and particle) displays several characteristic signatures which will be described in Section 4.
The variability of the emitted SKR power (Lamy et al., 2008) is presented on Figure 5. The average usual SKR emitted power is of the order of 106 W/sr to 107 W/sr, and we observe SKR average power raising up to 107 W/sr, with peaks to 108 W/sr (i.e., one order of magnitude higher than regular levels). SKR emitted power drops down to 105 W/sr and even down to undetectable levels on day Nov. 18th, 2014, and on the last 2 days of Nov. 2014.
The propagated solar wind data available in AMDA are presented in Figure 6. This Figure shows the modelled solar wind density, temperature, radial velocity and dynamic pressure (panels (b) to (e)), using the 1D MHD model developed by Tao et al. (2005). Setting a threshold to 0.1 nPa, AMDA provides us with four time intervals of enhanced dynamic pressure, with peak values at about 0.15 nPa. The four intervals are shown in Table 1. The model is however not well constrained since the simulation is run with input parameters measured at Earth, which in Solar conjunction with Saturn at this time. This model shall thus only be used as an rough indication of the solar wind conditions.
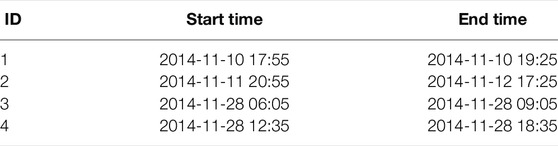
TABLE 1. AMDA derived dynamic pressure peaks (>0.1 nPa) as modelled by Tao et al. (2005). Times are given in the format YYYY-MM-DD hh:mm.
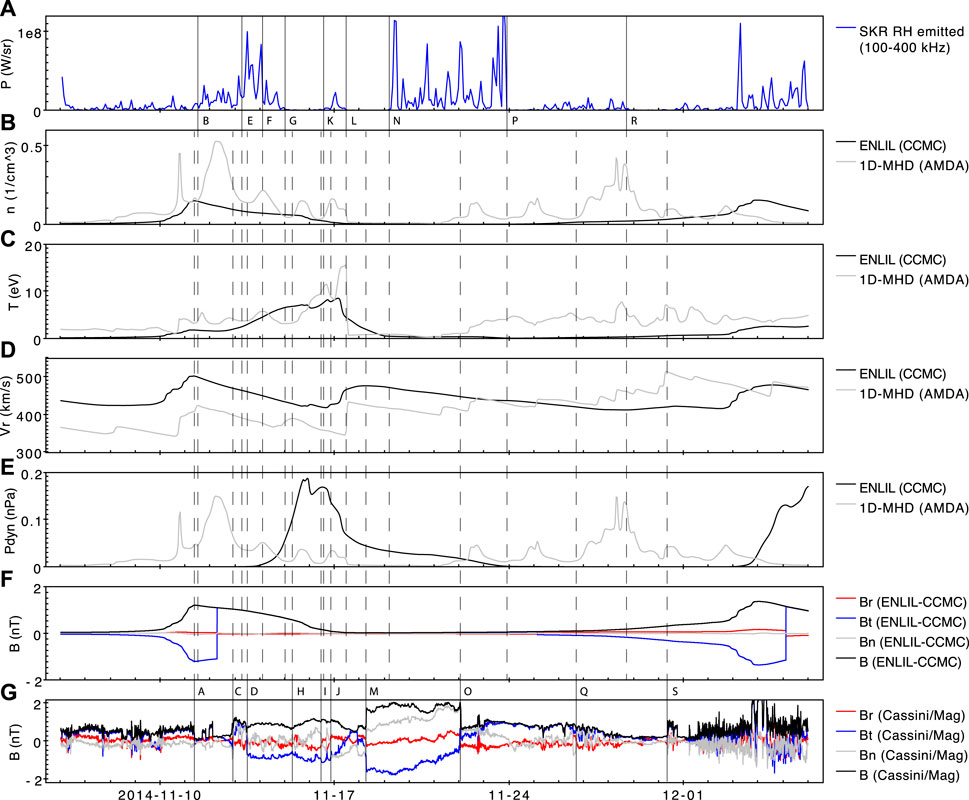
FIGURE 6. Comparison of the solar wind modelled parameters from the two selected propagation models. From top to bottom: (A) the SKR RH emitted powerdensity integrated over 100–400 kHz and smoothed to a temporal resolution of 6000 s; (B–E) the modelled solar wind density (in cm−3), temperature (in eV), radialvelocity (in km/s) and dynamic pressure (in nPa), as provided by the ENLIL code at CCMC (black) and 1D-MHD code at CDPP (grey); (F,G) the modelled (ENLIL) andmeasured (Cassini/Mag) solar wind magnetic field in RTN cooordinates (Br in red; Bt in blue; Bn in grey; B magnitude in black). The vertical lines and the capital letter markers are the same as in Figure 4 and described in Table 2. Times are given in the format YYYY-MM-DD.
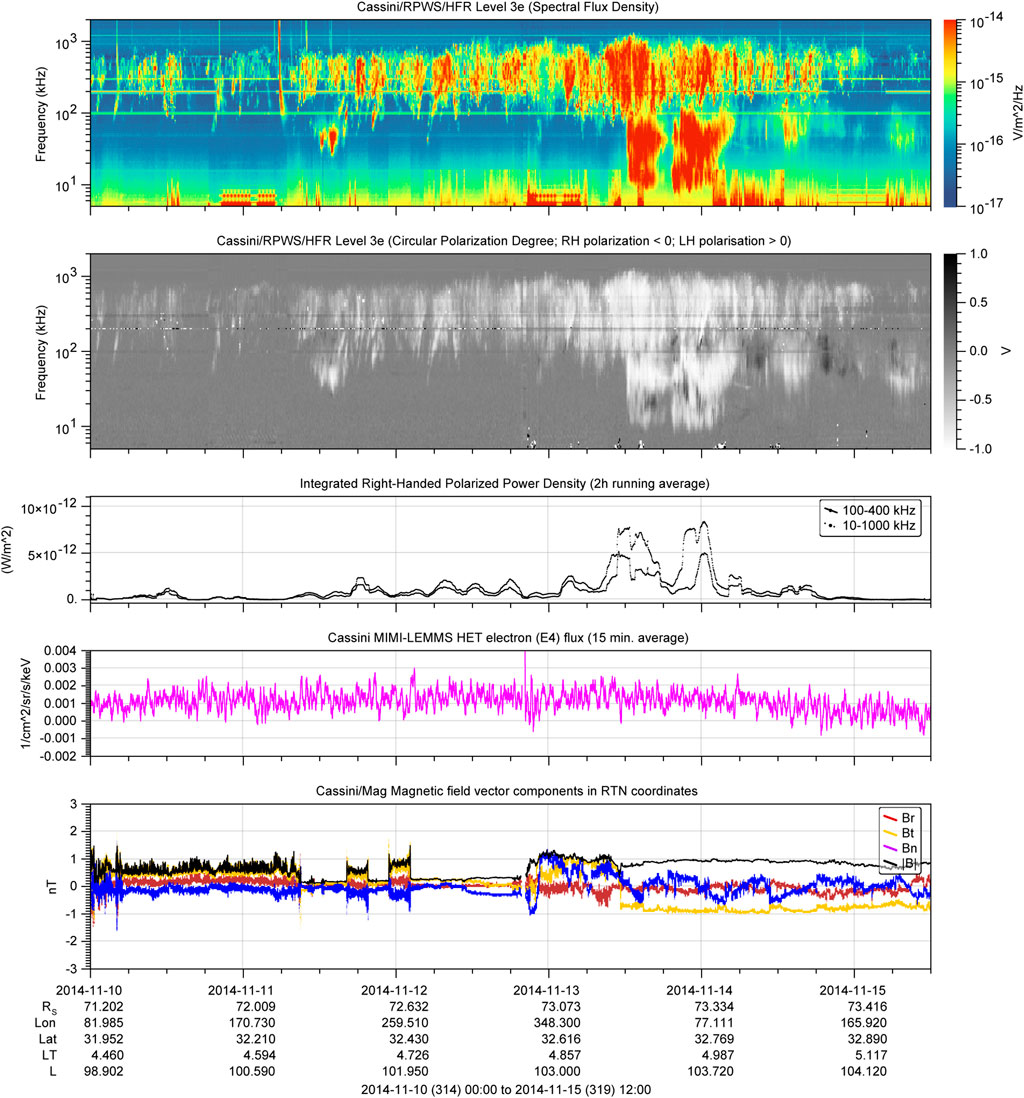
FIGURE 7. Zoomed-in version of Figure 4, from Nov. 10th 00:00 SCET to Nov. 15th, 12:00 SCET. The panel description is the same as for Figure 4. Times are given in the format YYYY-MM-DD, and hh:mm.
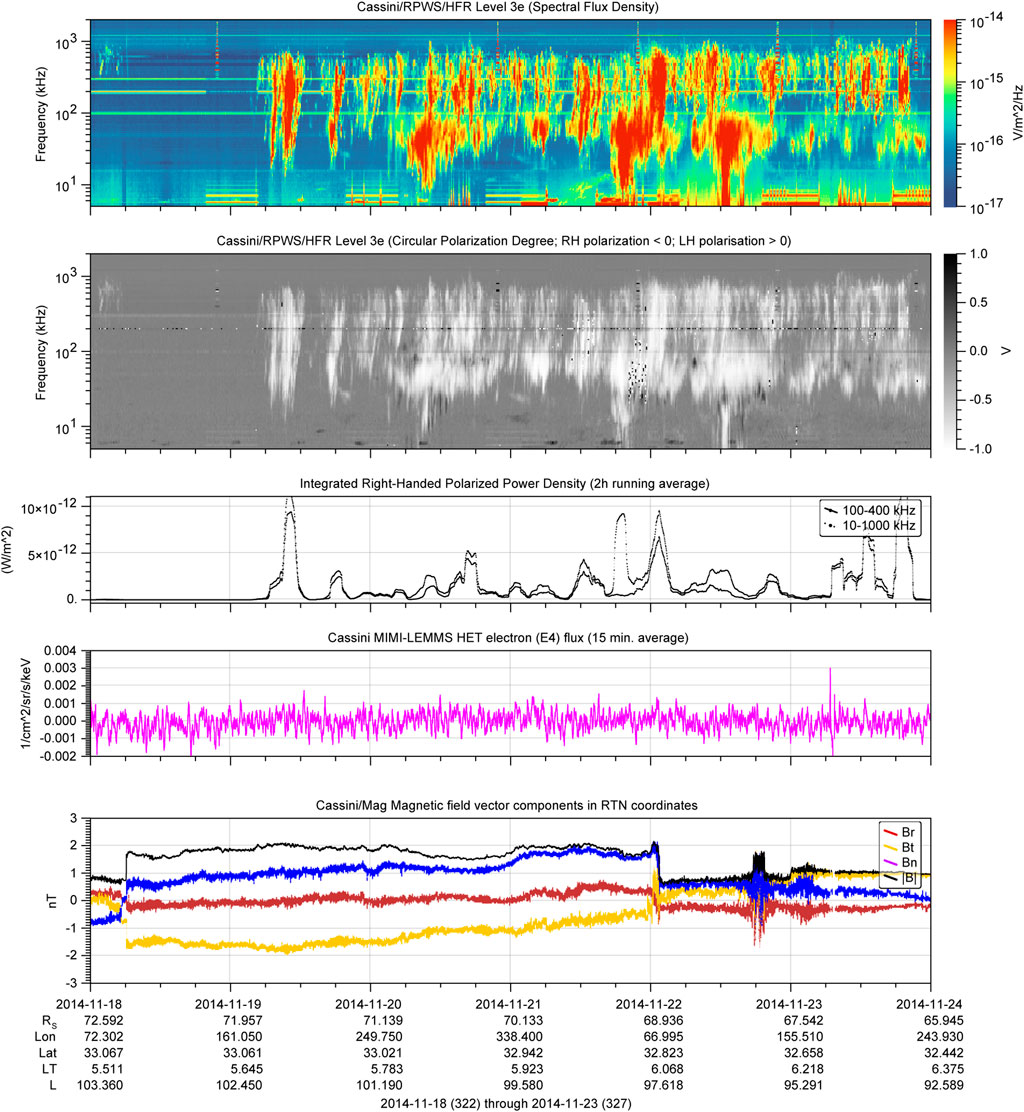
FIGURE 8. Zoomed-in version of Figure 4, from Nov. 18th 00:00 SCET to Nov. 24th 10:00 SCET. The panel description is the same as for Figure 4. Times are given in the format YYYY-MM-DD, and hh:mm.
Propagated solar wind data available at CCMC (Community Coordinated Modelling Center) are also presented in Figure 6. The simulation uses ENLIL, a 3D MHD modelling code (Odstrcil, 2003). The simulation run used here is Leila_Mays_092716_SH_11 (Witasse et al., 2017). The Figure presents the same solar wind parameters, as for the 1D-MHD model presented in the previous paragraph, as well as the modelled magnetic field components. The Figure shows a clear enhancement of dynamic pressure from Nov. 15th to Nov. 17th, with a peak value around 0.2 nPa. The ENLIL data also shows another similar event starting at the end of the time interval, on Dec 4th.
The two propagation models are predicting similar solar wind parameters values and trends (density, temperature and radial velocity) up to ∼Nov. 21st, with the noticeable exception of the dynamic pressure, which is showing different peak times depending on the model, as well as rather different overall variation all along the studied interval. The modelled magnetic field doesn’t reproduce the observed ICME structure. During the interval when Cassini exited into the solar wind (19 days, from labels A to S of Figure 4 and Table 2), it was possible to directly sample the interplanetary magnetic field. We can use this to compare against model predictions for the broader interval. The two models are predicting different arrival times of the ICME. The model developed by Tao et al. (2005) and available from the CDPP is about 5 days earlier compared to the ENLIL simulation run output from CCMC. Due to the Solar System orbital configuration, the ENLIL simulation run should be more accurate. Indeed, the ENLIL simulation predicts the arrival of the ICME at 12:00 UT on 15 November, about 2.5 days after the real hit. This is a rather accurate estimation given the distance of Saturn with respect to the Sun and the limitations of the simulation at these distances (Witasse et al., 2017).
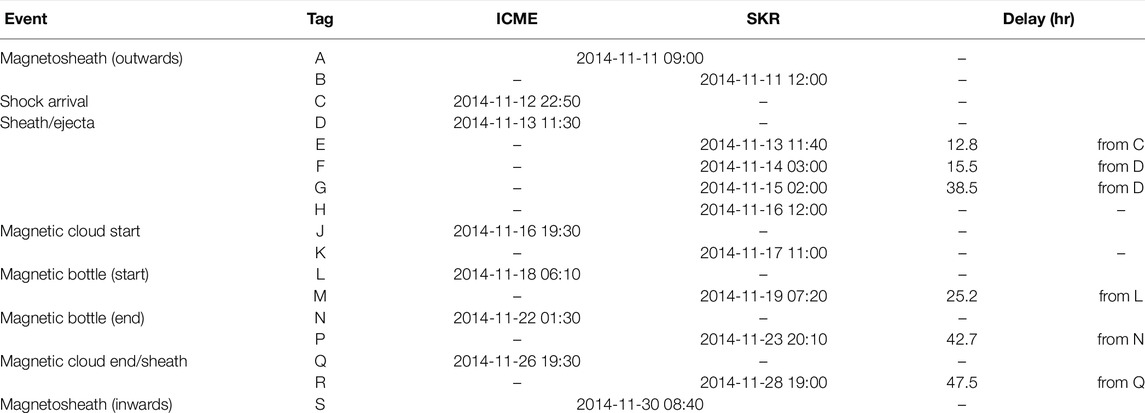
TABLE 2. Timings of the major signatures of the ICME and SKR. The first column are the tags shown on Figure 4. Times are given in the format YYYY-MM-DD hh:mm.
In order to correlate and interpret the variations of the SKR emissions, it is necessary to characterise the ICME event. This ICME erupted from the Solar Active Region 12192 on 14 October 2014 at ∼18:30 UT as seen by the SOlar and Heliospheric Observatory (SOHO), the Project for On Board Autonomy 2 (PROBA-2), the Solar Dynamics Observatory (SDO), and the Solar TErrestrial RElations Observatory Ahead (STEREO-A) missions. On its transit to the outer Solar System, the ICME encountered Venus, STEREO-A, Mars, comet 67P/Churyumov-Gerasimenko, Saturn, possibly New Horizons on its way to Pluto and Voyager-2 at the heliosheath as discussed in detail by Witasse et al. (2017). The propagation of this event was also modelled with two different solar wind simulations: 1) the CDPP Propagation Tool, and 2) the Wang-Sheeley-Arge (WSA)-ENLIL + Cone model. For this latter case and based on the Graduated Cylindrical Shell (GCS) fit performed to the coronagraph observations from STEREO-A and SOHO, the CME was injected into the simulation using inputs of 1015 km/s for radial speed, 150° for longitude, 12° for latitude and a full width of 116°. For the ICME propagation out to Saturn, a medium resolution (2°) simulation was performed on a HEEQ spherical grid of 1920 × 60×180 (r, θ, ϕ), with a range of 0.1–10.1 AU in radius (r), −60° to +60° in latitude (θ), and −180° to +180° in longitude (ϕ). In addition to the CME of this study, the simulation also included 138 CMEs with speeds above 500 km/s and full angular widths above 50°. This was necessary in order to get the most accurate estimation of the arrival time of the ICME to Saturn since most CMEs merge with the background solar wind at largest distances (see, e.g., Hanlon et al., 2004). Figure 1 shows a snapshot of the propagation of this ICME just before its arrival at Saturn (the ICME is outlined in black), and Figure 6 shows the derived solar wind density, velocity and temperature profiles obtained from the simulation at Saturn. The ICME arrived at Saturn approximately 1 month after its ejection at the Sun as observed by Cassini, which was immersed in the solar wind at this time.
Although there were no in-situ plasma measurements of the ICME and the background solar wind speeds, values of 500 and 400 km/s, respectively can be estimated from Witasse et al. (2017). This estimation is consistent with the modelled solar wind velocity presented on Figure 6.
Table 2 gives a summary of the timing of the different regions of the ICME at Cassini as well as the corresponding SKR enhancements. In particular, the shock of the ICME is seen as a significant increase of the interplanetary magnetic field strength from 0.3 to 1.2 nT. It is followed by the sheath/ejecta, where a clear rotation of the By component is seen. After that, there is the magnetic cloud that is clearly identified with a rotation of the magnetic field Bz component, with the addition that this event has a “magnetic bottle” structure which is identified as the region where the magnetic field strength is at its largest value (1.6–2 nT). The internal structure of a magnetic bottle is comprised of helical, twisted magnetic field lines, which present as a local intensification of the field strength when traversed by a spacecraft.
It is noticeable that the enhanced activity of the SKR starts with the arrival of the first event in the ENLIL simulation, during the enhanced solar wind density event, before the peak dynamic pressure. The isolated SKR burst emission on Nov. 17th corresponds to the peak of dynamic pressure predicted by the ENLIL simulation run. The rise of SKR activity at the end of the interval also corresponds to a period of enhanced density and dynamic pressure in the ENLIL simulation.
The SKR variability observed during the month of Nov. 2014 is closely related to the ICME events, with observed delays of ∼ 20 h between SKR and solar wind events. We observe that the integrated power (over 100–400 kHz, i.e, the core of the SKR band, as well as over the 10–1000 kHz, i.e., the extended SKR band) increase by 1 order of magnitude. We also observe SKR dropouts at undetectable levels. With the assumption of a direct control of the SKR intensity by the solar wind dynamic pressure (Kaiser et al., 1980), such low SKR level conditions are indicating significant expansion of the Kronian magnetosphere (or, equivalently, a strong depletion of the solar wind). It is noticeable that these trends are very similar as the event presented in Figure 1 of Jackman et al. (2005). Desch and Rucker (1983) reported the disappearance of SKR when Saturn is in Jupiter’s magnetotail, hence in a depleted plasma environment.
The spacecraft is located on the dawn side of the magnetosphere (∼0700 h LT) throughout this interval. It is expected due to the location of radio sources and the hollow cone beaming pattern of the SKR that radio emissions in the main SKR band should maximise around this viewing location (Lamy et al., 2008). Indeed, Figure 4 displays continuous SKR modulations around Nov. 11th 2014, as expected from this vantage point. The SKR modulation breakouts, as well as SKR peaks and dropouts are thus related to a specific set of events, responding to the dynamics, rather than an effect of limited viewing due to spatial constraints.
The intensification in the main band of SKR is accompanied by an extension of the emission to lower frequencies (LFE), similarly to what is observed in the case of a CIR compressions impacting the Kronian magnetosphere, as investigated in detail by Jackman et al. (2005). This strong, continuous extension of emission is interpreted as a growth/expansion of the radio source to higher altitudes along the field line, with the lower field strength correlated to lower frequency emission (due to the CMI generation mechanism).
We observe an enhancement of SKR intensity after in-situ events with delays ranging from ∼13 h after the shock arrival, to ∼25 h at the start of the magnetic bottle, and to ∼44 h near the end of the event. The uncertainty on the delays shall be evaluated taking into account the SKR modulation at or close to the planetary rotation period, i.e., ∼10.5 h (Lamy, 2010). Considering a typical SKR burst duration of ∼5.2 h (half the planetary rotation period), the uncertainty is asymmetric: from about −5.2 h (if the event occurs during the low SKR level modulation phase) to 0 h (if the event occurs during the high SKR level modulation phase). This implies that delays can be overestimated by a few hours. Our findings on delays between in-situ and radio events are fully consistent with the study of Taubenschuss et al. (2006), where delays between solar wind and SKR events have been derived using statistical methods. This previous study identified delays ranging from ∼13 h for dynamic pressure enhancement, to ∼27 h to ∼44 h for magnetic field events. The observed delays can be expressed in units of the average planetary rotation period: 13, 25 and 44 h correspond respectively to 1.2, 2.4 and 4.2 planetary rotation periods with an uncertainty of −0.5/+ 0 planetary rotation. Jackman et al. (2005) reported delays of about 40 h. Rucker (1984) reported delays of a few planetary rotation, with a maximum correlation at about 4 planetary rotations. Interestingly, Figure 6 of Rucker (1984) shows a superposed-epoch analysis of SKR peaks with various solar wind parameters: a statistical delay of a few planetary rotations is observed (the figure is too small to get a better estimate). This suggests that the delay in the response of SKR to solar wind variability is always present. In the general case, the SKR periodic variability makes it difficult to evaluate the delays. However, since the event studied here triggers a drastic change in SKR properties, the delay can be estimated directly.
Such long delays are still not understood. Jackman et al. (2013) reported substorm-like event in Saturn’s magnetotail at a distance of ∼45 Rs. With the modelled solar wind velocity (400–500 km/s, see Figure 6), the solar wind event is reaching this distance after a few hours at most. The observed delays are thus inconsistent with a direct control by the solar wind. The variability of SKR is modulated by several factors: an active local sector (Galopeau et al., 1995), which location is driven by the solar wind velocity (Galopeau and Lecacheux, 2000) and the rotating magnetospheric plasma [see, e.g., Lamy et al. (2013), which describes in detail the relation between the magnetospheric plasma rotation (observed with an energetic neutral atoms imager) and the auroral activity (observed at radio, infrared and ultraviolet spectral ranges)]. As shown in that latter study, the dynamics and the transport of plasma in the magnetosphere are key drivers of the auroral variability.
According to the CMI mechanism, several parameters can play a role in the enhancement or damping of radio emissions: the growth rate is related to the presence of free energy (unstable particle distribution functions, such as energetic beams, loss cone or shell distributions), as well as a locally depleted and magnetized cold plasma. SKR bursts and dropouts are observed during the event studied here. This indicates a radical reconfiguration of the magnetosphere, resulting in a change of the plasma properties in the radio source regions (i.e., along the auroral magnetic field lines). Understanding the magnetospheric response to intense solar wind events requires global and dynamical modelling of Saturn’s magnetosphere at scales of a few planetary rotations.
Thanks to the specific orbital configuration during the event, we have been able to observe simultaneously the ICME in the solar wind upstream from Saturn, as well as the SKR response. This study is thus very complementary to other studies [see, e.g.,Palmerio et al. (2021)] using only modelled data to identify the event arrival times at Saturn. The shock arrival time derived from the data is estimated to 2014-11-12 22:50. The 1D-MHD modelled data (Tao et al., 2005) predicts a first dynamic pressure pulse starting at 2014-11-10 17:55, and a second, longer one, at 2014-11-11 20:55. The ENLIL model (Odstrcil, 2003) predicts a peaked solar wind density on 2014-11-11 and a peaked dynamic pressure on 2014-11-15. In terms of time of arrival estimations, our observational data seem to favor the 1D-MHD modelling available in AMDA provides, compared to the ENLIL code available at CCMC. However, it is clear that current solar wind modelling tools are not providing solar wind parameters with sufficient timing accuracy for detailed comparison with in-situ measurement at the distance of Saturn.
The datasets analyzed for this study and their location have been described the Section 2. Scripts allowing to reproduce the figures of this article are available (Cecconi et al., 2021) and accessible at: https://doi.org/10.25935/dzrb-p221.
BC performed writing, conceptualization, data gathering, figure editing. OW, CMJ, and BS-C performed conceptualization, writing—reviewing and editing. MLM provided CCMC data.
BC acknowledges support from Observatoire de Paris, CNRS/INSU (Centre National de la Recherche Scientifique/Institut des Sciences de l’Univers) and CNES (Centre National d’Etudes Spatiales). OW was supported by ESA (European Space Agency). CMJ’s work at DIAS was supported by the Science Foundation Ireland Grant 18/FRL/6199. BS-C acknowledges support through UK-STFC Ernest Rutherford Fellowship ST/V004115/1 and STFC grants ST/S000429/1, ST/W00089X/1.
The authors declare that the research was conducted in the absence of any commercial or financial relationships that could be construed as a potential conflict of interest.
All claims expressed in this article are solely those of the authors and do not necessarily represent those of their affiliated organizations or those of the publisher, the editors, and the reviewers. Any product that may be evaluated in this article, or claim that may be made by its manufacturer, is not guaranteed or endorsed by the publisher.
The authors thank the developers of: AMDA (Automated Multidataset Analysis Tool) and 3Dview at CDPP (Centre de Données de la Physique des Plasmas); Autoplot at University of Iowa; and TOPCAT (Tools for Operations on Catalogues and Tables) at Bristol. Figures 4, 5, 7, 8 have been produced with Autoplot (Faden et al., 2010). The Cassini/RPWS data displayed on the figures have been retrieved from PADC (Paris Astronomical Data Centre) using the das2 (Piker, 2017) interfaces of the MASER (Measurements, Analysis, and Simulation of Emission in the Radio range) team (Cecconi et al., 2020). The Cassini/MAG is distributed by University of Iowa, also through a das2 interface. Figure 6 have produced with TOPCAT (Taylor, 2005), after conversion of the ENLIL original tabular data into VOTable (Ochsenbein et al., 2019), and transferring the other datasets from AMDA (Génot et al., 2010; Génot et al., 2021) using SAMP (Simple Application Messaging Protocol) (Génot et al., 2014; Taylor et al., 2015). The authors thank the two reviewers for their helpful comments, as well as L. Lamy and V. Génot, who sent valuable comments based on the initial manuscript version published on ArXiv.org.
1Available at: https://ccmc.gsfc.nasa.gov/database_SH/Leila_Mays_092716_SH_1.php
Arridge, C. S., Achilleos, N., Dougherty, M. K., Khurana, K. K., and Russell, C. T. (2006). Modeling the Size and Shape of Saturn's Magnetopause with Variable Dynamic Pressure. J. Geophys. Res. 111, A11227. doi:10.1029/2005JA011574
Badman, S. V., Cowley, S. W. H., Lamy, L., Cecconi, B., and Zarka, P. (2008). Relationship between Solar Wind Corotating Interaction Regions and the Phasing and Intensity of Saturn Kilometric Radiation Bursts. Ann. Geophys. 26, 3641–3651. doi:10.5194/angeo-26-3641-2008
Bunce, E. J., Cowley, S. W. H., Wright, D. M., Coates, A. J., Dougherty, M. K., Krupp, N., et al. (2005). In Situ observations of a Solar Wind Compression-Induced Hot Plasma Injection in Saturn's Tail. Geophys. Res. Lett. 32, L20S04. doi:10.1029/2005GL022888
Cecconi, B., Lamy, L., and Zarka, P. (2017). Cassini/RPWS/HFR N3e Data Collection. PADC/MASER. doi:10.25935/9ZAB-FP47
Cecconi, B., Loh, A., Le Sidaner, P., Savalle, R., Bonnin, X., Nguyen, Q. N., et al. (2020). MASER: A Science Ready Toolbox for Low Frequency Radio Astronomy. Data Sci. J. 19, 1062. doi:10.5334/dsj-2020-012
Cecconi, B., Witasse, O., Jackman, C., Sánchez-Cano, B., and Mays, M. (2021). Effect of an Interplanetary Coronal Mass Ejection on Saturn’s Radio Emission. Supplementary material (Version 1.0), PADC/MASER. doi:10.25935/dzrb-p221
Cecconi, B., and Zarka, P. (2005). Direction Finding and Antenna Calibration through Analytical Inversion of Radio Measurements Performed Using a System of Two or Three Electric Dipole Antennas on a Three-Axis Stabilized Spacecraft. Radio Sci. 40, RS3003. doi:10.1029/2004RS003070
Crary, F. J., Clarke, J. T., Dougherty, M. K., Hanlon, P. G., Hansen, K. C., Steinberg, J. T., et al. (2005). Solar Wind Dynamic Pressure and Electric Field as the Main Factors Controlling Saturn's Aurorae. Nature 433, 720–722. doi:10.1038/nature03333
Desch, M. D. (1982). Evidence for Solar Wind Control of Saturn Radio Emission. J. Geophys. Res. 87, 4549–4554. doi:10.1029/JA087iA06p04549
Desch, M. D. (1983). Radio Emission Signature of Saturn Immersions in Jupiter's Magnetic Tail. J. Geophys. Res. 88, 6904–6910. doi:10.1029/JA088iA09p06904
Desch, M. D., and Rucker, H. O. (1983). The Relationship between Saturn Kilometric Radiation and the Solar Wind. J. Geophys. Res. 88, 8999–9006. doi:10.1029/JA088iA11p08999
Dougherty, M. K., Kellock, S., Southwood, D. J., Balogh, A., Smith, E. J., Tsurutani, B. T., et al. (2004). The Cassini Magnetic Field Investigation. Space Sci. Rev. 114, 331–383. doi:10.1007/s11214-004-1432-2
Faden, J. B., Weigel, R. S., Merka, J., and Friedel, R. H. W. (2010). Autoplot: a Browser for Scientific Data on the Web. Earth Sci. Inform. 3, 41–49. doi:10.1007/s12145-010-0049-0
Galopeau, P. H. M., and Lecacheux, A. (2000). Variations of Saturn's Radio Rotation Period Measured at Kilometer Wavelengths. J. Geophys. Res. 105, 13089–13101. doi:10.1029/1999ja005089
Galopeau, P. H. M., Zarka, P., and Le Quéau, D. (1995). Source Location of Saturn's Kilometric Radiation: The Kelvin-Helmholtz Instability Hypothesis. J. Geophys. Res. 100, 26397–26410. doi:10.1029/95JE02132
Génot, V., André, N., Cecconi, B., Bouchemit, M., Budnik, E., Bourrel, N., et al. (2014). Joining the Yellow Hub: Uses of the Simple Application Messaging Protocol in Space Physics Analysis Tools. Astron. Comput. 7-8, 62–70. doi:10.1016/j.ascom.2014.07.007
Génot, V., Beigbeder, L., Popescu, D., Dufourg, N., Gangloff, M., Bouchemit, M., et al. (2017). Science Data Visualization in Planetary and Heliospheric Contexts with 3DView. Planet. Space Sci. 150, 111–130. doi:10.1016/j.pss.2017.07.007
Génot, V., Budnik, E., Jacquey, C., Bouchemit, M., Renard, B., Dufourg, N., et al. (2021). Automated Multi-Dataset Analysis (AMDA): An On-Line Database and Analysis Tool for Heliospheric and Planetary Plasma Data. Planet. Space Sci. 201, 105214. doi:10.1016/j.pss.2021.105214
Génot, V., Jacquey, C., Bouchemit, M., Gangloff, M., Fedorov, A., Lavraud, B., et al. (2010). Space Weather Applications with CDPP/AMDA. Adv. Space Res. 45, 1145–1155. doi:10.1029/2005JA011574
Gurnett, D. A., Kurth, W. S., Kirchner, D. L., Hospodarsky, G. B., Averkamp, T. F., Zarka, P., et al. (2004). The Cassini Radio and Plasma Wave Investigation. Space Sci. Rev. 114, 395–463. doi:10.1007/s11214-004-1434-0
Hanlon, P. G., Dougherty, M. K., Forsyth, R. J., Owens, M. J., Hansen, K. C., Tóth, G., et al. (2004). On the Evolution of the Solar Wind between 1 and 5 AU at the Time of the Cassini Jupiter Flyby: Multispacecraft Observations of Interplanetary Coronal Mass Ejections Including the Formation of a Merged Interaction Region. J. Geophys. Res. 109, A09S03. doi:10.1029/2003JA010112
Hess, S. L. G., Echer, E., and Zarka, P. (2012). Solar Wind Pressure Effects on Jupiter Decametric Radio Emissions Independent of Io. Planet. Space Sci. 70, 114–125. doi:10.1016/j.pss.2012.05.011
Jackman, C. M., Achilleos, N., Bunce, E., Cecconi, B., Clarke, J., Cowley, S. W. H., et al. (2005). Interplanetary Conditions and Magnetospheric Dynamics during the Cassini Orbit Insertion Fly-Through of Saturn's Magnetosphere. J. Geophys. Res. 110, A10212. doi:10.1029/2005JA011054
Jackman, C. M., Achilleos, N., Cowley, S. W. H., Bunce, E. J., Radioti, A., Grodent, D., et al. (2013). Auroral Counterpart of Magnetic Field Dipolarizations in Saturn's Tail. Planet. Space Sci. 82-83, 34–42. doi:10.1016/j.pss.2013.03.010
Jackman, C. M., Lamy, L., Freeman, M. P., Zarka, P., Cecconi, B., Kurth, W. S., et al. (2009). On the Character and Distribution of Lower-Frequency Radio Emissions at Saturn and Their Relationship to Substorm-Like Events. J. Geophys. Res. 114, A08211. doi:10.1029/2008JA013997
Kaiser, M. L., Desch, M. D., Warwick, J. W., and Pearce, J. B. (1980). Voyager Detection of Nonthermal Radio Emission from Saturn. Science 209, 1238–1240. doi:10.1126/science.209.4462.1238
Kanani, S. J., Arridge, C. S., Jones, G. H., Fazakerley, A. N., McAndrews, H. J., Sergis, N., et al. (2010). A New Form of Saturn's Magnetopause Using a Dynamic Pressure Balance Model, Based on In Situ, Multi-Instrument Cassini Measurements. J. Geophys. Res. 115, A06207. doi:10.1029/2009JA014262
Kita, H., Kimura, T., Tao, C., Tsuchiya, F., Murakami, G., Yamazaki, A., et al. (2019). Jovian UV Aurora's Response to the Solar Wind: Hisaki EXCEED and Juno Observations. J. Geophys. Res. Space Phys. 124, 10209–10218. doi:10.1029/2019ja026997
Krimigis, S. M., Mitchell, D. G., Hamilton, D. C., Livi, S., Dandouras, J., Jaskulek, S., et al. (2004). Magnetosphere Imaging Instrument (MIMI) on the Cassini Mission to Saturn/Titan. Space Sci. Rev. 114, 233–329. doi:10.1007/s11214-004-1410-8
Kurth, W. S., Hospodarsky, G. B., Gurnett, D. A., Lamy, L., Dougherty, M. K., Nichols, J., et al. (2016). Saturn Kilometric Radiation Intensities during the Saturn Auroral Campaign of 2013. Icarus 263, 2–9. doi:10.1016/j.icarus.2015.01.003
Lamy, L., Cecconi, B., Prangé, R., Zarka, P., Nichols, J. D., and Clarke, J. T. (2009a). An Auroral Oval at the Footprint of Saturn's Kilometric Radio Sources, Colocated with the UV Aurorae. J. Geophys. Res. 114, A10212. doi:10.1029/2009JA014401
Lamy, L., Cecconi, B., and Zarka, P. (2009b). Cassini/RPWS/HFR SKR Data Collection. PADC/MASER. doi:10.25935/ZKXB-6C84
Lamy, L., Prangé, R., Hansen, K. C., Clarke, J. T., Zarka, P., Cecconi, B., et al. (2012). Earth-Based Detection of Uranus' Aurorae. Geophys. Res. Lett. 39, L07105. doi:10.1029/2012GL051312
Lamy, L., Prangé, R., Pryor, W., Gustin, J., Badman, S. V., Melin, H., et al. (2013). Multispectral Simultaneous Diagnosis of Saturn's Aurorae throughout a Planetary Rotation. J. Geophys. Res. Space Phys. 118, 4817–4843. doi:10.1002/jgra.50404
Lamy, L., Prangé, R., Tao, C., Kim, T., Badman, S. V., Zarka, P., et al. (2018). Saturn's Northern Aurorae at Solstice from HST Observations Coordinated with Cassini's Grand Finale. Geophys. Res. Lett. 45, 9353–9362. doi:10.1029/2018GL078211
Lamy, L., Schippers, P., Zarka, P., Cecconi, B., Arridge, C. S., Dougherty, M. K., et al. (2010). Properties of Saturn Kilometric Radiation Measured within its Source Region. Geophys. Res. Lett. 37, L12104. doi:10.1029/2010GL043415
Lamy, L. (2010). Variability of Southern and Northern Skr Periodicities. PRE 7, 39–50. doi:10.1553/PRE7s39
Lamy, L., Zarka, P., Cecconi, B., Prangé, R., Kurth, W. S., and Gurnett, D. A. (2008). Saturn Kilometric Radiation: Average and Statistical Properties. J. Geophys. Res. 113, A07201. doi:10.1029/2007JA012900
Louarn, P., Kurth, W. S., Gurnett, D. A., Hospodarsky, G. B., Persoon, A. M., cecconi, B., et al. (2007). Observation of Similar Radio Signatures at Saturn and Jupiter: Implications for the Magnetospheric Dynamics. Geophys. Res. Lett. 34, L20113. doi:10.1029/2007GL030368
Ochsenbein, F., Williams, R., Davenhall, C., Demleitner, M., Donaldson, T., Durand, D., et al. (2019). VOTable Format Definition. IVOA Recommendation, IVOA. doi:10.25504/FAIRsharing.g2ChgH
Odstrcil, D. (2003). Modeling 3-d Solar Wind Structure. Adv. Space Res. 32, 497–506. doi:10.1016/s0273-1177(03)00332-6
Palmerio, E., Nieves‐Chinchilla, T., Kilpua, E. K. J., Barnes, D., Zhukov, A. N., Jian, L. K., et al. (2021). Magnetic Structure and Propagation of Two Interacting CMEs from the Sun to Saturn. JGR Space Phys. 126, 1–45. doi:10.1029/2021JA029770
Prangé, R., Pallier, L., Hansen, K. C., Howard, R., Vourlidas, A., Courtin, R., et al. (2004). An Interplanetary Shock Traced by Planetary Auroral Storms from the Sun to Saturn. Nature 432, 78–81. doi:10.1038/nature02986
Reed, J. J., Jackman, C. M., Lamy, L., Kurth, W. S., and Whiter, D. K. (2018). Low‐Frequency Extensions of the Saturn Kilometric Radiation as a Proxy for Magnetospheric Dynamics. J. Geophys. Res. Space Phys. 123, 443–463. doi:10.1002/2017JA024499
Roussos, E., Jackman, C. M., Thomsen, M. F., Kurth, W. S., Badman, S. V., Paranicas, C., et al. (2018). Solar Energetic Particles (SEP) and Galactic Cosmic Rays (GCR) as Tracers of Solar Wind Conditions Near Saturn: Event Lists and Applications. Icarus 300, 47–71. doi:10.1016/j.icarus.2017.08.040
Rucker, H. O. (1984). External Control of Saturn Kilometric Radiation: Voyager 1 and 2 Studies. Planet. Radio Emissions 1 (1), 143–160.
Tao, C., Kataoka, R., Fukunishi, H., Takahashi, Y., and Yokoyama, T. (2005). Magnetic Field Variations in the Jovian Magnetotail Induced by Solar Wind Dynamic Pressure Enhancements. J. Geophys. Res. 110, A11208. doi:10.1029/2004JA010959
Taubenschuss, U., Rucker, H. O., Kurth, W. S., Cecconi, B., Zarka, P., Dougherty, M. K., et al. (2006). Linear Prediction Studies for Solar Wind and Saturn Kilometric Radiation. Ann. Geophys. 24, 3139–3150. doi:10.5194/angeo-24-3139-2006
Taylor, M. B., Boch, T., and Taylor, J. (2015). SAMP, the Simple Application Messaging Protocol: Letting Applications Talk to Each Other. Astron. Comput. 11, 81–90. doi:10.1016/j.ascom.2014.12.007
Taylor, M. B. (2005). TOPCAT & STIL: Starlink Table/VOTable Processing Software. ASP Conf. Ser. 346, 29–33.
Vandegriff, J., and Kusterer, M. B. (2018). Cassini Saturn Mimi Lemms Calibrated Data Archive, Co-S-Mimi-4-Lemms-Calib-V1.0. NASA Planetary Data System. doi:10.17189/1519608
Wang, Z., Gurnett, D. A., Fischer, G., Ye, S.-Y., Kurth, W. S., Mitchell, D. G., et al. (2010). Cassini Observations of Narrowband Radio Emissions in Saturn's Magnetosphere. J. Geophys. Res. 115, A06213. doi:10.1029/2009JA014847
Warwick, J. W., Pearce, J. B., Peltzer, R. G., and Riddle, A. C. (1977). Planetary Radio Astronomy experiment for Voyager Missions. Space Sci. Rev. 21, 309. doi:10.1007/BF00211544
Went, D. R., Hospodarsky, G. B., Masters, A., Hansen, K. C., and Dougherty, M. K. (2011). A New Semiempirical Model of Saturn's bow Shock Based on Propagated Solar Wind Parameters. J. Geophys. Res. 116, A07202. doi:10.1029/2010JA016349
Witasse, O., Sánchez-Cano, B., Mays, M. L., Kajdič, P., Opgenoorth, H., Elliott, H. A., et al. (2017). Interplanetary coronal mass ejection observed at STEREO-A, Mars, Comet 67P/Churyumov-Gerasimenko, Saturn, and New Horizons en route to Pluto: Comparison of its Forbush decreases at 1.4, 3.1, and 9.9 AU. J. Geophys. Res. Space Phys. 122, 7865–7890. doi:10.1002/2017JA023884
Wu, C. S., and Lee, L. C. (1979). A Theory of the Terrestrial Kilometric Radiation. Astrophys. J. 230, 621–626. doi:10.1086/157120
Keywords: Saturn, Cassini, SKR emission, interplanetary coronal mass ejection, solar wind
Citation: Cecconi B, Witasse O, Jackman CM, Sánchez-Cano B and Mays ML (2022) Effect of an Interplanetary Coronal Mass Ejection on Saturn’s Radio Emission. Front. Astron. Space Sci. 9:800279. doi: 10.3389/fspas.2022.800279
Received: 22 October 2021; Accepted: 21 February 2022;
Published: 27 May 2022.
Edited by:
Marian Lazar, Ruhr University Bochum, GermanyReviewed by:
Robert Wilkes Ebert, Southwest Research Institute (SwRI), United StatesCopyright © 2022 Cecconi, Witasse, Jackman, Sánchez-Cano and Mays. This is an open-access article distributed under the terms of the Creative Commons Attribution License (CC BY). The use, distribution or reproduction in other forums is permitted, provided the original author(s) and the copyright owner(s) are credited and that the original publication in this journal is cited, in accordance with accepted academic practice. No use, distribution or reproduction is permitted which does not comply with these terms.
*Correspondence: B. Cecconi, YmFwdGlzdGUuY2VjY29uaUBvYnNlcnZhdG9pcmVkZXBhcmlzLnBzbC5ldQ==
Disclaimer: All claims expressed in this article are solely those of the authors and do not necessarily represent those of their affiliated organizations, or those of the publisher, the editors and the reviewers. Any product that may be evaluated in this article or claim that may be made by its manufacturer is not guaranteed or endorsed by the publisher.
Research integrity at Frontiers
Learn more about the work of our research integrity team to safeguard the quality of each article we publish.