
95% of researchers rate our articles as excellent or good
Learn more about the work of our research integrity team to safeguard the quality of each article we publish.
Find out more
ORIGINAL RESEARCH article
Front. Astron. Space Sci. , 01 September 2022
Sec. Astrobiology
Volume 9 - 2022 | https://doi.org/10.3389/fspas.2022.763329
This article is part of the Research Topic Current and Future Instrumentation for the Detection and Identification of Signatures of Life on Mars and Beyond View all 8 articles
 Taewoo Kim1,2†
 Nathan Oborny1†
 Eugene Serabyn1J. Kent Wallace1Kurt Liewer1Manuel Bedrossian3Stephanie Rider3
 Aaron Noell1
 Peter Willis1
 Chris Lindensmith1
 Jay Nadeau4*
In the study of microbial life, microscopy plays a unique role due to its ability to detect ordered structure, motility, and fluorescence signals. As such it has also recently gained attention in the context of searching for extant life on distant Solar System bodies bearing liquid water. In this paper we introduce a multi-modal volumetric microscopy system for potential future spaceflight missions that combines digital holographic microscopy (DHM) and volume fluorescence imager (VFI), which are volumetric imaging methods that provide high-resolution, high-throughput examination of liquid samples. DHM provides information on the absorption, morphology, and motility of imaged objects without requiring the use of contrast agents. On the other hand, VFI based on light field microscopy focuses on the fluorescence signals from the sample to observe specific structures dyed with targeted contrast agents or providing unique autofluorescence signals. We also present an autonomous sample handling and data acquisition system to allow for an autonomous mission to distant planets or moons, or for autonomous use in bodies of water on Earth. The full system, named ELVIS, or Extant Life Volumetric Imaging System, is capable of autonomously surveying a liquid sample to extract morphology, motility, and fluorescence signals of extant microbial life.
The evidence in recent years for planetary moons, such as Europa and Enceladus, bearing large bodies of liquid water under ice shells (i.e., ocean worlds) in the outer Solar System has resulted in a great deal of interest in life detection in aqueous environments (Nimmo and Pappalardo, 2016). Moreover, recent discovery of subglacial water on Mars increases the attention to life-detection in water (Lauro et al., 2021; Scheller et al., 2021). The importance of extant life detection is not only in detecting the potential existence of non-terrestrial life, but also in potentially revealing how early life formed on Earth. Potential life in the ocean worlds, including Europa and Enceladus, is expected to exist in microbial (prokaryotic) form at very low densities, if present at all; estimates for Europa based upon solar energy budgets are ∼102 cells/mL (Hand et al., 2009). Although the low densities and potential sizes of the target organisms down to less than a micron make detection extremely difficult to detect them, methods for studying bacteria and archaea in extreme environments on Earth or in the ocean are being considered for planned NASA missions to find extant life elsewhere. Among these methods, light microscopy is considered one of the most direct life detection modalities, for its capability to capture microscale evidence for life, such as structure, compositional and functional indicators, abundance, and motility. This combination of information is well suited for distinguishing living from non-living particles and serves as a strong biosignature (Neveu et al., 2018).
Despite the usefulness of microscopy, developing a suitable microscopy system for such applications is challenging for several reasons. First, due to the anticipated low sample concentration and small size of the potential life, the microscope needs to have both a high sample throughput and a high resolution. Typically, a microscope loses its throughput (or the field of view) as the resolution improves. However, in a time- and power-limited mission scenario, both aspects need to be met at the same time. Second, as there is limited time and data budget, the imaging process has to be highly compressive. The estimated data budget for a potential Europa Lander mission is likely to be highly limited at 1,260 Kbps, with a baseline science data budget of 600 Mb divided among as many as six instruments (Europa Study Team, 2012). Third, the entire system, including the sample handling, imaging, and analysis, will need to be autonomous while being space- and mass-constrained.
Based on these requirements and the eventual goal of future space missions, we developed a volumetric microscopy suite that is capable of capturing high-resolution morphology, motility, and fluorescence of a liquid volume. The suite, called Extant Life Volumetric Imaging System (ELVIS), combines digital holographic microscopy (DHM) with fluorescence light field microscopy (FLFM) in order to capture both high-resolution morphology and fluorescence synchronously (Serabyn et al., 2020; Kim et al., 2020a). These volumetric imaging techniques capture signals from an extended depth of field and allows for a rapid and compressed imaging of the sample volume. Moreover, in order to enable autonomous operation of the system for a future space mission, we introduce a sample processing unit (SPU) and a custom acquisition software package to control the fluid motion, staining, and image acquisition. The instrument was tested at the Kerckhoff Marine Laboratory in Newport Beach, CA to demonstrate its capability to detect life in oligotrophic ocean water. Lastly, we also present most recent developments made to the system based on the discoveries from the field test.
ELVIS combines a digital holographic microscope with a fluorescence microscope to have a multi-modal volumetric single-shot imaging. The two microscopes share the same field of view and share the same trigger for spatially and temporally synchronized imaging. Combining the two microscopes, ELVIS is capable of capturing high-resolution morphology, 3D motility and biochemical fluorescence sensitivity, which are all considered biosignatures. In this section, we briefly introduce the full ELVIS instrument suite. Further details on the instruments can be found in the Materials and Methods section.
Digital holographic microscopy (DHM) is an interferometric technique that is capable of capturing volumetric information in a single shot, by capturing the complex electric field (amplitude and phase) at the image plane of the microscope and numerically propagating the captured field (Kim, 2010). DHM captures a much larger volume of view (VOV) in a single image compared to a conventional microscope by increasing the depth of field; the VOV of DHM is typically two to three orders of magnitude larger than that of a conventional microscope with the same optical elements. This improves the volumetric throughput of the system without demanding larger data storage or a longer imaging duration, as the holographic image encodes the entire 3D volume into a 2D image, thus providing natural data compression.
Our group has previously introduced DHM as a high-resolution, label-free volumetric imaging method that is suitable for surveying a relatively a large volume of liquid sample (Lindensmith et al., 2016; Bedrossian et al., 2017). In order to ensure detection of microbial life at a density of 100 cells/ml, it is expected that we must examine 40 µl of liquid (Bedrossian et al., 2017). For a conventional microscope with a 500 μm × 500 µm FOV and 2 µm depth of field (DOF), each image examines a 0.5 nl volume. Therefore, in order to examine 40 μl, the device needs to capture 80,000 images. Converting the number of captured images to more relevant numbers in a mission, this corresponds to ∼320 GB of data storage and 4,000 s of continuous imaging, given 4 Mpixels/image, 8 bits/pixel and 15 fps imaging speed. On the other hand, examining a 40 µl volume using DHM requires only 200 images to be captured, corresponding to 8 GB of data or 15 s of imaging, and allows for a mission-suited instrument. This capability has been tested previously at Nuuk, Greenland (Lindensmith et al., 2016).
Because DHM relies on the intrinsic contrast of the samples, specifically their absorption (amplitude) and refractive index difference from the surrounding medium (phase), the technique captures objects in the liquid sample without a need for dyes. However, DHM lacks the biochemical specificity that can be obtained by fluorescence tagging. A fluorescence-based volumetric imaging method could be used to indicate internal cell structures, which could further aid in the determination of whether biological structures are present in the sample. To improve the system and provide a higher confidence in life detection, we combined the DHM system with a fluorescence light field microscopy system, named Volume Fluorescence Imager (VFI), to simultaneously capture the same VOVs. Figure 1A shows the schematic of the system, which combines the DHM system with a volumetric fluorescence imager using a dichroic mirror.
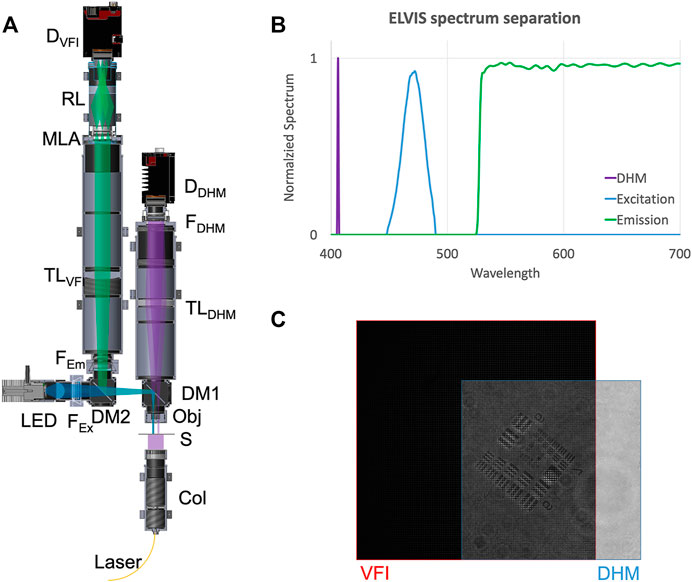
FIGURE 1. Combined DHM-VFI system. (A) Schematic of the combined system. Laser: Thorlabs S1FC405; Col: Laser collimator; S: Sample; Obj: Objective lenses (Edmund Optics, #47-689); DM1: Dichroic mirror (Thorlabs, DMSP425R); TLDHM: 150 mm tube lens (Thorlabs, AC508-150-A); FDHM: 405 nm spectral filter (Thorlabs, FB405-10); DDHM: DHM detector (Allied Vision, Prosilica GT 2450); LED: LED source (Thorlabs M470L3); FEx: Excitation filter (Thorlabs, MF469-35); DM2: Dichroic mirror (Thorlabs, DMSP490R); FEm: Emission filter (Thorlabs, FELH0500); TLVFI: 200 mm tube lens (Thorlabs, AC508-200-A); MLA: Microlens array (RPC Photonics, MLA-S125-f30); RL: 0.528X Relay lens array (Opto Engineering, OPTC23016); DVFI: VFI detector (Allied Vision, Prosilica GT 2450). (B) Theoretical spectrum separation between DHM, VFI excitation and VFI emission. (C) Shared FOV between DHM and VFI.
Light field microscopy (LFM) is a volumetric imaging method that allows for a post-capture refocusing of an image by encoding the position and the direction of propagation of the light using a microlens array (MLA) located at the image plane of a conventional microscope (Levoy et al., 2006). The image is then captured by a detector array placed one focal length away from the microlens array. Effectively, each microlens acts as a pixel that encodes the directional information in the physical detector pixels that are underneath it. Once the image is captured, using a simple ray optics principle, the image can be reconstructed to recover multiple images at different focal points. Compared with a conventional fluorescence microscope, LFM is capable of capturing a volumetric fluorescence image over a larger depth of field that is determined by the system magnification and the number of detector pixels covered by each microlens. While LFM can increase the depth of field (DOF) of a microscope by two orders of magnitude, this does not come for free. As explained previously, each microlens acts as an effective pixel for the imaging system and limits the spatial resolution of the system to d/M, where d is the diameter of each microlens and M is the system magnification.
The two microscopes combined in our ELVIS system complement each other. While the DHM captures high-resolution images with high-sensitivity for the sample’s morphology and motility, the VFI looks for chemical/fluorescence biosignatures that are missed by DHM. By sharing the same objective lens and the same trigger, they capture a spatially and temporally synchronized scene in two different modalities. Moreover, with a careful selection of spectral filters and dichroic mirrors (Figure 1B), the two microscopes are free from cross-talk, removing any ambiguity in signal origin. The large shared VOV (350 μm × 480 μm × 150 µm) is shown in Figure 1C. The depth of field, 150 μm, was limited by VFI DOF, which is taken here to be the reconstruction depth that maintains the lateral resolution. For reconstruction depths larger than 150 μm, the lateral resolution degrades. The overall performance of the system is summarized in Table 1.
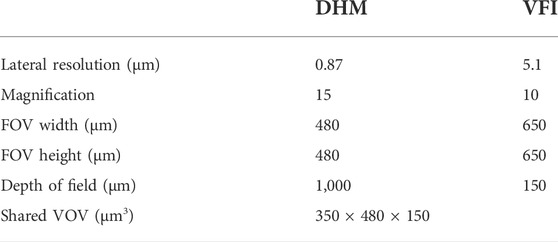
TABLE 1. DHM and VFI performance specifications.
Another significant portion of the ELVIS system is its automated sample processing unit (SPU), which handles automated control of sample delivery, staining and cleaning the system in The SAC is a simple microfluidic flow-through device consisting of two internal fluid channels, the design of which is shown in Figure 2. The SAC was designed with reference and sample channels to match those of the DHM. For this field test, disposable versions of the SAC were constructed (Aline Inc., Rancho Dominguez, CA, United States). This was a three-layer device with optical quality glass on top and bottom. As shown in Figure 2, channels were cut into a 1 mm thick middle polymer layer with channel dimensions measuring ∼12 mm × 3 mm and ∼7 mm × 3 mm (sample and reference channels respectively). The device design ensured that both the sample and reference beams only passed through optical quality glass.
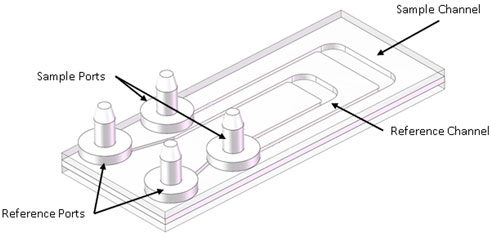
FIGURE 2. Sample aliquot chamber (SAC): The SAC consisted of two channels, a larger sample channel and a smaller reference channel. These channels were connected to the SPU via tubing, itself connected to the SAC via barbed connectors. Image credit Mineh Badalians.
During operation, the reference channel was filled with deionized (DI) water, providing an index of refraction match to the sample. A sample was then passed through the sample chamber for analysis. Prior to observation, valves on both the inlet and outlet of the SAC were closed and fluid motion was allowed to cease completely before analysis, requiring approximately 30 s.
The SPU was designed to interface with the SAC and provide a means of automated sample handling. It provided delivery of sample, rinsing using water and/or ethanol, and staining of up to three fluorescent cell dyes to a sample. After each dye staining, the sample was routed back to the SAC for subsequent analysis.
A logical schematic of the SPU can be seen in Figure 3A. A minimum of 100 µl of a sample could be delivered to the sample chamber of the SAC for analysis as a series of aliquots. The sample was transported with the aid of two, 10 µl fixed volume dispensing pumps (LPMA1251110L) and three varieties of electrically actuated, face-mounted solenoid valves: three-way (LHLA0521111H) and two-way (LHLA0552311H) latching valves and non-latching normally closed two-way valves (LHDB0552115H) (all from The Lee Company, Westbrook, CT, United States). Latching valves can hold their state without constant application of voltage. The two pumps worked in concert but in opposite directions to pull the sample through the SPU and into place for analysis with one upstream and one downstream of the chamber. This pump arrangement was chosen in order to prevent the sample passing through a pump, thereby avoiding the possibility of damaging any cells present. A top-down view of the SPU is shown in Figure 3B.
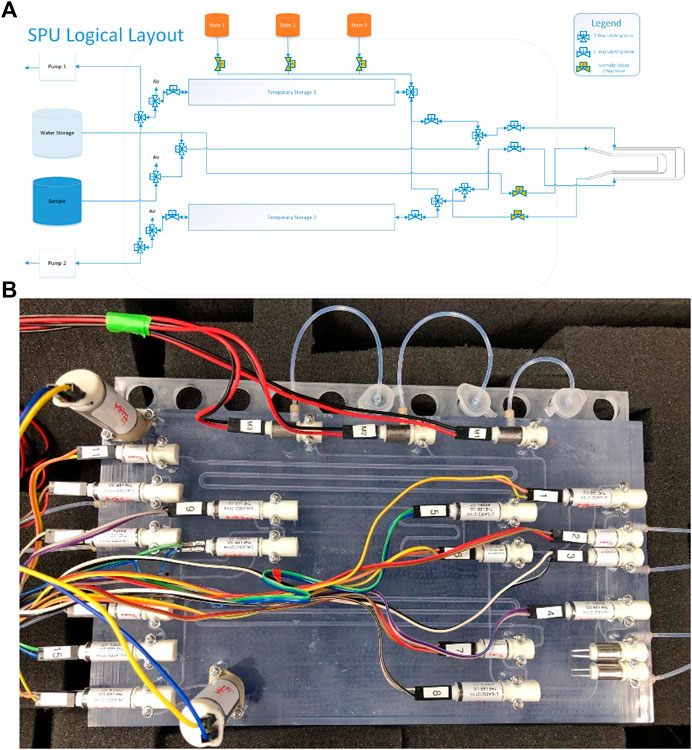
FIGURE 3. Sample Processing Unit. (A) Image of the SPU in schematic view connected to the SAC. The SPU consisted of 10 three-way latching valves, six two-way latching valves, and five normally closed solenoid valves. Fluid motion through the system was accomplished via coordinated action of pump choice and valve state. Latching valves were used where their state lasted for extended periods. Normally closed solenoid valves were used where preventing fluid motion the majority of the time was important. (B) A top-down view of the SPU: The SPU was 3D printed using a clear polymer marketed as Watershed (Protolabs, Maple Plain, MN). Not shown, the SAC was connected to the right side via tubing.
As the ELVIS system is intended to be applicable to future space missions, we also developed autonomous acquisition software that is capable of capturing the images simultaneously from the two cameras. The acquisition software, named DHMx, is based on Allied Vision Vimba SDK and controls the essential functions such as exposure, gain and frame rate. DHMx also includes a DHM reconstruction module that can be loaded to process the interferogram in real-time. The software is open-source and can be found on GitHub (Fregoso, 2020). The DHM reconstruction module can run on the same computer as used for acquisition or a remote computer, allowing remote users to operate the instrument from any distance over which a network link can be established. Furthermore, we have added a hardware trigger using an Arduino microcontroller to provide synchronous capture signal to the two cameras. By opening two instances of DHMx to capture images from the two cameras, and by providing a script to simultaneously capture the data, we were able to capture images from the two cameras with a less than 0.2 ms offset in the start times, which is insignificant for our frame rate of 15 fps.
The complete ELVIS system was tested at the Kerckhoff Marine Laboratory, Newport Beach, CA (Kim et al., 2020b). Samples were collected from the ocean (representing a low biomass sample) and a tidal pool (representing a high biomass sample) in sterile 500 ml bottles. Four different sample types were used for the field test: Blank samples (pure water), unconcentrated low biomass sample, filter-concentrated low biomass sample, and high-biomass sample. Each of the samples were processed via the following steps:
1) SPU/sample chamber was cleaned with ethanol and flushed with water
2) Reference chamber was loaded with refraction index matched fluid (extracted from sample)
3) Sample chamber was loaded with sample
4) Sample was imaged using DHM and VFI (15 fps, 30 s, three time series)
5) Sample was routed back to SPU to be stained with dye #1
6) Dye #1 (Acridine Orange) applied to sample for 5 min (2:1 sample to dye ratio)
7) Dyed sample was routed back to the sample chamber
8) Dyed sample was reimaged with both DHM and VFI (15 fps, 30 s per FOV, three time series)
9) Sample was routed back to SPU to be stained with #2
10) Dye #2 (FM1-43) applied to sample for 20 min (2:1 sample to dye ratio)
11) Dyed sample routed back to the sample chamber
12) Dyed sample was reimaged with both microscopes (15 fps, 30 s per FOV, three time series)
13) Sample was flushed with water and the chamber was cleaned with ethanol
From the initial few aliquots, we were able to detect signs of life in DHM, both prokaryotes and eukaryotes. In VFI, only large eukaryotic cells were detected. In the high-biomass sample, a wide variety of organisms of different sizes were seen by both autofluorescence and dye labeling (Figure 4). Shown in Figure 4 are the correlative images from DHM and VFI showing a eukaryotic cell swimming in the FOV over 4 s. The minimum z- (along the optical axis) and t- (time) projection for the DHM data and the maximum z- and maximum t-projection for the VFI data are shown to capture the 4D stack. The fluorescence signal was detected before dye addition, indicating that the signal was from the native fluorophore such as chlorophyll.
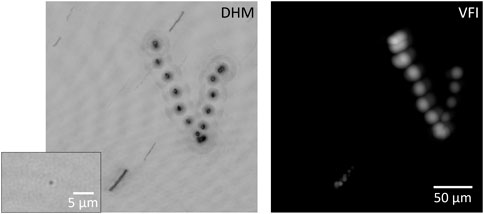
FIGURE 4. Correlative images of a eukaryotic cell expressing native fluorescence captured by DHM amplitude and VFI intensity. The images are captured over 4 s (60 frames) and volume reconstructed. The DHM amplitude reconstructions are minimum projected in the z-direction and then overlaid over time. The VFI intensity reconstructions are maximum projected in the z-direction and then overlaid over time. (Inset) 1 µm bacteria-sized object detected by DHM. The image was obtained from one frame of a series of images showing the bacterial motility.
While the VFI detected autofluorescent cells of size ≥10 μm, the DHM was capable of detecting smaller bacteria-sized cells as well by recording motility. The inset of Figure 4 shows a bacterium from the ocean water captured using DHM. Note that there was no structural information detected even with the high-resolution DHM because the size of bacterial cells (∼1 µm) is very close to the spatial resolution of the system. Although clear motility was detected from DHM, there was no corresponding signal detected from the VFI on such small entities, either before and after staining. While it was expected that there would not be a detectable VFI signal from bacterial cells before staining, the cells were still not visible after staining, indicating that system improvements were necessary.
The initial system showed high levels of background fluorescence that made detection of small cells impossible. One significant source of background was the ABS (RenShape® SL 7820) used to mount the objectives. A new objective holder was machined from anodized aluminum, making detection of bacteria possible. Further iterations improved the signal to noise, specifically reducing dye concentration. Although the dyes tested here were chosen for their enhancement upon specific binding, unbound dye nevertheless resulted in significant background, making the SNR for 1 µm size particles to be less than 1. Therefore, it was crucial to identify and use the minimal dye concentration to stain the sample to avoid high background. With these changes, we have improved our sensitivity allowing us to detect individual bacterial particles of 1 µm size. Moreover, we have introduced multiple laser bands for DHM and a color camera for VFI to allow for multi-color imaging with a goal to detect information regarding the pigment in the samples and multiple fluorescence signals in a single shot and allowing the dyes to be applied simultaneously in future field tests. The results of the recent advances are summarized in Figure 5.
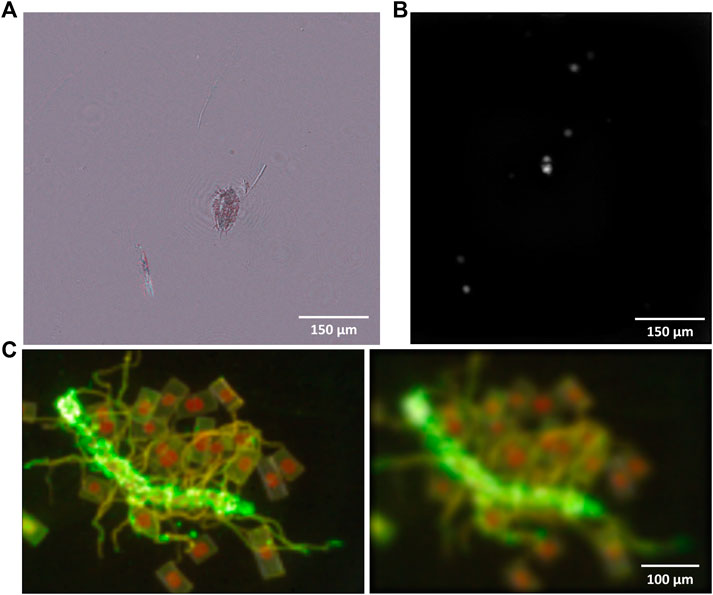
FIGURE 5. (A) A reconstructed multi-wavelength DHM amplitude image of a water flea captured at Newport Beach. (B) High-sensitivity VFI image of 1 µm sized single bacteria (Serratia marcescens) stained with 50 nM Syto-9. (C) Multi-color VFI images of FM1-43 stained ocean algae reconstructed at two different z-planes. Green color is from FM1-43 and red is from native Chlorophyll.
Figure 5A shows an amplitude reconstruction of a multi-wavelength DHM image capturing a sea flea. DHM images of three different wavelengths (405, 520, and 635 nm) are captured in a single image, separated in the Fourier plane, reconstructed and overlaid to show the wavelength-dependent absorption of the object. Figure 5B shows the sensitivity improvement in VFI, which is now capable of imaging 1 µm sized single Serratia marcescens dyed with Syto-9. Serratia marcescens was obtained from the American Type Culture Collection (ATCC) (ATCC 13880 type strain) and maintained in lysogeny broth (LB, Fisher Scientific) at 30°C. The background dye concentration has also been optimized at 50 nM to minimize the background signal without losing the dyeing efficiency. Figure 5C shows two different z-positions of a volume reconstructed multi-color VFI image of an algae sample dyed with FM1-43. The membrane dye shows up as green while the native chlorophyll shows up as red in a single image. This result shows the improved specificity information obtained from VFI.
In this paper, we have demonstrated the ELVIS system’s capability, detecting and studying microbial life in liquid sample. The system is capable of capturing 3D high-resolution morphology and motility through its DHM arm and also 3D fluorescence information from the same field of view via its VFI arm. Therefore, the system serves as a high-throughput, high-resolution, multi-modal imaging suite for studying microbial life. Moreover, the addition of SPU to the microscope system allows for an autonomous operation of the sample examination. We demonstrated the capabilities through the field test performed at Newport Beach, CA, during which ambient life was successfully detected. Further improvements have been made based on the findings from the field test, and now the ELVIS system demonstrates its future capabilities providing access to more sample characteristics including multiple fluorescence signals and pigments.
Overall, we have demonstrated that, although the system was built as a prototype for a future space mission, the ELVIS system provides a new means to studying microbiological samples in general. Moreover, since it is developed with a goal of future space missions to find extant life in the ocean worlds, it accommodates the resource limitates of such missions. The details of a potential flight system can be tailored to match science performance to specific mission goals while staying within mass, power, and data constraints to provid a powerful instrument for the detection of potential extant life.
The original contributions presented in the study are included in the article/Supplementary Material, further inquiries can be directed to the corresponding author.
TK and NO contributed equally to the study. TK and NO performed the field test operation, data analysis and creating the initial manuscript draft. TK and KL built the field test instrument. NO built the SPU. ES, JW, KL, and SR built the prototype of the microscope instrument. MB performed the 3D reconstruction of DHM data. AN, PW, CL, and JN oversaw the project.
The work described in this paper is funded by and performed at the Jet Propulsion Laboratory, California Institute of Technology under contract with the National Aeronautics and Space Administration. The work is also funded by NSF MRI grant 1828793, ELVIS.
The authors thank Sheri McKinney for supplying cultured cells during the initial lab-based testing and post field test analysis.
Author TK was employed by Columbus Technologies and Services, Inc.
The remaining authors declare that the research was conducted in the absence of any commercial or financial relationships that could be construed as a potential conflict of interest.
All claims expressed in this article are solely those of the authors and do not necessarily represent those of their affiliated organizations, or those of the publisher, the editors and the reviewers. Any product that may be evaluated in this article, or claim that may be made by its manufacturer, is not guaranteed or endorsed by the publisher.
The Supplementary Material for this article can be found online at: https://www.frontiersin.org/articles/10.3389/fspas.2022.763329/full#supplementary-material
Bedrossian, M., Lindensmith, C., and Nadeau, J. L. (2017). Digital holographic microscopy, a method for detection of microorganisms in plume samples from Enceladus and other icy worlds. Astrobiology 17 (9), 913–925. doi:10.1089/ast.2016.1616
Europa Study Team, (2012). Europa Study 2012 Report: Europa Lander Mission. JPL D-71990, National Aeronautics and Space Administration.
Fregoso, S. F. (2020). DHMx Software Suite. GitHut Repository: https://github.com/dhm-org/dhm_suite.
Hand, K. P., Chyba, C. F., Priscu, J. C., Carlson, R. W., and Nealson, K. H. (2009). “Astrobiology and the potential for life on Europa,” in Space science series. Editor W. M. R. Pappalardo, and K. Khurana. 2nd ed. (Tucson, AZ: University of Arizona Press), 529
Kim, M. (2010). Principles and techniques of digital holographic microscopy. J. Photonics Energy 1, 018005. doi:10.1117/6.0000006
Kim, T., Serabyn, E., Schadegg, M., Liewer, K., Oborny, N., Wallace, J. K., et al. (2020a). Elvis: A correlated light-field and digital holographic microscope for field and laboratory investigations. MTO 28 (3), 18–25. doi:10.1017/S1551929520000899
Kim, T., Serabyn, E., Liewer, K., Oborny, N., Wallace, J., Rider, S., et al. (2020b). ELVIS: A correlated light-field and digital holographic microscope for field and laboratory investigations–Field demonstration. MTO 28 (4), 14–18. doi:10.1017/S1551929520001133
Lauro, S. E., Pettinelli, E., Caprarelli, G., Guallini, L., Rossi, A. P., Mattei, E., et al. (2021). Multiple subglacial water bodies below the south pole of Mars unveiled by new MARSIS data. Nat. Astron. 5, 63–70. doi:10.1038/s41550-020-1200-6
Levoy, M., Ng, R., Adams, A., Footer, M., and Horowitz, M. (2006). “Light field microscopy,” in ACM SIGGRAPH 2006 Papers (SIGGRAPH '06) (New York, NY: Association for Computing Machinery), 924–934. doi:10.1145/1179352.1141976
Lindensmith, C. A., Rider, S., Bedrossian, M., Wallace, J. K., Serabyn, E., Showalter, G. M., et al. (2016). A submersible, off-axis holographic microscope for detection of microbial motility and morphology in aqueous and icy environments. PloS one 11 (1), e0147700. doi:10.1371/journal.pone.0147700
Neveu, M., Hays, L. E., Voytek, M. A., New, M. H., and Schulte, M. D. (2018). The ladder of life detection. Astrobiology 18 (11), 1375–1402. doi:10.1089/ast.2017.1773
Nimmo, F., and Pappalardo, R. T. (2016). Ocean worlds in the outer solar system. JGR. Planets 121 (8), 1378–1399. doi:10.1002/2016JE005081
Scheller, E. L., Ehlmann, B. L., Hu, R., Adams, D. J., and Yung, Y. L. (2021). Long-term drying of Mars by sequestration of ocean-scale volumes of water in the crust. Science 372 (6537), 56–62. doi:10.1126/science.abc7717
Keywords: life detection, microscopy, holography, automation, ocean worlds
Citation: Kim T, Oborny N, Serabyn E, Wallace JK, Liewer K, Bedrossian M, Rider S, Noell A, Willis P, Lindensmith C and Nadeau J (2022) A multi-modal volumetric microscope with automated sample handling for surveying microbial life in liquid samples. Front. Astron. Space Sci. 9:763329. doi: 10.3389/fspas.2022.763329
Received: 23 August 2021; Accepted: 03 August 2022;
Published: 01 September 2022.
Edited by:
Andreas Riedo, University of Bern, SwitzerlandReviewed by:
Josep M. Trigo-Rodríguez, Institute of Space Sciences, Spanish National Research Council (CSIC), SpainCopyright © 2022 Kim, Oborny, Serabyn, Wallace, Liewer, Bedrossian, Rider, Noell, Willis, Lindensmith and Nadeau. This is an open-access article distributed under the terms of the Creative Commons Attribution License (CC BY). The use, distribution or reproduction in other forums is permitted, provided the original author(s) and the copyright owner(s) are credited and that the original publication in this journal is cited, in accordance with accepted academic practice. No use, distribution or reproduction is permitted which does not comply with these terms.
*Correspondence: Jay Nadeau, bmFkZWF1QHBkeC5lZHU=
†These authors have contributed equally to this work
Disclaimer: All claims expressed in this article are solely those of the authors and do not necessarily represent those of their affiliated organizations, or those of the publisher, the editors and the reviewers. Any product that may be evaluated in this article or claim that may be made by its manufacturer is not guaranteed or endorsed by the publisher.
Research integrity at Frontiers
Learn more about the work of our research integrity team to safeguard the quality of each article we publish.