- Space Science and Applications Group (ISR-1), Los Alamos National Laboratory, Los Alamos, NM, United States
Geomagnetic substorms are associated with characteristic energetic particle injection signatures at geosynchronous orbit that are often dispersionless in both electrons and ions near the magnetic local time sector of auroral onset locations and are dispersed farther away from this region. Although the precise mechanism responsible for the coherent injection signatures at geosynchronous orbit have been the topic on considerable ongoing debate for decades, recent work on bursty bulk flows (BBFs) in the tail have led to the hypothesis that they may be the result of multiple, overlapping flow bursts penetrating into the inner magnetosphere from more distant downtail reconnection sites. Since auroral streamers are thought to be ionospheric signatures of BBFs in the tail, they can be used as proxies for testing this hypothesis. Using high resolution auroral imagery from the POLAR/VIS instrument combined with multi-spacecraft observations of energetic particle injections at geosynchronous orbit, we examine the association of mesoscale auroral structures with particle injection signatures over many hours during the 9 November 1998 storm. We find that the explosive types of auroral activations, such as pseudo-breakups and substorm onset breakups, are associated with the more intense and well-defined dispersed injection signatures, while intervals of isolated streamer activity appear to be associated with smaller dispersed “injectionlet” signatures. Furthermore, intervals of sustained, intense, and late expansion phase/recovery phase streamer activity appear to be associated with sustained elevated dispersed particle fluxes. These results are consistent with the hypothesis that it is the overlapping effects of sustained, intense multiple flow bursts penetrating toward the Earth that result in classical substorm particle injection signatures at geosynchronous orbit. However, it is also suggested that torches/omega-band tongues are the prime fate of braking isolated flow bursts (streamers) rather than the development of breakups, bulges, and substorm current wedge formation. A statistical analysis is presented showing that 93% of the observed torches evolved from streamers, 93% of streamers arriving in the equatorward regions of the bulge led to torches, 10.5% of such streamers led to breakups (either pseudo-breakups or substorm onsets), and only 3.5% of such streamers led to substorm onsets.
1 Introduction
During active times, auroral displays develop a large variety of complex mesoscale structuring with scale sizes of 10–100s of kilometers. Studies of these forms have been largely phenomenological and have introduced terms such as rays, folds, loops, and breakups to describe the characteristics of smaller scale features. A hierarchy of more complex forms that can arise when one or more of these individual forms are added to a quiet arc was introduced by Akasofu (1965). Adding rays result in a “rayed arc”; adding folds result in a ‘band’; adding rays and folds result in a “rayed band”; and adding rays, folds, and loops result in complex “drapery” forms. At the most active levels of this hierarchy, “auroral breakups” can be observed as “scattered rays” or “broken-up rayed bands”. “Complete disruptions” can also occur, which evolve into “scattered patches”. Although a number of these terms are no longer in common use, some are still used to describe auroral features (such as “omega bands”) so it useful to understand where the terms came from.
Over the past 60 years, many additional characteristics of mesoscale auroral phenomena have been identified including (Forsyth et al. (2020); Henderson (2012), Henderson M. (2021)) dynamics of the westward traveling surge, poleward boundary intensifications, auroral streamers, auroral torches, omega bands, pre-onset beading, auroral breakups, pseudo-breakups, “contact breakups”, undulations and giant undulations (in the equatorward boundary of the auroral oval), detached subauroral arcs and patches, dayside poleward-moving auroral forms (PMAFs), polar cap patches, and Q-aurora. Many of the nightside auroral features are related to one another and many have been linked to processes in the tail.
1.1 Poleward Boundary Intensifications and Auroral Streamers
Active auroral disturbances such as substorms and Steady Magnetospheric Convection (SMC) events can be viewed as an ensemble of a series of more elemental episodes of activity that recur at intervals of ∼5–15 min. These events are typically associated with an activation of a poleward arc system (called poleward boundary intensifications or PBIs) followed by the equatorward ejection of north–south (NS)-aligned auroral “streamers” from the poleward arc into the bulge (Montbriand 1971; Rostoker et al., 1987; Nakamura et al., 1993; Henderson 1994; Henderson et al., 1998; Lyons 2000). During substorms, the active poleward arc system where this takes place is located at the poleward edge of the substorm bulge (which is typically equatorward of the open/closed boundary during the expansion phase). Late in the expansion phase during substorms (when the bulge has reached the open/closed boundary) and during intervals of SMC-like activity, the PBIs typically occur at the most poleward arc system which is adjacent to the polar cap open field line region.
The activations of the poleward arc system typically include an intensification (which is sometimes observed to travel eastward along the arc system from near the surge head) and/or the creation of new arcs at the poleward edge (Henderson 1994; Henderson et al., 1994; Henderson et al., 1998; Henderson M., 2021). In the western part of the bulge, the equatorward moving forms often have a west-to-east or northwest-to-southeast alignment, while farther to the east, the structures tend to be more north–south–aligned. Once in the bulge, the auroral forms below the westward traveling surge drift in a clockwise sense (as viewed from above in the northern hemisphere) as they rotate around the Harang discontinuity region (Henderson M. (2021)). In the post-midnight side of the bulge, the equatorward moving streamer forms typically drift eastward. After the streamer forms are injected into the bulge, they propagate toward the equatorward boundary where they become broader and more diffused in appearance and often evolve into torch-like auroral structures, which are the poleward-protruding tongues of luminosity associated with omega bands (Henderson et al., 2002; Henderson 2012; Lyons et al., 2015; Henderson 2016; Henderson et al., 2018; Liu et al., 2018; Forsyth et al., 2020; Henderson M., 2021; Henderson M. G., 2021).
These more elemental episodic events are characteristic of both substorms and SMCs (and storms since they frequently contain substorms and SMC-like intervals) and are probably the auroral signatures of the “micro-substorms” observed by Sergeev (1974) and Yahnin et al. (1983), the “substorm intensifications” described by Rostoker et al. (1980), and the “multiple onset substorms” described by Pytte et al. (1976). Rostoker et al. (1987) originally interpreted substorm-associated north–south–aligned auroral forms as “the projection on the ionosphere of the drift paths of [localized blobs of] energetic electrons as they drift from the magnetotail into the more dipolar inner magnetosphere”, and Liu and Rostoker (1993) proposed a model in which these “plasma blobs” are injected into the central plasma sheet from the adjacent low latitude boundary layer.
More recently, auroral streamer events have been implicated as an ionospheric manifestation of fast flows (e.g., BBFs) in the tail (Henderson et al., 1998; Sergeev et al., 1999, Sergeev et al., 2000; Kauristie et al., 2000, Kauristie et al., 2003; Zesta et al., 2000; Nakamura et al., 2004; Zesta et al., 2006) and have been shown to be associated with ionospheric flow channels (Amm and Kauristie 2002; Gallardo-Lacourt et al., 2014, Gallardo-Lacourt et al., 2017; Gabrielse et al., 2018) and enhanced subauroral SAPS flow enhancements (Gallardo-Lacourt et al., 2017). It has been shown that the luminous emissions within the streamer forms map to the upward field-aligned current (FAC) that is generated by flow shears at the duskside of the BBF, while the downward FAC generated on the dawnside of the BBF is thought to be largely devoid of emissions in the ionosphere. Thus, the elemental mode of earthward transport in the tail (BBFs) has been firmly connected with the elemental mode of auroral activity in the ionosphere (the PBI/streamer events). Since the fast flows that produce the streamers are themselves likely a result of reconnection in the tail, it stands to reason that the region where the streamers emerge from in the ionosphere is also likely to be related to this reconnection site. In terms of their production mechanism, it is thought that small-scale (
Since streamers emerge from the poleward edge of the poleward expanding substorm bulge, even while the bulge is obviously entirely enveloped by closed field lines (indicated by the presence of undisturbed auroral emissions poleward) (Murphree et al., 1993; Henderson 2009), the poleward edge of the bulge during expansion phase is likely to be associated with a NENL that has not yet started processing open field lines. Streamers can also emerge from the higher latitude auroral boundary and this is likely related to a reconnection site farther downtail that is currently processing lobe field lines. Note that the x-line farther downtail will itself have been formed via a previous episode of substorm activity, and depending upon the time-history of the solar-wind/magnetosphere/ionosphere system, this site may or may not have retreated very far downtail and it may also become reinvigorated in response to favorable solar wind driver conditions.
1.2 Torches and Omega Bands
Omega bands are large-scale, discrete auroral folds that develop in the morning sector during substorms (Akasofu 1974; Saito 1978; Rostoker and Barichello 1980; Henderson et al., 2002; Henderson 2012, Henderson 2016; Forsyth et al., 2020) or following substorm intensifications (Pellinen et al., 1992) and during SMC (Steady Magnetospheric Convection) or convection bay-like intervals (Solovyev 1999; Henderson 2012, Henderson 2016). They typically occur at the poleward edge of the diffuse auroral region but are embedded in the most equatorward component of the so-called double oval configuration that also develops in the later phases of an auroral substorm (Henderson 1994; Elphinstone et al., 1993) or during SMC-like intervals Henderson et al. (2006b,a); Henderson (2012), Henderson 2016). They are characterized by a series of (roughly) north–south–aligned protrusions, which extend poleward toward the higher latitude component of the double oval and are azimuthally separated by dark regions. The poleward protrusions or “tongues” of luminosity were originally referred to as “auroral torches” by Akasofu and Kimball (1964). When more than one such torch exists, the auroral pattern resembles a series of inverted Greek letter Ω’s with the concave portion of each Ω pointing poleward. As discussed previously, when multiple such “folds” coexist, the composite structure is referred to as an omega “band”.
Omega bands vary in azimuthal size between a few hundred kilometers and several thousand kilometers (even within a single event) and are typically observed to drift eastward at speeds between 0.4 and 2 km/s, although individual torch-like structures have occasionally been observed to drift westward as well. In addition, it has been shown that omega bands are associated with long-period Ps6 magnetic pulsations with a 4–40 min period (a special substorm-associated subclass of long-period Pi3 irregular magnetic pulsations) (Saito 1978; Kawasaki and Rostoker 1979; Opgenoorth et al., 1983; Buchert et al., 1988) and that each packet of Ps6 pulsations is associated with the occurrence of a low-latitude Pi2 pulsation (Saito 1978). Oguti et al. (1981) have also determined that the central regions of the bright poleward protrusions or torches are activity centers for pulsating auroras during magnetically active periods.
The equivalent ionospheric current systems derived from ground magnetometer and radar measurements show that omega bands are associated with a series of eastward-drifting pairs of upward and downward field-aligned currents (FACs). The western edges of the luminous torches are associated with regions of upward FAC while the western-most edge of the dark voids between the torches is associated with downward FAC (Wild et al., 2000). Andreeva et al. (2021) mapped omega bands to the tail and found that 90% of them mapped to a radial distance of 6–14 Re, which places them firmly in the nightside magnetotail transition region (the region separating tail-like from dipole-like field lines), which also coincides with the region where BBFs are observed to rapidly decelerate (or “brake”).
Noting their quasi-periodic nature coupled with their eastward drift, many researchers proposed that omega bands may be related to the growth of a wave-like mode such as the Kelvin–Helmholtz instability (KHI) (Rostoker and Samson 1984; Lyons and Walterscheid 1985; Buchert et al., 1990; Wild et al., 2000) or a hybrid KHI/interchange instability (Yamamoto (2009), Yamamoto (2011). The region where this instability is hypothesized to operate is different for many of these models. For example, Rostoker and Samson (1984) assumed that the omega bands were distortions in the poleward boundary and therefore suggested that the shear flow causing the KHI was between the plasma sheet and the low latitude boundary layer on the morning side magnetotail. Lyons and Walterscheid (1985) proposed that the KHI was driven by neutral wind shear velocities near the poleward edge of the diffuse aurora in the morning-side ionosphere. Other mechanisms place the velocity shear at the inner edge of the plasma sheet (Connors and Rostoker 1993). Some of these proposed mechanisms can be rejected based solely on mapping arguments. For example, since the omega bands are deeply embedded in the closed field line region and certainly do not represent distortions of the open/closed boundary, mechanisms such as those proposed by Rostoker and Samson (1984) are not plausible. In addition, none of the purely KHI-based mechanisms appear to provide an adequate explanation for why omega-band waveforms often develop in quite an irregular manner, sometimes with pre-existing omegas dividing into a multiplicity of smaller omegas (e.g., see the yellow annotation in Figure 13 in the work by Forsyth et al. (2020)). It also seems implausible that the KHI could produce the very pronounced torch-like structures that are commonly observed to extend from the equatorward edges of the auroral distribution (which must map quite close to the Earth) very far poleward toward the active poleward boundary auroras since it would likely need to operate coherently over very large radial distances on the nightside.
Most recently, using global auroral imager data, Henderson et al. (2002) demonstrated conclusively that the equatorward-moving streamer forms that are ejected episodically from the poleward boundary can evolve directly into torch structures which contribute to well-defined omega-band forms. Since (as discussed previously) streamers are thought to be an ionospheric manifestation of fast flows penetrating earthward from a downtail reconnection site, these observations implied that omega bands can be produced as a direct result of earthward-directed bursty bulk flows (BBFs). Since streamers form quasi-periodically in time and can also form at multiple longitudes simultaneously (sometimes also quasi-periodically spaced), this model naturally explains how the torch structures can be generated in a piece-wise manner to produce an irregular eastward-drifting omega-band waveform. In addition, the FAC structure associated with streamers is in exactly the same sense as the torch structures, and the fact that the torch structures are activity centers for pulsating aurora (Oguti et al., 1981) is easily explained in terms of the free energy introduced by the associated earthward penetrating fast flows (Henderson et al., 2002; Henderson 2012; Forsyth et al., 2020).
1.3 Current Outstanding Questions
Although the relationship between PBIs, streamers, torches, and omega bands can largely be understood in terms of the flow burst model described previously, a number of unresolved questions still persist. First, it is likely that not all omega-band forms are generated in this manner and/or there may well be additional mechanisms that operate to further process the forms (e.g., KHI or KHI/interchange instabilities in the tail transition region). Second, there is still considerable debate about how streamers may be related to the development of new auroral breakups (that may or may not result in full substorms) and to the energetic particle injections associated with substorms.
In the present study, we will address a number of topics relating to both of these issues. Specifically, we will present auroral and geosynchronous energetic particle (EP) observations during the 9 November 1998 storm and discuss the following key long-standing unresolved questions:
1) How often are auroral torches produced as a result of auroral streamer impacts?
2) How often do auroral streamers result in the formation of auroral torches?
3) How often are new auroral breakups (pseudo-breakups and/or full substorm onsets) triggered by streamers (or more precisely, how often are they triggered by the earthward flows that also produce the streamers)?
4) What does the observed auroral dynamics imply with respect to the role of flow-braking in SCW/WTS development?
5) Which of the mesoscale auroral structures are related to the particle injections?
6) Why do some of the breakups not develop into full substorms while others do?
Since the 9 November 1998 storm contains multiple examples of all of the relevant auroral dynamics (PBIs, streamers, torches, omega bands, pseudo-breakups, contact breakups, and substorms), it is ideally suited for addressing these issues.
2 Observations
On 9 November 1998, the auroral distribution displayed a long-lived, active double-oval–type configuration. The auroral dynamics were characterized by repetitive episodes of poleward boundary intensifications and equatorward ejection of north–south–aligned auroral forms and by the presence of a well-developed and intense morning sector omega-band structure.
2.1 Solar Wind and IMF Conditions
Figure 1 shows the solar wind and interplanetary magnetic field conditions on 9 November 1998 from the ACE spacecraft (located
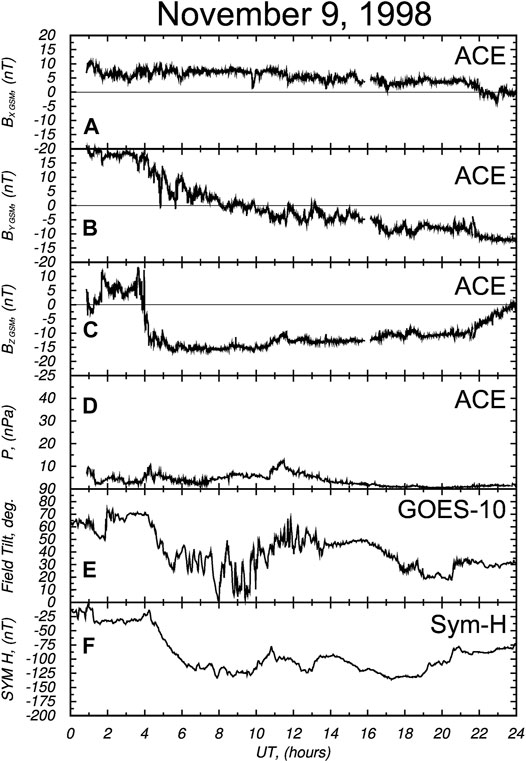
FIGURE 1. Solar wind (SW) and interplanetary magnetic field (IMF) conditions together with two indicators of magnetospheric response during the 9 November 1998 geomagnetic storm. (A–C) Interplanetary magnetic field Bx, By, and Bz components in GSM coordinates from the ACE spacecraft located at the upstream L1 point. (D) Solar wind dynamic pressure from the ACE spacecraft. (E) Magnetic field inclination angle at GOES-10. (F) Sym-H index.
From the Sym-H index shown in Figure 1F, it can be seen that the ring current quickly became enhanced to strong storm levels in response to the strong interval of negative IMF Bz, with the main phase lasting only ∼2 h. After
2.2 Auroral Dynamics
Figure 2 shows a sequence of images of the northern auroral distribution acquired with the Polar VIS/LR auroral imager. A subset of these images has already been presented by Henderson et al. (2002) and was used to demonstrate how the ejection of a single north–south–aligned auroral form from the poleward component of the double oval was related to the formation of the omega bands residing on the equatorward part of the double oval configuration. As shown, a poleward boundary intensification (PBI) was observed at 06:06:52 UT followed by the ejection of an equatorward moving north–south–aligned auroral structure between 0611 and 0620 UT. By 0629 UT, the north–south–aligned form has evolved into a classic torch-like structure at the western edge of a well-developed omega-band structure. The evolution of this streamer into a torch structure is highlighted with green annotation in Figure 2. When the images are animated (as shown in the movie provided as Supplementary Data S1), the omega bands are clearly seen to drift eastward and the evolution of the NS form into the torch structure is very clear and dramatic. Several other episodes of PBI/NS auroral activity occurred throughout this time period and each behaved in a similar manner.
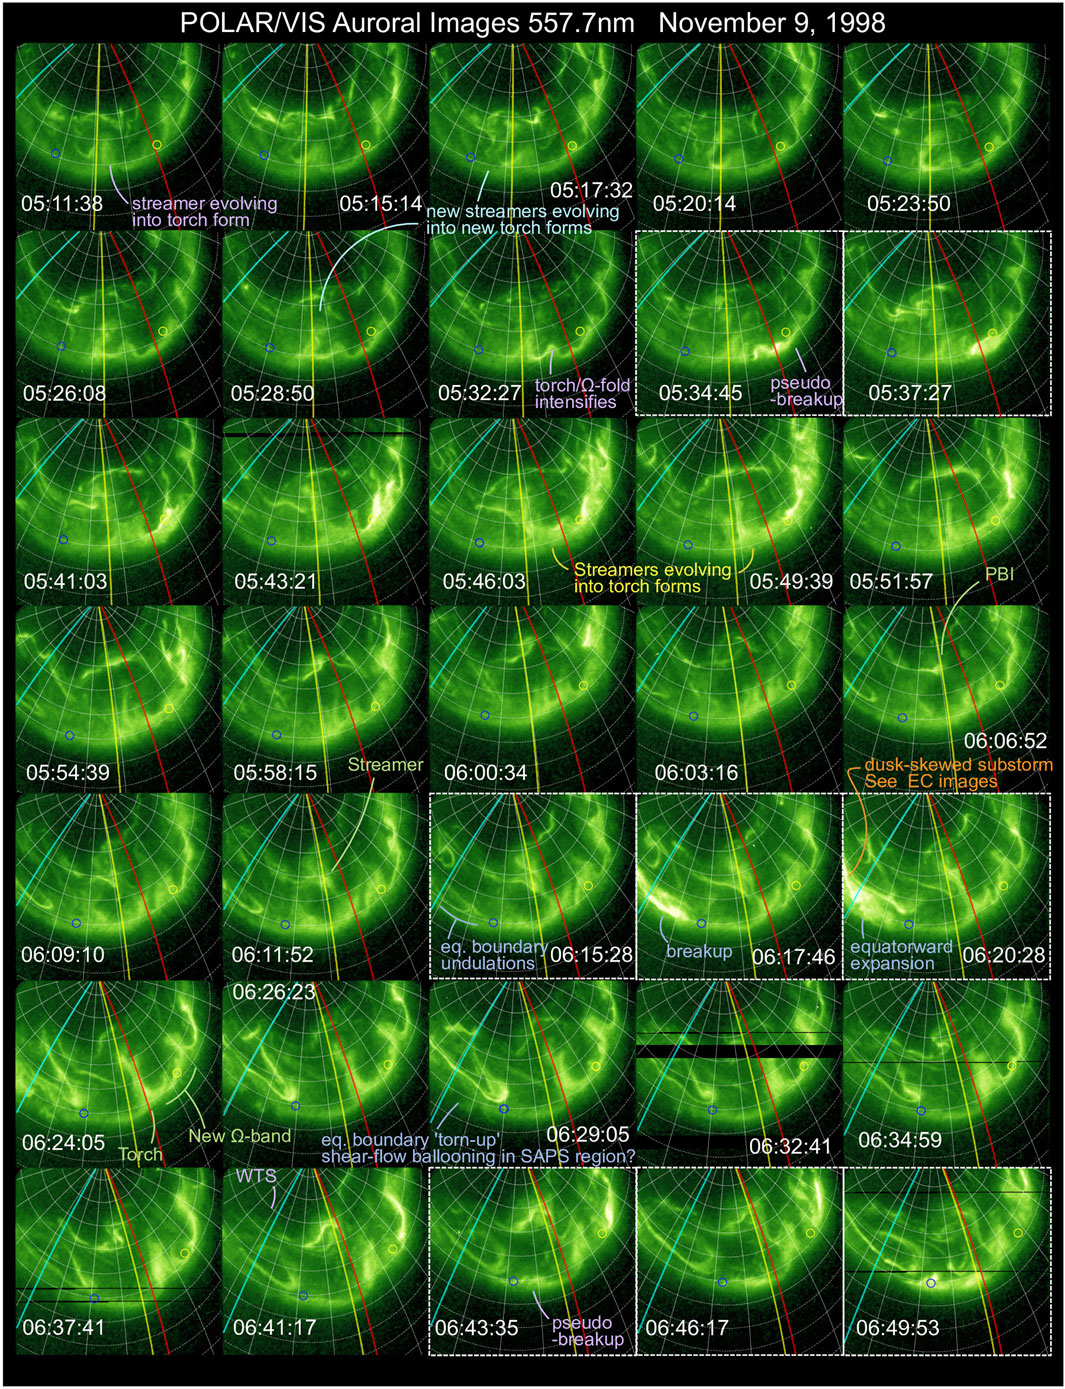
FIGURE 2. Images of the Earth’s northern auroral distribution acquired by the Polar VIS/LR auroral imager on 9 November 1998 at a wavelength of 557.7 nm.
The additional features highlighted in Figure 2 include the occurrence of two pseudo-breakups (one at ∼05:34 UT and another at ∼06:43 UT) and a highly duskward-skewed substorm-like disturbance at ∼06:17 UT. The 05:34 UT disturbance begins in the equatorward regions of the auroral distribution just to the east of where a torch-like structure has been formed via the prior arrival of a streamer. The initial equatorward ejection of the streamer was not captured in the high resolution imagery but can be seen forming in the lower-resolution Earth Camera (EC) imagery as early as ∼04:59 UT (Supplementary Animation S1), and as shown in Figure 2, some additional complex streamer forms were ejected equatorward between ∼05:11 and 05:30 UT (cyan annotation). The explosive brightening associated with the pseudo-breakup disturbance spread mainly eastward and resulted in a substantial intensification of the omega-band forms that were pre-existing there (in addition to some poleward expansion in the east). The disturbance did not propagate poleward to the open-closed boundary, which is why it is classified as a pseudo-breakup and not a substorm breakup. Hence, if reconnection processes developed in association with this disturbance, they did not appear to invoke lobe reconnection at any point. In fact, following the pseudo-breakup, a number of additional ongoing streamer forms can be seen descending equatorward, all of which continue evolving into torch-like forms that continue building the eastward-drifting omega-band forms in the equatorward regions of the auroral distribution (one of these is highlighted in yellow annotation, but there are others clearly evident as well). Analysis of the EC imagery (Supplementary Animation S1) shows that there were no other abrupt enhancements outside of the LR FOV during this time period.
The second disturbance shown in Figure 2 occurred at ∼06:17 UT. This event has also been studied extensively by Henderson et al. (2018); Henderson (2021a,b), who noted that it appears to occur in the westward return flow region to the west of the Harang reversal location, it was associated with SAPS flows, and that it produced a marked disruption of the equatorward boundary of the oval there together with the generation of some interesting subauroral forms that may be related to the formation of detached arcs and STEVE-like phenomena (STEVE: “Strong Thermal Emission Velocity Enhancement”). As with the previous pseudo-breakup, this event was also preceded by substantial ongoing streamer/torch-generation activity. As shown in Figure 2, the envelope of auroral disturbance associated with event did not appear to propagate poleward to the O/C boundary within the field of view of the LR camera and certainly did not affect any of the other ongoing mesoscale auroral activity to the east of it. However, the Earth Camera data show that it extended very substantially westward and poleward outside the LR camera FOV. This event appears to be a highly duskward-skewed substorm rather than a pseudo-breakup.
The second pseudo-breakup in Figure 2 occurred at ∼06:43 UT and developed below a dark channel feeding up into a prominent horn-like westward traveling surge (WTS) structure (purple annotation in last row of images). The auroral breakup disturbance displays a small degree of expansion (poleward and azimuthally) but as with the other pseudo-breakups (PBs), its occurrence does not alter forms or activity poleward of it (and hence also cannot have engaged lobe reconnection). At ∼06:58 UT (Figure 3), a substorm associated with an intense poleward boundary activation occurs to the west and this appears to produce a prominent streamer (see yellow annotation). The duskward-skewed substorm developed outside of the FOV of the LR camera, but can be seen in the EC imagery included in the Supplementary Material.
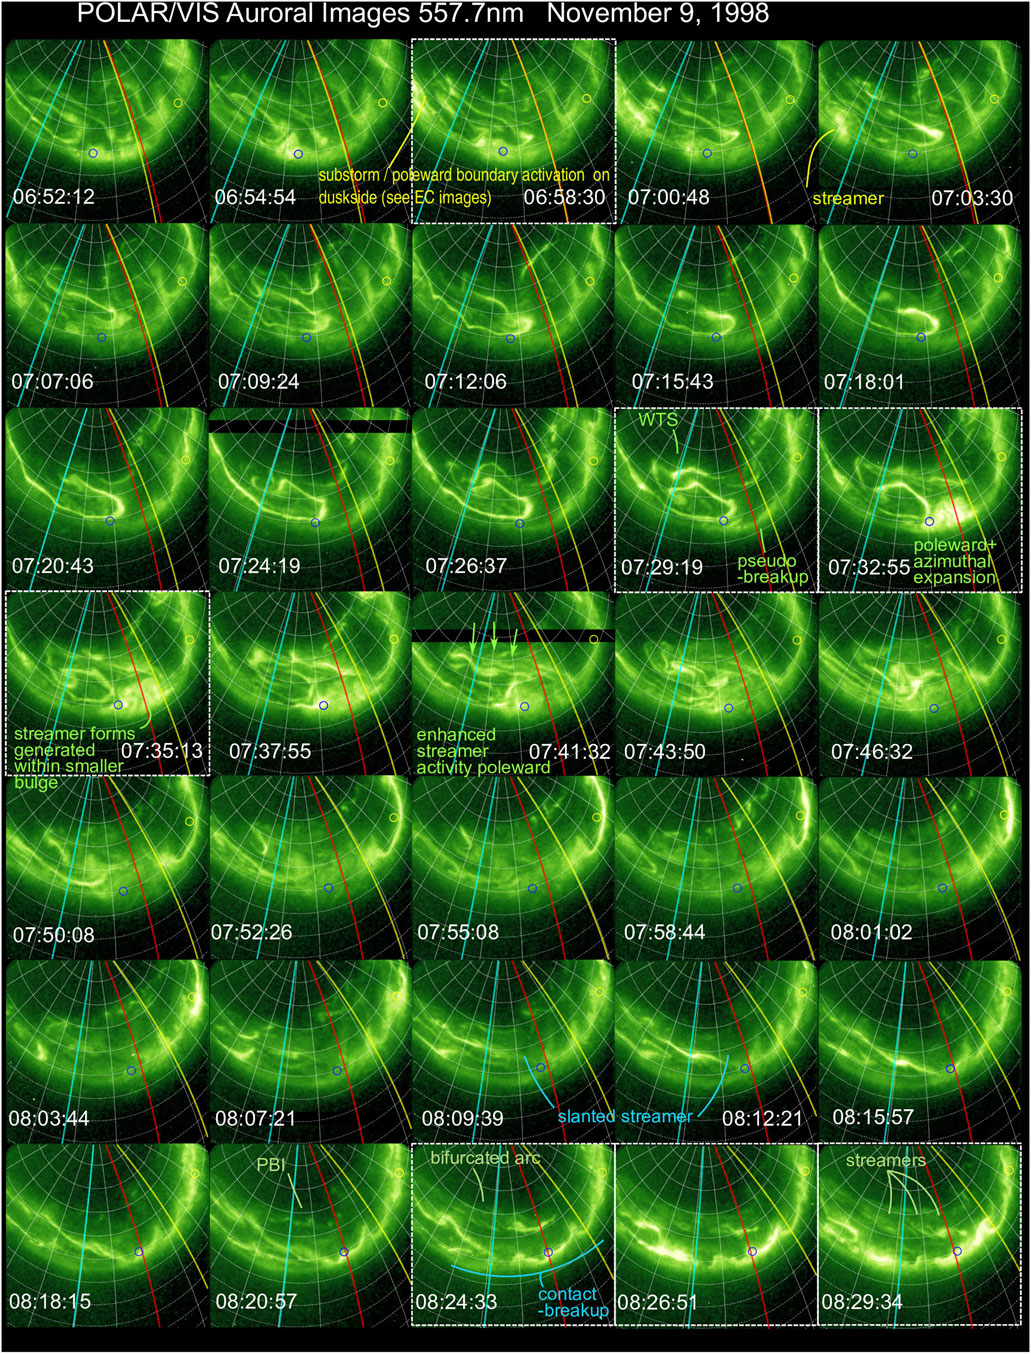
FIGURE 3. Continuation of Figure 2. Images of the Earth’s northern auroral distribution acquired by the Polar VIS/LR auroral imager on 9 November 1998 at a wavelength of 557.7 nm. Magnetic midnight is drawn as a red line and the MLT meridians for Ewa Beach and Boulder are drawn as cyan and yellow lines, respectively.
Figure 3 shows the occurrence of two more pseudo-breakups at ∼07:30 UT and ∼08:24 UT. The first of these also occurred below the prominent WTS form that is visible (see green annotation). This event produced some poleward and azimuthal expansion and developed into a small bulge-like form, but it also failed to propagate up to the O/C boundary and also did not affect much of the other ongoing mesoscale activity occurring elsewhere. However, it is interesting to note that new streamer-like forms can be seen within the small bulge-like form, and we speculate that these may be due to localized reconnection at a near-earth reconnection site that also failed to tap into lobe field lines. Following the PB (pseudo-breakup) disturbance at ∼07:30 UT, enhanced streamer production can be seen emerging from the poleward boundary, especially from within the WTS region (see green annotation in the 07:41:32 UT image).
The second pseudo-breakup, observed in Figure 3, occurred at ∼08:24 UT. This event was clearly preceded by the arrival of a slanted arc-like streamer structure that had descended equatorward over the prior ∼15 min. This type of event appears to be a classic example of a so-called “contact breakup” as first reported by Oguti (1973) and later by others (Nishimura et al. (2010); Lyons et al. (2018)). As with the other PB events discussed so far, this activation was locally confined and also failed to propagate to the O/C boundary. As with the other cases, equatorward propagating streamer activity persisted during and following the activation which continued feeding the torch/omega-band forms at the equatorward part of the auroral distribution. The other event, highlighted in Figure 3 (at 06:58:30 UT), was another highly duskward skewed substorm that can be seen in EC images.
Figure 4 shows the continued development of the northern auroral distribution on 9 November 1998 from 08:33:10–10:17:14 UT. In this sequence of images, yet another episode of a streamer evolving into a torch can be seen, which adds a new Ω to the pre-existing omega-band structure. In the frame at 09:09:53 UT, another slant-like streamer structure can be seen producing a new torch-like structure. By 09:18:29 UT, this torch-like structure grows substantially into a much more poleward-protruding structure. Then, by 09:24:48 UT, the equatorward parts of the auroral distribution explosively brighten and expand poleward and azimuthally until they encompass the entire portion of the oval that is visible. Since this event became global in nature and did appear to propagate to the O/C boundary, it is classified as a full substorm. Also, as shown in Figure 4, after the poleward boundary is reached, copious new streamer production occurs (blue annotation in second to last row), and this is consistent with enhanced reconnection processes that have engaged the lobe field lines. This substorm event was also examined by Henderson et al. (2002), and they noted that since it took ∼25 min between the initial torch formation and the onset, the observations are consistent with a scenario in which the prior streamer/torch generation activity contributed to a destabilization of the inner magnetosphere that finally resulted in the full-blown substorm.
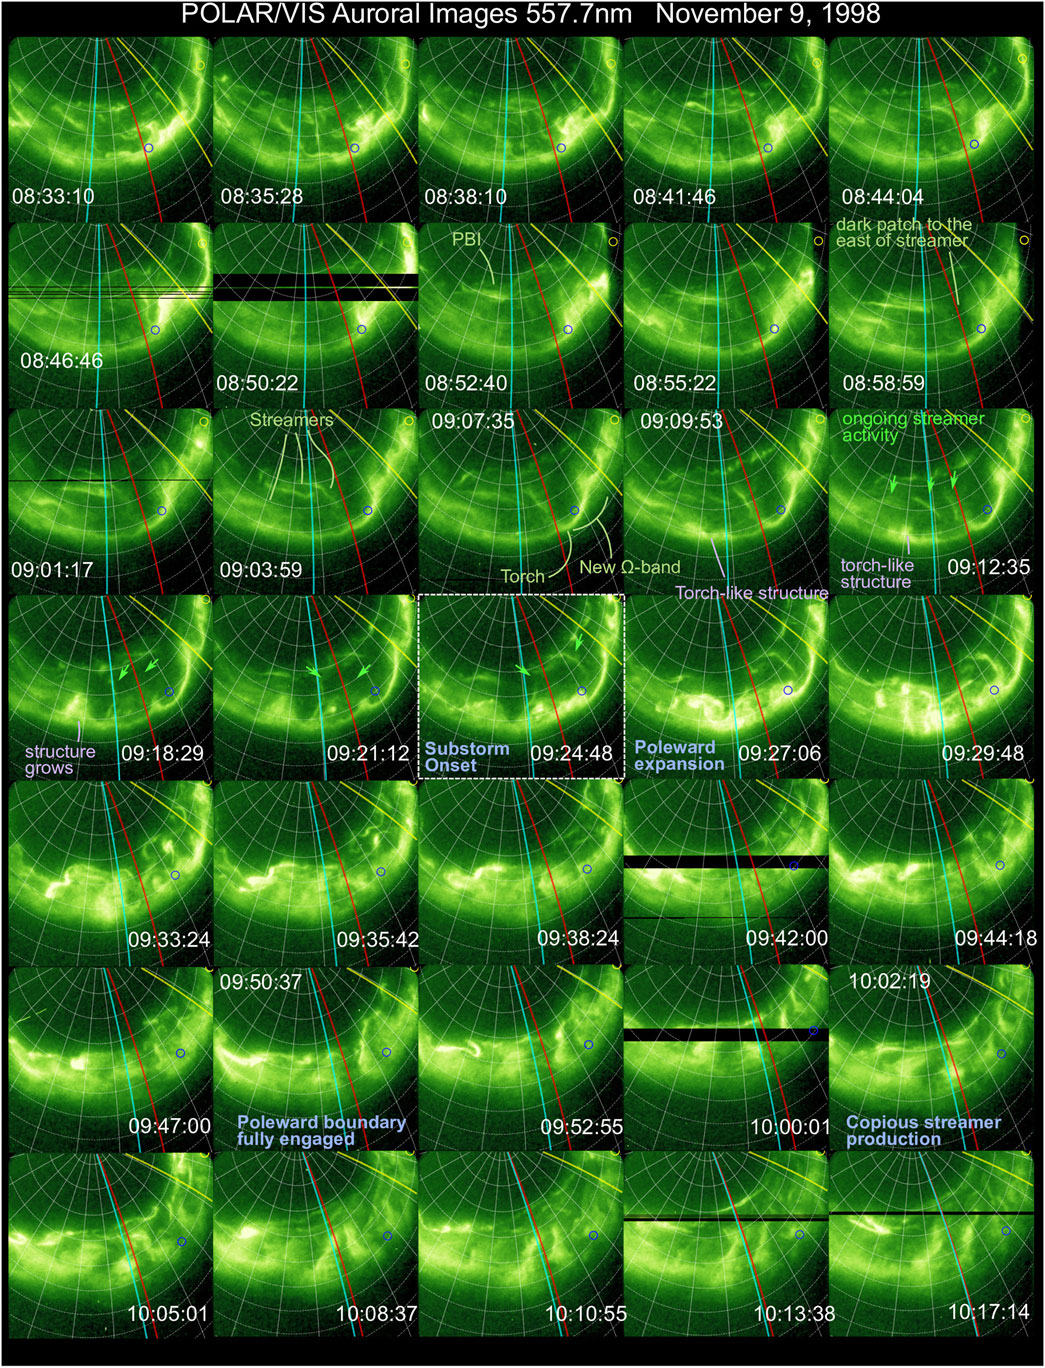
FIGURE 4. Continuation of Figure 3. Images of the Earth’s northern auroral distribution acquired by the Polar VIS/LR auroral imager on 9 November 1998 at a wavelength of 557.7 nm.
Figure 5 shows the continuation of the development of the northern auroral distribution on 9 November 1998 from 10:19:32 to 11:56:53 UT. Over this time period, numerous additional torches are seen to evolve from equatorward-moving streamers, but none of these appear to be associated with PBs. In addition, from the EC imagery (Supplementary Animation S1), no additional breakups were observed outside of the LR FOV.
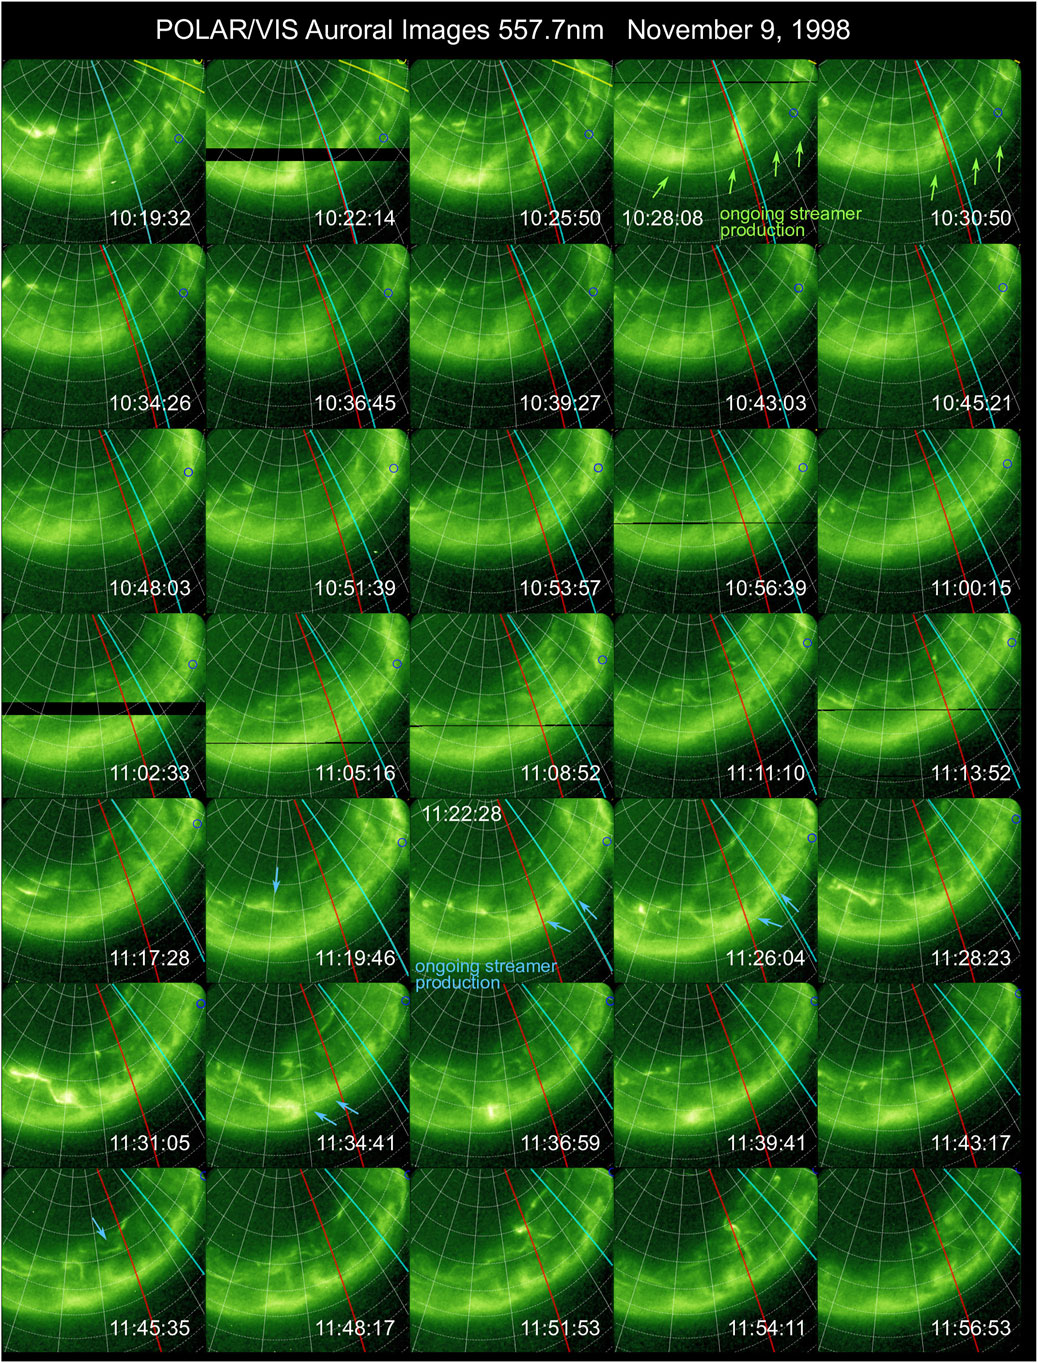
FIGURE 5. Continuation of Figure 4. Images of the Earth’s northern auroral distribution acquired by the Polar VIS/LR auroral imager on 9 November 1998 at a wavelength of 557.7 nm.
Figure 6 shows the continued development of the northern auroral distribution from 12:00:30 UT to 13:40:03 UT. During this time period, a contact breakup was observed in the image taken at 12:43:31 UT, and a full substorm onset was observed at ∼12:57 UT. From the EC images (Supplementary Animation S1), the contact breakup at ∼ 12:43 UT appears to have resulted in a broad brightening across much of the nightside. In the LR images taken at 13:00:44 UT and 13:03:02 UT (Figure 6), this activity appears to have evolved into a fairly well-defined east–west–aligned arc system that spans the lower third of the expanded oval, and we speculate that this could be the luminous signatures of a NENL that has formed. Starting at ∼13:05 UT, this region develops into a poleward-expanding embedded bulge with a WTS at its western edge (see annotation in the 13:09:20 UT image) and expands poleward, eastward, and westward. During this expansion, streamers are ejected equatorward from the poleward edge of the embedded bulge (see annotation in the 13:11:38 UT image), which supports the hypothesis that a NENL is likely formed in the preceding several minute time-frame.
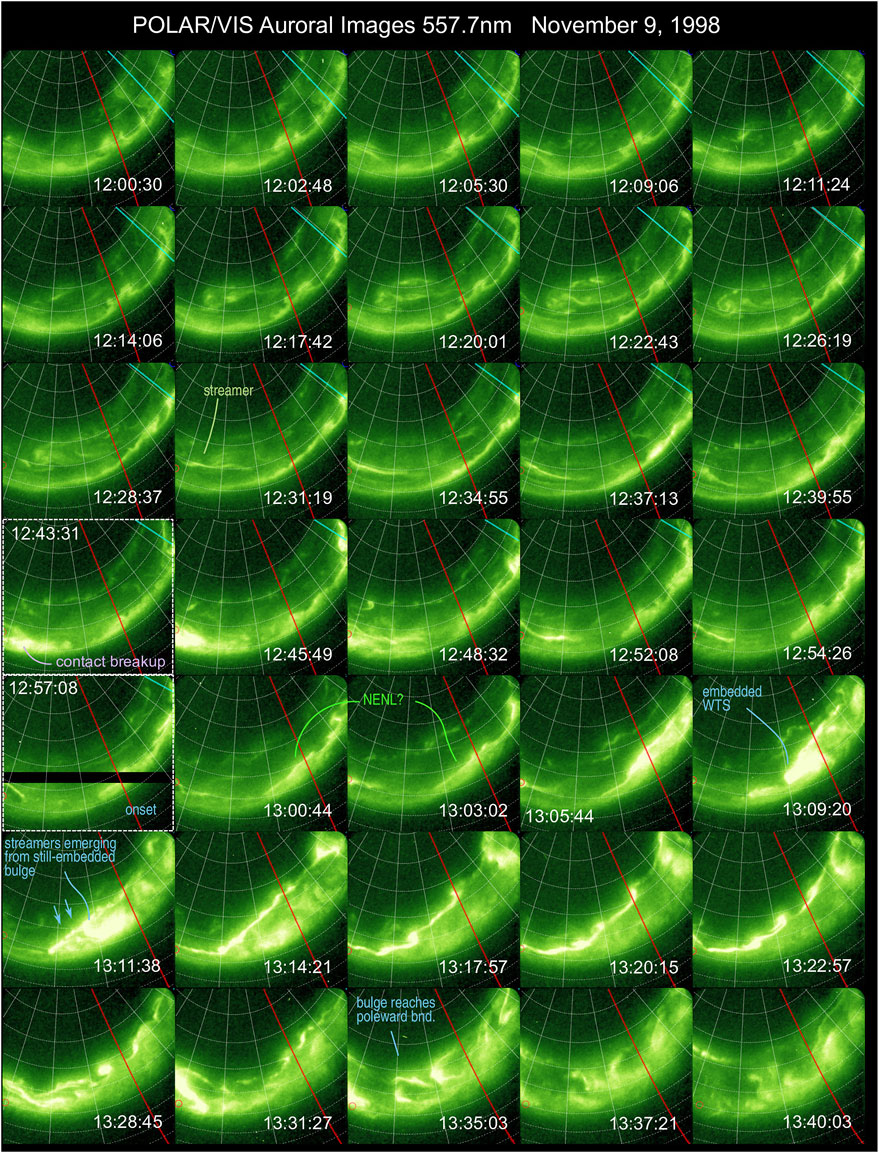
FIGURE 6. Continuation of Figure 5. Images of the Earth’s northern auroral distribution acquired by the Polar VIS/LR auroral imager on 9 November 1998 at a wavelength of 557.7 nm.
To better constrain the timing of the ∼12:57 UT substorm onset shown in Figure 6, additional images acquired with the
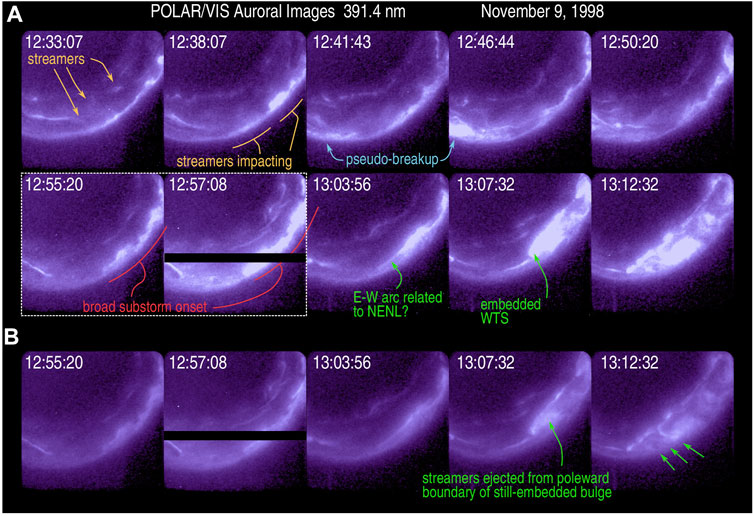
FIGURE 7. POLAR/VIS LR camera images, acquired around the time of the ∼12:57 UT substorm onset, with the
2.3 Statistics of Streamer to Omega-Band/Torch Production
As we have discussed previously, there are exceptionally clear examples showing definitively that streamers can evolve directly into torches that then contribute to the piece-wise assembly of omega-band forms. However, two important questions are: 1) How often does this occur? and 2) can the torches/omega bands form without having evolved from streamers? Since the auroral torch forms constantly drift and evolve in complex ways after their formation, it can be difficult to keep track of them over longer time-scales. In order to shed light on this issue, we have annotated all the streamer and torch structures evident in Figures 2–6 and these are shown as Supplementary Figures S2–S6. It is important to note that while all torches were tracked, not all streamers were tracked. Only those streamers that were seen to propagate substantially toward the equatorward regions of the oval (e.g., those that made it to the lower half of the oval) were tracked. The reason for this is that numerous smaller-scale streamers often occur closer to the poleward edge of the oval and many of these can “fizzle” out before they propagate very far equatorward. While it is still interesting to study such forms, here, we are mainly concerned with streamers (BBFs in the tail) that have a chance to impact the regions closer to the earth where breakups, onsets, and torches are known to map to.
From these annotated figures, it is much easier to compile statistics to address the question of how often torch/omega bands form via streamer impacts and conversely how often streamers evolve into torches. As discussed in the Supplementary Material, 57 torch/tongue events were identified, and it is found that:
• 93.0% of torch/tongue forms evolve from streamers.
• Conversely, 93.0% of streamers arrive in the equatorward regions of the oval-produced torches.
• 10.5% of streamers arrive in the equatorward region of bulge leading to breakups.
• 3.5% of streamers arrive in the equatorward region of bulge leading to substorms.
In other words, for this event, we find that the vast majority of streamers arriving in the equatorward regions of the bulge result in tongue/torch-type structures and only a very small fraction lead to breakups or substorms.
It is important to note that since every streamer was not tracked, the occurrence frequencies for the aforementioned last three bullets could be considered upper limits if we were to consider all streamers. However, the first bullet clearly indicates that for this event, the vast majority (93%) of the torches evolved from streamers and may be considered a lower limit because there is still some ambiguity on a few of the potentially negative cases.
2.4 Geosynchronous Particle Injections
Figures 8–10 show energy versus time spectrograms for electrons and protons at geosynchronous orbit (at 1991–080, LANL-97A, and 1994–084 S/C, respectively). In each plot, the top two panels show data from three different Los Alamos instruments (MPA, SOPA, and ESP) that have been merged together. The energies range from several eV up to the MeV range for each species. Since the fluxes vary over orders of magnitude for this energy range, color spectrograms constructed from the raw data would typically not be able to display dispersion features across the whole energy range. In order to overcome this problem, the data are “detrended” (i.e., “flattened”) across the energy dimension. To do this, for each energy channel (i.e., each row in a spectrogram), a daily “robust average” (of log (flux)) is computed and subtracted from the observed log (fluxes) The average for each channel is computed by sorting the data into ascending order and then using only the middle third of the values, thereby discarding extreme low and high log (flux) values from the averages. The resulting images therefore represent perturbations above or below the nominal log (fluxes). These “perturbation maps” are extremely useful for identifying numerous features in geosynchronous data including dispersed energetic particle injections across the full energy scale. Also, note that, while the energy axis for electrons increases up the page, the energy axis for protons is flipped and increases down the page.
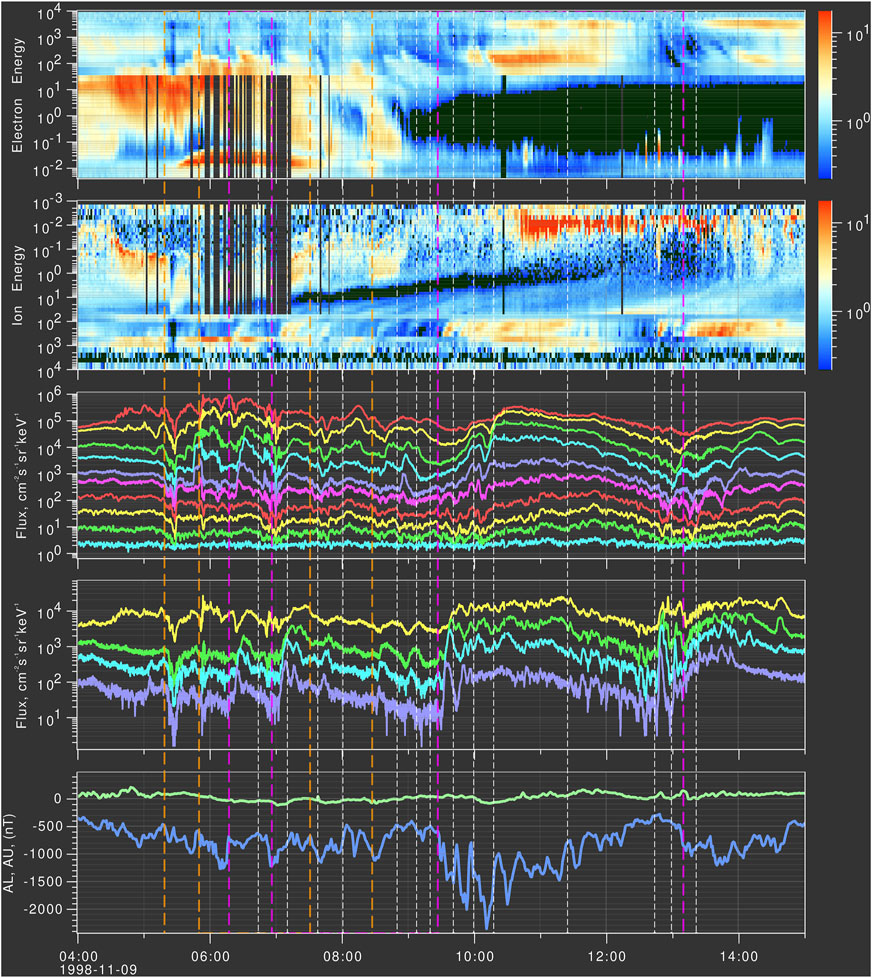
FIGURE 8. Plasma and energetic particle data from the 1991–080 S/C shown in both spectrogram format and as line plots. Injections associated with substorm onsets are highlighted with magenta lines, injections associated with pseudo-breakups are highlighted with orange lines, and other injections are highlighted with white lines.
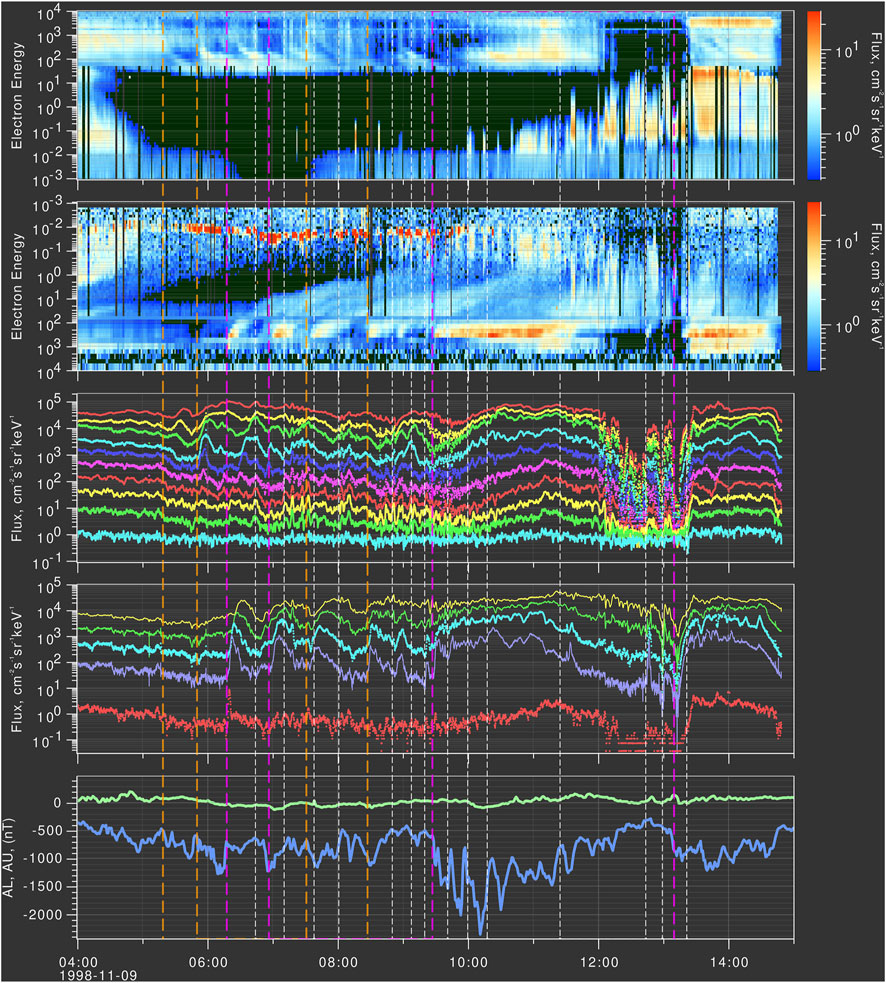
FIGURE 9. Plasma and energetic particle data from the LANL-97A S/C shown in both spectrogram format and as line plots. Injections associated with substorm onsets are highlighted with magenta lines, injections associated with pseudo-breakups are highlighted with orange lines, and other injections are highlighted with white lines.
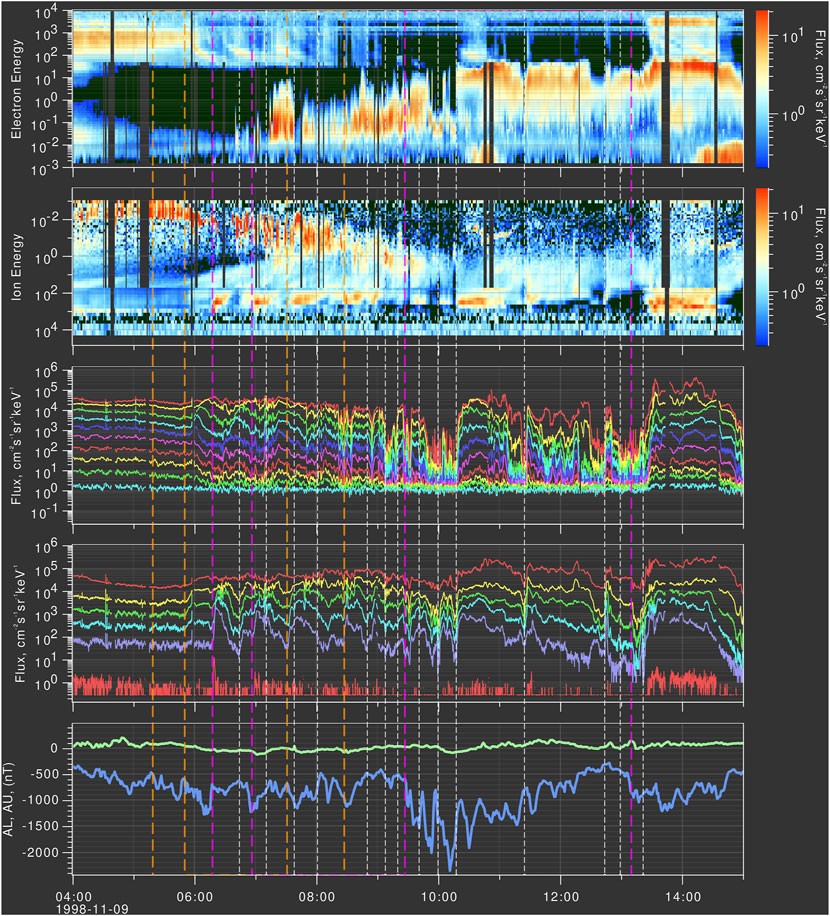
FIGURE 10. Plasma and energetic particle data from the 1994–084 S/C shown in both spectrogram format and as line plots. Injections associated with substorm onsets are highlighted with magenta lines, injections associated with pseudo-breakups are highlighted with orange lines, and other injections are highlighted with white lines.
In order to show how the “perturbation map” spectrograms relate to the standard line-plot style often used to present GEO EP data, the electron and ion fluxes from the SOPA instrument are also shown in Figures 8–10. An immediately obvious feature of the 1991–080 ion line plots in Figure 8 is that this event displayed a sawtooth-like character with variable inter-tooth times (∼1h to ∼2–3 h).
From the spectrograms in Figures 8–10, we observe that a quasi-periodic sequence of injections occurred at about 5:30–6:00 UT. These injections can be seen as energy-time dispersed bands in both the electrons and protons, but are most obvious in the high energy proton channels. At lower energies, the dispersed signatures of the ion injections become very broad and can be seen for many hours in the spectrograms. For example, the injections seen between ∼6 and 7 UT in Figure 8 can be seen at progressively lower energies for hours afterward. As the spacecraft gets closer to the injection region, the injections become less dispersed and we can observe that the same ∼6–7 UT injections are less dispersed at LANL-97A (which was at later MLTs) and even less so at 1994–084 (which was at even later MLTs). Another feature that is immediately exposed in the energy vs. time spectrogram is the frequent occurrence of small local dispersionless fluctuations across the entire energy range (even when the observing S/C is far away from the injection region). These are likely due to local field fluctuations which can occur even on the dayside (especially during storms).
Although the LANL detectors were situated on the dayside during much of this event, this observing configuration is desirable in that true injections (resulting in drifting populations) can be observed away from the obfuscating effects of chaotic local field fluctuations on the nightside. In addition, the “true” injection times can still be determined accurately because the proton dispsersion signatures asymptotically approach a clearly observed limit at high energies. Since the time of arrival is approximately linearly related to 1/E, the injection times from observations of dispersed injections can be determined by first fitting the energy-dependent arrival times versus 1/E and then taking the injection time as the y-intercept, where 1/E = 0 (i.e., the time of arrival for “infinite-energy” particles). Here, the arrival time in a given energy channel is the first increase in flux and the energy is the highest energy in the energy bin. When a S/C is embedded within the injection region, the injections are often dispersionless, which can make timing easier, but unfortunately, local field fluctuations often make those timings more ambiguous.
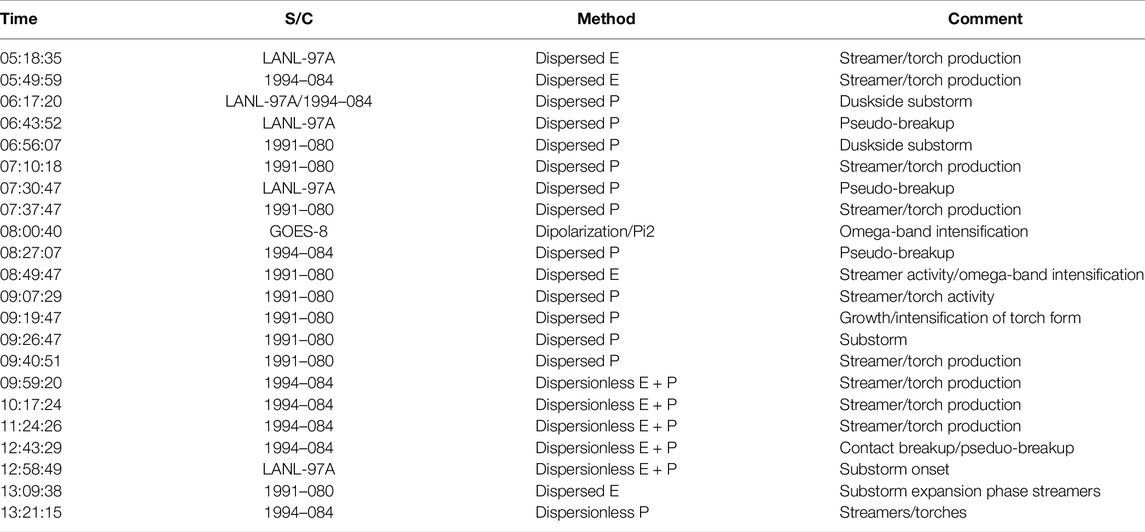
Using this methodology, the times for 21 injections were determined from the LANL GEO data and are listed in column 1 of Table 1. The spacecraft, particle species, and timing method used are given in columns two and three. An additional time was added based on dipolarization and Pi2 signatures at GOES-8 because local field fluctuations in the LANL GEO data prevented reliable timing for that injection. All of the injection times in Table 1 have been plotted in Figures 8–10.
2.5 Association of Particle Injections With Magnetometer and Auroral Data
Magnetometer data from GOES-10 and GOES-8 are shown in Figure 11, along with low-latitude ground magnetometer data from Ewa Beach, Hawaii, and the P2-P5 proton fluxes from 1991 to 080, LANL-97A, and 1994–084. The Pi2-filtered Bygsm components at GOES-10 and GOES-8 and the field tilt angle (here defined as
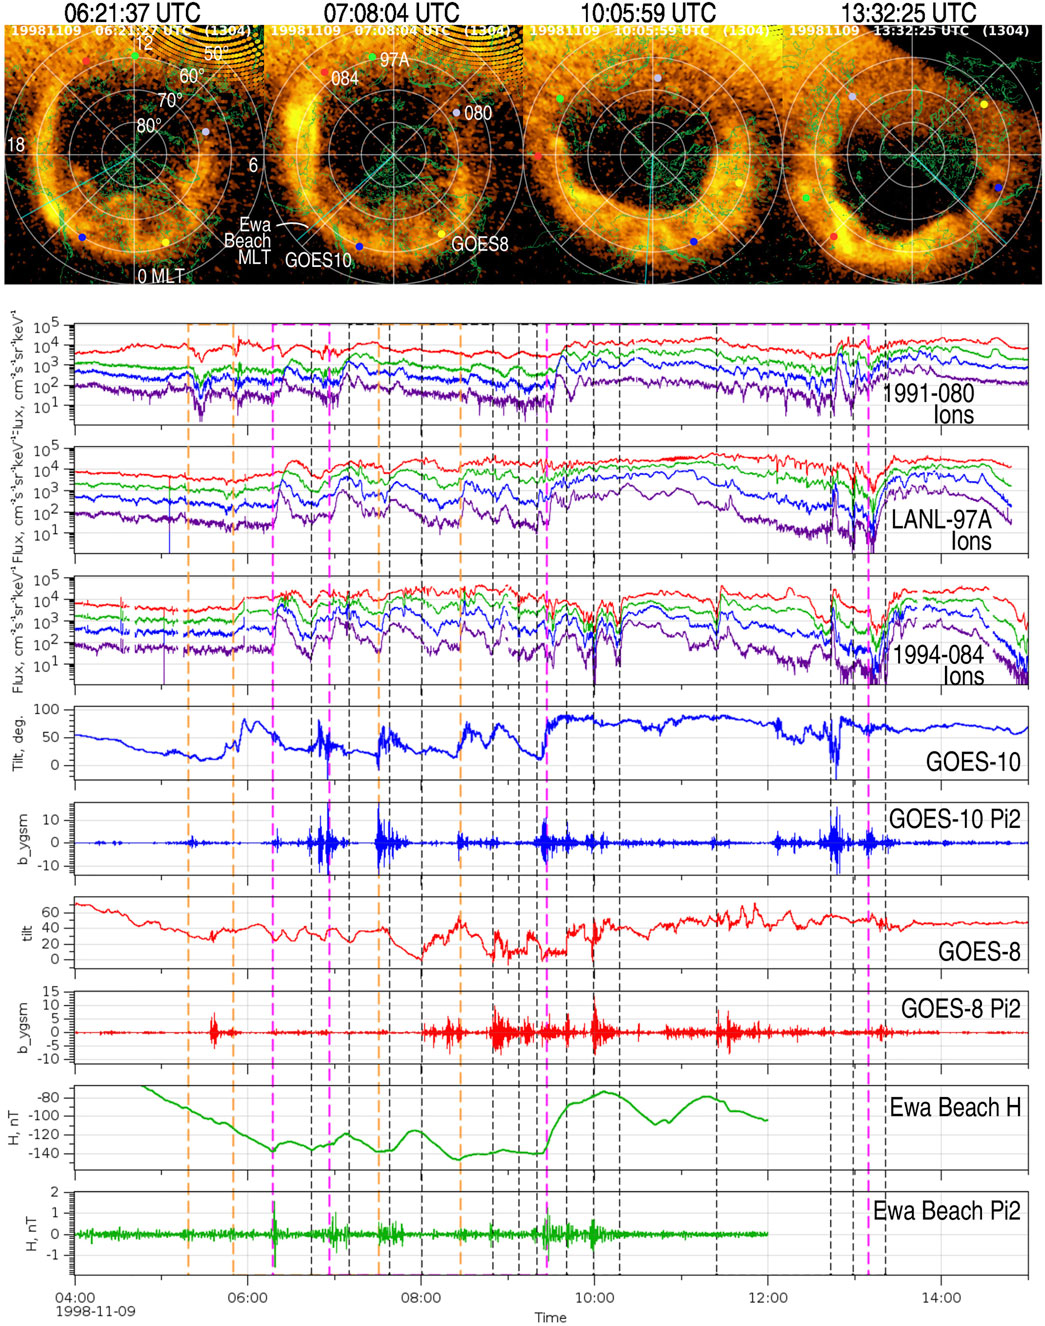
FIGURE 11. LANL GEO/SOPA protons at 1991–080, LANL-97A, and 1994–084 spacecraft together with magnetic field tilt angles at GOES-8 and GOES-10 and the H-component magnetometer data from Ewa Beach Hawaii. Pi2 bandpass (40–150s) filtered data are also shown for GOES-8, GOES-10, and Ewa Beach. Injections associated with substorm onsets are highlighted with magenta lines, injections associated with pseudo-breakups are highlighted with orange lines, and other injections are highlighted with white lines.
In Figure 11, the dashed vertical lines have been drawn at the injection times shown in Table 1. As expected, many of the particle injections appear to be associated with a dipolarization and a burst of Pi2 pulsations in the nightside near-earth magnetosphere. The Ewa Beach magnetometer data (lower two panels of Figure 11) show that there was a good general correlation between some of the injections and the occurrence of a low-latitude Pi2 pulsation and a positive H-bay.
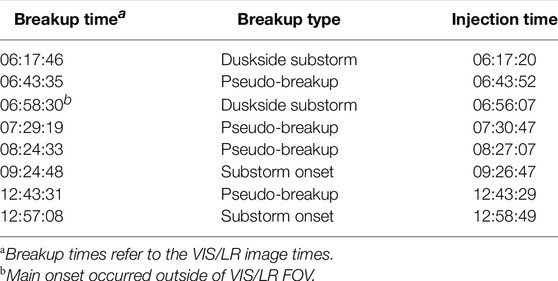
From the auroral data presented, it is clear that the events identified as breakups (PB and substorm) were all associated with injections, and these types of auroral disturbances were associated with all of the sawtooth-like proton flux increases seen in Figures 8–10. Table 2 lists all of the auroral breakup times together with the associated injection times. The 06:17 UT and 06:56 UT injection times were associated with dusk-skewed substorms, the 07:37 UT injection was associated with enhanced streamer production, and the 08:49 UT injection was associated with an intensification of the omega-band forms as shown in Figure 4. This may have been a type of PB, but it was not very localized. The other injections observed in the LANL data also appear to be related to many of the auroral events that have been discussed in the previous section and we have added a comment in Table 1 to highlight these apparent associations.
It is also interesting to observe what isolated streamers outside of breakup times correspond to in the LANL GEO particle data, although this is somewhat difficult because there are so many individual streamers present in the auroral data and it is not clear how to define a precise time for them. Nevertheless, from Figures 4, 5 we can observe that the time period between 10 and 12 UT was dominated by streamer/torch production, with no obvious breakups. Until about 10:30 UT, streamers from the preceding substorm were still forming and then another intense period of streamer/torch production started up at about 11:17:28 UT. Multiple injections were observed during this time period at 09:40:51, 09:59:20, 10:17:24, and 11:24:26 UT. Although the first three of these are likely related to late expansion/recovery phase streamer production from the prior substorm, the 11:24:26 UT injection appears well-correlated with the relatively intense streamer seen in the 11:22:28/11:26:04 UT images. Most of these were also associated with Pi2 pulsations, but were not obviously associated with any major low-latitude positive H-bays at Ewa Beach.
Overall, the most intense injections were correlated with the breakup-types of auroral disturbances (pseudo-breakups and substorms), while there were many additional smaller “injection-lets” that may well be related to the numerous streamers/torch events produced throughout the storm. To distinguish injections associated with different auroral types, the time lines drawn on Figures 8–11 have been color coded: magenta for substorms, orange for pseudo-breakups, and white for other types.
Note that smaller “injectionlet” signatures were seen prior to both the 09:27 and 12:59 UT substorms. For the 12:59 UT substorm, the injectionlet immediately preceding the substorm was most closely associated with a contact breakup (e.g., of the type described by Oguti 1973; Lyons et al., 2018). For the 09:27 UT substorm, the injectionlet immediately preceding the substorm was most closely associated with the growth of a torch structure that was formed a few minutes earlier and was likely fed by a similar slanted contact breakup type arc. This precursor event was also studied by Henderson et al. (2002). However, it is interesting to note that in both cases, there was a substantial delay between the precursor injection and the development of the full substorm; more than 7 min for the 09:27 substorm and
3 Discussion
A detailed analysis of mesoscale auroral dynamics during the 9 November 1998 storm has been presented. The observations unambiguously show that auroral streamers can evolve directly into torches and omega bands, and that once formed, the torches and omega-band structures can continue to evolve. This is in complete agreement with previous studies (Henderson et al. (2002); Henderson (2012); Forsyth et al. (2020)). Since auroral streamers are now generally thought to be the ionospheric projection of (the upward FAC components of) bursty bulk flows (BBFs) in the tail, their evolution into torches and omega-band forms implies that omega bands can be generated by earthward-directed BBFs. Note that this does not imply that every part of an omega band is necessarily generated in this manner and there may well be additional processes at work that could also contribute to their formation and/or subsequent evolution. Nevertheless, for this event, we estimate that 93% of the torch/tongue features evolved from streamers, 93% of streamers that arrive in the equatorward regions of the bulge produce torches, 10.5% of such streamers lead to breakups, and only 3.5% led to substorms.
We have also demonstrated that auroral breakups can occur in the equatorward regions of the auroral distribution that are embedded within these complex ongoing PBI/streamer/torch/omega-band dynamical processes. These can either lead to full substorms or they can be quenched and remain localized disturbances, in which case they are considered pseudo-breakups.
3.1 Streamer Dynamics as a Physical Mapping Tool
Since auroral streamers can be used to infer the locations of flow bursts in the ionosphere, a detailed examination of where they begin and how they evolve relative to other auroral features can be used as a powerful indirect (or “physical”) mapping tool. In this type of mapping, the idea is to understand which auroral features map to specific physical regions, boundaries, or processes in the tail rather than attempting to map their locations along (typically incorrect) models of the magnetic field.
Perhaps the most fundamental physical mapping that can be performed in this manner is illustrated in Figure 12. As discussed previously, the occurrence of an equatorward moving auroral streamer can be used to infer that an earthward moving BBF occurred in the tail (Henderson (1994); Henderson et al. (1998)). In addition, it is generally thought that BBFs are generated by locally enhanced reconnection at a reconnection site in the tail (via the production of localized entropy-depleted bubbles which propagate earthward due to buoyancy forces). Given this physical constraint in the tail, the streamers in the ionosphere must therefore emerge from features that are related to the reconnection site.
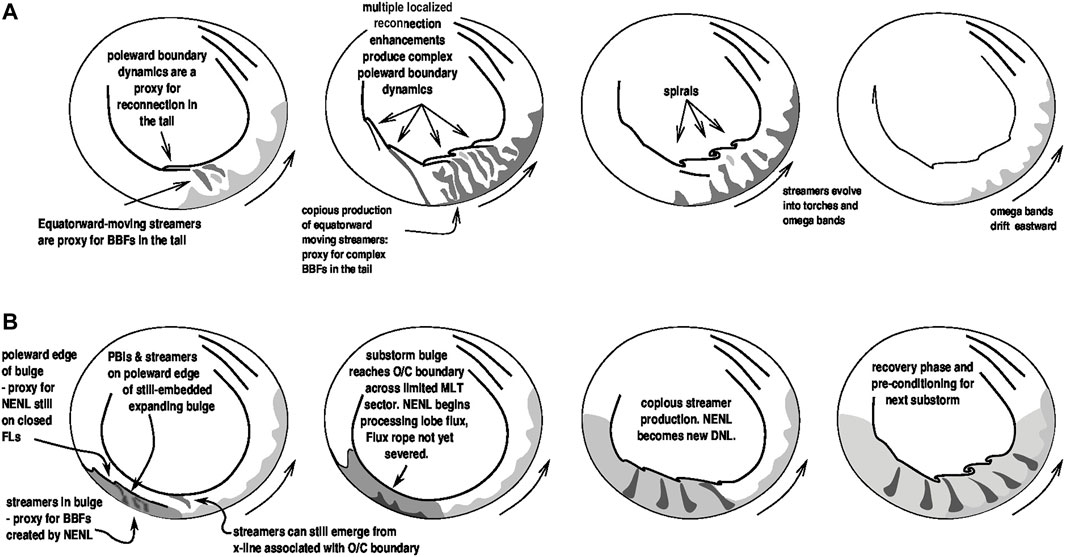
FIGURE 12. Schematic illustrating how reconnection and associated BBF production at the NENL and the DNL may be associated with auroral features. (A) Reconnection and meso-scale BBF production at DNL. (B) Reconnection and meso-scale BBF production at NENL and at DNL.
Figure 12A illustrates how streamers break away from the most poleward arc system. Typically, the arc system brightens (i.e., a PBI) and splits or bifurcates in association with a step-wise poleward motion of the upper arc and an equatorward collapse of the lower portion together with the formation of a streamer form (Forsyth et al., 2020). Using the physical mapping logic, the emergence of the streamers from the poleward arc system implies that this feature is related to a reconnection site and that the observed poleward boundary dynamics is related to the localized enhanced reconnection processes. Since this most poleward arc system is likely adjacent to the open/closed boundary, the reconnection site in this case is likely to be the distant neutral line (DNL) (as discussed by Henderson (2004), which may reside anomalously close to the Earth for extended periods of time during storms and SMCs). Also shown in Figure 12A is the case where numerous such PBI/streamer (reconnection/BBF) episodes occur in close temporal proximity, but at different azimuthal locations, and it is also shown how streamer forms can evolve into torches and omega bands.
Figure 12B illustrates the development of a substorm in the pre-midnight sector. In the first frame, the bulge is shown still fully embedded on closed field lines, that is, it has not yet reached the O/C boundary poleward of it. Also shown within the expanding substorm bulge are new streamers being ejected equatorward from its poleward edge, particularly near the western region of the poleward edge association with the WTS. This is precisely the type of dynamics shown in Figure 7. Using the physical mapping logic in this case implies that the new streamers are new BBFs in the tail and that they should emerge from a new reconnection site. In the tail, this reconnection site would be the NENL (i.e., the substorm NL) and in the ionosphere, it must map to the poleward boundary of the bulge because that is where the streamers are emerging from.
3.2 Importance of Azimuthal (Cross-Tail) Scale-Size of Streamers
BBFs are localized in the cross-tail direction to
As the BBFs brake in the near-earth region, it is thought that they expand substantially in the azimuthal direction, and as they dipolarize, they produce flux pileup. This process is widely assumed to be a direct cause of substorm-bulge azimuthal and poleward expansion (Kepko et al. (2015); McPherron and Chu (2016)). However, the data presented here are somewhat at odds with this scenario. As can be seen repeatedly during the 9 November 1998 event, when streamer → torch events do not lead to breakups (which is the case for the vast majority of them), they do not display characteristics of bulge-like azimuthal/poleward expansion. Instead, the streamers tend to evolve into eastward drifting torches to become additional components of irregular omega-band structures. BBFs/streamers still likely play a critical role in the formation of substorm bulges, as we will discuss in the next section.
3.3 Substorm Current Wedge, Flow-Braking, and Poleward Expansion of the Bulge
In the standard “outside–in” model of auroral substorm initiation, it is the braking of the BBFs in the near-earth region that leads to dipolarization, Pi2 generation, current wedge formation, and the poleward expansion of the bulge as the dipolarized flux pileup region propagates tailward (Kepko et al. (2015); McPherron and Chu (2016)).
However, as discussed in the previous section, a major problem with the flow-braking model of poleward expansion of the bulge is that new PBI/streamer activity is often observed emerging equatorward from the poleward edge of the expanding bulge, even before it gets to the open/closed boundary. This type of behavior can be seen in the image acquired at 09:27:06 UT in Figure 4, in the small-scale bulge produced by the ∼07:30 UT pseudo-breakup (see images acquired at 07:32:55 and 07:35:13 UT in Figure 3), and in the expanding embedded bulge seen at 13:11:38 UT in Figures 6, 7. If the region everywhere within the bulge corresponds to a flux pileup region in the tail, it is puzzling why new streamers would simultaneously get ejected from the poleward edge of the bulge into this putatively already dipolarized region. On the other hand, as pointed out previously, this type of behavior is very easy to explain if the poleward-propagating edge of the bulge were linked with a near-earth reconnection site instead of being the consequence of flux pileup.
In addition, we note that the vast majority of BBFs impacting the inner magnetosphere do not lead to such auroral effects since their ionospheric counterparts (auroral streamers) do not. This seriously unexplained aspect of the traditional flow-braking model of bulge growth was also pointed out by Henderson et al. (2002), and they proposed that rather than causing poleward-expanding substorm bulges, the most common auroral manifestation of flow-braking may just be the evolution of streamers into torches/omega-band tongues that broaden and become firmly rooted in the equatorward region of the oval (and also drift eastward).
3.4 Do Streamers (Earthward Flow Bursts) Trigger Breakups?
Although there is a growing consensus that the answer to this question is “yes” (Kepko et al. (2009); Nishimura et al. (2010, 2014, 2016)), observations such as those presented here indicate that the answer is more nuanced than is generally appreciated. Although there are clearly cases where breakups appear to be preceded by the arrival of “streamer-like” forms ((Oguti 1973; Henderson et al., 2002; Nishimura et al., 2010; and the current study), it is also certainly true that the vast majority of auroral streamers do not yield such contact breakups. Thus, the process of an auroral streamer (a BBF in the tail) arriving at the equatorward regions of the oval (BBF impacting the inner magnetosphere in the tail) cannot by itself lead to the two disparate outcomes (breakup and no-breakup) without an additional ingredient.
In addition, there can be a substantial delay observed between the arrival of a streamer and a subsequent auroral breakup. For example, the 09:24 UT substorm onset shown here was preceded by the arrival of a streamer and the subsequent growth of a torch-like structure ∼15 min earlier and its growth/intensification
Furthermore, it is important to note that streamers of varying size and intensity were also seen at other locations leading up to the breakup (and this is quite common) (for annotated examples of this, see Supplementary Figure S1 in the Supplementary Material). Since structured flows of many different scale-sizes and speeds in the tail are likely to produce some type of auroral signatures at their duskward edges, it may well be that some of these features are simply luminous signatures of less bursty “background convection” in the tail. In cases where only slowly equatorward-moving forms are observed, these may merely serve as a visual proxy for slower-moving larger-scale (non-BBF) earthward flows. Thus, an association between slowly moving weaker forms and new breakups may then essentially be the same thing as the well-known growth-phase element of the substorm cycle (i.e., an interval of enhanced convection destabilizes the tail and produces a substorm), and weak/slower equatorward-moving forms may merely be showing us that such convection is occurring. It is important to note, however, that slower-moving auroral forms in the ionosphere may not necessarily mean that associated flows in the tail are similarly slow if the motions in each location are significantly decoupled.
From the results presented here and elsewhere, it is apparent that there is no one-to-one association between the development of new breakups and the arrival of auroral streamers. Instead, there appears to be a much more complex range of scenarios possible as illustrated in Figure 13. In panel A, auroral streamers evolve into torches and omega bands and do not lead to any new breakups. In panel B, a new breakup occurs delayed and away from previous streamer impact sites. In panel C, a new breakup emerges from the site of a streamer impact and can also be delayed somewhat. In panel D, a breakup occurs when a “slant arc” or “slant streamer”–type structure sweeps over the breakup site. Panel E illustrates that any of these breakups has the potential to evolve into a full substorm. The examples of all of these different pathways are evident in the data presented here.
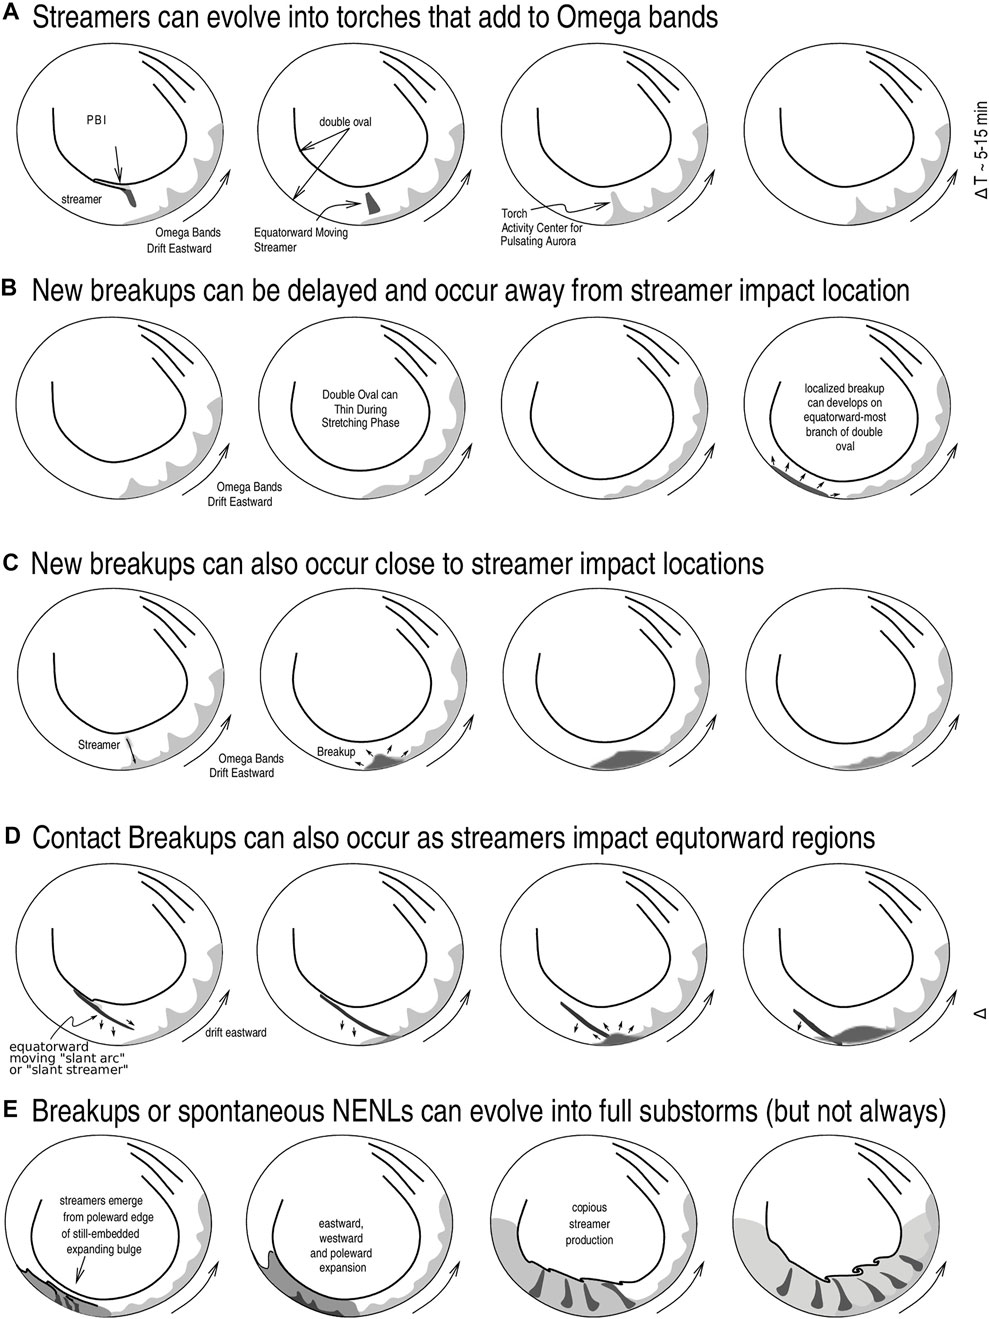
FIGURE 13. Schematic showing how streamers, torches, pseudo-breakups, and substorms can evolve. The panels show: (A) streamers emerge from poleward boundary intensifications (PBIs) and descend equatorward to form torch structures, which adds Ωs to pre-existing omega bands; (B) new breakups can occur in the equatorward regions several to tens of minutes later; (C) new breakups can occur close to the location to the original streamer impact; (D) contact breakups occur when the breakup occurs immediately as the streamer contacts the equatorward boundary; (E) breakups produced by whatever means or spontaneous NENLs can evolve into full poleward-expanding embedded substorm bulges.
The most obvious way to reconcile the diversity of outcomes following streamer impacts is that in addition to the normal convection-induced destabilization of the tail, faster structured flows (i.e., BBFs) can either 1) lead to a more prompt destabilization or 2) provide structured deformations of the inner magnetosphere that could allow other pre-conditioning instabilities to develop first (e.g., azimuthal wave modes such as KHI or shear flow/buoyancy-related instabilities). In all of these cases, the initial destabilization could result from either the spontaneous development of a NENL first (the “outside–in” model) or from the development of an inner magnetospheric instability first which leads to favorable conditions for a NENL to form farther downtail (the “inside–out” model). These different evolutionary pathways are illustrated in Figure 14.
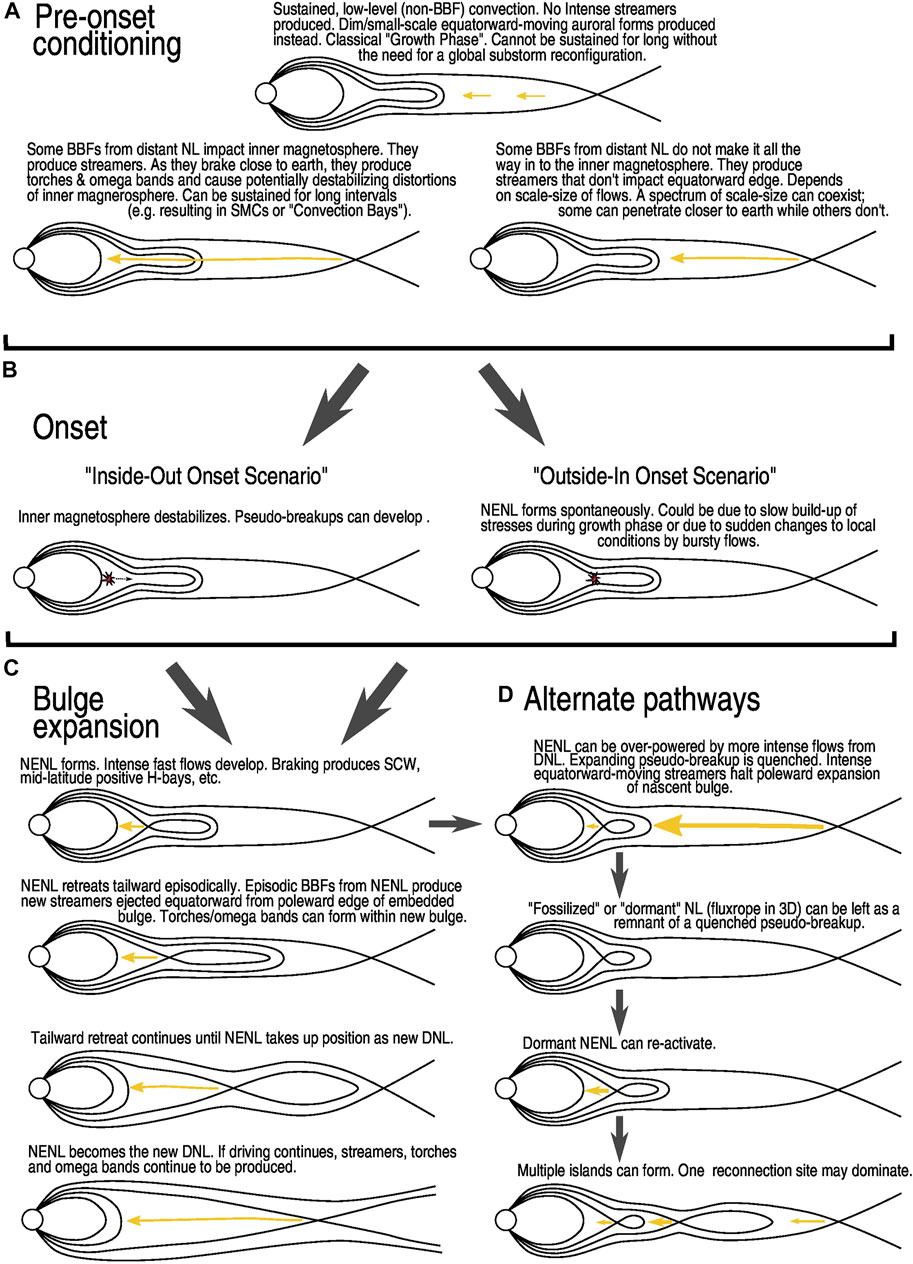
FIGURE 14. Schematic illustrating a unified model that incorporates the “inside–out” and “outside–in” onset scenarios. Note that all of these structures are inherently 3D (flux ropes) and that they are likely limited in azimuthal extant. (A) A variety of convection-driven pre-conditioning scenarios are shown (including slow “growth-phase” destabilization and more prompt distortion/destabilization via earthward penetrating BBFs); (B) onset could result from spontaneous formation of a NENL or it could be the result of a disturbance/instability propagating tailward from closer to the earth; (C) bulge expansion is nominally due to episodic reconnection events that progressively propagates to the lobe field lines (either tailward retreat of reconnection in-place could accomplish this); (D) alternate scenarios that could explain quenched pseudo-breakups. Note that the multiple x-lines in the bottom right panel are likely to be constrained in cross-tail size and are probably also located at different (but potentially overlapping) cross-tail positions.
3.5 Why do Only Some Breakups Evolve Into Full Substorms?
Not only does the scenario described previously explain why poleward expansion often progresses in a step-wise manner coupled with equatorward ejection of new streamers (Henderson 2012; Henderson, M. 2021) (Figure 14C), it also provides a plausible explanation for why some breakups are quenched while others expand into full substorms (i.e., the third question listed previously). Breakups that are quenched (and hence are pseudo-breakups) can arise when either 1) the initial instability does not progress toward the development of a new NENL or 2) a new NENL forms but cannot overcome potentially stronger flows from a reconnection site farther downtail. The second scenario is consistent with the 07:30 PB in Figure 3 during which enhanced streamer activity was evident poleward of the nascent bulge. It is also consistent with reports that “fossilized” near-earth x-lines can be pushed earthward by stronger flows from more vigorous reconnection sites downtail (Eastwood et al., 2005). The second scenario is illustrated schematically in Figure 14D, which also shows that an additional alternate scenario could arise whereby a “dormant” fossilized flux rope could subsequently reactivate (and potentially grow to a full substorm).
3.6 How Are the Auroral Features Related to Particle Injections?
With regard to the fourth question listed previously (which of the mesoscale structures are related to the particle injections?), the observations reported here show that the stronger and more energetic injections occurred in association with the breakup events. Numerous weaker particle “injectionlet” events were also observed throughout the event and these may well have been associated with isolated streamer events.
Over the past few decades, a major unresolved question has been whether or not the large classical particle injections routinely observed at geosynchronous orbit can be explained as an overlapping effect of particle energization via multiple earthward fast flows during the expansion phase. In other studies, it has already been shown that intense multiple streamer production can indeed produce classical injection signatures at geosynchronous orbit even in the absence of any classical auroral substorm onset signatures (Henderson 2012). In addition, numerous other observational and modeling studies have demonstrated that isolated streamers or flow bursts can energize particles as they propagate earthward (Henderson et al., 1994, Henderson et al., 1998; Sergeev et al., 1999; Runov et al., 2009, Runov et al., 2011; Yang et al., 2011; Sergeev et al., 2012; Gabrielse et al., 2012, Gabrielse et al., 2016). Nevertheless, in the study by Sergeev et al. (2012), it was found that for flow bursts detected at 8–13 Re, only a small portion of them were associated with EP injections at GEO. BBFs that did not produce EP injections at GEO tended to have smaller values of the plasma tube entropy parameter (PVγ) and smaller ΔBz values. Sergeev et al. (2012) suggested that the degree of stretching at GEO in addition to the background values of PVγ are critical parameters that control whether such flows can penetrate to GEO. It is interesting to note, however, that even if BBFs are unable to penetrate to GEO to produce dispersionless injections there, dispersed injections should still be detectable, particularly at lower energies since those particles have access to GEO. Although additional work needs to be done in order to determine if this is the case, for the present storm-time study, based on computed magnetic footpoints of the LANL and GOES S/C, it appears that many (but not all) of the streamers did penetrate to GEO.
A major finding of the present study is that it is the explosive (breakup-like) events that tend to give the stronger injection signatures, while weaker injectionlet signatures may be associated with the isolated streamers (although for the latter, a one-to-one correspondence is difficult to establish because there are many isolated streamers typically present). This naturally raises the question: What feature of the breakups is it that is associated with these injections? We propose that stronger injections are produced by intense earthward flows that are generated within the nascent bulge forms as soon as a NENL is formed near their poleward boundary. Such a reconnection site may form as a consequence of a pre-conditioning instability (e.g., ballooning) or it is possible that it could form spontaneously (however, in this case the initial brightening would likely be somewhat more poleward to start with). In this scenario, the poleward expansion of the bulge is not caused by flow braking but rather by sequentially step-wise tailward progression of the reconnection site. Flow braking would still occur within the growing bulge and lead to all of the effects normally attributed to it including mid-latitude positive H-bays, flux-pileup and dipolarization, current wedge formation, and particle energization, but it is due to the intense flows emerging from the poleward boundary of the bulge (not from poleward of the bulge). A major consequence of this scenario is that the pre-existing equatorward moving streamers mainly contribute to torch and omega-band production and also may serve to destabilize the inner magnetosphere to the point where the onset of new breakups is viable. This could require multiple impacts from streamers (flow bursts) across the nightside or it could occur promptly after only a single such impact.
Such a scenario naturally explains why the explosive breakup-type events were associated with stronger energetic particle injections and significant positive H-bays as shown in Figure 11. We note that this scenario is completely consistent with an “inside–out” onset mechanism if transient inner magnetosphere instability activates first and leads to a NENL (Henderson (2009)) or an “outside–in” onset mechanism if the NENL spontaneously activates first (or was already established by a previous episode of activity such as the 12:57 UT event shown in Figures 6, 7). However, in either case, the activity is often embedded within an expanded and active oval as in the case presented here (Henderson (2016)).
4 Conclusion
A detailed analysis of the development and evolution of mesoscale auroral structures and their association with energetic particle injections at geosynchronous orbit during the 9 November 1998 storm has been presented. A summary of results are listed here:
• The explosive types of auroral activations, such as pseudo-breakups and substorm onset breakups, are associated with the more intense and well-defined dispersed injection signatures, intervals of isolated streamer activity appear to be associated with smaller dispersed “injectionlet” signatures, and intervals of sustained intense post-onset streamer activity appear to be associated with sustained elevated dispersed particle fluxes. These results are consistent with the hypothesis that it is the aggregated overlapping effects of sustained, intense multiple flow bursts penetrating toward the Earth that result in classical substorm particle injection signatures at geosynchronous orbit. It is important to recognize that such streamer/BBF activity can emerge from poleward boundaries associated with either the still-embedded expanding substorm bulge or at the most poleward boundary adjacent to the O/C boundary, and that for full substorms, the poleward edge of the expanding bulge eventually morphs into the latter boundary.
• A total of 57 auroral torch structures were identified and tracked and it was found that 93.0% formed as a result of a prior streamer impact in the equatorward regions of the oval.
• Conversley, 93.0% of streamers arriving in the equatorward regions of the oval produced torches (note that some streamers did not appear to produce clear torches, while some torches were not clearly associated with evolution from streamers. The ratio here is only coincidentally the same as the prior statistic).
• 10.5% of the streamer → torch formation event led to significant breakups. It is suggested that this implies that the formation of torches is a primary end result of the braking of BBFs in the tail rather than poleward expansion of substorms bulges and westward traveling surge structures.
• Only 3.5% of the streamer → torch events could be considered precursors to full substorms. This is not surprising since there are many more streamers and torches than there are substorms.
• Streamers are ejected equatorward from the poleward boundary of substorm bulges (especially below and to the east of the WfTS) even when they are still fully embedded in the closed field line region. Under the assumption that streamers are emitted from reconnection sites, they can be used as a natural mapping tool. It is suggested that the poleward expansion of the substorm bulge and dynamics of the WTS are not driven by the impact of streamers (BBFs) from above (tailward), but rather the poleward edge of the bulge is related to the NENL and that the poleward expansion results from a progression of the NENL toward becoming the new distant neutral line.
Data Availability Statement
Publicly available datasets were analyzed in this study. These data can be found here: https://cdaweb.gsfc.nasa.gov/pub/data/lanl; https://cdaweb.gsfc.nasa.gov/pub/data/omni/; https://cdaweb.gsfc.nasa.gov/pub/data/polar/vis/.
Author Contributions
MH performed all work presented here.
Funding
The work presented here was conducted under the NASA LWS grant 19-LWS19_2-0040, NSF GEM grant ATM-0202303, and LDRD grants 20210440ER and 20170047DR.
Conflict of Interest
The author declares that the research was conducted in the absence of any commercial or financial relationships that could be construed as a potential conflict of interest.
Publisher’s Note
All claims expressed in this article are solely those of the authors and do not necessarily represent those of their affiliated organizations, or those of the publisher, the editors and the reviewers. Any product that may be evaluated in this article, or claim that may be made by its manufacturer, is not guaranteed or endorsed by the publisher.
Supplementary Material
The Supplementary Material for this article can be found online at: https://www.frontiersin.org/articles/10.3389/fspas.2022.742246/full#supplementary-material
References
Akasofu, S.-I. (1965). Dynamic Morphology of Auroras. Space Sci. Rev. 4, 498. doi:10.1007/bf00177092
Akasofu, S.-I., and Kimball, D. S. (1964). The Dynamics of the Aurora-I. J. Atmos. Terrestrial Phys. 26, 205–211. doi:10.1016/0021-9169(64)90147-3
Akasofu, S. (1974). A Study of Auroral Displays Photographed from the DMSP-2 Satellite and from the Alaska meridian Chain Od Stations. Space Sci. Rev. 16, 617–725. doi:10.1007/bf00182598
Amm, O., and Kauristie, K. (2002). Ionospheric Signatures of Bursty Bulk Flows. Surv. Geophys. 23, 1–32. doi:10.1023/A:1014871323023
Andreeva, V. A., Apatenkov, S. V., Gordeev, E. I., Partamies, N., and Kauristie, K. (2021). Omega Band Magnetospheric Source Location: A Statistical Model-Based Study. J. Geophys. Res. Space Phys. 126, e2020JA028997. doi:10.1029/2020JA028997
Buchert, S., Baumjohann, W., Haerendel, G., La Hoz, C., and Lühr, H. (1988). Magnetometer and Incoherent Scatter Observations of an Intense Ps 6 Pulsation Event. J. Atmos. Terrestrial Phys. 50, 357–367. doi:10.1016/0021-9169(88)90020-7
Buchert, S., Haerendel, G., and Baumjohann, W. (1990). A Model for the Electric Fields and Currents During a Strong Ps 6 Pulsation Event. J. Geophys. Res. 95, 3733. doi:10.1029/ja095ia04p03733
Connors, M., and Rostoker, G. (1993). Source Mechanisms for Morning Auroral Features. Geophys. Res. Lett. 20, 1535–1538. doi:10.1029/93gl01594
Eastwood, J. P., Sibeck, D. G., Slavin, J. A., Goldstein, M. L., Lavraud, B., Sitnov, M., et al. (2005). Observations of Multiple X-Line Structure in the Earth's Magnetotail Current Sheet: A Cluster Case Study. Geophys. Res. Lett. 32. doi:10.1029/2005GL022509
Elphinstone, R. D., Murphree, J. S., Hearn, D. J., Heikkila, W., Henderson, M. G., and Cogger, L. L. (1993). The Auroral Distribution and its Mapping According to Substorm Phase. J. Atmos. Terrestrial Phys. 55, 1741–1762. doi:10.1016/0021-9169(93)90142-L
Forsyth, C., Sergeev, V. A., Henderson, M. G., Nishimura, Y., and Gallardo-Lacourt, B. (2020). Physical Processes of Meso-Scale, Dynamic Auroral Forms. Space Sci. Rev. 121, 46. doi:10.1007/s11214-020-00665-y
Gabrielse, C., Angelopoulos, V., Runov, A., and Turner, D. L. (2012). The Effects of Transient, Localized Electric Fields on Equatorial Electron Acceleration and Transport Toward the Inner Magnetosphere. J. Geophys. Res. Space Phys. 117. doi:10.1029/2012JA017873
Gabrielse, C., Harris, C., Angelopoulos, V., Artemyev, A., and Runov, A. (2016). The Role of Localized Inductive Electric fields in Electron Injections Around Dipolarizing Flux Bundles. J. Geophys. Res. Space Phys. 121, 9560–9585. doi:10.1002/2016JA023061
Gabrielse, C., Nishimura, Y., Lyons, L., Gallardo-Lacourt, B., Deng, Y., and Donovan, E. (2018). Statistical Properties of Mesoscale Plasma Flows in the Nightside High-Latitude Ionosphere. J. Geophys. Res. Space Phys. 123, 6798–6820. doi:10.1029/2018JA025440
Gallardo-Lacourt, B., Nishimura, Y., Lyons, L. R., Mishin, E. V., Ruohoniemi, J. M., Donovan, E. F., et al. (2017). Influence of Auroral Streamers on Rapid Evolution of Ionospheric Saps Flows. J. Geophys. Res. Space Phys. 122 (406–12), 12420. doi:10.1002/2017JA024198
Gallardo-Lacourt, B., Nishimura, Y., Lyons, L. R., Zou, S., Angelopoulos, V., Donovan, E., et al. (2014). Coordinated Superdarn Themis Asi Observations of Mesoscale Flow Bursts Associated with Auroral Streamers. J. Geophys. Res. Space Phys. 119, 142–150. doi:10.1002/2013JA019245
Henderson, M. G. (2012). “Auroral Substorms, Poleward Boundary Activations, Auroral Streamers, Omega Bands, and Onset Precursor Activity,” in Auroral Phenomenology and Magnetospheric Processes: Earth and Other Planets. Keiling, A., Donovan, E., Bagenal, F., and Karlsson, T. (Natl Sci Fdn; Univ Calgary). Vol. 197 of Geophysical Monograph Series, 39–54. 10.1029/2011GM001165. Chapman Conference on the Relationship Between Auroral Phenomenology and Magnetospheric Processes, Fairbanks, AK, FEB 27-MAR 04, 2011.
Henderson, M. G. (2021b). Generation of Subauroral Longitudinally Extended Emissions Following Intensifications of the Poleward Boundary of the Substorm Bulge and Streamer Production. J. Geophys. Res. Space Phys. 126, e2020JA028556. doi:10.1029/2020JA028556
Henderson, M. G. (1994). Impications Of Viking Imager Results For Substorm Models (PhD Thesis). Department of Physics and Astronomy, University of Calgary.
Henderson, M. G., Kepko, L., Spence, H. E., Connors, M., Sigwarth, J. B., Frank, L. A., et al. (2002). “The Evolution of North-South Aligned Auroral Forms into Auroral Torch Structures: The Generation of Omega Bands and Ps6 Pulsations via Flow Bursts,” in Proceedings of the Sixth International Conference on Substorms. Editor Winglee, R. M. (University of Washington), 169–174.
Henderson, M. G., Morley, S. K., and Kepko, L. E. (2018). Saps-Associated Explosive Brightening on the Duskside: A New Type of Onset-Like Disturbance. J. Geophys. Res. Space Phys. 123, 197–210. doi:10.1002/2017JA024472
Henderson, M. G., Murphree, J. S., and Reeves, G. D. (1994). “The Activation of the Dusk-Side and the Formation of North-South Aligned Structures During Substorms,” in Proc. Second International Conference on Substorms (ICS-2). Editors Kan, J. R., Craven, J. D., and Akasofu, S. (Geophysical Institute, University of Alaska Fairbanks), 37.
Henderson, M. G. (2009). Observational Evidence for an Inside-Out Substorm Onset Scenario. Ann. Geophysicae 27, 2129–2140. doi:10.5194/angeo-27-2129-2009
Henderson, M. G. (2016). Recurrent Embedded Substorms During the 19 October 1998 Gem Storm. J. Geophys. Res. 121, 7847–7859. doi:10.1002/2015ja022014
Henderson, M. G., Reeves, G. D., and Murphree, J. S. (1998). Are North-South Aligned Auroral Structures an Ionospheric Manifestation of Bursty Bulk Flows? Geophys. Res. Lett. 25, 3737–3740. doi:10.1029/98gl02692
Henderson, M. G., Reeves, G. D., Skoug, R., Thomsen, M. F., Denton, M. H., Mende, S. B., et al. (2006a). Magnetospheric and Auroral Activity During the 18 April 2002 Sawtooth Event. J. Geophys. Res. Space Phys. 111. doi:10.1029/2005JA011111
Henderson, M. G., Skoug, R., Donovan, E., Thomsen, M. F., Reeves, G. D., Denton, M. H., et al. (2006b). Substorms During the 10–11 August 2000 Sawtooth Event. J. Geophys. Res. Space Phys. 111. doi:10.1029/2005JA011366
Henderson, M. G. (2004). The May 2–3, 1986 Cdaw-9c Interval: A Sawtooth Event. Geophys. Res. Lett. 31. doi:10.1029/2004GL019941
Henderson, M. (2021a). Key Elements of Auroral Substorm Development and Their Relationship to Recent Observations of Detached Sub-Auroral Phenomena Including Steve-Like Emissions. J. Atmos. Solar-Terrestrial Phys. 218, 105600. doi:10.1016/j.jastp.2021.105600
Iyemori, T., and Rao, D. R. K. (1996). Decay of the Dst Field of Geomagnetic Disturbance After Substorm Onset and its Implication to Storm-Substorm Relation. Ann. Geophysicae 14 (#6), 608–618. doi:10.1007/s00585-996-0608-3
Kauristie, K., Sergeev, V. A., Amm, O., Kubyshkina, M. V., Jussila, J., Donovan, E., et al. (2003). Bursty Bulk Flow Intrusion to the Inner Plasma Sheet as Inferred from Auroral Observations. J. Geophys. Res. Space Phys. 108. doi:10.1029/2002JA009371
Kauristie, K., Sergeev, V. A., Kubyshkina, M., Pulkkinen, T. I., Angelopoulos, V., Phan, T., et al. (2000). Ionospheric Current Signatures of Transient Plasma Sheet Flows. J. Geophys. Res. Space Phys. 105, 10677–10690. doi:10.1029/1999JA900487
Kawasaki, K., and Rostoker, G. (1979). Perturbation Magnetic Fields and Current Systems Associated with Eastward Drifting Auroral Structures. J. Geophys. Res. 84, 1464–1480. doi:10.1029/ja084ia04p01464
Kepko, L., McPherron, R. L., Amm, O., Apatenkov, S., Baumjohann, W., Birn, J., et al. (2015). Substorm Current Wedge Revisited. Space Sci. Rev. 190, 1–46. doi:10.1007/s11214-014-0124-9
Kepko, L., Spanswick, E., Angelopoulos, V., Donovan, E., McFadden, J., Glassmeier, K.-H., et al. (2009). Equatorward Moving Auroral Signatures of a Flow Burst Observed Prior to Auroral Onset. Geophys. Res. Lett. 36. doi:10.1029/2009GL041476
Liu, J., Lyons, L. R., Archer, W. E., Gallardo-Lacourt, B., Nishimura, Y., Zou, Y., et al. (2018). Flow Shears at the Poleward Boundary of Omega Bands Observed During Conjunctions of Swarm and Themis Asi. Geophys. Res. Lett. 45, 1218–1227. doi:10.1002/2017GL076485
Liu, W. W., and Rostoker, G. (1993). On the Origin of Auroral Fingers. J. Geophys. Res. 98, 17401–17407. doi:10.1029/93ja01313
Lyons, L. R. (2000). Geomagnetic Disturbances: Characteristics of, Distinction Between Types, and Relations to Interplanetary Conditions. J. Atmos. Solar-Terrestrial Phys. 62, 1087–1114. doi:10.1016/s1364-6826(00)00097-3
Lyons, L. R., Nishimura, Y., Gallardo-Lacourt, B., Zou, Y., Donovan, E. F., Mende, S., et al. (2015). Dynamics Related to Plasmasheet Flow Bursts as Revealed from the Aurora. American Geophysical Union AGU. Chap. 8. 95–113. doi:10.1002/9781118978719.ch8
Lyons, L. R., and Walterscheid, R. L. (1985). Generation of Auroral Omega Bands by Shear Instability of the Neutral Winds. J. Geophys. Res. 90, 12321–12329. doi:10.1029/ja090ia12p12321
Lyons, L. R., Zou, Y., Nishimura, Y., Gallardo-Lacourt, B., Angelopulos, V., and Donovan, E. F. (2018). Stormtime Substorm Onsets: Occurrence and Flow Channel Triggering. Earth, Planets and Space 70, 81. doi:10.1186/s40623-018-0857-x
McPherron, R. L., and Chu, X. (2016). Relation of the Auroral Substorm to the Substorm Current Wedge. Geosci. Lett. 3, 12. doi:10.1186/s40562-016-0044-5
Miyashita, Y., and Ieda, A. (2018). Revisiting Substorm Events with Preonset Aurora. Ann. Geophysicae 36, 1419–1438. doi:10.5194/angeo-36-1419-2018
Montbriand, L. (1971). The Proton Aurora and Auroral Substorm. The Radiating Atmosphere, 366–373. Cited By 22. doi:10.1007/978-94-010-3090-8_33
Murphree, J., Elphinstone, R., Henderson, M., Cogger, L., and Hearn, D. (1993). Interpretation of Optical Substorm Onset Observations. J. Atmos. Terrestrial Phys. 55, 1159–1170. doi:10.1016/0021-9169(93)90044-Y
Nakamura, R., Baumjohann, W., Mouikis, C., Kistler, L. M., Runov, A., Volwerk, M., et al. (2004). Spatial Scale of High-Speed Flows in the Plasma Sheet Observed by Cluster. Geophys. Res. Lett. 31. doi:10.1029/2004GL019558
Nakamura, R., Oguti, T., Yamamoto, T., and Kokubun, S. (1993). Equatorward and Poleward Expansion of the Auroras During Auroral Substorms. J. Geophys. Res. 98, 5743–5759. doi:10.1029/92ja02230
Nishimura, Y., Lyons, L. R., Nicolls, M. J., Hampton, D. L., Michell, R. G., Samara, M., et al. (2014). Coordinated Ionospheric Observations Indicating Coupling Between Preonset Flow Bursts and Waves That Lead to Substorm Onset. J. Geophys. Res. Space Phys. 119, 3333–3344. doi:10.1002/2014JA019773
Nishimura, Y., Lyons, L., Zou, S., Angelopoulos, V., and Mende, S. B. (2010). Substorm Triggering by New Plasma Intrusion: THEMIS All-Sky Imager. J. Geophys. Res. 115, A07222. doi:10.1029/2009ja015166
Nishimura, Y., Yang, J., Pritchett, P. L., Coroniti, F. V., Donovan, E. F., Lyons, L. R., et al. (2016). Statistical Properties of Substorm Auroral Onset Beads/Rays. J. Geophys. Res. Space Phys. 121, 8661–8676. doi:10.1002/2016JA022801
Oguti, T. (1973). Hydrogen Emission and Electron Aurora at Onset of Auroral Breakup. J. Geophys. Res. 78, 7543–7547. doi:10.1029/ja078i031p07543
Oguti, T., Kokubun, S., Hayashi, K., Tsuruda, K., Machida, S., Kitamura, T., et al. (1981). An Auroral Torch Structure as an Activity Center of Pulsating Aurora. Can. J. Phys. 59, 1056–1062. doi:10.1139/p81-139
Opgenoorth, H. J., Oksman, J., Kaila, K. U., Nielsen, E., and Baumjohan, W. (1983). Characteristics of Eastward Drifting Omega Bands in the Morning Sector of the Auroral Oval. J. Geophys. Res. 88, 9171–9185. doi:10.1029/ja088ia11p09171
Pellinen, R. J., Opgenoorth, H. J., and Pulkkinen, T. I. (1992). “Substorm Recovery Phase: Relationship to Next Activation,” in Proc. International Conference on Substorms (ICS-1) ESA SP-335 (Nordwijk, Netherlands), 469–475.
Pytte, T., McPherron, R. L., and Kokubun, S. (1976). The Ground Signatures of the Expansion Phase During Multiple Onset Substorms. Plant Space Sci. 24, 1115. doi:10.1016/0032-0633(76)90149-5
Rostoker, G., Akasofu, S.-I., Foster, J., Greenwald, R. A., Kamide, Y., Kawasaki, K., et al. (1980). Magnetospheric Substorms – Definitions and Signatures. J. Geophys. Res. 85, 1663–1668. doi:10.1029/ja085ia04p01663
Rostoker, G., and Barichello, J. C. (1980). Seasonal and Diurnal-Variation of Ps-6 Magnetic Disturbances. J. Geophys. Res. 85, 161–163. doi:10.1029/ja085ia01p00161
Rostoker, G., Lui, A. T. Y., Anger, C. D., and Murphree, J. S. (1987). North-South Aligned Structures in the Midnight Sector Auroras as Viewed by the Viking Imager. Geophys. Res. Lett. 14, 407–410. doi:10.1029/gl014i004p00407
Rostoker, G., and Samson, J. C. (1984). Can Substorm Expansive Phase Effects and Low Frequency Pc Magnetic Pulsations Be Attributed to the Same Source Mechanism? Geophys. Res. Lett. 11, 271. doi:10.1029/gl011i003p00271
Runov, A., Angelopoulos, V., Sitnov, M. I., Sergeev, V. A., Bonnell, J., McFadden, J. P., et al. (2009). Themis Observations of an Earthward-Propagating Dipolarization Front. Geophys. Res. Lett. 36. doi:10.1029/2009GL038980
Runov, A., Angelopoulos, V., Zhou, X.-Z., Zhang, X.-J., Li, S., Plaschke, F., et al. (2011). A Themis Multicase Study of Dipolarization Fronts in the Magnetotail Plasma Sheet. J. Geophys. Res. Space Phys. 116. doi:10.1029/2010JA016316
Saito, T. (1978). Long-Period Irregular Magnetic Pulsation, Pi3. Space Sci. Rev. 21, 427–467. doi:10.1007/bf00173068
Sergeev, V. A., Angelopoulos, V., Gosling, J. T., Cattell, C. A., and Russell, C. T. (1996). Detection of Localized, Plasma-Depleted Flux Tubes or Bubbles in the Midtail Plasma Sheet. J. Geophys. Res. Space Phys. 101, 10817–10826. doi:10.1029/96JA00460
Sergeev, V. A., Chernyaev, I. A., Dubyagin, S. V., Miyashita, Y., Angelopoulos, V., Boakes, P. D., et al. (2012). Energetic Particle Injections to Geostationary Orbit: Relationship to Flow Bursts and Magnetospheric State. J. Geophys. Res. Space Phys. 117. doi:10.1029/2012JA017773
Sergeev, V. A., Liou, K., Meng, C.-I., Newell, P. T., Brittnacher, M., Parks, G., et al. (1999). Development of Auroral Streamers in Association with Localized Impulsive Injections to the Inner Magnetotail. Geophys. Res. Lett. 26, 417–420. doi:10.1029/1998gl900311
Sergeev, V. A., Sauvaud, J. A., Popescu, D., Kovrazhkin, R. A., Liou, K., Newell, P. T., et al. (2000). Multiple-Spacecraft Observation of a Narrow Transient Plasma Jet in the Earth’s Plasma Sheet. Geophys. Res. Lett. 27, 851–854. doi:10.1029/1999GL010729
Sergeev, V. A. (1974). The Discrete Activations of the Magnetosphere During the Substorm Explosive Phase. Proc. STP Symp. 2, 22–58.
Solovyev, S. I. (1999). Structure of Disturbances in the Dayside and Nightside Ionosphere During Periods of Negative Interplanetary Magnetic Field Bz. J. Geophys. Res. 104, 28019–28039.
Wild, J. A., Yeoman, T. K., Eglitis, P., and Openoorth, H. J. (2000). Multi-Instrument Observations of the Electric and Magnetic Field Structure of Omega Bands. Ann. Geophysicae 18, 99–110. doi:10.1007/s00585-000-0099-6
Yahnin, A. G., Sergeev, V. A., Pellinen, R. J., Baumjohann, W., Kaila, K. U., Ranta, H., et al. (1983). Substorm Time Sequence and Microstructure on 11 November 1976. J. Geophys. 53, 182–197.
Yamamoto, T. (2011). A Numerical Simulation for the Omega Band Formation. J. Geophys. Res. Space Phys. 116. doi:10.1029/2010JA015935
Yamamoto, T. (2009). Hybrid Kelvin-Helmholtz/Rayleigh-Taylor Instability in the Plasma Sheet. J. Geophys. Res. Space Phys. 114. doi:10.1029/2008JA013760
Yang, J., Toffoletto, F. R., Wolf, R. A., and Sazykin, S. (2011). Rcm-e Simulation of Ion Acceleration During an Idealized Plasma Sheet Bubble Injection. J. Geophys. Res. Space Phys. 116. doi:10.1029/2010JA016346
Zesta, E., Lyons, L. R., and Donovan, E. (2000). The Auroral Signature of Earthward Flow Bursts Observed in the Magnetotail. Geophys. Res. Lett. 27, 3241–3244. doi:10.1029/2000gl000027
Keywords: auroral streamers, omega bands, auroral breakups, injections, torches, mesoscale aurora, flow braking, substorm current wedge
Citation: Henderson MG (2022) Association of Mesoscale Auroral Structures and Breakups With Energetic Particle Injections at Geosynchronous Orbit. Front. Astron. Space Sci. 9:742246. doi: 10.3389/fspas.2022.742246
Received: 15 July 2021; Accepted: 05 April 2022;
Published: 12 July 2022.
Edited by:
Anthony Tat Yin Lui, Johns Hopkins University, United StatesReviewed by:
Victor Sergeev, Saint Petersburg State University, RussiaJiang Liu, University of Southern California, United States
Copyright © 2022 Henderson. This is an open-access article distributed under the terms of the Creative Commons Attribution License (CC BY). The use, distribution or reproduction in other forums is permitted, provided the original author(s) and the copyright owner(s) are credited and that the original publication in this journal is cited, in accordance with accepted academic practice. No use, distribution or reproduction is permitted which does not comply with these terms.
*Correspondence: M. G. Henderson, bWdoZW5kZXJzb25AbGFubC5nb3Y=
 M. G. Henderson