 McArthur Jones
  John T. Emmert1
 Quan Gan
 Jia Yue
- 1Space Science Division, U. S. Naval Research Laboratory, Washington, DC, United States
- 2Laboratory for Atmospheric and Space Physics, University of Colorado, Boulder, CO, United States
- 3Goddard Space Flight Center, NASA Greenbelt, Greenbelt, MD, United States
- 4Catholic University of America, Washington, DC, United States
Currently, thermospheric species densities and temperatures between ∼100 and 200 km are not known to the accuracy needed to fully characterize how the thermosphere transitions from a well-mixed atmosphere to a diffusively separated atmosphere with zero temperature gradient. This greatly inhibits scientific discovery attainable from either models or observations in this region, especially the understanding of mechanisms that drive thermosphere and ionospheric variability from space weather to climatological time scales. The purpose of this paper is to highlight the importance and critical need for new, global, height-resolved neutral composition (O, O2, N2) and temperature measurements in the new ignorosphere: the 100–200 km region of the thermosphere. We conclude with observation recommendations and requirements for new comprehensive composition and temperature measurements in the 100–200 km altitude region that would lead to significant advances in thermosphere-ionosphere science, space weather, and space climate.
1 Scientific motivation and challenges
The thermosphere and ionosphere (T-I) system is forced from both above and below. From above, external forcing includes (but is not limited to) extreme ultraviolet (EUV) and X-ray radiation as well as energy and momentum input via coupling with the solar wind and magnetosphere. From below, a wide-ranging spectrum of vertically propagating waves of lower atmospheric origin impart their energy and momentum into the T-I system (Oberheide et al., 2015; Liu, 2016; Sassi et al., 2019). Coupling between the plasma in the ionosphere and neutrals in thermosphere via ion drag, chemistry, and Joule heating add even more complexity to T-I system. The primary neutral parameters that define the thermospheric state are temperature, composition, mass density, and winds, which experience variations over a wide range of spatiotemporal scales (e.g., Qian and Solomon, 2012; Emmert, 2015a) due to the energy and momentum inputs outlined above. Ultimately, neutral or thermospheric variations, together with variations in the electrodynamic forcing, drive ionospheric variations and produce the space weather of the T-I system (e.g., Rishbeth, 1998; Liu et al., 2021).
The thermosphere spans roughly 90–600 km altitude, consisting primarily of N2, O2, O, He, and H. The thermosphere transitions between ∼100 and 120 km (e.g., Offermann et al., 2007) from a well-mixed fluid (dominated by eddy diffusion) to one dominated by molecular diffusion, whereby individual species are distributed by altitude according to their molecular masses. Above ∼200 km, the thermosphere is in approximate diffusive equilibrium (Meier et al., 2001), transitioning from a molecular dominated atmosphere (N2, O2), to an atomic dominated regime, with O diffusing upward and becoming the major thermospheric species from ∼200 to 600 km. Between ∼250 and 750 km (depending on the solar cycle), O accounts for most of the thermospheric mass and therefore most of the atmospheric drag experienced by satellites and debris in low-Earth orbit. Critically, the O distribution in the mesosphere and lower thermosphere (MLT, ∼50–120 km), which is controlled by the relative contributions of chemistry, diffusion, and dynamics (e.g., Yamazaki and Richmond, 2013; Jones Jr, et al., 2014b; Chang et al., 2014; Gan et al., 2015), is directly connected to mass density distribution in the upper thermosphere via molecular diffusion (Picone et al., 2013; Jones Jr et al., 2017; Jones Jr et al., 2018; Jones Jr et al., 2021).
Adding to the complexity of the 100–200 km region is that the thermospheric temperature profile increases steeply with altitude from ∼250 K at 100 km to ∼1000 K at 200 km (on average). Numerous competing heating and cooling processes govern the temperature of the thermosphere, including direct absorption of solar UV radiation, thermal interaction with the ionosphere, exothermic chemical reactions, infrared radiation by several species (including CO2 and NO), and adiabatic heating and cooling due to dynamic motions. The connection between temperature and mass density (and therefore composition) is via hydrostatic balance and the ideal gas law. Variations in mass density are highly sensitive to variations in underlying temperature because increased temperature acts to expand a hydrostatic column, leading to increases in the density scale height and increased mass density at a fixed altitude. For example, a 20 K overestimate of temperature over a 10 km altitude band near 100 km will produce a ∼20% overestimate of atmospheric density at higher altitudes, because the erroneously high temperature produces a more expanded air column via hydrostatic adjustment. Thus, in order to properly interpret mass and plasma density changes measured in the upper thermosphere from previous [e.g., Challenging Minisatellite Payload (CHAMP)] and future [e.g., Global Dynamics Constellation (GDC)] satellite missions, one must understand the temperature and composition of the 100–200 km region.
Further complicating the understanding of upper T-I variations connected with variations in the 100–200 km altitude regime is that most vertically-propagating waves (solar and lunar tides, planetary waves, Kelvin waves, gravity waves) break, dissipate, and generate secondary or higher order waves at this altitude, bringing momentum and energy from the lower atmosphere into the thermosphere. As a result, accurate modeling of neutral thermospheric composition, temperature, and ionospheric plasma density are important for satellite operations and requires a deft understanding of atmospheric waves, dynamics, and thermodynamics that modulate the neutral and plasma densities at time scales from days, months, years, to decades (e.g., Qian et al., 2009, 2013; Leonard et al., 2012; Vadas et al., 2014; Emmert, 2015b; Pedatella et al., 2016; Thayer et al., 2021). Further, wave propagation and dissipation prior to geomagnetic storms can serve to precondition thermospheric composition, dynamics, and temperature, which if unaccounted for can lead to large uncertainties in modeled plasma density calculations (e.g., Pedatella and Liu, 2018).
All the above is well supported by a rich body of scientific literature and provided strong motivation for the GDC and Dynamical Neutral Atmosphere (DYNAMIC) science missions that were among the highest priority recommendations in the 2013 Decadal Survey (National Research Council, 2013). Further, both GDC and DYNAMIC were strongly advocated for in the Decadal Survey Midterm Assessment (NASEM, 2020), with the latter receiving strong community support from the 2022 CEDAR community statements on DYNAMIC (CEDAR Science Steering Committee, 2022).
2 Current state of temperature and composition measurements in the 100–200 km region
Sophisticated whole atmosphere and/or middle and upper atmospheric models constrained with realistic lower atmosphere forcing from atmospheric prediction systems or reanalyses can reproduce some of the nuances of T-I composition and temperature in the T-I system. Since the 2013 Decadal Survey, a number of advances in understanding the composition and temperature variations in the 100–200 km region have been accomplished via combined data-modeling efforts.
However, temperature and composition measurements in the 100–200 km region are still very sparse, which is an obstacle to the validation and interpretation of the modeling results. Figure 1 illustrates the historical and current record of major data sets as a function of altitude and year. The only current and ongoing research measurements of major thermospheric chemical constituents and/or temperature above 105 km are from the NASA Ionospheric Connection Explore (ICON) mission (Immel et al., 2017; neutral temperature measurements only, max altitude 127 km daytime, 108 km nighttime), the NASA Global-scale Observations of the Limb and Disk (GOLD) mission (Eastes et al., 2017; temperature, a vertically integrated measurement that is of limited utility; column O/N2 and O2 vertical profiles, but in geostationary orbit, with limited longitudinal coverage), ground-based incoherent scatter radar (campaign-based operation, only ∼3 sites, daytime only, requires special processing), ground-based airglow measurements (only at ∼250 km altitude, nighttime, limited geographic coverage, sporadic temporal coverage), and ground-based resonance fluorescence lidars routinely measure temperature from ∼80 km up to ∼115 km at nighttime (Yuan et al., 2021), with occasional temperature observations reaching ∼140 km and above (Chu et al., 2011; Liu et al., 2016). Further, important for improving the Mass Spectrometer Incoherent Scatter radar or MSIS series of empirical models with current and future thermospheric composition and temperature measurements, is the complicating factor that measurement techniques often use MSIS itself as an initial guess or for ancillary parameters needed in the retrieval (e.g., Michelson Interferometer for Passive Atmospheric Sounding (MIPAS), Bermejo-Pantaleón et al., 2011; Global Ultraviolet Imager (GUVI), Meier et al., 2015). Thus, there is a need to expand existing and develop new techniques for measuring and retrieving thermospheric temperature and composition, especially between the 100 km and 200 km altitude region, which has strong vertical gradients and a strong influence on higher altitudes in the T-I.
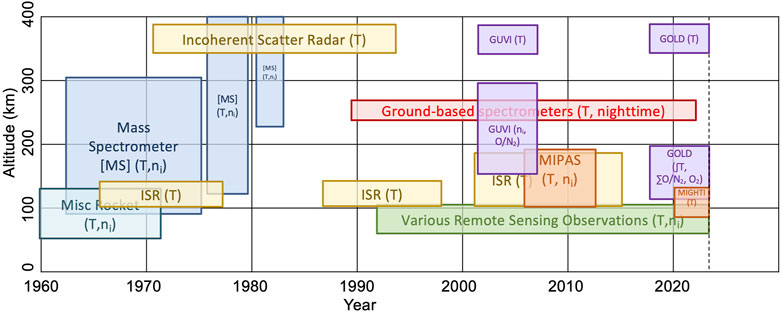
FIGURE 1. Coverage of existing and historical thermospheric composition and temperature data sets in terms of altitude and year. Note that the amount of data available within these ranges varies widely, and is generally very sparse. The dashed line indicates present day.
In the absence of well-resolved global temperature and composition measurements the community has often turned to the empirical Mass Spectrometer Incoherent Scatter Radar (MSIS®) class of models (Hedin et al., 1977a; Hedin et al., 1977b; Hedin, 1987; Hedin, 1991; Picone et al., 2002) to understand and validate thermospheric composition and temperature phenomena in the 100–200 km region. MSIS recently went through a major reformulation and upgrade from NRLMSISE-00 to NRLMSIS version 2.0 by Emmert et al. (2021), using extensive new datasets from the ground to ∼100 km altitude (green box labeled “Various Remote Sensing Observations”, post-2000 in Figure 1). Further, above ∼250 km new satellite drag-derived mass densities were used to tune and recalibrate thermospheric atomic oxygen. Otherwise, the neutral parameters provided by the NRLMSISE-00 model in the thermosphere was largely retained. Emmert et al. (2021) specifically highlighted the scarcity of thermospheric composition and temperature measurements between 100 and 200 km, making the following statements, “We also note that species densities in the middle thermosphere are not known to the accuracy needed to fully understand the critical transition from a fully mixed atmosphere to a diffusively separated one. Observations needed to constrain lower and middle thermospheric physics are scarce, and the 100–200 km region can perhaps be termed the new “ignorosphere,” an epithet previously applied to the mesosphere, which by comparison is now well measured and understood.”
Not only are thermospheric composition and temperature measurements sparse in the 100–200 km altitude region, but also existing temperature datasets exhibit large mutual biases of up to 80 K or more. For example, Figure 2 illustrates the mutual biases of selected thermospheric temperature data sets using NRLMSIS 2.0 as a benchmark, during the daytime and at mid-latitudes. Compounding the challenge of understanding the thermospheric state between 100 and 200 km and its impact on the overlying T-I system is that new “ignorosphere” overlaps the same altitude regime of the so-called “thermospheric gap”, a term coined by Oberheide et al. (2011). The “thermospheric gap” refers to 110–200 km region of the thermosphere, where we know very little about the dynamics of this region due to a lack of vector wind measurements.
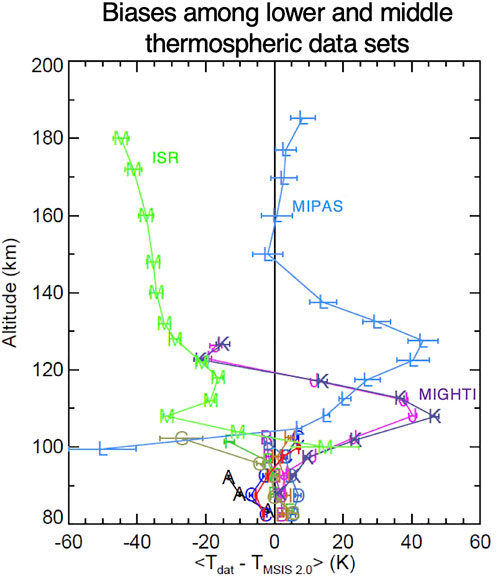
FIGURE 2. Biases among selected lower and middle thermospheric temperature datasets, during daytime and at mid-latitudes (30S—47N) with respect to NRLMSIS 2.0 as the baseline. The middle thermospheric data sets MIGHTI (“J”,“K″), MIPAS (“L”), and ground-based incoherent scatter radar (ISR, “M”) are highlighted. The data sets below 100 km include a variety of space-based and ground-based remote sensing measurements. Error bars denote the statistical uncertainty of the estimated biases. Also shown but not discussed in are AURA/MLS (“A”), ACE/FTS (“B”), UARS/HALOE (“C”), AIM/SOFIE (“D”), Boulder, CO Lidar (“E”), Ft. Collins, CO Lidar (“F”), Logan, UT Lidar (“G”), TIMED/SABER (“H”), and ODIN/OSIRIS (“I”).
This lack of wind measurements coupled with the sparsity of composition and temperature measurements in the new ignorosphere has significantly hindered scientific progress on a number of T-I phenomena in which composition and temperature variations, and dynamical-control thereof, are known to play an important role. Just a few phenomena that cover both local and global spatial scales, as well as span time scales from days to beyond a solar cycle are listed below:
• Long-term trends in composition, mass density, and temperature in the thermosphere (Emmert, 2015a; Solomon et al., 2019)
• The residual interhemispheric lower thermospheric residual circulation and its effect on O and temperature (Qian and Yue, 2017).
• Characterizing the prominent drivers (especially those associated with gravity waves and tides) of the global annual and semiannual oscillations in the upper T-I, and their solar cycle variability (Jones Jr et al., 2021)
• The equinox transition of composition and temperature in the thermosphere (Qian et al., 2022).
• What actually causes changes in ∑O/N2 in existing FUV measurements, be it O, N2, or temperature and what is the contribution of each?
• Impacts of short-term (<5 days) variability of neutral constituents and temperature (e.g., Yue et al., 2016; Gan et al., 2017) between 100 and 200 km on the space weather of the upper T-I system.
3 Recommendations for addressing limitations in the “ignorosphere” and “thermospheric gap”
In the next decade, it is imperative that new and more extensive composition and temperature observations coupled with neutral wind measurements in the ignorosphere and thermospheric gap become available. Considering the scientific challenges listed above (and a number of others), Emmert et al. (2021) provided some recommendation on how to address such challenges including:
• New in situ mass spectrometers measurements of species densities in the thermosphere.
• New remote sensing (and potentially in situ) techniques for, and extensive new measurements, of height-resolved temperature and composition in the 100–200 km (and even slightly above) region.
• Dedicated research effort into identifying, characterizing, and reconciling systemic biases among existing and future composition and temperature observations.
Given these previous recommendations by Emmert et al. (2021) and others, we highly recommend flying a satellite constellation of at least 2 satellites, but ideally 3, with the necessary instruments that would provide unprecedented longitude, local time, and height-resolved temperature and composition observations of the 100–200 km region. Table 1 provides a synopsis of the new thermospheric composition and temperature observations that would facilitate new scientific discoveries in the 100–200 km region of the thermosphere. Note that these composition and temperature measurements are not much different to what was advocated for in the 2013 Decadal Survey (National Research Council, 2013) when the DYNAMIC mission was originally proposed.
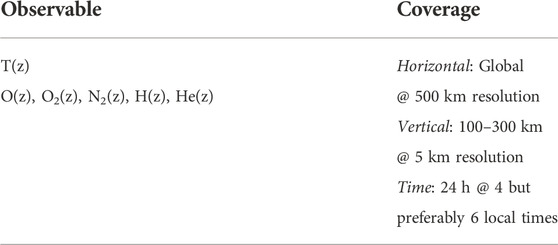
TABLE 1. Key thermospheric composition and temperature observables between 100 and 200 km.
Additionally, the measurements in Table 1 coupled with coincident vector wind measurements at 4 local solar times per day (2 satellites separated apart by 6 h) at the same resolution would allow one to resolve the large-scale gravity wave spectrum, daily diurnal tidal spectrum, and zonal mean wind daily. These waves are known to have profound effects on the thermospheric composition and temperature between 100 and 200 km and above (e.g., Yamazaki and Richmond, 2013; Jones Jr et al., 2014a; Vadas et al., 2014). Ideally, the composition and temperatures measurements in Table 1 coupled with coincident vector wind measurements would be measured at 6 local solar times per day (3 satellites separated apart by 4 h) at the same resolution, allowing one to resolve the daily semidiurnal tidal spectrum as well, in the altitude regime where many of these tides reach their maximum amplitude (e.g., Forbes et al., 2022). Observing the semidiurnal part of the tidal spectrum would add significant benefit as it is well-known to be important in coupling lower atmospheric variability to T-I variability in composition and temperature during sudden variability in composition and temperature during sudden stratospheric warmings (e.g., Jones Jr et al., 2020; Oberheide et al., 2020; and many others before and after these).
In closing, the lack of global, day and night, height-resolved thermospheric composition and temperature (and wind) observations between 100 and 200 km has not been sufficiently addressed since the last Decadal Survey, and continues to be an important priority for the Heliophysics community. New, comprehensive, thermospheric composition and temperature (and wind) measurements in this altitude region, would significantly advance T-I system science, space weather modeling and prediction, and provide a means for more collaboration between the ground and space-based observation communities of the 100–200 km region. A table of other Heliophysics professionals that support our position on the future of thermospheric measurements in the 100–200 km region is included as Supplementary Material.
Data availability statement
Publicly available datasets were analyzed in this study. This data can be found here: NRLMSIS 2.0 Code and all data samples used in the ensemble fits and model validation are available at https://map.nrl.navy.mil/map/pub/nrl/NRLMSIS/NRLMSIS2.0. Ground-based lidar and ISR data were obtained from http://www.cedar. openmadrigal.org website. USU Lidar data are also available online (https://doi.org/10.15142/T33H26). MIPAS data used in this study are available for registered users at http://www.imk-asf.kit.edu/english/308.php website. MIGHTI data used in this study are available at available from the ICON website (https://icon.ssl.berkeley.edu/Data) and at the Space Physics Data Facility (https://spdf.gsfc.nasa.gov/).
Author contributions
MJ and JE equally contributed to this work, and share first authorship. All authors contributed to manuscript citations, revisions, reading, and approved the submitted version.
Funding
MJ and JE were supported by the Office of Naval Research. QG was supported by NASA grants 80NSSC20K0721 and 80GSFC18C006. JY was supported by NSF AGS-2140031, NASA, and the NASA AIM mission.
Acknowledgments
A similar version of this paper was submitted as a position paper to the Decadal Survey for Solar and Space Physics (Heliophysics) 2024–2033. The positions, experiences, and viewpoints expressed in this work are those of the authors as scientists in the space research community, and are not the official positions of their employing institutions. The authors would also like to thank Michael Stevens, Kenneth Dymond, and Andrew Stephan of NRL for their inputs on an initial version of this manuscript.
Conflict of interest
The authors declare that the research was conducted in the absence of any commercial or financial relationships that could be construed as a potential conflict of interest.
Publisher’s note
All claims expressed in this article are solely those of the authors and do not necessarily represent those of their affiliated organizations, or those of the publisher, the editors and the reviewers. Any product that may be evaluated in this article, or claim that may be made by its manufacturer, is not guaranteed or endorsed by the publisher.
Supplementary material
The Supplementary Material for this article can be found online at: https://www.frontiersin.org/articles/10.3389/fspas.2022.1062967/full#supplementary-material
References
Bermejo-Pantaleόn, D., Funke, B., Lόpez-Puertas, M., García-Comas, M., Stiller, G., Clarmann, T., et al. (2011). Global observations of thermospheric temperature and nitric oxide from MIPAS spectra at 5.3µm. J. Geophys. Res. Space Phys. 116 (A10). doi:10.1029/2011JA016752
CEDAR Science Steering Committee (2022). Cedar CSSC Community statement on DYNAMIC. Available at https://docs.google.com/document/d/1J4zc0c4u0PCNJxPv1GFRKrgqDJN6mIQx/edit.
Chang, L., Yue, J., Wang, W., Wu, Q., and Meier, R. (2014). Quasi two day wave-related variability in the background dynamics and composition of the mesosphere/thermosphere and the ionosphere. J. Geophys. Res. Space Phys. 119 (6), 4786–4804. doi:10.1002/2014ja019936
Chu, X., Yu, Z., Gardner, C., Chen, C., and Fong, W. (2011). Lidar observations of neutral Fe layers and fast gravity waves in the thermosphere (110-155 km) at McMurdo (77.8-S, 166.7-E), Antarctica. Geophys. Res. Lett. 38 (23). doi:10.1029/2011GL050016
Eastes, R., McClintock, W., Burns, A., Anderson, D., Andersson, L., Codrescu, M., et al. (2017). The Global-scale observations of the Limb and Disk (GOLD) mission. Space Sci. Rev. 212 (1), 383–408. doi:10.1007/s11214-017-0392-2
Emmert, J., Drob, D., Picone, J., Siskind, D., Jones, M., Mlynczak, M., et al. (2021). Nrlmsis 2.0: A whole-atmosphere empirical model of temperature and neutral species densities. Earth Space Sci. 8 (3), e2020EA001321. doi:10.1029/2020EA001321
Emmert, J. T. (2015a). Altitude and solar activity dependence of 1967-2005 thermospheric density trends derived from orbital drag. J. Geophys. Res. Space Phys. 120 (4), 2940–2950. doi:10.1002/2015JA021047
Emmert, J. T. (2015b). Thermospheric mass density: A review. Adv. Space Res. 56 (5), 773–824. doi:10.1016/j.asr.2015.05.038
Forbes, J., Oberheide, J., Zhang, X., Cullens, C., Englert, C., Harding, B., et al. (2022). Vertical coupling by solar semidiurnal tides in the thermosphere from ICON/MIGHTI measurements. JGR. Space Phys. 127 (5), e2022JA030288. doi:10.1029/2022JA030288
Gan, Q., Oberheide, J., Yue, J., and Wang, W. (2017). Short-term variability in the ionosphere due to the nonlinear interaction between the 6 day wave and migrating tides. JGR. Space Phys. 122 (8), 8831–8846. doi:10.1002/2017JA023947
Gan, Q., Yue, J., Chang, L., Wang, W., Zhang, S., and Du, J. (2015). Observations of thermosphere and ionosphere changes due to the dissipative 6.5-day wave in the lower thermosphere. Ann. Geophys. 33 (7), 913–922. doi:10.5194/angeo-33-913-2015
Hedin, A. (1991). Extension of the MSIS Thermosphere Model into the middle and lower atmosphere. J. Geophys. Res. 96 (A2), 1159–1172. doi:10.1029/90JA02125
Hedin, A. (1987). MSIS-86 thermospheric model. J. Geophys. Res. 92 (A5), 4649–4662. doi:10.1029/JA092iA05p04649
Hedin, A., Reber, C., Newton, G., Spencer, N., Brinton, H., Mayr, H., et al. (1977b). A global thermospheric model based on mass spectrometer and incoherent scatter data MSIS, 2. Composition. J. Geophys. Res. 82 (16), 2148–2156. doi:10.1029/JA082i016p02148
Hedin, A., Salah, J., Evans, J., Reber, C., Newton, G., Spencer, N., et al. (1977a). A global thermospheric model based on mass spectrometer and incoherent scatter data MSIS, 1. N2 density and temperature. J. Geophys. Res. 82 (16), 2139–2147. doi:10.1029/JA082i016p02139
Immel, T., England, S., Mende, S., Heelis, R., Englert, C., Edelstein, J., et al. (2017). The ionospheric connection Explorer mission: Mission Goals and Design. Space Sci. Rev. 214 (1), 13. doi:10.1007/s11214-017-0449-2
Jones, M., Forbes, J., Hagan, M., and Maute, A. (2014a). Impacts of vertically propagating tides on the mean state of the ionosphere-thermosphere system. J. Geophys. Res. Space Phys. 119 (3), 2197–2213. doi:10.1002/2013JA019744
Jones, M., Forbes, J., and Hagan, M. (2014b). Tidal-induced net transport effects on the oxygen distribution in the thermosphere. Geophys. Res. Lett. 41 (14), 5272–5279. doi:10.1002/2014GL060698
Jones, M., Emmert, J., Drob, D., Picone, J., and Meier, R. (2018). Origins of the thermosphere-ionosphere semiannual oscillation: Reformulating the “thermospheric Spoon” mechanism. JGR. Space Phys. 123 (1), 931–954. doi:10.1002/2017JA024861
Jones, M., Emmert, J., Drob, D., and Siskind, D. (2017). Middle atmosphere dynamical sources of the semiannual oscillation in the thermosphere and ionosphere. Geophys. Res. Lett. 44 (1), 12–21. doi:10.1002/2016GL071741
Jones, M., Siskind, D., Drob, D., McCormack, J., Emmert, J., Dhadly, M., et al. (2020). Coupling from the middle atmosphere to the Exobase: Dynamical Disturbance effects on Light chemical species. JGR. Space Phys. 125 (10). doi:10.1029/2020JA028331
Jones, M., Sutton, E., Emmert, J., Siskind, D., and Drob, D. (2021). On the effects of mesospheric and lower thermospheric oxygen chemistry on the thermosphere and ionosphere semiannual oscillation. JGR. Space Phys. 126 (3). doi:10.1029/2020JA028647
Leonard, J., Forbes, J., and Born, G. (2012). Impact of tidal density variability on orbital and reentry predictions. Space weather. 10 (12). doi:10.1029/2012SW000842
Liu, A., Guo, Y., Vargas, F., and Swenson, G. (2016). First measurement of horizontal wind and temperature in the lower thermosphere (105-140 km) with a Na Lidar at Andes Lidar Observatory. Geophys. Res. Lett. 43 (6), 2374–2380. doi:10.1002/2016GL068461
Liu, H. -L. (2016). Variability and predictability of the space environment as related to lower atmosphere forcing. Space weather. 14 (9), 634–658. doi:10.1002/2016SW001450
Liu, H., Yamazaki, Y., and Lei, J. (2021). ‘Day-to-Day variability of the thermosphere and ionosphere’, upper atmosphere dynamics and energetics. Washington, D.C., United States: American Geophysical Union, 275–300. doi:10.1002/9781119815631.ch1510.1002/9781119815631.ch15
Meier, R., Picone, J., Drob, D., Bishop, J., Emmert, J., Lean, J., et al. (2015). Remote sensing of Earth's Limb by TIMED/GUVI: Retrieval of thermospheric composition and temperature. Earth Space Sci. 2 (1), 1–37. doi:10.1002/2014EA000035
Meier, R., Picone, J., Drob, D., and Roble, R. (2001). Similarity transformation-based analysis of atmospheric models, data, and inverse remote sensing algorithms. J. Geophys. Res. 106 (A8), 15519–15532. doi:10.1029/2001JA000062
National Academies of Sciences Engineering and Medicine (2020). Progress toward Implementation of the 2013 decadal Survey for solar and space physics: A Midterm Assessment. Washington, DC: The National Academies Press. doi:10.17226/25668
National Research Council (2013). Solar and space physics: A science for a Technological Society. Washington, DC: The National Academies Press. doi:10.17226/13060
Oberheide, J., Forbes, J. M., Zhang, X., and Bruinsma, S. L. (2011). Climatology of upward propagating diurnal and semidiurnal tides in the thermosphere. J. Geophys. Res. 116 (A11). doi:10.1029/2011JA016784
Oberheide, J., Pedatella, N., Gan, Q., Kumari, K., Burns, A., and Eastes, R. (2020). Thermospheric composition O/N response to an Altered Meridional mean circulation during sudden stratospheric warmings observed by GOLD. Geophys. Res. Lett. 47 (1). doi:10.1029/2019GL086313
Oberheide, J., Shiokawa, K., Gurubaran, S., Ward, W., Fujiwara, H., Kosch, M., et al. (2015). The geospace response to variable inputs from the lower atmosphere: A review of the progress made by Task Group 4 of CAWSES-II. Prog. Earth Planet. Sci. 2 (1), 2. doi:10.1186/s40645-014-0031-4
Offermann, D., Jarisch, J., Schmidt, H., Oberheide, J., Grossmann, K. U., Gusev, O., et al. (2007). The “wave turbopause”. J. Atmos. Solar-Terrestrial Phys. 69 (17), 2139–2158. doi:10.1016/j.jastp.2007.05.012
Pedatella, N., and Liu, H. L. (2018). The influence of Internal atmospheric variability on the ionosphere response to a Geomagnetic storm. Geophys. Res. Lett. 45 (10), 4578–4585. doi:10.1029/2018GL077867
Pedatella, N., Oberheide, J., Sutton, E., Liu, H. L., Anderson, J., and Raeder, K. (2016). Short-term nonmigrating tide variability in the mesosphere, thermosphere, and ionosphere. JGR. Space Phys. 121 (4), 3621–3633. doi:10.1002/2016JA022528
Picone, J. M., Hedin, A. E., Drob, D. P., and Aikin, A. C. (2002). NRLMSISE-00 empirical model of the atmosphere: Statistical comparisons and scientific issues. J. Geophys. Res. 107 (A12), 15–21. doi:10.1029/2002JA009430)
Picone, J. M., Meier, R. R., and Emmert, J. T. (2013). Theoretical tools for studies of low-frequency thermospheric variability. J. Geophys. Res. Space Phys. 118 (9), 5853–5873. doi:10.1002/jgra.50472
Qian, L., Burns, A. G., Solomon, S. C., and Wang, W. (2013). Annual/semiannual variation of the ionosphere. Geophys. Res. Lett. 40 (10), 1928–1933. doi:10.1002/grl.50448
Qian, L., Gan, Q., Wang, W., Cai, X., Eastes, R., and Yue, J. (2022). Seasonal variation of thermospheric composition observed by NASA GOLD. J. Geophys. Res. Space Phys. 127 (6), e2022JA030496. doi:10.1029/2022JA030496
Qian, L., Solomon, S. C., and Kane, T. J. (2009). Seasonal variation of thermospheric density and composition. J. Geophys. Res. 114 (A1). doi:10.1029/2008JA013643
Qian, L., and Solomon, S. (2012). Thermospheric density: An Overview of temporal and spatial variations. Space Sci. Rev. 168 (1), 147–173. doi:10.1007/s11214-011-9810-z
Qian, L., and Yue, J. (2017). Impact of the lower thermospheric winter-to-summer residual circulation on thermospheric composition. Geophys. Res. Lett. 44 (9), 3971–3979. doi:10.1002/2017GL073361
Rishbeth, H. (1998). How the thermospheric circulation affects the ionospheric F2-layer. J. Atmos. Solar-Terrestrial Phys. 60 (14), 1385–1402. doi:10.1016/S1364-6826(98)00062-5
Sassi, F., McCormack, J., and McDonald, S. (2019). Whole atmosphere coupling on Intraseasonal and Interseasonal time scales: A potential Source of increased predictive Capability. Radio Sci. 54 (11), 913–933. doi:10.1029/2019RS006847
Solomon, S., Liu, H. L., Marsh, D., McInerney, J., Qian, L., and Vitt, F. (2019). Whole atmosphere climate change: Dependence on solar activity. JGR. Space Phys. 124 (5), 3799–3809. doi:10.1029/2019JA026678
Thayer, J., Tobiska, W., Pilinski, M., and Sutton, E. (2021). ‘Remaining Issues in upper atmosphere satellite drag’, space weather effects and Applications. Washington, D.C., United States: American Geophysical Union, 111–140. doi:10.1002/9781119815570.ch510.1002/9781119815570.ch5
Vadas, S., Liu, H. L., and Lieberman, R. (2014). Numerical modeling of the global changes to the thermosphere and ionosphere from the dissipation of gravity waves from deep convection. J. Geophys. Res. Space Phys. 119 (9), 7762–7793. doi:10.1002/2014JA020280
Yamazaki, Y., and Richmond, A. (2013). A theory of ionospheric response to upward-propagating tides: Electrodynamic effects and tidal mixing effects. J. Geophys. Res. Space Phys. 118 (9), 5891–5905. doi:10.1002/jgra.50487
Yuan, T., Stevens, M., Englert, C., and Immel, T. (2021). Temperature tides across the mid-Latitude summer turbopause measured by a Sodium lidar and MIGHTI/ICON. J. Geophys. Res. Atmos. 126 (16), e2021JD035321. doi:10.1029/2021JD035321
Keywords: thermosphere, ionosphere, temperature, mass density, composition, space weather, space climate
Citation: Jones M Jr, Emmert JT, Gan Q and Yue J (2022) On the importance of neutral composition and temperature measurements in the 100–200 km altitude region. Front. Astron. Space Sci. 9:1062967. doi: 10.3389/fspas.2022.1062967
Received: 06 October 2022; Accepted: 18 November 2022;
Published: 29 November 2022.
Edited by:
Philip J. Erickson, Massachusetts Institute of Technology, United StatesCopyright © 2022 Jones, Emmert, Gan and Yue. This is an open-access article distributed under the terms of the Creative Commons Attribution License (CC BY). The use, distribution or reproduction in other forums is permitted, provided the original author(s) and the copyright owner(s) are credited and that the original publication in this journal is cited, in accordance with accepted academic practice. No use, distribution or reproduction is permitted which does not comply with these terms.
*Correspondence: McArthur Jones Jr, bWNhcnRodXIuam9uZXNAbnJsLm5hdnkubWls