 Riley N. Troyer1*
 Allison N. Jaynes1
 Stephen R. Kaeppler2
 Roger H. Varney3
 Ashton S. Reimer4
 Sarah L. Jones5
- 1University of Iowa, Department of Physics and Astronomy, Iowa City, IA, United States
- 2Clemson University, Department of Physics and Astronomy, Clemson, SC, United States
- 3University of California, Los Angeles, Department of Atmospheric and Oceanic Sciences, Los Angeles, CA, United States
- 4Formerly of SRI International, Menlo Park, CA, United States
- 5Formerly of National Aeronautics and Space Administration, Goddard Space Flight Center, Greenbelt, MD, United States
Pulsating aurora are common diffuse-like aurora. Studies have suggested that they contain higher energy particles than other types and are possibly linked to substorm activity. There has yet to be a quantitative statistical study of the variation in pulsating aurora energy content related to substorms. We analyzed the inverted energy content from 53 events using the Poker Flat Incoherent Scatter Radar. To reduce the uncertainty, we split the differential energy flux into low and high energy using the limit of 30 keV. We also analyzed the lower altitude boundary of the electron density profile, characterized by a number density of
1 Introduction
Pulsating aurora are much different than the bright curtains of discrete aurora that often precede them. Diffuse and barely visible to the naked eye, this type of aurora is most often observed a few hours after magnetic midnight (e.g., Oguti et al., 1981; Jones et al., 2011). Often lasting for many hours, pulsating aurora can cover large portions of the sky and in some cases expand over entire sections of the auroral region (Jones et al., 2013). Using SuperDarn and imager data, Bland et al. (2021) found that around half of pulsating aurora events extend between 4 and 5 h of magnetic local time and between 62° and 70° in magnetic latitude. Over this area, auroral patches blink on and off with periods ranging up to around 20 s (e.g., Davis, 1978; Lessard, 2012). Adding to the auroral display, individual patches can be remarkably varied with differing periods, shapes, and sizes typically between 10s and 100s of kilometers (Johnstone, 1978; Lessard, 2012). Figures 1A1–A3 shows a typical example of pulsating aurora that occurred on 13 October 2016 over the Poker Flat Research Range. The red oval highlights a patch that turns on and off during the three images.
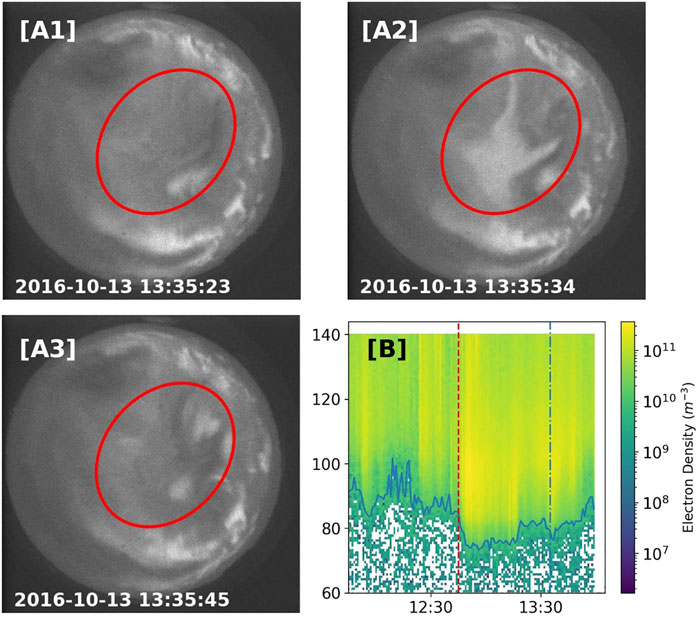
FIGURE 1. (A1–A3) show a series of 428 nm images from the Poker Flat Research Range All Sky Imager with several pulsating aurora patches of differing sizes. Even though the imaging cadence of 12 s is longer than some pulsating periods, we can still identify pulsating aurora. The red dot indicates the center of each image and thus the approximate location of the vertical PFISR beam. (B) is the PFISR electron number density data for a pulsating aurora event on 13 October 2016. The data is plotted vs. altitude in km and universal time. The dashed red line indicates the start of pulsating aurora. The dashed and dotted blue line indicates when the images were taken. The radar stopped taking data before the pulsating aurora ended. The solid blue line indicates the lowest altitude where Ne = 1010 m−3.
Numerous studies have shown that the electrons responsible for pulsating aurora originate in the equatorial region of the outer Van Allen radiation belt. These electrons are pitch-angle scattered into the upper-atmosphere through wave-particle interactions, most likely with lower-band chorus waves (Nishimura et al., 2010, 2011; Jaynes et al., 2013; Kasahara et al., 2018; Hosokawa et al., 2020). Previous studies have found that the energy range of pulsating aurora electrons is substantially higher than other auroral types, ranging between 10s and 100s of keV (e.g., Whalen et al., 1971; Sandahl et al., 1980). Tesema et al. (2020b) verified this statistically using 253 pulsating aurora events observed by the DMSP, POES, and FAST spacecraft. Within a single event, the total energy flux and hardness can vary. Jones et al. (2009) notes often seeing a decrease in the differential energy flux of 0.5–32.5 keV electrons throughout an event. Hosokawa and Ogawa (2015) found, using the European Incoherent Scatter Radar, that the energy spectrum of pulsating aurora is harder when a patch is “on” versus when it is “off” with only background aurora present.
Some studies have attempted to classify different types of pulsating aurora. For instance, Royrvik and Davis (1977) classified events into patches, arcs, and arc segments. More recently, Grono and Donovan (2018) made a distinction between the quickly varying amorphous pulsating aurora (APA), more regular patchy pulsating (PPA) aurora, and non-pulsating patchy aurora (nPPA). Tesema et al. (2020a) used incoherent scatter radar to look at the electron density profile between APA, PPA, and nPPA. They found that PPA and nPPA were associated with enhanced electron densities below 100 km when compared with APA.
Several papers regarding the height of pulsating aurora indicate that there may be a relation between peak differential energy flux of precipitating electrons and substorm onset. In the two events that Oyama et al. (2017) analyzed, they found a drop to lower altitudes following substorm onset in the atmospheric electron densities of pulsating aurora. This would indicate an influx of higher energy electrons capable of penetrating further into the atmosphere. These results are similar to the statistical study of Hosokawa and Ogawa (2015) who showed that the electron density profile of pulsating aurora extends lower in altitude during periods with a large AE index (
These previous investigations make a strong case for a link between substorm onset and AE index and both the total energy flux and spectral hardness of pulsating aurora. More energetic events seem to occur right after substorm onset and for higher AE indices. However, direct evidence supporting this hypothesis has yet to be established. Providing this evidence will be an important step in understanding how energy is transferred from the magnetosphere to the atmosphere. There are many reasons why this is important, but one which has recently become more apparent is the depletion of ozone due to pulsating aurora produced NOx and HOx (Turunen et al., 2016; Verronen et al., 2021). In this paper, we provide statistical evidence, using inverted energy content, that substorm onset and AE index are correlated with both a larger and harder differential energy flux during pulsating aurora. The results shown here both confirm the high-energy nature of pulsating aurora and specify how pulsating aurora energies are correlated with substorm onset and AE index.
2 Data
This paper presents a data set of 57 pulsating aurora events between 2012 and 2021, four of which (2015-01-13, 2017-08-17, 2018-12-30, and 2021-01-13) were not usable for our energy inversion. We visually identified pulsating aurora using all sky images and used the classifications of both Royrvik and Davis (1977) and Grono and Donovan (2018) when doing so. This data was captured over 51 days with the Poker Flat Research Range All Sky Imager (PFRR ASI). A table with the dates of all 51 days can be found in the supplemental material and the data can be found in Troyer et al. (2022). The PFRR ASI takes an image approximately every 12 s at 428 nm, 557 nm, and 630 nm. We used the 428 nm images. It is worth noting that despite the 12 s period of the camera, we can still accurately identify pulsating aurora, see Figures 1A1–A3 as an example.
For each of these pulsating aurora events, the Poker Flat Incoherent Scatter Radar (PFISR) was running one of the D-region modes (MSWinds23, MSWinds26, or MSWinds27). For more details about these modes, see Kaeppler et al. (2020). These modes all use 13-baud Barker codes with 10 μs baud, oversampled at 5μs (0.75 km range resolution) to provide electron density as function of range and time over ranges between 40 and 144 km. This study uses 1 min integration times, which means the electron density profiles are averaged over many cycles of the pulsating aurora. These modes all use four beam directions (magnetic zenith, vertical, north-west, and north-east). This study uses the vertical beam data since it is systematically more sensitive than the magnetic zenith direction at PFISR. The magnetic zenith is close to the phased-array antenna grating lobe steering limit. Furthermore, the MSWinds27 modes revisit the beams unevenly such that the vertical beam receives 16 times more pulses than the other beam directions, resulting in a factor of 4 improvement in the statistical uncertainty relative to the other beam directions. The vertical beam is
3 Analysis
In this study, we quantify the differential energy flux of pulsating aurora, in particular, the higher energy portion. Previous investigations have indicated that the energy of pulsating aurora varies significantly both within and between events, and is correlated with substorm activity (Jones et al., 2009; Wing et al., 2013; Hosokawa and Ogawa, 2015). Based on these results, we chose to examine variations related to magnetic local time (MLT), AE index, and an epoch associated with substorm onset temporal proximity. We set an epoch time of 0 to substorm onsets taken from lists created by Newell and Gjerloev (2011), Forsyth et al. (2015), and Ohtani and Gjerloev (2020). We chose these three lists because they cover a time period that covers the range of dates in our data. Each method identifies substorms in a slightly different way, so by including all three we can identify more events over a broader range of criteria. To make sure that one method is not biasing the results, we repeated our analysis using each individual list and found that they all had similar behaviors. If a substorm onset is repeated in more than one list, we use the onset closest to the pulsating aurora event. We limited these substorms to those that occurred within ±15° longitude and ±8° latitude of the Poker Flat Research Range. The substorm onset lists may not be as precise as a skilled observer, but due to the statistical nature of this study we were unable to classify by hand. However, we believe any associated error will be smaller than the 20 min time bins that we use. For the AE indices, we used archived 10-min averaged predicted values (Luo et al., 2013). For every 1-min electron density profile we find the closest in time AE index and assign that to the data point.
As a proxy for energy, we chose the lower altitude boundary that PFISR measured a number density of Ne = 1010 m−3 for each 1-min integrated altitude profile. Additionally, to meet this criteria, the associated error had to be less than 5 × 10⁹ m−3. We chose these values somewhat arbitrarily given that they are round numbers near the detection limit of PFISR. However, we did test the sensitivity by varying the threshold up to an order of magnitude higher and rerunning the analysis. When doing this, we found that the behavior did not change. Future, more sensitive instruments could use a smaller density threshold and thus detect lower altitudes. Finally, we implemented an outlier-rejection algorithm to remove high power returns that are not consistent with the expected electron density profile from precipitation. The D-region data can be cluttered by range-aliased satellite echoes, airplanes in antenna sidelobes, and various types of interference. Most of these clutter sources appear as localized outliers in the power data confined to one or two range-gates. We expect a realistic electron density profile to extend over 10 s of km in altitude and be monotonically decreasing with altitude. We compute the median electron density over 5 km around a data point and check that it is less than the median electron density 20 km above that point. Furthermore, we check that there are not any NaN or negative electron density estimates in the 20 km above that point. If any of these checks fails, we continue the search at a higher altitude.
For context, we have also included plots using the altitude of the peak electron density. These are shown in Figure 3. Overall, the trend are similar but less pronounced than in Figure 2, with the exception of magnetic local time.
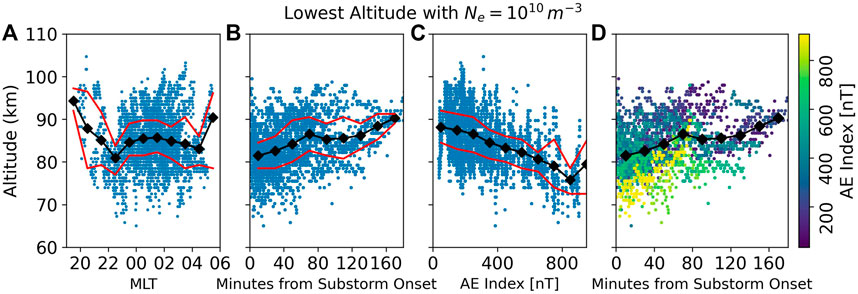
FIGURE 2. Lowest altitude PFISR measurements during pulsating aurora with Ne = 1010 m−3 plotted versus magnetic local time (A), time from the nearest substorm onset (B), AE index (C), and combined substorm and AE (D). The black diamonds indicate the average altitude for the surrounding hour, 20 min, 200 nT of AE, and 20 min respectively. The red lines indicate the 25% and 75% quartiles.
3.1 Magnetic local time
Figure 2A shows the altitude boundary values compared to MLT as calculated from the IGRF model for 2020. As we would expect, a majority of the measurements during pulsating aurora occurred several hours after magnetic midnight. Previous studies have shown that this is the most common time for pulsating aurora (Oguti et al., 1981; Jones et al., 2011). The hourly averages shown by the black diamonds centered on each hour indicate that there is little, if any, dependence on MLT. The peak electron density shows a stronger MLT dependence as illustrated in Figure 3. This is in agreement with previous studies of peak electron density altitude and MLT (Hosokawa and Ogawa, 2015; Partamies et al., 2017; Bland et al., 2019; Tesema et al., 2020a; Nanjo et al., 2021). This indicates that the more energetic electrons depend less on MLT and more on substorm activity, while the opposite is true of the lower energy electrons. However, it is also possible that our data is not an accurate representation in relation to MLT due to the wide scatter and limited statistics for several time bins. In addition, we requested instrument runs during the most common time for pulsating aurora, so the data is biased towards that period. It would be interesting to investigate this disparity in future studies.
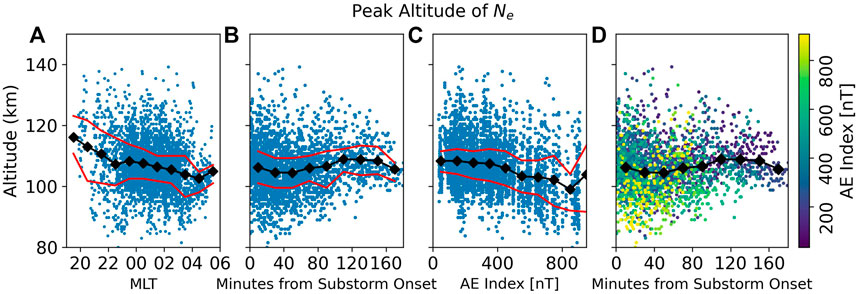
FIGURE 3. Altitude of the peak electron density in PFISR measurements during pulsating aurora plotted versus magnetic local time (A), time from the nearest substorm onset (B), AE index (C), and combined substorm and AE (D). The black diamonds indicate the average altitude for the surrounding hour, 20 min, 200 nT of AE, and 20 min respectively. The red lines indicate the 25% and 75% quartiles.
3.2 Substorm onset and AE index
Figure 2B shows the altitude boundary with Ne = 1010 m−3 compared to substorm onset. Here we see that lower altitudes are more common closer to substorm onset, indicating a hardening of the energy content. These results are similar to that of Oyama et al. (2017), who found both an enhancement and lowering of electron densities just after substorm onsets for several case study pulsating aurora events. Our work extends these findings to a statistical dataset.
Figure 2C shows the altitude boundary with Ne = 1010 m−3 compared to the closest in time 10-min averaged AE index. Similar to substorm onset temporal proximity, there is a clear relation between a higher AE value and lower altitudes. This is similar to the results of Hosokawa and Ogawa (2015) who found that the peak altitude of pulsating aurora lowers during higher AE indices. However, our measurements differ in that the peak altitude is a proxy for an average energy flux, whereas our lower altitude boundary is more representative of the energy content hardness.
We combined Figures 2B,C to produce Figure 2D. Here we have colored the markers of Figure 2B based on AE index. This result shows that both substorm onset temporal proximity and AE index play a role in varying the lower altitude boundary. The lowest altitudes tend to occur with both a high AE index and close temporal proximity to a substorm. In regards to the statistics, our events cover a wide range of AE indices with 10 occurring during periods with AE
We repeated the above analysis with the AL index and obtained similar results. A more negative AL index corresponded to lower altitudes. We’ve included this plot in the supplementary materials.
It is more typical for studies to concentrate on the altitude of the peak electron density (Jones et al., 2009; Hosokawa and Ogawa, 2015; Oyama et al., 2017). We chose a different metric as we wanted a proxy that would more closely represent the flux of higher energy particles. This approach is not perfect as a higher flux of slightly lower energy particles could produce a similar boundary to a lower flux of higher energy particles. While systematic changes in the background density dependent on time of day, season, etc. could bias these results, we believe that because the background density is usually below the detection limit of PFISR, this effect will be small enough that it will not have a meaningful impact (Kaeppler et al., 2020). Any altitude metric is still only a proxy for energy, but this one also contains other useful information. One of the main goals of this work is to provide data to help understand the atmospheric effects of pulsating aurora such as ozone depletion. In this regard, atmospheric changes are more important than the original energy flux. For instance, studies of energetic particle precipitation indicate that an energy flux deposited at 100 km may have less of an impact on ozone production than an energy flux deposited at 80 km (Verronen et al., 2021). Thus, by choosing to measure altitude from a lower boundary instead of the peak electron density, we are able to more closely connect our measurements to possible atmospheric effects. Finally, due to the limitations of a proxy such as this, the reader should view Figure 2 as additional contextual information. For explicit values, we performed inversions of the full electron density profile to estimate the incoming differential energy flux. See Section 3.3 for these results.
3.3 Energy spectra from electron density inversion
Our analysis of the lower altitude boundary with Ne = 1010 m−3 indicates that both AE index and substorm onset have substantial impacts on how hard the pulsating aurora energy content can be. However, this metric is only a proxy for hardness. To investigate further, we solved the inverse problem required to convert the PFISR electron densities into a differential energy flux. To do this, we used the process outlined in Semeter and Kamalabadi (2005). We assumed that the pitch angle distribution was isotropic (Whalen et al., 1971; Sandahl et al., 1980). We also assumed that the 1-min PFISR integrated electron density varied slowly. While Hosokawa and Ogawa (2015) showed that the electron density can vary between the on and off phases of pulsating aurora, these changes occur at a sub-minute frequency and so will be smoothed over in the PFISR integration. However, if these assumptions are not valid it could change our results. We describe our exact implementation of the inversion process in Supplementary Appendix S1. In an inverse problem such as this, there are multiple spectra that could result in a reasonably good fit of the density profile, making the problem ill-defined. To pick the best fit, we chose the solution that maximized the Berg Entropy. As Semeter and Kamalabadi (2005) states, this solution “may be viewed as the most noncommittal approach with respect to the unavailable information.” Because of these uncertainties that are inherent to the inversion process, it is not useful to look at the finer shape of the differential energy flux. Instead, to provide a more robust analysis, we chose an energy threshold of 30 keV to separate the low and high portions of the differential energy flux and integrated the two regions. This gives us an average low and high energy flux and limits the dependence of our results on the smaller scale details.
The largest source of error in the inversion process is likely the assumed atmospheric chemistry that connects PFISR observations to an ionization rate via a recombination coefficient. This is still an ongoing area of research, especially for the D-region. As our primary chemistry model, we used the Glukhov-Pasko-Inan (GPI) model (Glukhov et al., 1992; Lehtinen and Inan, 2007). This has been shown to perform well for the D-region (Marshall et al., 2019). For the E-region, we set the coefficient values above 90 km to those calculated by Gledhill (1986) for nighttime aurora. The Gledhill model is suitably close to that of Vickrey et al. (1982) above 90 km and the Vickrey model performs well in this region (Sivadas et al., 2017). While we could have used the Vickrey model, we believe the Gledhill model is more relevant for this data as it was derived for nighttime auroral activity. However, both models are only rough estimates of the recombination coefficient. We refer to this adjusted model as GPI+. To provide context to our results calculated using GPI+, we inverted each density profile using three additional chemistry models. These results can be found in Supplementary Appendix S1.
After performing the inversions, we found the geometric mean of the differential energy flux for
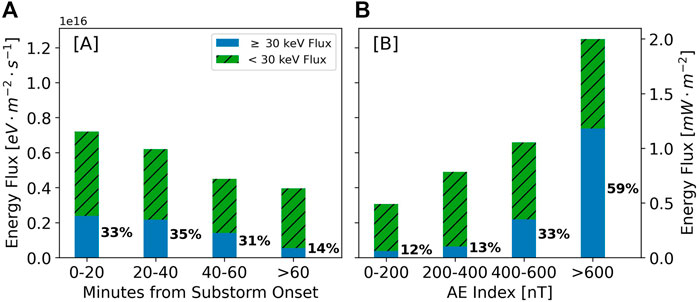
FIGURE 4. The high (
The differential energy flux associated with AE index varies even more dramatically. In highly perturbed times of AE
Assumptions about the atmospheric chemistry can vary the absolute differential energy flux, but for every model we found the same relative behavior. While not shown here, the relative behavior was also the same when we used threshold values of 50 keV and 100 keV. For
4 Discussion
Our work builds on Wing et al. (2013), Hosokawa and Ogawa (2015), and Oyama et al. (2017), whose studies showed that the altitude of pulsating aurora can decrease after substorm onset and for periods of high AE index. It also builds on papers such as Jones et al. (2009), which demonstrated that the inverted differential energy flux of particular pulsating aurora events can vary throughout the event. These studies suggest that the total energy flux and spectral hardness of pulsating aurora could be influenced by substorm onset and AE index, but does not make a direct statistical connection.
Figure 4 demonstrates, statistically, that the total differential energy flux of pulsating aurora is highly variable. Second, they show that pulsating aurora events can have large, and in some cases majority, contributions from
The link between substorms and pulsating aurora is likely through whistler-mode waves, which are known to drive instances of pulsating aurora (Nishimura et al., 2010, 2011; Jaynes et al., 2013; Kasahara et al., 2018; Hosokawa et al., 2020). There is a well documented relation between substorm activity post-midnight and whistler-mode wave generation near the equator (Thorne et al., 1974; Tsurutani and Smith, 1974). The proposed mechanism connecting them is Doppler-shifted cyclotron resonance with 10–100 keV substorm injected electrons (Dungey, 1963; Kennel and Petschek, 1966). In addition, the amplitude of already present whistler-mode waves can vary with substorm injection. Meredith et al. (2000) showed that between 3.8 < L < 6 whistler-mode amplitudes increased after a substorm and then decayed with a timescale of τ ≈ 1.1 h. Figure 5 shows that the timescale associated with the
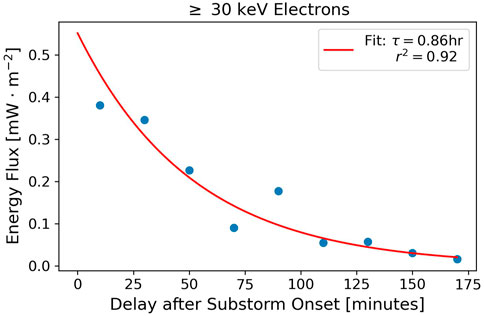
FIGURE 5. The decay rate of the differential energy flux from electrons with energies
Also, Figure 4 confirms the inherent energetic nature of pulsating aurora that previous case studies have suggested. Understanding the nature of pulsating aurora is important when assessing their atmospheric impact. Pulsating aurora are very common (Oguti et al., 1981) and can be long-lasting (Jones et al., 2013), thus they could represent an important transfer of energy between the magnetosphere and lower ionosphere. To assess the subsequent impact, both the total energy flux and the hardness of the spectra are of high relevance. Higher energy electrons reach further into the atmosphere and thus have a higher probability of influencing terrestrial climate through processes like NOx and HOx based ozone depletion (Turunen et al., 2016; Verronen et al., 2021, and references therein). We found that the hardest events occur close in time to substorm onset and for high AE indices. In short, our results can be used to more accurately parameterize the atmospheric consequences of pulsating aurora. For instance, combining the results of Figure 4 with those of Bland et al. (2021), we can perform a back-of-the-envelope calculation to estimate the incoming power of a typical pulsating aurora event. We will assume an event extending between 62° and 70° magnetic latitude and 4 h of magnetic local time. Using this, approximately 4.8 gigawatts (GW) of power would be entering the atmosphere during periods with AE
In Figure 2B it appears that within 20 min of substorm onset, what could be considered the expansion phase, is the most common time for our pulsating aurora. That statistic seems to be in contradiction to Partamies et al. (2017), who found that the most common substorm phase for pulsating aurora was the recovery phase. While occurrence rates were not the focus of this work, it is worth examining where this difference could come from. There are two potential reasons. One, our search for pulsating aurora differs. Partamies et al. (2017) only identified pulsating aurora when it was the most dominant type, stating that “ our event selection criteria favors recovery phases over the expansion phases where brighter aurora plays a major role in the auroral displays.” Our search included pulsating aurora when it was the most visually dominant type of aurora directly overhead, but not necessarily across the entire field of view. Two, Partamies et al. (2017) used a magnetometer at the imager locations while our search was semi local and encompassed a much larger geographic region, so our ratio of substorms to pulsating aurora events was likely higher.
It is worth describing possible sources of systematic error in our results. One, several previous studies found that the energy content becomes harder during the on phase of pulsating aurora (Whalen et al., 1971; Hosokawa and Ogawa, 2015). Our data is integrated over 1 minute, so these variations will likely be smoothed out, thus reducing the hardness. Two, we are not capturing the full range of the energy flux. Ionization associated with electron energies less than about 1 keV usually peaks above the altitudes that PFISR measures in the D-region mode (Fang et al., 2010). If the energy flux for this portion of the spectrum is significant, we could be overestimating the hardness and underestimating the total energy. Three, the sensitivity of PFISR limits our ability to detect higher energy, lower flux electrons. If populations such as these are present, we could be underestimating the hardness. Four, we only selected pulsating aurora that were in the center of the imager, but we didn’t account for times that the PFISR beam wasn’t directly on a pulsating patch. If the precipitating flux is highly local, we could be underestimating the energy flux during such periods.
The statistical spread of energies in most of our bins is greater than an order of magnitude. This is an indication of how variable pulsating aurora energies can be, but also suggests other variables are involved than just the ones we looked at. One possibility is the type of pulsating aurora. As Tesema et al. (2020a) found, the electron density profile, and thus likely the energy, varies between the types identified by Grono and Donovan (2018). Given the image cadence of our data, we could not accurately distinguish between the different types. Another possibility is substorm phase. Due to the nature of our substorm onset lists, it was not feasible for us to classify based on substorm phase. However, the length of the expansion and recovery phase of different substorms can vary (Chu et al., 2015). Given that our metric was based only on time from substorm onset, it is likely that some of our bins include events from multiple different phases. If there is a difference in energy content between the expansion and recovery phase, this would be another unaccounted for variable. We do see possible bimodal distributions in histograms of the
5 Summary
It has been suspected that substorm onset and AE index are linked to variations in the energy flux of incoming electrons responsible for pulsating aurora. Studies investigating proxies for energy, such as the altitude of the peak electron density are the basis of this hypothesis. In this paper, we presented statistical evidence, using inverted energy content, which supports this hypothesis. Pulsating aurora that occur right after substorm onset and/or are associated with high AE values are more likely to have a higher energy flux, and a harder energy spectrum.
• The differential energy flux of pulsating aurora correlates strongly with the substorm onset and AE index.
• In relation to substorm onset the total differential energy flux varies between 1.15 and 0.63 mW ⋅m−2 for
• In relation to substorms, the differential energy flux remains hard out to 1 h after onset before softening.
• In relation to AE index the total differential energy flux varies between 2.00 and 0.49 mW ⋅m−2 for AE
• We estimate that for a typically pulsating auroral event occurring
Data availability statement
Imager data referenced in this paper is available from https://doi.org/10.5281/zenodo.6878145 and was derived from the University of Alaska Fairbanks Geophysical Institute archive. The incoherent scatter radar data referenced in this paper is available from AMISR: https://data.amisr.com/database/pfisr/level2/nenotr/0.9.2018.11.22/. The AE and AL indices referenced in this paper are available from LASP: https://lasp.colorado.edu/space_weather/dsttemerin/archive/dst_years.html. The substorm onset lists referenced in this paper are available from SuperMAG: https://supermag.jhuapl.edu/substorms/?tab=download.
Author contributions
RT wrote the manuscript and performed the data analysis for the study. AJ helped edit the manuscript and provided feedback and advise for the data analysis. SK wrote a portion of the code used to analyze the data, provided expertise on the PFISR measurements, and helped to edit the manuscript. RV and AR provided expertise and operational support for the PFISR measurements. In addition, RV helped to edit the manuscript, and wrote the PFISR appendix. SJ provided initial feedback and advise on the project and analysis.
Funding
This material is based upon work supported by the Poker Flat Incoherent Scatter Radar, which is a major facility funded by the National Science Foundation through cooperative agreement AGS-1840962 to SRI International. RT was supported by the NASA FINESST award 80NSSC20K1514 to the University of Iowa. AJ was supported by NSF CAREER grant 2045016 to the University of Iowa. SK was supported by Air Force Office of Scientific Research grant FA9550-19-1-0130 to Clemson University.
Acknowledgments
We acknowledge the help and advice of Robert Marshall, Nithin Sivadas, and Pekka Verronen in developing our inversion analysis. We acknowledge the substorm timing list identified by the SOPHIE technique Forsyth et al. (2015), the Newell and Gjerloev technique Newell and Gjerloev (2011), the Ohtani and Gjerloev technique Ohtani and Gjerloev (2020), the SMU and SML indices Newell and Gjerloev (2011); and the SuperMAG collaboration Gjerloev (2012).
Conflict of interest
Author AR is employed by LeoLabs Inc.
The remaining authors declare that the research was conducted in the absence of any commercial or financial relationships that could be construed as a potential conflict of interest.
Publisher’s note
All claims expressed in this article are solely those of the authors and do not necessarily represent those of their affiliated organizations, or those of the publisher, the editors and the reviewers. Any product that may be evaluated in this article, or claim that may be made by its manufacturer, is not guaranteed or endorsed by the publisher.
Supplementary material
The Supplementary Material for this article can be found online at: https://www.frontiersin.org/articles/10.3389/fspas.2022.1032552/full#supplementary-material
References
Barrett, J. L., and Hays, P. B. (1976). Spatial distribution of energy deposited in nitrogen by electrons. J. Chem. Phys. 64, 743–750. doi:10.1063/1.432221
Bland, E. C., Partamies, N., Heino, E., Yukimatu, A. S., and Miyaoka, H. (2019). Energetic electron precipitation occurrence rates determined using the syowa east SuperDARN radar. JGR. Space Phys. 124, 6253–6265. doi:10.1029/2018JA026437
Bland, E., Tesema, F., and Partamies, N. (2021). D-region impact area of energetic electron precipitation during pulsating aurora. Ann. Geophys. 39, 135–149. doi:10.5194/angeo-39-135-2021
Chu, X., McPherron, R. L., Hsu, T.-S., and Angelopoulos, V. (2015). Solar cycle dependence of substorm occurrence and duration: Implications for onset. JGR. Space Phys. 120, 2808–2818. doi:10.1002/2015JA021104
Davis, T. N. (1978). Observed microstructure of auroral forms. J. Geomagn. Geoelec. 30, 371–380. doi:10.5636/jgg.30.371
Dungey, J. W. (1963). Loss of Van Allen electrons due to whistlers. Planet. Space Sci. 11, 591–595. doi:10.1016/0032-0633(63)90166-1
Fang, X., Randall, C. E., Lummerzheim, D., Wang, W., Lu, G., Solomon, S. C., et al. (2010). Parameterization of monoenergetic electron impact ionization. Geophys. Res. Lett. 37, L22106. doi:10.1029/2010GL045406
Forsyth, C., Rae, I. J., Coxon, J. C., Freeman, M. P., Jackman, C. M., Gjerloev, J., et al. (2015). A new technique for determining substorm onsets and phases from indices of the electrojet (SOPHIE). J. Geophys. Res. Space Phys. 120, 10592–10606. doi:10.1002/2015JA021343
Gjerloev, J. W. (2012). The SuperMAG data processing technique. J. Geophys. Res. 117, A09213. doi:10.1029/2012JA017683
Gledhill, J. A. (1986). The effective recombination coefficient of electrons in the ionosphere between 50 and 150 km. Radio Sci. 21, 399–408. doi:10.1029/RS021i003p00399
Glukhov, V. S., Pasko, V. P., and Inan, U. S. (1992). Relaxation of transient lower ionospheric disturbances caused by lightning-whistler-induced electron precipitation bursts. J. Geophys. Res. 97, 16971–16979. doi:10.1029/92JA01596
Grono, E., and Donovan, E. (2018). Differentiating diffuse auroras based on phenomenology. Ann. Geophys. 36, 891–898. doi:10.5194/angeo-36-891-2018
Hedin, A. E. (1991). Extension of the MSIS thermosphere model into the middle and lower atmosphere. J. Geophys. Res. 96, 1159–1172. doi:10.1029/90JA02125
Hosokawa, K., Miyoshi, Y., Ozaki, M., Oyama, S. I., Ogawa, Y., Kurita, S., et al. (2020). Multiple time-scale beats in aurora: Precise orchestration via magnetospheric chorus waves. Sci. Rep. 10, 3380. doi:10.1038/s41598-020-59642-8
Hosokawa, K., and Ogawa, Y. (2015). Ionospheric variation during pulsating aurora. J. Geophys. Res. Space Phys. 120, 5943–5957. doi:10.1002/2015JA021401
Jaynes, A. N., Lessard, M. R., Rodriguez, J. V., Donovan, E., Loto’Aniu, T. M., and Rychert, K. (2013). Pulsating auroral electron flux modulations in the equatorial magnetosphere. JGR. Space Phys. 118, 4884–4894. doi:10.1002/jgra.50434
Jones, S. L., Lessard, M. R., Fernandes, P. A., Lummerzheim, D., Semeter, J. L., Heinselman, C. J., et al. (2009). PFISR and ROPA observations of pulsating aurora. J. Atmos. Solar-Terrestrial Phys. 71, 708–716. doi:10.1016/j.jastp.2008.10.004
Jones, S. L., Lessard, M. R., Rychert, K., Spanswick, E., Donovan, E., and Jaynes, A. N. (2013). Persistent, widespread pulsating aurora: A case study. JGR. Space Phys. 118, 2998–3006. doi:10.1002/jgra.50301
Jones, S. L., Lessard, M. R., Rychert, K., Spanswick, E., and Donovan, E. (2011). Large-scale aspects and temporal evolution of pulsating aurora. J. Geophys. Res. 116, A03214. doi:10.1029/2010JA015840
Kaeppler, S. R., Sanchez, E., Varney, R. H., Irvin, R. J., Marshall, R. A., Bortnik, J., et al. (2020). “Chapter 6 - incoherent scatter radar observations of 10–100kev precipitation: Review and outlook,” in The dynamic loss of earth’s radiation belts. Editors A. N. Jaynes, and M. E. Usanova (Elsevier), 145–197. doi:10.1016/B978-0-12-813371-2.00006-8
Kasahara, S., Miyoshi, Y., Yokota, S., Mitani, T., Kasahara, Y., Matsuda, S., et al. (2018). Pulsating aurora from electron scattering by chorus waves. Nature 554, 337–340. doi:10.1038/nature25505
Kennel, C. F., and Petschek, H. E. (1966). Limit on stably trapped particle fluxes. J. Geophys. Res. 71, 1–28. doi:10.1029/JZ071i001p00001
Kirkwood, S., and Osepian, A. (1995). Quantitative studies of energetic particle precipitation using incoherent scatter radar. J. Geomagn. Geoelec. 47, 783–799. doi:10.5636/jgg.47.783
Lehtinen, N. G., and Inan, U. S. (2007). Possible persistent ionization caused by giant blue jets. Geophys. Res. Lett. 34, L08804. doi:10.1029/2006GL029051
Lessard, M. R. (2012). “A review of pulsating aurora,” in Auroral phenomenology and magnetospheric processes earth and other planets (Washington, D.C.: American Geophysical Union), 197, 55–68.
Luo, B., Li, X., Temerin, M., and Liu, S. (2013). Prediction of the AU, AL, and AE indices using solar wind parameters. J. Geophys. Res. Space Phys. 118, 7683–7694. doi:10.1002/2013JA019188
Marshall, R. A., Xu, W., Kero, A., Kabirzadeh, R., and Sanchez, E. (2019). Atmospheric effects of a relativistic electron beam injected from above: Chemistry, electrodynamics, and radio scattering. Front. Astron. Space Sci. 6, 6. doi:10.3389/fspas.2019.00006
Meredith, N. P., Horne, R. B., Johnstone, A. D., and Anderson, R. R. (2000). The temporal evolution of electron distributions and associated wave activity following substorm injections in the inner magnetosphere. J. Geophys. Res. 105, 12907–12917. doi:10.1029/2000JA900010
Mitra, A. P. (1981). Chemistry of middle atmospheric ionization - a review. J. Atmos. Terr. Phys. 43, 737–752. doi:10.1016/0021-9169(81)90050-7
Nanjo, S., Hozumi, Y., Hosokawa, K., Kataoka, R., Miyoshi, Y., Oyama, S.-i., et al. (2021). Periodicities and colors of pulsating auroras: DSLR camera observations from the international space station. JGR. Space Phys. 126, e29564. doi:10.1029/2021JA029564
Newell, P. T., and Gjerloev, J. W. (2011). Substorm and magnetosphere characteristic scales inferred from the SuperMAG auroral electrojet indices. J. Geophys. Res. 116, A12232. doi:10.1029/2011JA016936
Nishimura, Y., Bortnik, J., Li, W., Thorne, R. M., Chen, L., Lyons, L. R., et al. (2011). Multievent study of the correlation between pulsating aurora and whistler mode chorus emissions. J. Geophys. Res. 116, A11221. doi:10.1029/2011JA016876
Nishimura, Y., Bortnik, J., Li, W., Thorne, R. M., Lyons, L. R., Angelopoulos, V., et al. (2010). Identifying the driver of pulsating aurora. Science 330, 81–84. doi:10.1126/science.1193186
Oguti, T., Kokubun, S., Hayashi, K., Tsuruda, K., Machida, S., Kitamura, T., et al. (1981). Statistics of pulsating auroras on the basis of all-sky TV data from five stations. I. Occurrence frequency. Can. J. Phys. 59, 1150–1157. doi:10.1139/p81-152
Ohtani, S., and Gjerloev, J. W. (2020). Is the substorm current wedge an ensemble of wedgelets?: Revisit to midlatitude positive bays. JGR. Space Phys. 125, e27902. doi:10.1029/2020JA027902
Osepian, A., Kirkwood, S., Dalin, P., and Tereschenko, V. (2009). D-region electron density and effective recombination coefficients during twilight - experimental data and modelling during solar proton events. Ann. Geophys. 27, 3713–3724. doi:10.5194/angeo-27-3713-2009
Oyama, S., Kero, A., Rodger, C. J., Clilverd, M. A., Miyoshi, Y., Partamies, N., et al. (2017). Energetic electron precipitation and auroral morphology at the substorm recovery phase. J. Geophys. Res. Space Phys. 122, 6508–6527. doi:10.1002/2016JA023484
Partamies, N., Whiter, D., Kadokura, A., Kauristie, K., Nesse Tyssøy, H., Massetti, S., et al. (2017). Occurrence and average behavior of pulsating aurora. J. Geophys. Res. Space Phys. 122, 5606–5618. doi:10.1002/2017JA024039
Royrvik, O., and Davis, T. N. (1977). Pulsating aurora: Local and global morphology. J. Geophys. Res. 82, 4720–4740. doi:10.1029/JA082i029p04720
Sandahl, I., Eliasson, L., and Lundin, R. (1980). Rocket observations of precipitating electrons over a pulsating aurora. Geophys. Res. Lett. 7, 309–312. doi:10.1029/GL007i005p00309
Semeter, J., and Kamalabadi, F. (2005). Determination of primary electron spectra from incoherent scatter radar measurements of the auroral<i>E</i>region. Radio Sci. 40, RS2006. doi:10.1029/2004RS003042
Sivadas, N., Semeter, J., Nishimura, Y., and Kero, A. (2017). Simultaneous measurements of substorm-related electron energization in the ionosphere and the plasma sheet. JGR. Space Phys. 122 (10528–10), 547. doi:10.1002/2017JA023995
Tesema, F., Partamies, N., Nesse Tyssøy, H., and McKay, D. (2020a). Observations of precipitation energies during different types of pulsating aurora. Ann. Geophys. 38, 1191–1202. doi:10.5194/angeo-38-1191-2020
Tesema, F., Partamies, N., Tyssøy, H. N., Kero, A., and Smith-Johnsen, C. (2020b). Observations of electron precipitation during pulsating aurora and its chemical impact. JGR. Space Phys. 125, e27713. doi:10.1029/2019JA027713
Thorne, R. M., Smith, E. J., Fiske, K. J., and Church, S. R. (1974). Intensity variation of ELF hiss and chorus during isolated substorms. Geophys. Res. Lett. 1, 193–196. doi:10.1029/GL001i005p00193
Troyer, R., Jaynes, A., Kaeppler, S., Varney, R., Reimer, A., and Jones, S. (2022). PFRR ASC Image Dataset for Troyer et al. 2022 (Substorm Activity as a Driver of Energetic Pulsating Aurora). doi:10.5281/zenodo.6878145
Tsurutani, B. T., and Smith, E. J. (1974). Postmidnight chorus: A substorm phenomenon. J. Geophys. Res. 79, 118–127. doi:10.1029/JA079i001p00118
Turunen, E., Kero, A., Verronen, P. T., Miyoshi, Y., Oyama, S.-I., and Saito, S. (2016). Mesospheric ozone destruction by high-energy electron precipitation associated with pulsating aurora. JGR. Atmos. 121 (852–11), 11861. doi:10.1002/2016JD025015
Verronen, P. T., Kero, A., Partamies, N., Szelag, M. E., Oyama, S.-I., Miyoshi, Y., et al. (2021). Simulated seasonal impact on middle atmospheric ozone from high-energy electron precipitation related to pulsating aurorae. Ann. Geophys. 39, 883–897. doi:10.5194/angeo-39-883-2021
Vickrey, J. F., Vondrak, R. R., and Matthews, S. J. (1982). Energy deposition by precipitating particles and Joule dissipation in the auroral ionosphere. J. Geophys. Res. 87, 5184–5196. doi:10.1029/JA087iA07p05184
Whalen, B. A., Miller, J. R., and McDiarmid, I. B. (1971). Energetic particle measurements in a pulsating aurora. J. Geophys. Res. 76, 978–986. doi:10.1029/JA076i004p00978
Keywords: pulsating aurora, substorm, incoherent scatter radar, energetic particle precipitation, chorus waves
Citation: Troyer RN, Jaynes AN, Kaeppler SR, Varney RH, Reimer AS and Jones SL (2022) Substorm activity as a driver of energetic pulsating aurora. Front. Astron. Space Sci. 9:1032552. doi: 10.3389/fspas.2022.1032552
Received: 31 August 2022; Accepted: 24 November 2022;
Published: 08 December 2022.
Edited by:
Olga V. Khabarova, Institute of Terrestrial Magnetism Ionosphere and Radio Wave Propagation (RAS), RussiaReviewed by:
Hilde Nesse Tyssøy, University of Bergen, NorwayEmma Bland, The University Centre in Svalbard, Norway
Copyright © 2022 Troyer, Jaynes, Kaeppler, Varney, Reimer and Jones. This is an open-access article distributed under the terms of the Creative Commons Attribution License (CC BY). The use, distribution or reproduction in other forums is permitted, provided the original author(s) and the copyright owner(s) are credited and that the original publication in this journal is cited, in accordance with accepted academic practice. No use, distribution or reproduction is permitted which does not comply with these terms.
*Correspondence: Riley N. Troyer, cmlsZXktdHJveWVyQHVpb3dhLmVkdQ==