- 1Department of Physics, University of Lagos, Lagos, Nigeria
- 2Department of Physics, Bamidele Olumilua University of Education, Science and Technology, Ikere-Ekiti, Nigeria
Apart from the rapid ionospheric response to geomagnetic forcing originating from the Sun during extreme space weather events, forcing from the lower atmosphere below still exerts a significant influence on the ionosphere during quiet-time conditions. This study examines the ionospheric response of the equatorial ionization anomaly (EIA) in the American sector to the combined influence of the cascades of sudden stratospheric warming (SSW) events and the geomagnetic storms that coexisted with them during the period of January–March 2016. We adopted a multi-instrument and multi-modeling approach with the study locations spanning ±40° geomagnetic latitudes. Our results showed a hemispheric asymmetry in the total electron content and change in total electron content (ΔTEC) distribution with higher enhancement clearly visible in the Northern Hemisphere in comparison to the Southern Hemisphere (NH). Semidiurnal signatures were observed in both ΔTEC and equatorial electrojet parameters for some days. The double-peak zonal mean zonal wind amplitude days supported the formation of the reverse fountain effects. The different SSW peak temperature days also showed either positive or negative ionospheric response. Generally, orientation of the prompt penetration electric field (PPEF) and their strengths at either daytime or nighttime played a weak role in the ionosphere response during some of the geomagnetic storms. The negative and positive ionospheric responses under geomagnetic storm conditions were ascribed to changes in the composition of the thermosphere, prompt penetration electric field (PPEF), and traveling atmospheric disturbances (TADs).
1 Introduction
Research studies from the ionospheric community have demonstrated that a major portion (80%) of the observed ionospheric variabilities can be ascribed to the physical mechanism associated with X-ray flares and geomagnetic storms due to extreme solar forcing (Goncharenko et al., 2018) while the remaining portion (20%) can be accounted for by different physical drivers, originating from the lower atmosphere (Forbes et al., 2000; Goncharenko et al., 2010a). Despite the identifications of these drivers originating from the lower atmosphere accounting for 20% of the variabilities in the upper atmosphere, systematic investigation of these lower atmospheric drivers still remains a daunting task owing to the rapid response of the ionosphere to both solar and magnetospheric drivers originating from the Sun (Goncharenko and Zhang 2008). However, despite these shortcomings, recent studies have shown clear evidence of the upward transfer of energy and momentum via propagation of atmospheric waves (tides, gravity waves, and planetary waves) during the sudden stratospheric warming (SSW) events. Sudden stratospheric warmings are dynamical meteorological phenomena associated with abrupt rise in stratospheric temperature by tens of Kelvin (Scherhag 1952; Liu et al., 2011). These events can be mainly classified into two types, major and minor warmings. Major warmings are associated with the complete reversal of the stratospheric zonal mean zonal winds, while minor warmings are associated with the steady deceleration of the stratospheric zonal mean zonal winds without an accompanying change in wind direction from westerly to easterly (Andrews et al., 1987; Chau et al., 2012; Vieira et al., 2017; Goncharenko et al., 2020). Matsuno (1971) attributed their occurrence to the non-linear interaction of the stratospheric zonal mean zonal wind flow with the upward vertically propagating planetary waves (Rossby waves).
These variabilities associated with forcing from the lower atmospheres during such atmospheric disturbances include alternate regions of cooling and warming in the mesosphere and lower thermosphere (MLT) using an ion temperature parameter obtained from the incoherent scatter radar (Goncharenko and Zhang, 2008)and semidiurnal variations in both the total electron content (TEC) and vertical drifts with morning enhancement and afternoon suppression (Chau et al., 2009; Chau et al., 2010; Fejer et al., 2010; Chau et al., 2012). Depletion of the electron density is related to changes in the thermosphere composition in the daytime hemisphere (Pedatella et al., 2016). For the nighttime hemisphere, more drastic changes were visible in the ionosphere such as weakening of ionospheric scintillations and the formation of an ionospheric hole arising from the depletion of the electron density (De Paula et al., 2015; Goncharenko et al., 2018). It is worth mentioning that most of the SSW studies’ investigations occurred during the period of low solar activity.
For the period of moderate to high solar activity, semidiurnal features in the TEC and vertical drift were reported during the 2013 SSW events (Goncharenko et al., 2013; Jonah et al., 2014). De Jesus et al. (2017a) reported a nighttime enhancement in the TEC during the 2014 major SSW event in March. Both the SSW events (2013 and 2014) were also reported to overlap with the occurrence of geomagnetic storms (Idolor et al., 2021, 2022). Modeling results using the thermosphere– ionosphere–mesosphere–electrodynamics general circulation model (TIME–GCM) of the vertical drifts for the 2013 SSW event showed a significant increase in daytime vertical drift of ∼100% associated with the moderate geomagnetic storm occurrence for the American sector (Maute et al., 2015). A similar report of positive ionospheric response in the TEC was presented in the American sector and negative ionospheric TEC response in the African sector associated with the overlap of the moderate geomagnetic storm with the 2013 SSW event (Idolor et al., 2022). Several studies have also shown an increase in TEC enhancement at the equatorial ionization anomaly (EIA) crest regions during some of the SSW events in the American sector (Goncharenko et al., 2013; Paes et al., 2014), while the EIA TEC suppression have been reported in the Brazilian sector (De Jesus et al., 2017b; Vieira et al., 2017).
As stated in previous studies, the variations in the TEC magnitude at the low-latitude regions during SSW events can be comparable to the TEC variations during the occurrence of a geomagnetic storm (Mannucci et al., 2005; Goncharenko et al., 2010a; Mosna et al., 2021). Geomagnetic storms are a major component of space weather. Geomagnetic storms are disturbances originating from the Sun that often leads to significant changes in the ionospheric density structures with overbearing negative consequences (degradation) on space-based and ground-based communication and navigation system (National Research Council, 2008; Akala and Adewusi 2020). Despite the earlier results mentioned on the overlapping of these SSW phenomena with geomagnetic storms, more concerted efforts are still required from the space weather community to resolve the attendant effects associated with the simultaneous overlap of the SSW events with geomagnetic storms (Goncharenko et al., 2021a). It is generally perceived that the combined force arising from these two distinct phenomena can result in more drastic ionospheric effects that can negatively affect space-based and ground-based technological infrastructures heavily relied on for daily economic activities (Idolor et al., 2021). The present study investigates the ionospheric response during 2016 SSW events in the American sector with the motive of distinctly characterizing the two geophysical drivers associated with the coupling of the lower and upper atmospheres in order to isolate their individual contributions to the ionospheric electrodynamics.
2 Data and methods of analysis
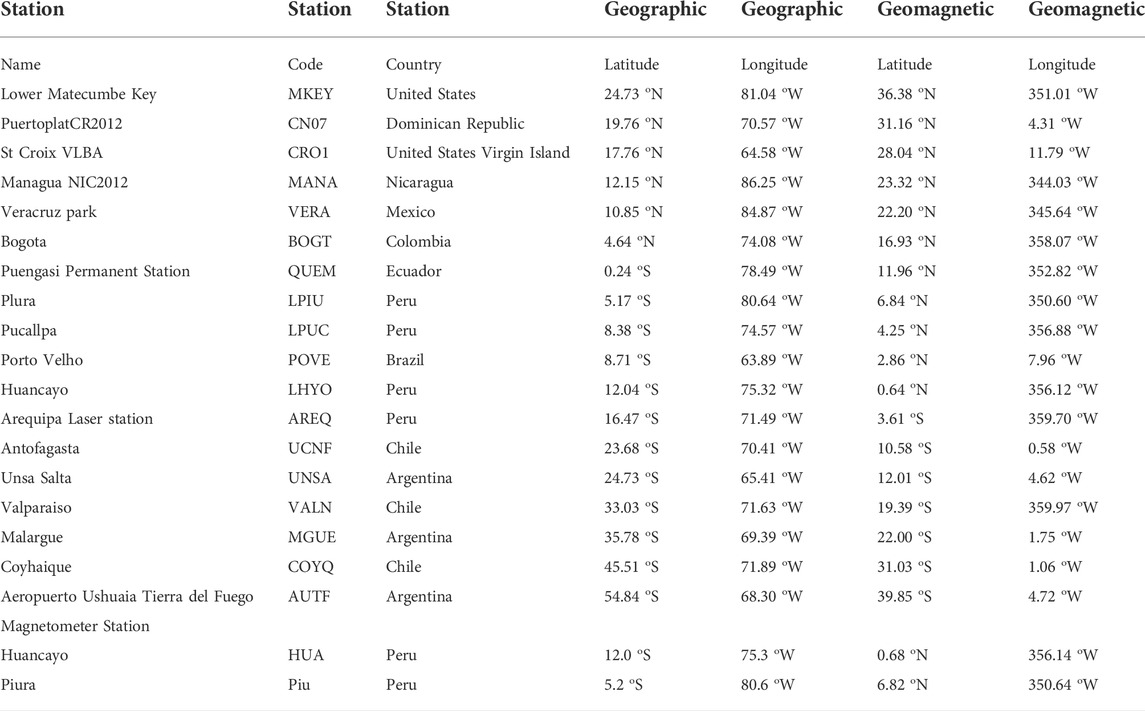
The map of the American sector showing the locations of global positioning system (GPS) receivers used in this study are presented in Figure 1. In the American sector, a chain of 18 GPS stations within the range of ±40° geomagnetic latitudes were used. Table 1 shows the list of GPS stations with their station codes, geography, and geomagnetic coordinates. Both the stratospheric temperature at 90°N and the zonal mean zonal wind at 60°N at the same pressure level of 10 hPa (about 32 km) from 1st January to 31st March 2016 used in this study were obtained from the National Oceanic and Atmospheric Administration (NOAA) website (https://downloads.psl.noaa.gov/Datasets/ncep.reanalysis.dailyavgs/pressure/) in the NetCDF format. In addition, all the available data of 38 years from the NOAA satellites from 1979 to 2015 prior to the occurrence of the 2016 SSW year investigated were used to generate both the historical mean of the temperature and zonal mean zonal wind. In order to probe the solar and geomagnetic conditions of the ionosphere, the F10.7 cm solar flux, Kp planetary index, and Dst index used in the present study were obtained from the Kyoto World Data Center (WDC) for geomagnetism (http://wdc.kugi.kyoto-u.ac.jp/kp/index.html), while the solar flux index was obtained from the Space Physics Data Facility website operated by the National Aeronautics and Space Administration (NASA) (http://omniweb.gsfc.nasa.gov/form/dx1.html). We classified all days with Kp ≤ 3 and the daily sum of all the three hourly Kp index (ƩKp
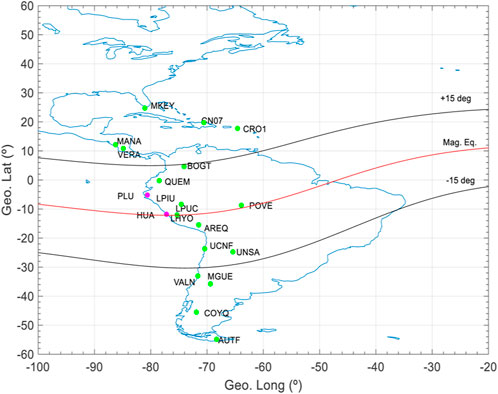
FIGURE 1. Map of the global positioning system (GPS) stations and magnetometer stations in the American sector (green and magenta).
The observational GNSS data used in this study were retrieved from network repositories of the Low Ionospheric Sensor Network, LISN (http://lisn.igp.gob.pe/data/), International Global Navigation Satellite Systems Service (IGS) (www.igs.org), University NAVSTAR Consortium, UNAVCO (https://data.unavco.org/archive/gnss/rinex/obs/), and Système d'Observation du Niveau des Eaux Littorales, SONEL (www.sonel.org) in the file format of Receiver Independent Exchange (RINEX) having a sampling frequency interval of 30 s. These RINEX files were further processed using GPS-TEC software (GPS_Gopi_v3.0) to derive the vertical total electron content (VTEC) of the respective stations used in this study (https://seemala.blogspot.com). GPS-TEC processing software (Seemala, 2010) removes both the satellite and receiver biases by leveling both the pseudo range and carrier phase measurement (Ciraolo et al., 2007) in order to estimate the relative slant total electron content (STEC). The satellite biases are provided from the University of Bern, while the associated TEC variability which minimizes between 02:00 and 06:00 LT were used to estimate receiver biases (Amaechi et al., 2021). The absolute STEC was converted into VTEC using the ionospheric thin-shell model with an ionospheric pierce point (IPP) altitude of roughly 350 km (Mannucci et al., 1993). We also adopted a cut-off frequency of 30° to minimize the effects arising from multipath.
In order to isolate the SSW TEC effects, the hourly average TEC values for the quiet days for the duration of the SSW pre-condition days of 02–22nd January were estimated. These quiet days were defined as days having a maximum Kp ≤ 3, while days with TEC data having maximum Kp > 3 were excluded from estimation of the hourly quiet days average TEC. The underlying TEC perturbations associated with the 2016 SSW event was given by Equation 1:
where
where
To probe the electrodynamics effects associated with the 2016 SSW event, we computed both the equatorial electrojet current (EEJ) and inferred vertical drift (Anderson et al., 2002; Anderson et al., 2004; Yizengaw et al., 2014; Rabiu et al., 2017). The sampled 1-min horizontal magnetic field intensity data used to determine both the EEJ current and vertical
where HHUA is the solar quiet (Sq) current computed for Huancayo and HPLU is the Sq current computed for the Piura magnetometer stations, respectively, while the estimated inferred vertical drift of the ΔH horizontal current was obtained from a mathematical relationship using the vertical drift model (Anderson et al., 2004). Anderson’s quantitative mathematical formulation obtained from the neural regression technique is given by the following expression (Anderson et al., 2002; Anderson et al., 2004; Yizengaw et al., 2014; Kassamba et al., 2020; Idolor et al., 2021; Idolor et al., 2022).
where Vdrift is the evaluated vertical drift (m/s), YR is the SSW study year, DOY is the day of the year, F107obs is the daily F10.7 cm solar flux, F107adj is the 81-day adjusted average F10.7 cm solar flux, Ap and Kp are the daily and three hourly geomagnetic indices, LT is the local time in hours, and ΔH is the difference in the horizontal magnetic field strength (nT). In addition, the EEJ for the topside ionosphere for the selected SSW and GS days investigated was computed using the Swarm data obtained from the absolute scalar magnetometer (ASM), following the procedure outlined by Aiken et al. (2013) and Aiken et al. (2015). These data were obtained from the Swarm satellite mission operated by the European Space Agency (https://earth.esa.int/swarm). The EEJ current of the topside ionosphere are generally measured in milli-Ampere per meter (mA/m) (Aiken et al., 2015).
Furthermore, in order to probe the effects of the geomagnetic disturbance overlapping with the 2016 SSW event, the horizontal component of the magnetic field was also used to compute the monthly quiet mean given in Equation 5.
where n represents the five magnetically quiet days of the month obtained from the World Data Center (WDC) for Geomagnetism.
where θ depicts the geomagnetic latitude,
Fathy et al. (2014) provide more details on the procedure for separating the DP2 and Ddyn from the Diono. We also compared the DP2 current computed with the data from the real-time prompt penetration electric field (PPEF) model developed by the Cooperative Institute for Research in Environmental Sciences (CIRES) of the University of Colorado at Boulder (http://geomag.colorado.edu/real-time-model-of-the-ionospheric-electric-fields.html).
Furthermore, the observed changes in neutral composition of the thermosphere for the days of weak and moderate geomagnetic storms and the major and minor 2016 SSW events were examined using the oxygen and nitrogen ratio (O/N2) maps obtained from the Global Ultraviolet Imager (GUVI) on board the Thermosphere, Ionosphere, Mesosphere Energetics, and Dynamics (TIMED) satellites. These maps were obtained from the website gallery (http://guvitimed.jhuapl.edu/).
3 Results
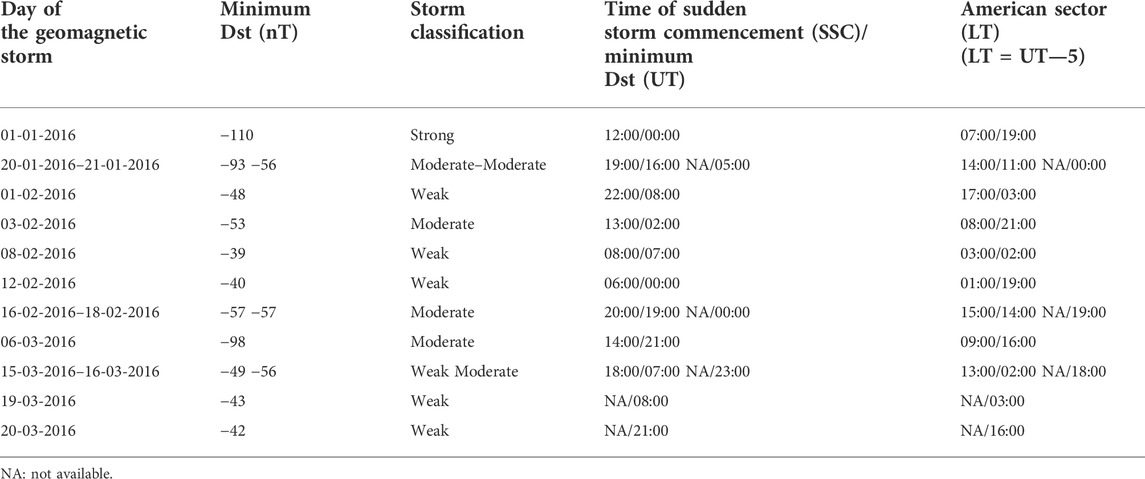
Figure 2A shows the stratospheric zonal mean zonal wind at 60°N, historic zonal mean zonal wind at 60°N, zonal mean air temperature at 90°N, and historic zonal mean air temperature at 90°N and the daily variations in the Dst index for the period of both the pre-SSW and SSW events (2 January to 31 March 2016), with all stratospheric parameters used in this study obtained at the pressure level of 10 hPa. Three minor and one major SSW events denoted by blue lines were identified from Figure 2A. The first cascade of the minor SSW event (M–SSW–1) with dual temperature peak of 224.15 and 233.19 K on 27 January and 1 February 2016 occurred within the period of 22 January–5 February 2016. The second minor warming during the period of 6–17th February showed a stratospheric temperature climax of 269.31 K on 8 February 2016. The third minor warming occurred between 18 February and 3 March 2016, with a peak stratospheric temperature recorded at 227.04 K on 26 February. The major warming associated with the reversal of the zonal mean zonal wind occurred on 5 March at 264.77 K. This event stretched on until the end of March, with the zonal wind showing signs of a reverse signature on same temperature peak day with a corresponding dual maximum zonal mean zonal wind speed of −31.15 and −30.83 m/s attained on 11th and 15th of March, respectively. The historic mean stratospheric temperature showed an increasing trend (green line), while the historic mean stratospheric zonal wind showed an opposing trend of decrease in magnitude (red line). For the duration of 1 January—31 March 2016, a total of 13 geomagnetic storms were observed from the Dst plot. A strong storm with minimum Dst of −110 nT occurred at 00:00 UT on 1 January 2016. Table 2 shows the summary of the sudden storm commencement and minimum Dst of the main phase of the six moderate and six weak storms investigated during the duration of the SSW events. A direct overlap occurred between the minor SSW event and weak geomagnetic storm on 1 and 8 February 2016. Similar direct overlap of the major SSW with a moderate geomagnetic storm on 6th March was also observed. Figure 2B shows 3 days having a daily maximum hourly Kp index value of 6, 13 days recorded a Kp value of 5, while the remaining days’ investigation showed lower geomagnetic activity with the Kp value ranging between 4 and below; all Kp values used in this study are given in the nearest whole number. The highest absolute Kp value for each day was used as a daily representative value. The solar flux observed was generally below the value of ∼120 solar flux units for the entire study duration.
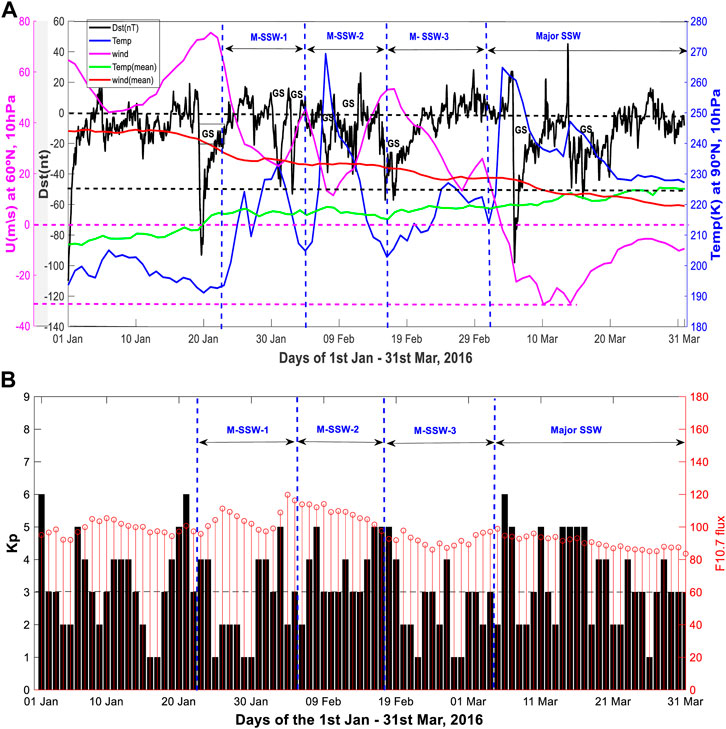
FIGURE 2. (A) Stratospheric zonal mean air temperature at 90°N, stratospheric historic zonal mean air temperature at 90°N, stratospheric zonal mean zonal wind at 60°N, stratospheric historic zonal mean zonal wind at 60°N, all at 10 hPa, and daily variations of Dst index, all from 1 January to 31 March 2016. M-SSW-1 represents the period of first minor SSW, M-SSW-2 for second minor SSW, M-SSW-3 for third minor SSW, and GS represents the periods of geomagnetic storms. (B) Kp index (black bar plots) and F10.7 cm solar flux (red stem plots) from 1 January to March 31.
Figure 3 shows the daily variations in the EIA TEC response from January to March 2016. On 1st January (Figure 3I), coinciding with the occurrence of the strong geomagnetic storm, the EIA crest (region of maximum TEC enhancement within ±20°) was situated around ∼6.0°N for the Northern Hemisphere (NH) and ∼3.5°S in the Southern Hemisphere (SH) with an observed maximum TEC value of ∼38.88 TECu recorded for that day. More TEC enhancements were observed on 20th January, while 21st January showed a corresponding TEC suppression indicating different ionospheric responses to the moderate geomagnetic storms. Table 3 showed the computed average crest location for the days of the SSW precondition for the NH was ∼9.28°N and 9.39°S in the SH. Figure 3II showed the general TEC suppression coinciding with the days of minor SSW peak temperature and weak storm on 1–2nd February. The well-defined two-peak EIA crest signatures were observed for some days of the M–SSW-2 event with the highest maximum TEC enhancements ∼85.00 TECu recorded at 16.93°N on 13 February. 16 February showed a poleward expansion of plasma observed in the NH, while a reverse equatorward flow of plasma was noted on 19 February 2016. Figure 3III shows that on 5 March major SSW peak temperature day coinciding with the zonal mean zonal wind reversal, significant TEC enhancement (∼68.00 TECu) in the NH were observed, while it was practically impossible to ascertain the response of the SH due to the data gap (white background). TEC enhancement was also observed in both hemispheres from 8 to 10 March with equatorward plasma movement displayed in the EIA features on 11 and 15 March. Generally, for most days of the major SSW in March, TEC enhancement were relatively higher in the NH compared to SH. Table 3 shows the average EIA crest locations for each of the SSW phases, while Table 4 shows the EIA crest locations for both quiet SWW (minor and major) days and geomagnetically disturbed storm days.
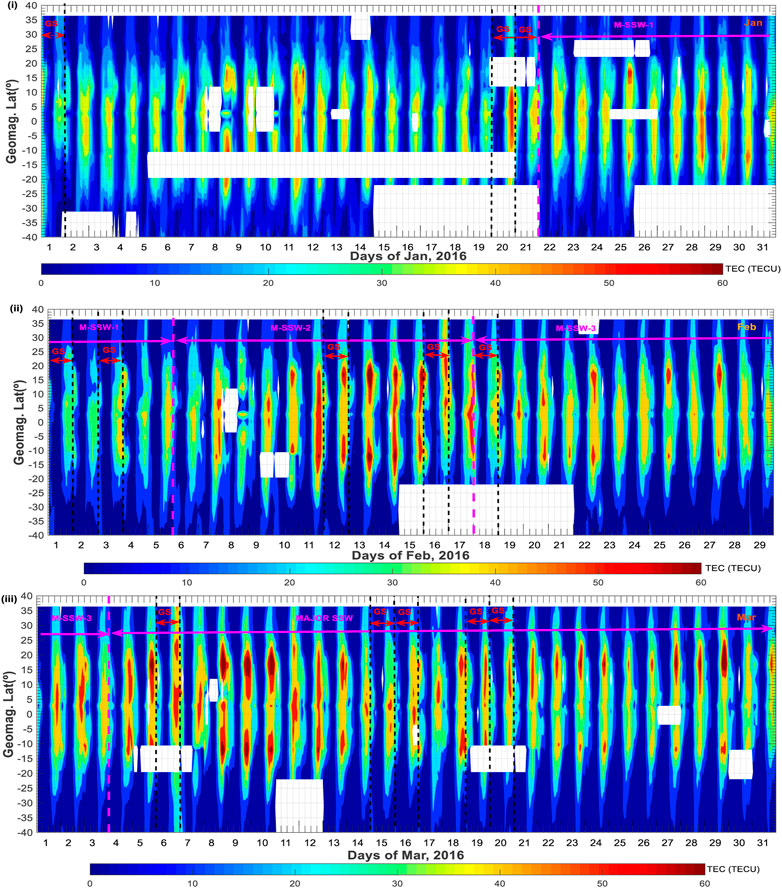
FIGURE 3. Day-to-day variations of EIA (TEC) from 1 January to 31 March 2016 in the American sector: (I–III) represent January, February, and March, respectively (UT = LT + 5). The black vertical dash lines represent the geomagnetic storm (GS) days.

TABLE 3. Average crest locations for the SSW precondition, M-SSW-1, M-SSW-2, M-SSW-3, and major SSW events are shown.
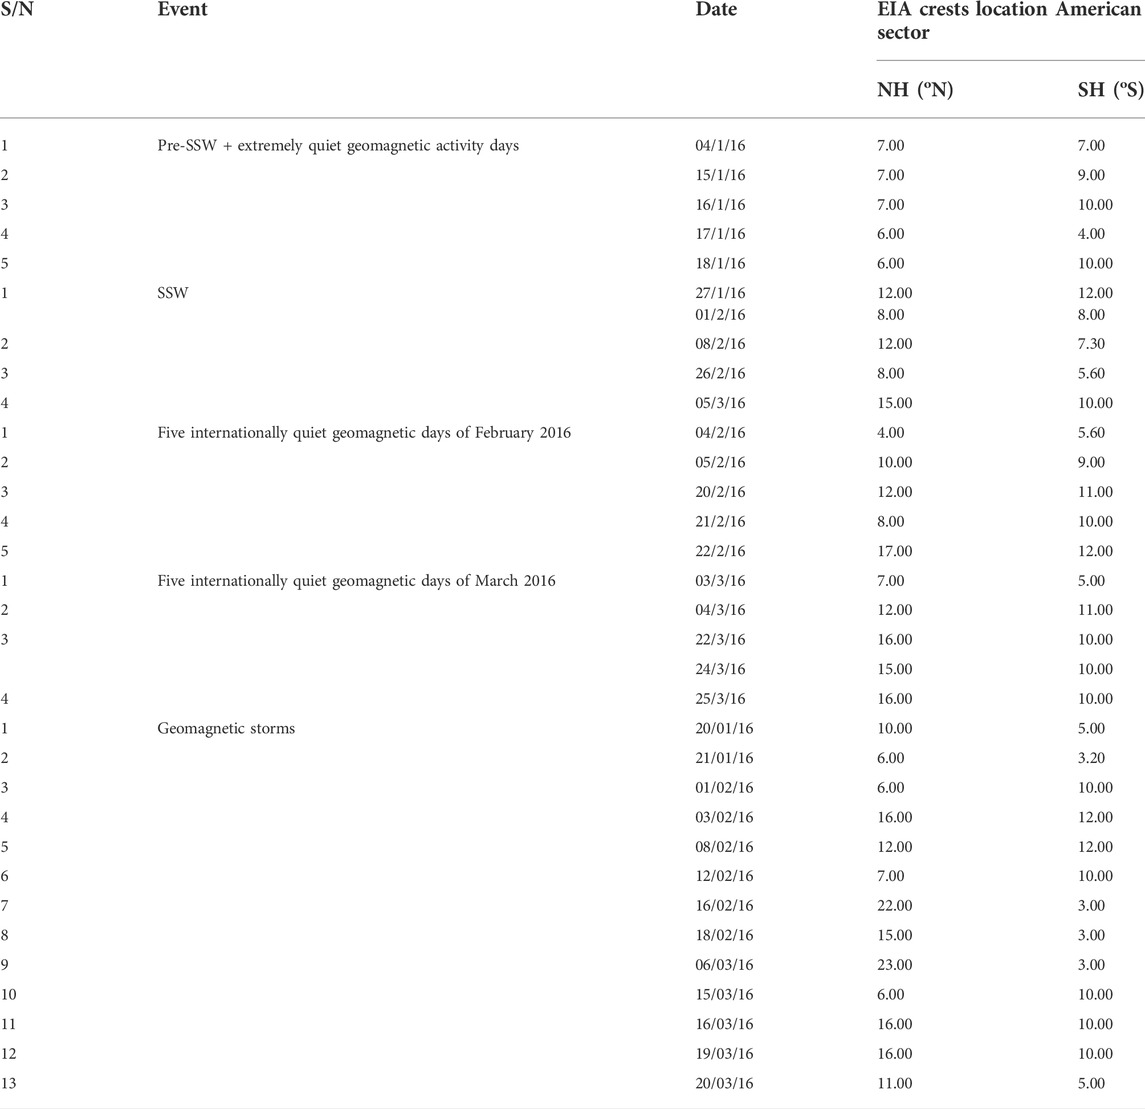
TABLE 4. Variations of EIA crest locations in the American sectors during 2016 pre-SSW and extremely quiet geomagnetic activity days, SSW peak days, five most quiet geomagnetic days of February and March 2016, and geomagnetic storm days.
Figures 4I–III show the daily variations in ΔTEC of the EIA profile obtained from Equation 1 from January to March 2016. Most of the days of January showed no conspicuous TEC enhancement except for 8, 11, 20, 25, 28, and 30. Semidiurnal TEC variations were observed in both the NH and SH at ∼17 °N and ∼15 °S, respectively, during M–SSW-1 event on 28 January. TEC suppression was evident on the 8 February minor SSW peak temperature day at the equatorial and low-latitude regions of the EIA in both hemispheres. Some days in February (Figure 4II) showed the semidiurnal EIA patterns. Semidiurnal features (represented by black dash spheres) are generally depicted by two maxima and one minimum over a 24-h window. Figure 4III shows the ΔTEC daily EIA profile for the days of March 2016. Higher TEC enhancements were observed in the NH in comparison to the SH for most days of the major SSW event in March.
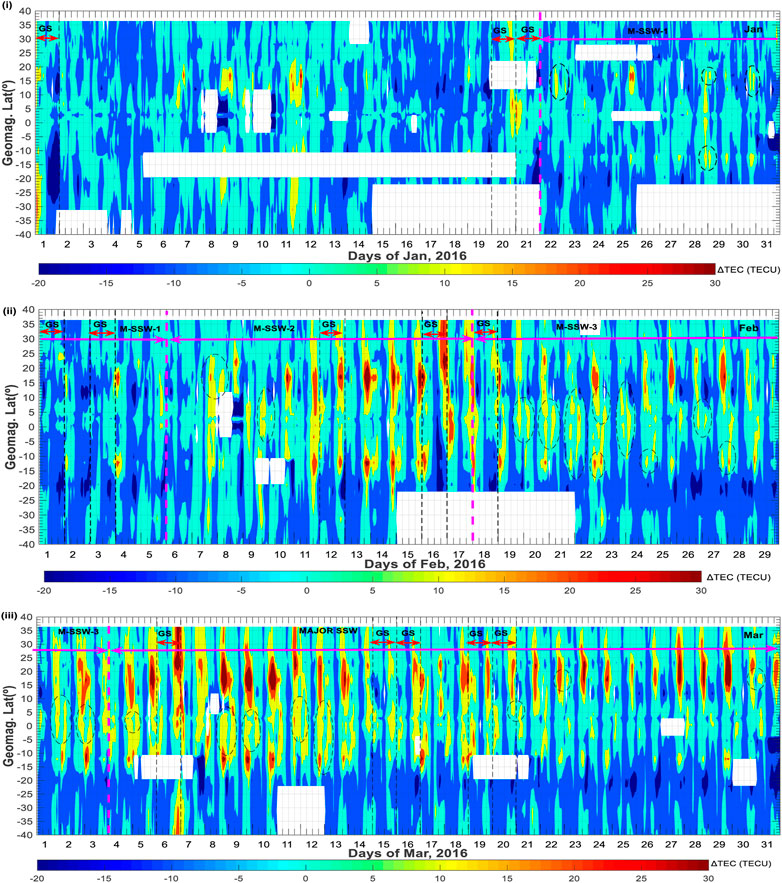
FIGURE 4. Day-to-day variations of EIA (ΔTEC) from 1 January to 31 March 2016 in the American sector: (I–III) represent January, February, and March, respectively (UT = LT + 5). The black vertical dash lines represent the geomagnetic storm (GS) days, while the black dash eclipse depict the semidiurnal TEC variations.
Figures 5I–III show the residual EIA TEC response to the geomagnetic storms after subtracting the mean of the five quiet reference days for each month from the days of the geomagnetic storm occurrence. For the moderate storm of 20 January (Figure 5I), an enhancement in TEC response was observed at the EIA region spanning both daytime and nighttime, while the moderate geomagnetic storm of 21 January showed EIA TEC suppression. Daytime suppression occurred in TEC response Figure 5II shows observation on 3 and 8 February storm (superimposed with SSW peak temperature), while the geomagnetic storms of 16 February showed EIA TEC enhancement. Suppression in EIA TEC response was observed for the storm occurrence (Figure 5III on 15, 19, and 20 March). Suppression of the daytime EIA response was observed on 16 March. Poleward expansion of plasma on 6th March was observed in both NH and SH.
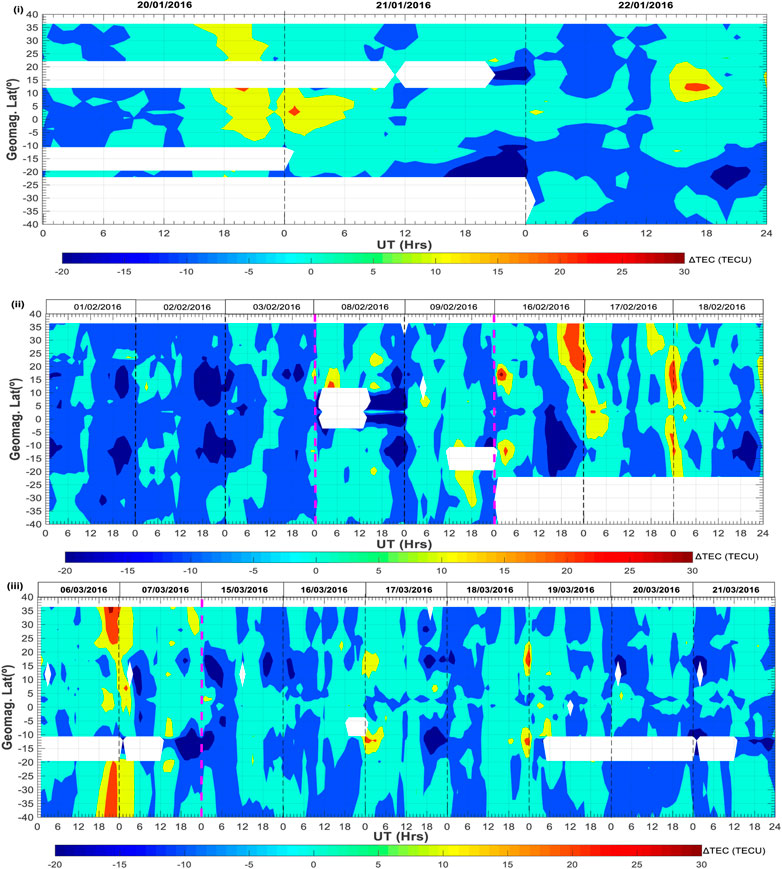
FIGURE 5. Responses of TEC to the geomagnetic storms in the American sector (I) January, (II) February, and (III) March using the mean of the geomagnetically quiet days of each month as the reference for the respective months (UT = LT + 5).
Figure 6 shows the daily EIA ΔTEC variation arising from the overlap of SSW events with geomagnetic storm using Equation 2. We deduce the geomagnetic storm TEC component after isolating TEC contribution, resulting from SSW events. For the February storms that occurred on 1 (Kp 4 and Dst −48 nT) and 8 (Kp 5 and Dst −39 nT), the ΔTEC quiet-day data for 2 (Kp 3) and 10 (Kp 3) were used to isolate the storm components, respectively. A similar procedure using 5 March (Kp 2) SSW quiet-day ΔTEC data were adopted to obtain the TEC contributions arising from 6 March (Kp 6 and Dst −98 nT) moderate storm. TEC enhancement was observed at ± 15° during the post sunset hours (19:00–22:00 LT) for 1 February, while negative TEC response was observed at the EIA regions for most of the day (06:00–18:00 LT) with patches of TEC enhancement ∼10 TECu (yellow pattern) observed at post sunset hours at ∼ 5°N on 8 February. For the moderate storm that occurred on 6 March, higher TEC anomalies were observed at 25–40° of both hemispheres. However, more TEC enhancements (asymmetric EIA plasma density profile) were observed in the SH in comparison to the NH.
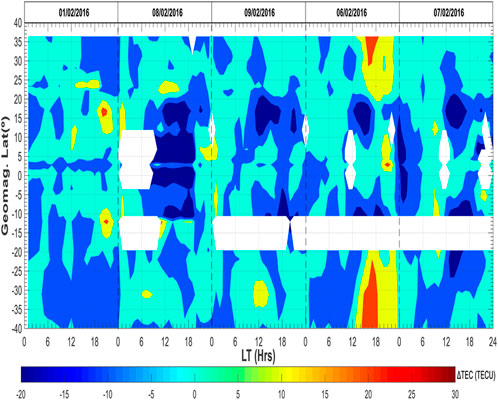
FIGURE 6. Removal of SSW-induced ionospheric effect overlapping with geomagnetic activity-induced ionospheric effect for some weak storms in February (1 and 8 weak geomagnetic storm) and 6 March moderate geomagnetic storm.
Figure 7 shows the real-time modeled response of the prompt penetration electric field (PPEF) (mV/m) for selected days of the SSW and geomagnetic storm disturbance from December 2015 to March 2016. The PPEF amplitude oscillated between the interval range of 0.6 mV/m and −0.4 mV/m for the moderate storm of 21st January. The PPEF amplitude fluctuated between 0.2 mV/m and 0.4 mV/m on 31 December 2015 during the main phase of the 1 January 2016 strong storm. The moderate storm on 16 February PPEF had a maximum amplitude oscillation of 0.38 mV/m and −0.28 mV/m. All the remaining days observed showed oscillations below ±0.3 mV/m.
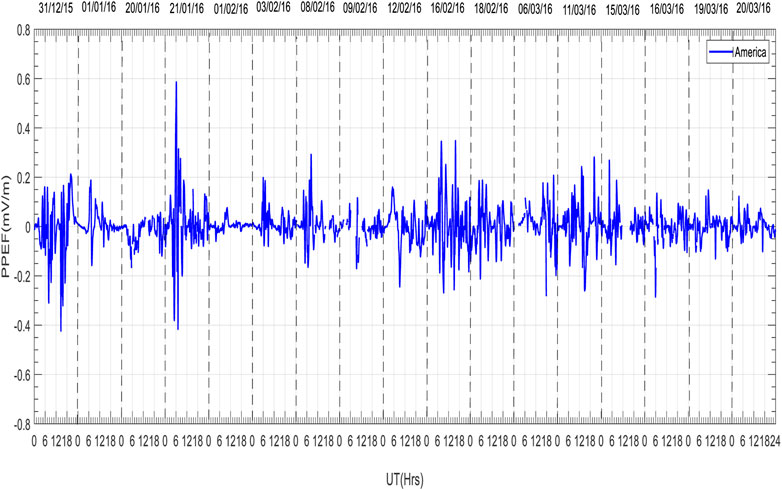
FIGURE 7. Daily prompt penetration electric field (PPEF) current signatures for the storm days of geomagnetic disturbance in December 2015, January, February, and March 2016.
Figure 8 shows the DP2 horizontal magnetic field signatures obtained using Equation 7. Large magnetic oscillations of amplitudes 105.9 nT and −100.2 nT were recorded on 31 December 2015 strong storm. The moderate storms of 20–21 January showed the positive amplitude of 49.73 nT and 70.79 nT with a corresponding negative amplitude of −113.50 nT and −59.91 nT, respectively. The moderate storm magnetic field oscillations on 16th February also showed a large positive amplitude of 163.9 nT and a negative amplitude of roughly ∼−118.2 nT. For March, DP2 oscillations of ∼128.4 nT and −147.2 nT were observed on 6 March, while 11 March showed a magnetic field oscillation amplitudes signature of 115.6 nT and −83.67 nT. The remaining selected quiet and disturbed days showed magnetic field fluctuations within the interval range of ±40 nT.
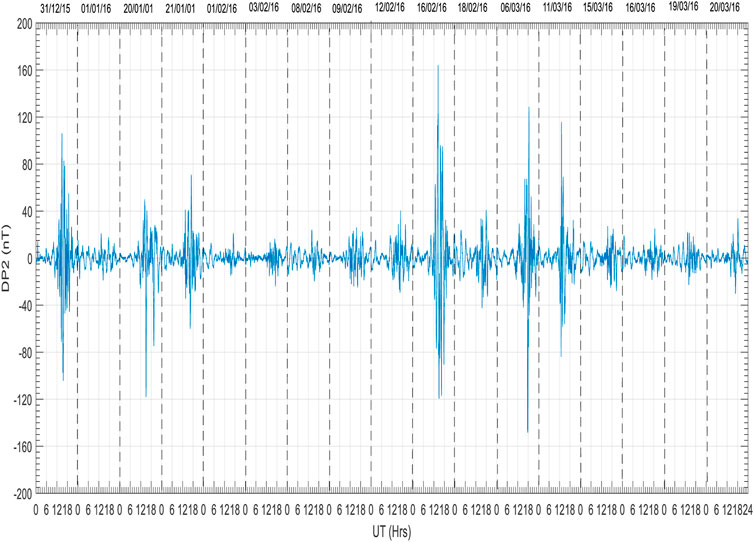
FIGURE 8. Daily variations in the DP2 magnetic current signatures for the storm days of geomagnetic disturbance in December 2015, January, February, and March 2016.
Figure 9 shows the equatorial electrojet current (EEJ) for days of SSW peak temperature and geomagnetic storms, selected in January, February, and March for Equation (3). The highest equatorial electrojet current of ∼93.14 nT occurred on 5 March at noon. 19 March recorded an EEJ current of ∼69.5 nT with the remaining days observed depicting the EEJ current intensity of ∼60 nT or below. A morning counter electrojet (CEJ) signature of ∼−22.04 nT and −73.74 nT was depicted at 9:00 LT on 21 January and 16 February, respectively. Afternoon counter electrojet signatures of magnitudes −41.36 nT (15:00 LT), −39.73 nT (16:00 LT), −0.71 nT (16:00 LT), and −60.88 nT (14:00 LT) were observed on 20 January, 9 February, 5 March, and 6 March, respectively. Figure 10 also shows the topside equatorial electrojet currents obtained from the Swarm satellites constellation within the same longitudinal coordinates as the ground-based equatorial magnetometer in the American sector for same selected quiet and disturbed days of January, February, and March. The highest equatorial electrojet currents of 163.6, 128.0, and 103.8 mA/m were recorded on 5th March, 19th March, and 18th February, respectively. Seven days depicted the formation of the daytime EEJ current profile ranging in magnitude between ∼40 and 80 mA/m with about 6 days showing lower electrojet signatures ranging in values from ∼ −30 to −40 mA/m.
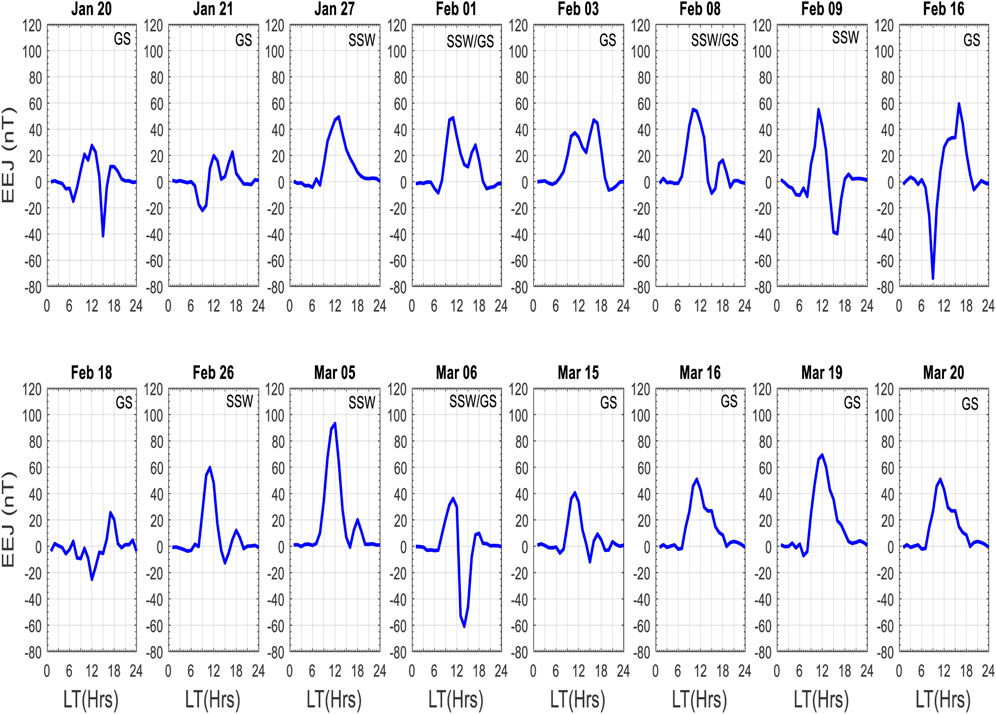
FIGURE 9. Daily variations in equatorial electrojet current (EEJ) for the observed peak SSW temperature and geomagnetic storm days in January, February, and March in the American sector.
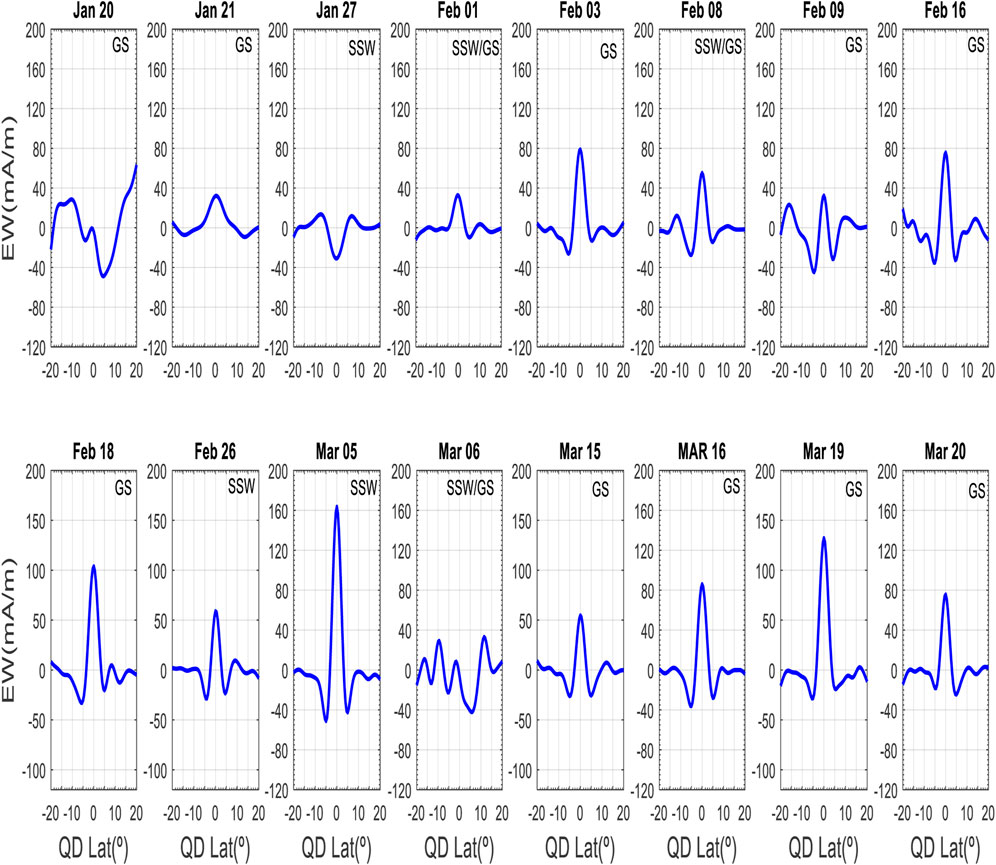
FIGURE 10. Daily variations in the eastward (EW) current density profile for the observed peak SSW temperature and geomagnetic storm days in January, February, and March in the American sector.
Figure 11 shows the estimated vertical drift obtained using Equation 4 of the Anderson’s mathematical relationship. Positive vertical drift was observed for all the selected days investigated. The highest drift velocities of ∼39.26 m/s and 35.09 m/s were observed on 5 and 19 March 2016 at noon, respectively. The lowest vertical drift velocities of magnitudes 10.14 m/s (09:00 LT) and 10.31 m/s (14:00 LT) were recorded on 16 February and 6 March 2016, respectively. Figure 12 shows the observed changes in neutral composition of the thermosphere for the selected days of geomagnetic storms, and SSW events were obtained from the Global Ultraviolet Imager (GUVI). The days of SSW and geomagnetic storms showed a higher O/N2 ratio in the Northern Hemisphere than that of the concentration of O/N2 in the Southern Hemisphere. The days 1 and 3 February showed complete data gaps (white background) in both hemispheres, while all the remaining days observed had consistent data gap patches in the Southern Hemisphere with lower O/N2 ratios depicted. On 8–9th February, the O/N2 was relatively lower in both hemispheres than all other days investigated.
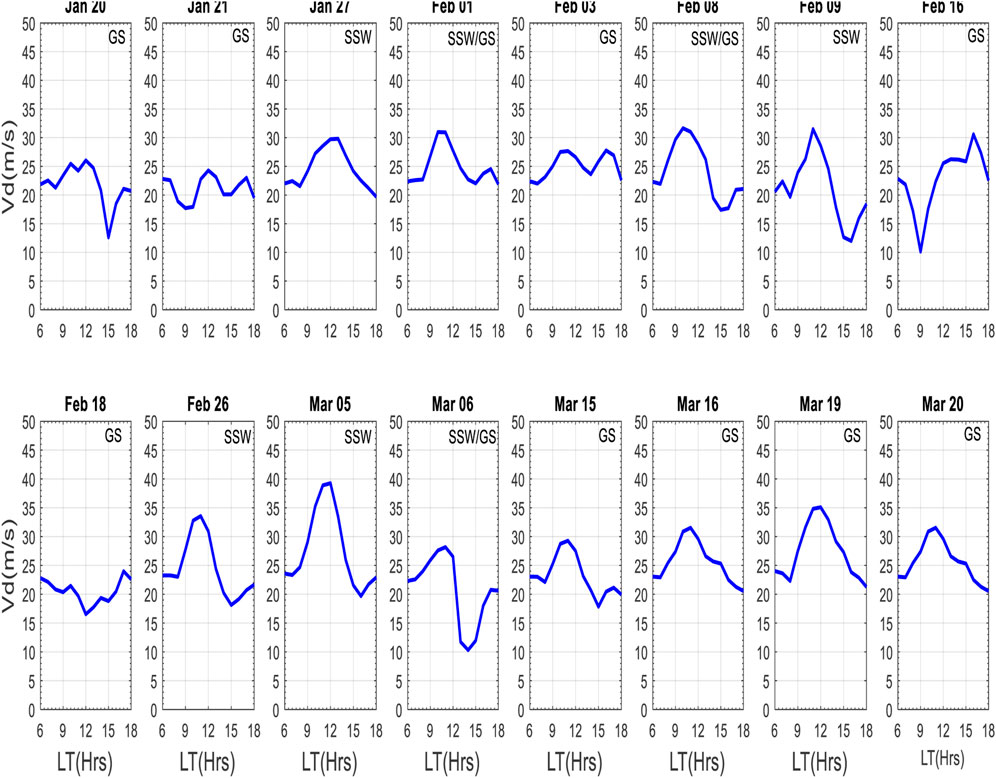
FIGURE 11. Daily estimates of the equatorial vertical drift for the observed peak SSW temperature and geomagnetic storm days in January, February, and March in the American sector.
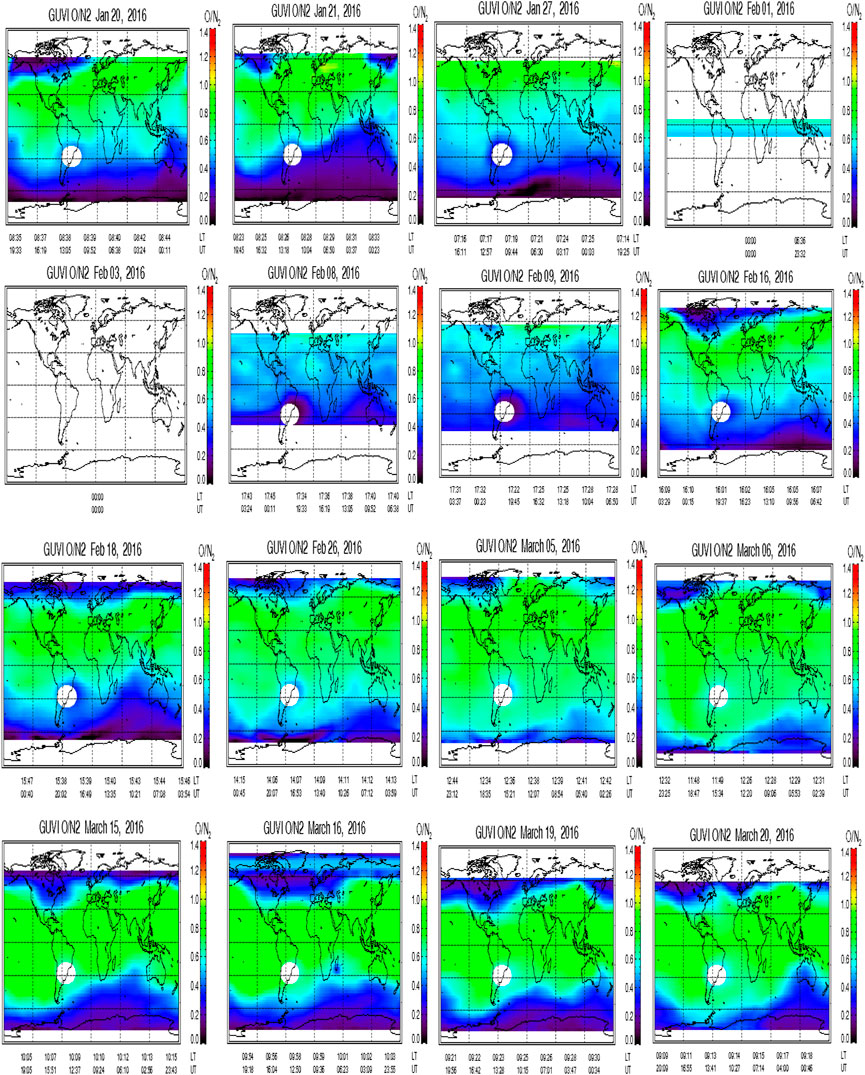
FIGURE 12. O/N2 ratio of the thermosphere for the selected peak SSW days and geomagnetic storms days in January, February, and March 2016.
4 Discussion
The present study investigates the ionospheric variabilities associated with the simultaneous occurrence of both geomagnetic storms and the sudden stratospheric warming events during the winter months of January–March 2016. The EIA crest locations (Table 4) in the NH were relatively higher on the SSW peak temperature days in comparison to the preconditioned quiet days of the SSW, while the EIA crest locations for SSW days were lower in the SH except on 27 February, where they were much higher than preconditioned phase. Both the TEC (Figure 3) and ΔTEC (Figure 4) EIA responses on 27 January, 1, and 8 February were negative in comparison to the precondition SSW quiet days with positive ionospheric response visible on 26 February and 5 March. As shown in Figure 12, the column of the O/N2 ratio was relatively lower for the first three SSW events in comparison to the last two. These results are consistent with earlier reports of the observed occurrence of positive and negative ionospheric responses during 2019 Antarctic SSW events with observed magnitude of ionospheric disturbances comparable to those of the geomagnetic storms (Goncharenko et al., 2021b). The negative response of our result was also consistent with the recent report of the first experimental evidence of ∼10% decrease in O/N2 ratio using data obtained from the Global-scale Observation of the Limb and Disk (GOLD) instrumentation during the Arctic winter 2019 SSW events (Oberheide et al., 2020). The negative response may be attributed to wave forcing and changes in residual circulation, while positive ionospheric response depicted by the overall increase in O/N2 ratio was consistent with the enhancement in TEC observed during the 2019 Antarctic SSW events in the western sector of America (Goncharenko et al., 2021b).
The 2016 Arctic SSW event in the American sector was also characterized by the semidiurnal features in both ionospheric ΔTEC (Figure 4), equatorial electrojets (Figure 9), and vertical drifts (Figure 10) on 8, 9, 26 February, and 5th March. Previous studies have demonstrated an existing relationship between sudden stratospheric warming and afternoon counter electrojets due to the enhancement of semidiurnal tidal amplitudes (Stening et al., 1996; Rastogi 1999; Sridharan et al., 2009; Vineeth et al., 2009). The generation of these semidiurnal tides is mainly due to the absorption of ultraviolet radiation by ozone in the stratosphere and mesosphere and the absorption of infrared radiation by water vapor in the troposphere (Sridharan et al., 2009; Fuller Rowell et al., 2011). Similar semidiurnal SSW features were reported in TEC and vertical drifts (Chau et al., 2009; Goncharenko et al., 2010a; Goncharenko et al., 2010b; Chau et al., 2012; Goncharenko et al., 2013). These semidiurnal features have been linked to the non-linear interaction of planetary waves with tides at lower altitudes, resulting in large changes in both migrating and non-migrating tides. These tides have maximum amplitudes at low latitudes and can migrate to the region of the thermosphere where they modulate the electric fields using the ionospheric wind dynamo (Goncharenko et al., 2010a; Goncharenko et al., 2010b; Goncharenko et al., 2013). The ΔTEC (Figure 4) daily variation also showed higher TEC enhancements in the NH in comparison to SH. Similar differences were observed in the O/N2 ratio between the winter and summer hemispheres for the SSW days. This difference in O/N2 ratio has been ascribed to reduce large-scale circulation of the thermosphere in the summer hemisphere and enhancement in the winter hemisphere (Oberheide et al., 2020). Denitrification has also been proposed as a possible mechanism responsible for the observed hemispheric asymmetry. Denitrification due to the less intense lower stratospheric temperature in the northern hemisphere results in the less destruction of ozone in the winter hemisphere during SSW events (Kodera, 2006) with contrary response observed in the SH. Yue et al. (2010) ascribed the hemispheric asymmetry during SSW events to the upward tidal propagation interacting with the planetary waves and modulating dynamo region in the more disturbed northern hemisphere.
In addition, an equatorward transport of plasma (reverse fountain effect) in the EIA profile coinciding with the period of maximum reversal of the stratospheric zonal wind was visible on 11, 14, and 15 March. The 15 March SSW wind reversal also coincided with the simultaneous occurrence of a weak geomagnetic storm (Table 2). The time of onset of the storm main phase was within the nighttime hours. The enhancement of the EIA TEC profile during the daytime can be attributed to the intensification of the forward plasma fountain (super-fountain effect) via the prompt penetration electric field (PPEF) mechanism strengthening the dayside eastward electric field (Akala et al., 2020; Arowolo et al., 2021). At nighttime, the PPEF has been reported to trigger the suppression of the EIA TEC profile (reverse fountain) by the formation of a westward electric field (Akala et al., 2020; Arowolo et al., 2021). Our study results showed a low DP2 magnetic amplitude oscillation (Figure 8) on 15 March. In addition, a weak afternoon counter electrojet (Figure 9) and vertical drift (Figure 11) depicting the semidiurnal SSW signature (Anderson and Araujo-Pradere, 2010) were observed on 15 March. Similar features of weak enhancement in the EEJ current density (Figure 10) profile were observed on 15 March from the Swarm satellite data. This equatorward shift of the EIA crest profile from higher to lower latitudes regions may be attributed to significant increase in both gravity and planetary waves arising from the deceleration of stratospheric zonal mean zonal wind. The interaction of these tides with gravity waves arising from enhanced planetary wave activities may lead to changes in the lower atmospheric circulation and the modification of the ionospheric wind system (De Jesus et al., 2017a; Idolor et al., 2021).
Pancheva and Mukhtarov (2011) suggested that the equatorward transport of plasma can be attributed to the perturbed ionospheric wind system arising from the forcing of the equatorward wind system originating from the lower thermosphere owing to heating. In addition, the main mechanism associated with the ionospheric variations on 15 March can be attributed to changes in the observed thermospheric composition arising from changes in the composition of the neutral gas species in the atmosphere. These changes in the neutral gas composition have been identified as one of the major drivers of ionospheric variabilities during SSW events (Fagundes et al., 2015; Idolor et al., 2021). It is noteworthy to mention that the observed semidiurnal pattern in the EEJ parameter on 15 March strongly suggests that the overlap of the weak geomagnetic storm with the minor SSW event had very little or no effects on the modulation of the ionosphere. Goncharenko et al. (2010b) reported a similar persistent semidiurnal pattern ascribed to the lower atmospheric forcing during the days of February 27–29 2008 SSW. According to Goncharenko et al. (2010b), the lower atmospheric forcing arising from the 2008 SSW event also coincided with the increase in geomagnetic activity.
Highest EEJ currents (Figures 9, 10) and vertical E X B drifts (Figure 11) were observed on 5 and 19 March. The 5 March EEJ (Anderson and Araujo-Pradere, 2010) semidiurnal signature coincided with the occurrence of the 2016 Major SSW event, while the 19 March diurnal EEJ signature coincided with the weak storm. The PPEF (Figure 7) and DP2 (Figure 8) magnetic oscillation signatures on 19 March was relatively low, indicating little or no effects arising from the weak storm. Thus, we can attribute the enhancement in the EEJ current strength on 5 and 19 March to tidal enhancement originating from the lower atmospheric forcing. Our EEJ results for the 2016 SSW events are consistent with tidal analysis report of ionospheric parameters for the 2013 SSW events at mid-latitudes (Chen et al., 2016). Chen et al. (2016) reported the enhancement of the 24-, 12-, and 8-h tidal components, especially the semidiurnal 12-h tides. This enhancement in diurnal and semidiurnal tides has been linked to the non-linear interaction of the migrating tides with the quasi-stationary planetary waves. These interactions strongly influence the E-region dynamo and electric fields via the generation of non-migrating tides (Liu et al., 2010; Chen et al., 2016).
Generally, for this study, a total of 13 storms were identified and investigated with the four cascades of SSW events. Based on the time of occurrence of the storm main phase (Table 2), the effect of the prompt penetration electric field on the ionosphere revealed six storms (21 January, 1 February, 3 February, 8 February, 15 March, and 19 March), depicting the negative ionospheric response (TEC suppression) coinciding with the westward PPEF nighttime occurrence of their main phase (Figure 5), and three storms (20 January, 16 February, and 6 March) revealed a positive response (TEC enhancement) coinciding with the eastward daytime PPEF of the storm main phase. The remaining storms (1 January, 18 February, 16 March, and 20 March) investigated (Figure 6) showed a negative EIA TEC signature. These negative EIA TEC features are contrary to the recent report of the positive ionospheric response in the American sector for the 2013 SSW event (Idolor et al., 2022). Idolor et al. (2022) reported that the impact of the PPEF on the ionosphere just around sunset enhances the eastward electric field via the vertical
Our DP2 current oscillation signatures (Figure 8) indicating the possible impacts of the prompt penetration electric field on the ionosphere were higher on 31st December, 20–21st January, 16th February, and 6th and 11 March 2016. The present results from this study showed the poleward expansion of plasma stretching toward the low-latitude regions in the NH for the geomagnetic storms on 20 January and 16 February 2016. The results for the SH were not shown due to the data gap for both the storms. However, positive poleward plasma expansion in the low latitudes was observed for both hemispheres on 6 March 2016. Removing the contributions arising from the SSW ionospheric disturbance superimposed with the geomagnetic storms (Figure 6) revealed a negative ionospheric response for 8 February and positive response on 6 March solely from the storm components. The positive response associated with 16 February storm can be attributed to the reinforcement of the dayside forward fountain effect by the superimposed eastward PPEF generated from the southward turning of the interplanetary magnetic field (IMF) with the dayside eastward ionospheric electric field (Tsurutani et al., 2004). This PPEF signature is clearly depicted in the afternoon enhancement of the EEJ (Figure 9) and vertical
Also, 11th March recorded a Kp index of +5, Ap index of 19, and
The positive ionospheric response observed on 20 January and 6 March may be attributed to traveling atmospheric disturbances (TADs) associated with the storm time disturbances, apart from the positive response observed in both TEC and ΔTEC. Both days from our result showed the formation of westward electric fields indicated by the afternoon counter electrojets (CEJs) (Figure 9) signature. Zhu et al., 2022 attributed the upward movement of plasma along magnetic field lines to the formation of storm time neutral wind disturbance propagating equatorward. Blanc and Richmond (1980) reported that during such storm days the neutral wind disturbance has the tendency to generate a westward electric field. Traveling atmospheric disturbances are wave-like impulse disturbances generated from the superposition of the atmospheric gravity waves propagating from the polar to the equatorial regions at high velocity. These disturbances are associated with increase in temperature, density, and equatorward-directed winds (Prolss 2004). During TADs, the general ionosphere is lifted upward to higher altitudes, resulting in an ionization density peak due to fast decrease in the molecular oxygen. Molecular oxygen species are responsible for the ionospheric density loss rate with elevation in comparison to the species of the atomic oxygen that govern the production rate. Hence, the overall net result of the elevated ionospheric layers due to TADs is an effective increase in ionization density of the F layer of the ionosphere (Prolss 2004; Idolor et al., 2021; Mosna et al., 2021). Our results are consistent with the observational and modeling simulations of ionospheric variations associated with the superposition of SSW with geomagnetic disturbances leading to an overall increase in TEC, height profile (hmF2), and electron density (NmF2) during the Arctic 2019 SSW events (Mosna et al., 2021). These authors demonstrated that the storm time effects of the neutral atmosphere on the ionosphere, leading to the enhancement of the electron density on 26–27 January 2009 to thermospheric winds and traveling atmospheric disturbances (TADs). For the negative ionospheric response, disturbances in the neutral gas composition can lead to an overall decrease in both the oxygen density and oxygen ion production and a corresponding increase in the molecular nitrogen species in the atmosphere. The combined effects of these competing neutral gas species result in a decrease in the ionization density via increase in the lost rates of the ion species (Prolss 2004; Idolor et al., 2021; Mosna et al., 2021).
Conclusion
The present study investigates the equatorial/low-latitude ionospheric response over the American sector to (a) the cascades of minor and majors SSW events (January–March 2016) and (b) weak and moderate geomagnetic storms that occurred during same duration of the SSW events. This study’s conclusions are:
1. Apart from the roles played by upper atmospheric forcing arising from geomagnetic storms and other solar events in space weather, lower atmospheric forcing also plays a key role in ionospheric variability associated with the dynamics of the ionospheric space weather (Mosna et al., 2021). With reference to the SSW quiet preconditioned days, our result showed a negative response on 27 January, 1, and 8 February, while the SSW peak temperature days on 27 February and 5 March showed positive ionospheric response. These positive/negative responses were ascribed to increase/decrease in the O/N2 ratios during the 2016 SSW events (Oberheide et al., 2020; Goncharenko et al., 2021a).
2. Despite the increase in geomagnetic activities, the characteristic semidiurnal features were still observed in ΔTEC, equatorial electrojet currents (EEJs), and E x B vertical drifts for some days of the 2016 SSW events. These semidiurnal features have been ascribed to the non-linear interaction of quasi-stationary planetary waves with tides and gravity waves leading to the tidal amplification responsible for the modulation of the electric fields via an ionospheric wind dynamo (Goncharenko et al., 2010a; Goncharenko et al., 2010b).
3. Asymmetry distribution of plasma was observed in the American sector with generally higher TEC enhancement in the winter hemisphere and a corresponding lower TEC magnitude in the summer hemisphere. These hemispheric differences in TEC response have been attributed to the interaction of tides and gravity waves with the upward propagation of quasi stationary planetary waves originating from the lower troposphere.
4. During the days of reversal of the maximum amplitude of the stratospheric zonal mean zonal wind, a general equatorward movement of plasma (reverse fountain effect) was visible on 11, 14, and 15 March. These plasma intensifications at the equatorial region can be linked to the modification of the ionospheric wind system driven by equatorward wind generated via the thermospheric heating of the Earth’s atmosphere (Pancheva and Mukhtarov, 2011).
5. The 2016 SSW events coincided with the multiple occurrences of both weak and moderate geomagnetic storms. The weak and moderate geomagnetic storms of 8 February and 6 March 2016 overlapped with the minor and major SSW peak temperature days. After deducting the TEC contribution associated with each of the respective SSW event, the weak storm revealed a negative ionospheric disturbance, while the moderate storm showed an opposing daytime positive ionospheric response. The negative response was ascribed to changes in the neutral gas composition leading to the decrease in the ion species in the ionosphere, while the positive response was attributed to wave impulse arising from traveling atmospheric disturbances in the upper atmosphere (Prolss 2004).
6. The results from this study provides more insight into the combined effect of the overlapped geomagnetic and SSW forcing during the period of descending phase of the solar activity, with the objective of isolating the role of each of the individual forcing on the ionosphere. In addition, the results from this study may support the development of future models with the possibilities of predicting the combined effects of SSW-induced and geomagnetic storm-induced ionospheric disturbance for the purpose of mitigating their adverse effects on the technological system for space weather applications.
Data availability statement
The datasets presented in this study can be found in online repositories. The names of the repository/repositories and accession number(s) can be found later. The stratospheric temperature and wind parameters used in this study were obtained from the National Oceanic and Atmospheric Administration (NOAA) Office of the Oceanic and Atmospheric Research, Earth System Research Laboratory, Boulder website ((https://downloads.psl.noaa.gov/Datasets/ncep.reanalysis.dailyavgs/pressure/)). The F10.7 cm data were obtained from the (National Aeronautics and Space Administration (NASA) Space Physics Data Facility, (http://omniweb.gsfc.nasa.gov/form/dx1.html) and the 81-day adjusted F10.7 cm solar flux was downloaded from the Celestrak public access website (https://celestrak.com/SpaceData/). The Dst, Kp, ƩKp, and Ap index were obtained from the World Data Center for Geomagnetism Kyoto (http://wdc.kugi.kyoto-u.ac.jp/kp/index.html). We obtained GPS data from the listed organizations; International Global Navigation Satellite Systems Service (IGS) (www.igs.org); UNAVCO non-profit university consortium network (https://data.unavco.org/archive/gnss/rinex/obs/); and SONEL data assembly file access (www.sonel.org). The horizontal magnetic field data were obtained from the Low Ionospheric Sensor Network (LISN) magnetometers (http://lisn.igp.gob.pe/data/) operated by the Instituto Geofisico del Peru (IGP).
Author contributions
OI drafted the original write-up, methodology, conceptualized, validated and prepared the manuscript; AOA designed the study objectives, OB designed the research method, while EO reviewed the draft manuscript write-up and validated the study methodology, ATA curated and processed the horizontal magnetic field data.
Conflict of interest
The authors declare that the research was conducted in the absence of any commercial or financial relationships that could be construed as a potential conflict of interest.
Publisher’s note
All claims expressed in this article are solely those of the authors and do not necessarily represent those of their affiliated organizations, or those of the publisher, the editors, and the reviewers. Any product that may be evaluated in this article, or claim that may be made by its manufacturer, is not guaranteed or endorsed by the publisher.
References
Aiken, P., Maus, S., Chulliat, A., Vigneron, P., Sirol, O., and Hulot, G. (2015). Swarm equatorial electric field chain: First results. Geophys. Res. Lett. 42, 673–680. doi:10.1002/2014GL062658
Aiken, P., Maus, S., Vigneron, P., Sirol, O., and Hulot, G. (2013). Swarm SCARF equatorial electric field inversion chain. Earth Planets Space 65, 1309–1317. doi:10.5047/eps.2013.09.008
Akala, A. O., and Adewusi, E. O. (2020). Quiet-time and storm-time variations of the African equatorial and low latitude ionosphere during 2009–2015. Adv. Space Res. 66 (6), 1441–1459. doi:10.1016/j.asr.2020.05.038
Akala, A. O., Oyeyemi, E. O., Amaechi, P. O., Radicella, S. M., Nava, B., and Amory‐Mazaudier, (2020). Longitudinal responses of the equatorial/low‐latitude ionosphere over the oceanic regions to geomagnetic storms of May and September 2017. J. Geophys. Res. Space Phys. 125, e2020JA027963. doi:10.1029/2020JA027963
Amaechi, O. P., Ibufubara, H., and Adewonyin, D. A. (2021). Assessment of the predictive capabilities of NIGTEC model over Nigeria during geomagnetic storm. Geodesy Geodyn. 12, 413–423. doi:10.1016/j.geog.2021.09.003
Anderson, D., Anghel, A., Chau, J., and Veliz, O. (2004). Daytime vertical E × B drift velocities inferred from ground-based magnetometer observations at low latitudes. Space weather. 2, S11001. doi:10.1029/2004SW000095
Anderson, D., Anghel, A., Yumoto, K., Ishitsuka, M., and Kudeki, E. (2002). Estimating daytime vertical E x B drift velocities in the equatorial F-region using ground-based magnetometer observations. Geophys. Res. Lett. 29, 1596. doi:10.1029/2001GL014562
Anderson, D., and Araujo‐Pradere, E. A. (2010). Sudden stratospheric warming event signatures in daytime ExB drift velocities in the Peruvian and Philippine longitude sectors for January 2003 and 2004. J. Geophys. Res. 115, A00G05. doi:10.1029/2010JA015337
Andrews, D., Holton, J. R., and Leovy, C. B. (1987). Middle atmosphere dynamics. New York: Elsevier, 259–294.
Arowolo, O. A., Akala, A. O., and Oyeyemi, E. O. (2021). Interplanetary origins of some intense geomagnetic storms during solar cycle 24 and the responses of african equatorial/low‐latitude ionosphere to them. J. Geophys. Res. Space Phys. 126. doi:10.1029/2020JA027929
Blanc, M., and Richmond, A. D. (1980). The ionospheric disturbance dynamo. J. Geophys. Res. 85 (A4), 1669–1686. doi:10.1029/JA085iA04p01669
Chau, J. L., Aponte, N. A., Cabassa, E., Sulzer, M. P., Goncharenko, L. P., and Gonzalez, S. A. (2010). Quiet time ionospheric variability over Arecibo during sudden stratospheric warming events. J. Geophys. Res. 115, A00G06. doi:10.1029/2010JA015378
Chau, J. L., Fejer, B. G., and Goncharenko, L. P. (2009). Quiet variability of equatorialE×Bdrifts during a sudden stratospheric warming event. Geophys. Res. Lett. 36, L05101. doi:10.1029/2008GL036785
Chau, J. L., Goncharenko, L. P., Fejer, B. G., and Liu, H.-L. (2012). Equatorial and low latitude ionospheric effects during sudden stratospheric warming events. Space Sci. Rev. 168, 385–417. doi:10.1007/s11214-011-9797-5
Chen, G., Wu, C., Zhang, S., Ning, B., Huang, X., Zhong, D., et al. (2016). Midlatitude ionospheric responses to the 2013 SSW under high solar activity. J. Geophys. Res. Space Phys. 121, 790–803. doi:10.1002/2015JA021980
Ciraolo, L., Azpilicueta, F., Brunini, L., Meza, A., and Radicella, S. M. (2007). Calibration errors on experimental slant total electron content (TEC) determined with GPS. J. Geod. 81, 111–120. doi:10.1007/s00190-006-0093-1
de Jesus, R., Jonah, O. F., Abreu, A. J., Fagundes, P. R., Venkatesh, K., Denardini, C. M., et al. (2017a). An investigation of the ionospheric disturbances due to the 2014 sudden stratospheric warming events over Brazilian sector. J. Geophys. Res. Space Phys. 122 (11), 698715–698811. doi:10.1002/2017JA024560
de Jesus., R., Batista, I. S., de Abreu, A. J., Fagundes, P. R., Venkatesh, K., and Denardini, C. M. (2017b). Observed effects in the equatorial and low-latitude ionosphere in the South American and African sectors during the 2012 minor sudden stratospheric warming. J. Atmos. Solar-Terrestrial Phys. 157-158, 78–89. doi:10.1016/j.jastp.2017.04.003
De Paula, E. R., Jonah, O. F., Moraes, A. O., Kherani, E. A., Fejer, B. G., Abdu, M. A., et al. (2015). Low-latitude scintillation weakening during sudden stratospheric warming events. J. Geophys. Res. Space Phys. 120, 2212–2221. doi:10.1002/2014ja020731
Fagundes, P. R., Goncharenko, L. P., de Abreu, A. J., Venkatesh, K., Pezzopane, M., de Jesus, R., et al. (2015). Ionospheric response to the 2009 sudden stratospheric warming over the equatorial, low, and middle latitudes in the South American sector. J. Geophys. Res. Space Phys. 120, 7889–7902. doi:10.1002/2014JA020649
Fathy, I., Amory-Mazaudier, C., Fathy, A., Mahrous, A. M., Yumoto, K., and Ghamry, E. (2014). Ionospheric disturbance dynamo associated to a coronal hole: Case study of 5-10 April 2010. J. Geophys. Res. Space Phys. 119, 4120–4133. doi:10.1002/2013ja019510
Fejer, B. G., Olson, M. E., Chau, J. L., Stolle, C., Luhr, H., Goncharenko, L. P., et al. (2010). Lunar‐dependent equatorial ionospheric electrodynamic effects during sudden stratospheric warmings. J. Geophys. Res. 115, A00G03. doi:10.1029/2010JA015273
Forbes, J. M., Palo, S. E., and Zhang, X. (2000). Variability of the ionosphere. J. Atmos. Sol. Terr. Phys. 62, 685–693. doi:10.1016/S1364-6826(00)00029-8
Fuller‐Rowell, T., Wang, H., Akmaev, R., Wu, F., Fang, T.‐W., Iredell, M., et al. (2011). Forecasting the dynamic and electrodynamic response to the January 2009 sudden stratospheric warming. Geophys. Res. Lett. 38, L13102. doi:10.1029/2011GL047732
Goncharenko, L., Chau, J. L., Condor, P., Coster, A., and Benkevitch, L. (2013). Ionospheric effects of sudden stratospheric warming during moderate-to-high solar activity: Case study of January 2013. Geophys. Res. Lett. 40, 4982–4986. doi:10.1002/grl.50980
Goncharenko, L. P., Harvey, V. L., Greer, K. R., Zhang, S., Coster, A., and Paxton, L. J. (2021b). Impact of september 2019 antarctic sudden stratospheric warming on mid-latitude ionosphere and thermosphere over north America and europe. Geophys. Res. Lett. 48, e2021GL094517. doi:10.1029/2021GL094517
Goncharenko, L. P., Harvey, V. L., Liu, H., and Pedatella, N. M. (2021a). “Sudden stratospheric warming impacts on the ionosphere-thermosphere system,” in A review of recent progress, space physics and aeronomy collection volume 3: Ionosphere dynamics and applications, geophysical monograph. Editors C. Huang, and G. Lu (Washington DC, USA: AGU), 369–400.
Goncharenko, L. P., Chau, J. L., Liu, H.-L., and Coster, A. J. (2010a). Unexpected connections between the stratosphere and ionosphere. Geophys. Res. Lett. 37, L10101. doi:10.1029/2010GL043125
Goncharenko, L. P., Coster, A. J., Chau, J. L., and Valladares, C. E. (2010b). Impact of sudden stratospheric warmings on equatorial ionization anomaly. J. Geophys. Res. 115, A00G07. doi:10.1029/2010JA015400
Goncharenko, L. P., Coster, A. J., Zhang, S.-R., Erickson, P. J., Benkevitch, L., Aponte, N., et al. (2018). Deep ionospheric hole created by sudden stratospheric warming in the nighttime ionosphere. JGR. Space Phys. 123, 7621–7633. doi:10.1029/2018JA025541
Goncharenko, L. P., Harvey, V. L., Greer, K. R., Zhang, S.-R., and Coster, A. J. (2020). Longitudinally dependent low-latitude ionospheric disturbances linked to the antarctic sudden stratospheric warming of september 2019. JGR. Space Phys. 125 (8), e2020JA028199. doi:10.1029/2020ja028199
Goncharenko, L., and Zhang, S.-R. (2008). Ionospheric signatures of sudden stratospheric warming: Ion temperature at middle latitude. Geophys. Res. Lett. 35, L21103. doi:10.1029/2008GL035684
Gonzalez, W. D., Joselyn, J. A., Kamide, Y., Kroehl, H. W., Ros- toker, G., Tsurutani, B. T., et al. (1994). What is a geomagnetic storm? J. Geophys. Res. 99, 5771–5792. doi:10.1029/93ja02867
Idolor, R. O., Akala, A. O., and Bolaji, O. S. (2022). African and American equatorial ionization anomaly (EIA) responses to 2013 SSW event. JGR. Space Phys. 127, e2021JA029848. doi:10.1029/2021JA029848
Idolor, R. O., Akala, A. O., and Bolaji, O. S. (2021). Responses of the african and American equatorial ionization anomaly (EIA) to 2014 arctic SSW events. Space weather. 19, e2021SW002812. doi:10.1029/2021SW002812
Jonah, O. F., de Paula, E. R., Kherani, E. A., Dutra, S. L. G., and Paes, R. R. (2014). Atmospheric and ionospheric response to sudden stratospheric warming of January 2013. J. Geophys. Res. Space Phys. 119, 4973–4980. doi:10.1002/2013JA019491
Kassamba, A. A., Doumbia, V., Obrou, O. K., Grodji, A., Tuo, Z., Kouassi, N., et al. (2020). Estimating the daytime vertical E × B drift velocities in the F-region of the equatorial ionosphere using the IEEY and AMBER magnetic data in West Africa. Adv. Space Res. 65, 2573–2585. doi:10.1016/j.asr.2020.03.008
Kodera, K. (2006). Influence of stratospheric sudden warming on the equatorial troposphere. Geophys. Res. Lett. 33, L06804. doi:10.1029/2005GL024510
Le Huy., M., and Amory-Mazaudier, C. (2005). Magnetic signature of the ionospheric disturbance dynamo at equatorial latitudes: “Ddyn”. J. Geophys. Res. 110, A10301. doi:10.1029/2004ja010578
Liu, H., Yamomoto, M., Tulasi Ram, S., Takuya, T., Otsuka, Y., Stolle, C., et al. (2011). Equatorial electrodynamics and neutral background in the Asian sector during the 2009 stratospheric sudden warming. J. Geophys. Res. 116, A08308. doi:10.1029/2011JA016607
Liu, H.-L., Wang, W., Richmond, A. D., and Roble, R. G. (2010). Ionospheric variability due to planetary waves and tides for solar minimum conditions. J. Geophys. Res. 115, A00G01. doi:10.1029/2009JA015188
Loewe, C. A., and Prolss, G. W. (1997). Classification and mean behavior of magnetic storms. J. Geophys. Res. 102, 14209–14213. doi:10.1029/96ja04020
Mannucci, A. J., Wilson, B. D., and Edwards, C. D. (1993). “A new method for monitoring the Earth’s ionosphere total electron content using the GPS global network,” in Proceedings of the 6th International Technical Meeting of the SatelliteDivision of the Institute of Navigation (ION GPS 1993), Salt Lake City, UT, 1323–1332.
Mannucci, A. J., Tsurutani, B. T., Iijima, B. A., Komjathy, A., Saito, A., Gonzalez, W. D., et al. (2005). Dayside global ionospheric response to the major interplanetary events of October 29–30, 2003 “Halloween Storms”. Geophys. Res. Lett. 32, 12. doi:10.1029/2004gl021467
Matsuno, T. (1971). A dynamical model of the stratospheric sudden warming. J. Atmos. Sci. 28, 1479–1494. doi:10.1175/1520-0469(1971)028<1479:admots>2.0.co;2
Maute, A., Hagan, M. E., Yudin, V., Liu, H.-L., and Yizengaw, E. (2015). Causes of the longitudinal differences in the equatorial vertical E×B drift during the 2013 SSW period as simulated by the TIME-GCM. JGR. Space Phys. 120, 5117–5136. doi:10.1002/2015JA021126
Mosna, Z., Edemskiy, I., Lastovicka, J., Kozubek, M., Knizova, P. K., Kouba, D., et al. (2021). Observation of the ionosphere in middle latitudes during 2009, 2018 and 2018/2019 sudden stratospheric warming events. Atmosphere 12, 602. doi:10.3390/atmos12050602
National Research Council (NRC) (2008). Severe space weather events – understanding societal and economic impacts. Washington, DC, USA: The National Academies Press.
Nishida, A. (1968). GeomagneticD<sub>p</sub>2 fluctuations and associated magnetospheric phenomena. J. Geophys. Res. 73, 1795–1803. doi:10.1029/ja073i005p01795
Oberheide, J., Pedatella, N. M., Gan, Q., Kumari, K., Burns, A. G., and Eastes, R. (2020). Thermospheric composition O/N response to an altered meridional mean circulation during sudden stratospheric warmings observed by GOLD. Geophys. Res. Lett. 47, e2019GL086313. doi:10.1029/2019GL086313
Paes, R. R., Batista, I. S., Candido, C. M. N., Jonah, O. F., and Santos, P. C. P. (2014). Equatorial ionization anomaly variability over the Brazilian region during boreal sudden stratospheric warming events. J. Geophys. Res. Space Phys. 119, 7649–7664. doi:10.1002/2014ja019968
Pancheva, D., and Mukhtarov, P. (2011). Stratospheric warmings: The atmosphere-ionosphere coupling paradigm. J. Atmos. Sol. Terr. Phys. 73, 1697–1702. doi:10.1016/j.jastp.2011.03.006
Pedatella, N. M., Richmond, A. D., Maute, A., and Liu, H. L. (2016). Impact of semidiurnal tidal variability during SSWs on the mean state of the ionosphere and thermosphere. JGR. Space Phys. 121, 8077–8088. doi:10.1002/2016/JA022910
Prolss, G. W. (2004). Physics of the Earth’s space environment. Verlag Berlin Heidelberg: Springer, 413–414.
Rabiu, A. B., Folarin, O. O., Uozumi, T., and Yoshikawa, A. (2017). “Simultaneity and asymmetry in the occurrence of counter equatorial electrojet along African longitudes,” in Ionospheric space weather: Longitude and hemispheric dependences and lower atmosphere forcing, geophysical monograph 220. Editors T. Fuller-Rowell, E. Yizengaw, P. H. Doherty, and S. Basu. (Hoboken, NJ: John Wiley & Sons), 21–31.
Rastogi, R. G. (1999). Morphological aspects of a new type of counter electrojet event. Ann. Geophys. 17, 210–219. doi:10.1007/s00585-999-0210-6
Scherhag, R. (1952). Die explosionsartigen Stratosphärenerwärmungen des Spätwinter 1951/1952 (The explosive warmings in the stratosphere of the late winter 1951/1952). Ber.Dtsch. Wetterd. U.S. Zone 38, 51–63.
Seemala, G. K. (2010). “Rinex GPS-TEC program, version 1.45. Satellite navig. Sci and tech for africa,” in Presentation at a workshop held from 23rd march–9th april, 2009 (Trieste, Italy: ICTP).
Sridharan, S., Sathishkumar, S., and Gurubaran, S. (2009). Variabilities ofmesospheric tides and equatorial electrojet strength during major stratospheric warming events. Ann. Geophys. 27, 4125–4130. doi:10.5194/angeo-27-4125-2009
Stening, R. J., Meek, C. E., and Manson, A. H. (1996). Upper atmosphere wind systems during reverse equatorial electrojet events. Geophys. Res. Lett. 23, 3243–3246. doi:10.1029/96gl02611
Tsurutani, B., Mannucci, A., Iijima, B., Abdu, M. A., Sobral, J. H. A., Gonzalez, W., et al. (2004). Global dayside ionospheric uplift and enhancement associated with interplanetary electric fields. J. Geophys. Res. 109 (A8), A08302. doi:10.1029/2003JA010342
Tsurutani, B. T., Verkhoglyadova, O. P., Mannucci, A. J., Saito, A., Araki, T., Yumoto, K., et al. (2008). Prompt penetration electric fields (PPEFs) and their ionospheric effects during the great magnetic storm of 30–31 October 2003. J. Geophys. Res. 113, A05311. doi:10.1029/2007JA012879
Vieira, F., Fagundes, P. R., Venkatesh, K., Goncharenko, L. P., and Pillat, V. G. (2017). Total electron content disturbances during minor sudden stratospheric warming, over the Brazilian region: A case study during january 2012. J. Geophys. Res. Space Phys. 122, 2119–2135. doi:10.1002/2016JA023650
Vineeth, C., Kumar Pant, T., Sridharam, R., and Sridharan, R. (2009). Equatorial counter electrojets and polar stratospheric sudden warmings – A classical example of high latitude – Low latitude coupling? Ann. Geophys. 27, 3147–3153. doi:10.5194/angeo-27-3147-2009
Yizengaw, E., Moldwin, E., Zesta, E., Biouele, C. M., Damtie, B., Mebrahtu, A., et al. (2014). The longitudinal variability of equatorial electrojet and vertical drift velocity in the African and American sectors. Ann. Geophys. 32, 231–238. doi:10.5194/angeo-32-231-2014
Yue, X., Schreiner, W. S., Lei, J., Rocken, G., Hunt, D. C., Kuo, Y., et al. (2010). Global ionospheric response observed by COSMIC satellites during the January 2009 stratospheric sudden warming event. J. Geophys. Res. 115, A00G09. doi:10.1029/2010JA015466
Keywords: equatorial ionization anomaly, sudden stratospheric warming, vertical drift, reverse fountain effects, traveling atmospheric disturbances (TADs), prompt penetration electric field (PPEF)
Citation: Idolor OR, Akala AO, Bolaji OS, Oyeyemi EO and Agbele AT (2022) Response of the American equatorial ionization anomaly to 2016 Arctic sudden stratospheric warming events. Front. Astron. Space Sci. 9:1024607. doi: 10.3389/fspas.2022.1024607
Received: 22 August 2022; Accepted: 14 October 2022;
Published: 02 November 2022.
Edited by:
Daniel Okoh, National Space Research and Development Agency, NigeriaReviewed by:
Veronika Barta, Institute of Earth Physics and Space Science (EPSS, ELKH), HungaryBenjamin Wisdom Joshua, Kebbi State University of Science and Technology Aliero, Nigeria
Copyright © 2022 Idolor, Akala, Bolaji, Oyeyemi and Agbele. This is an open-access article distributed under the terms of the Creative Commons Attribution License (CC BY). The use, distribution or reproduction in other forums is permitted, provided the original author(s) and the copyright owner(s) are credited and that the original publication in this journal is cited, in accordance with accepted academic practice. No use, distribution or reproduction is permitted which does not comply with these terms.
*Correspondence: O. R. Idolor, aWRvbG9yb21lbmFAeWFob28uY29t
 O. R. Idolor
 A. O. Akala1
 O. S. Bolaji