 A. R. A. Smith1*‡
 M. Pačes2 Swarm DISC†
- 1School of GeoSciences, University of Edinburgh, Edinburgh, United Kingdom
- 2EOX IT Services GmbH, Vienna, Austria
ESA’s Swarm mission is a constellation probing both Earth’s interior and geospace, delivering magnetic and plasma measurements which are used to generate many derived data products. From empirical magnetic field models of the core, crust, ionosphere, and magnetosphere, to multi-point estimates of ionospheric currents and in-situ plasma properties, these are challenging to navigate, process, and visualize. The VirES for Swarm platform (https://vires.services) has been built to tackle this problem, providing tools to increase usability of Swarm data products. The VirES (Virtual environments for Earth Scientists) platform provides both a graphical web interface and an API to access and visualise Swarm data and models. This is extended with a cloud-hosted development environment powered by JupyterHub (the “Virtual Research Environment/VRE”). VirES provides two API’s: the full VirES API for which a dedicated Python client is provided, viresclient, and the more interoperable Heliophysics API (HAPI). The VRE is furnished with a bespoke Python environment containing thematic libraries supporting science with Swarm. This service aims to ease the pathway for scientists writing computer code to analyze Swarm data products, increase opportunities for collaboration, and leverage cloud technologies. Beyond simply providing data and model access to Python users, it is extremely helpful to provide higher-level analysis and visualization tools, and ready-to-use code recipes that people can explore and extend. Critically for space physics, this involves crossover with many other datasets and so it is highly valuable to embed such tools within the wider data and software ecosystems. Through Swarm DISC (Data, Innovation, and Science Cluster), we are tackling this through cookbooks and Python libraries. Cookbooks are built and presented using Jupyter technologies, and tested to work within the VRE. A new library we are building is SwarmPAL, which includes tools for time-frequency analysis and inversion of magnetic field measurements for electric current systems, among others, while relying on the VirES server to provide data portability and other utilities. This paper reviews the current state of these tools and services for Swarm, particularly in the context of the Python in Heliophysics Community, and the wider heliophysics and geospace data environment.
1 Introduction
Swarm is a European Space Agency (ESA) spacecraft mission in Low Earth Orbit probing the electromagnetic environment around and within Earth1. Researchers making use of Swarm data products can face many challenges. These range from discovering, accessing, and comprehending an appropriate dataset for their research question, to forwards evaluation of various geomagnetic field models, to combining their analysis with external data sources, and bringing other algorithms and visualizations to the data. With the large and growing Python software ecosystem, it is of course crucial to place the Swarm data environment in close proximity to this. Considering the ever-increasing wealth of data sources (and volumes thereof), and potential tools to leverage such coming often from well beyond the domain of space sciences, while software systems are becoming increasingly complex, it is important to build sustainable solutions that can accommodate this complexity.
In this paper we outline the projects bringing Swarm products, tools and services to the community, with a focus on the Python ecosystem. These efforts are being carried out by EOX IT Services2 under contract to ESA, and by Swarm DISC (Data, Innovation, and Science Cluster) which is a consortium of institutions involved in Swarm data services. In the first part of the paper, we introduce the Swarm mission and its data products, and the VirES for Swarm service which provides convenient access to them. In the second part, we review the elements which connect to the Python ecosystem: the viresclient and SwarmPAL packages which provide access to the data and algorithms to process the data; the JupyterLab-based Virtual Research Environment (VRE): an easy way for researchers to immediately run code in the cloud; Swarm Notebooks, a cookbook of reproducible data recipes. We conclude with some discussion about how these elements fit into the wider software environment.
2 Swarm and VirES
2.1 The Swarm mission and its data products
Swarm was selected in 2004 in ESA’s Living Planet Programme to be the fifth mission within the fleet of Earth Explorers (Friis-Christensen et al., 2006). Swarm primarily comprises three spacecraft in Low Earth Orbit, gathering measurements of the magnetic field and plasma environment, which were launched on 22 November 2013. Having undergone several mission extensions Swarm continues to deliver well on its diverse objectives to study the geomagnetic field and related phenomena, probing properties and behavior all the way from Earth’s core to the magnetosphere. It is likely that the three primary Swarm spacecraft will continue to operate into the 2030s. However, there is an increasing focus on moving toward a “true Swarm of magnetic satellites” (Olsen et al., 2019), to integrate better with other current and future spacecraft to make more use of complementary data and to draw an even greater benefit from Swarm. One example of this is the introduction of the Canadian Space Agency’s e-POP (enhanced Polar Outflow Probe) payload aboard the CASSIOPE (Cascade, Smallsat and Ionospheric Polar Explorer) spacecraft as the fourth element of Swarm under ESA’s Earthnet Third Party Mission Programme, and similar synergy being found with the CSES (China Seismo-Electromagnetic Satellite) program of CNSA (the China National Space Administration). Another example is new processing and calibration of platform magnetometer data from selected spacecraft: currently Cryosat-2, GRACE A and B (Gravity Recovery and Climate Experiment), GRACE-FO 1 and 2 (GRACE Follow-On), GOCE (Gravity Field and Steady-State Ocean Circulation Explorer), and more planned, to create science-grade data products, delivered through the Swarm framework (see, for example, Olsen et al. (2020) and Stolle et al. (2021)).
The Swarm spacecraft carry several instruments. The Absolute Scalar Magnetometer (ASM) and Vector Field Magnetometer (VFM) together measure the intensity and vector of the magnetic field. The Electric Field Instrument (EFI) consists of the Thermal Ion Imager (TII) and Langmuir Probe (LP), measuring plasma density, drift and velocity. The instrument package is completed with accelerometers (ACC) and GNSS receivers (GPSR). These instruments all produce relatively simple low level data products (time series), but the proper calibration and correction of these is quite complex. Further to this, much of the utility of the collected data is only realized after the expert development and application of specialized algorithms to create higher level data products that can be more readily consumed and analyzed by the wider scientific community. These factors mean that there are currently approaching one hundred data products publicly available, in many cases multiplied by three (plus) spacecraft. The products range from electric current estimates inverted from the magnetic measurements (e.g., field-aligned currents: FACxTMS_2F), to estimated ion drifts and masses (e.g., EFIxIDM_2_), to spherical harmonic models of the core (e.g., the CHAOS - CHAMP, Ørsted, SAC-C, and Swarm—model, Finlay et al., 2020) or ionosphere (e.g., the AMPS—Average Magnetic field and Polar current System—model, Laundal et al., 2018). The journey for a researcher to discover, access, and analyze such data can be quite long and difficult, though, as we hope to demonstrate in this paper, this situation is improved by availability of software and services that help researchers to navigate this landscape.
2.2 VirES data retrieval and visualization system
VirES for Swarm3 started as an interactive data visualization and retrieval interface for the Swarm data products. Accessible directly through a web browser it allows anyone to view data and models both on a 3D globe and on 2D plots, in just a few mouse clicks (see Figure 1). Combinations of different data products can be selected and viewed together over a time window of interest, and plots have a degree of user-customizability to make them publication-ready. The web interface is not the focus of this paper, but it is a valuable part of the infrastructure because it is one of the foremost examples of accessible visualization tools in space physics and can still be very useful even when a particular user is comfortable processing data through Python. It can be used by newcomers to Swarm to gain familiarity and intuition about the data products, and by experienced users to quickly check events on particular days, for example.
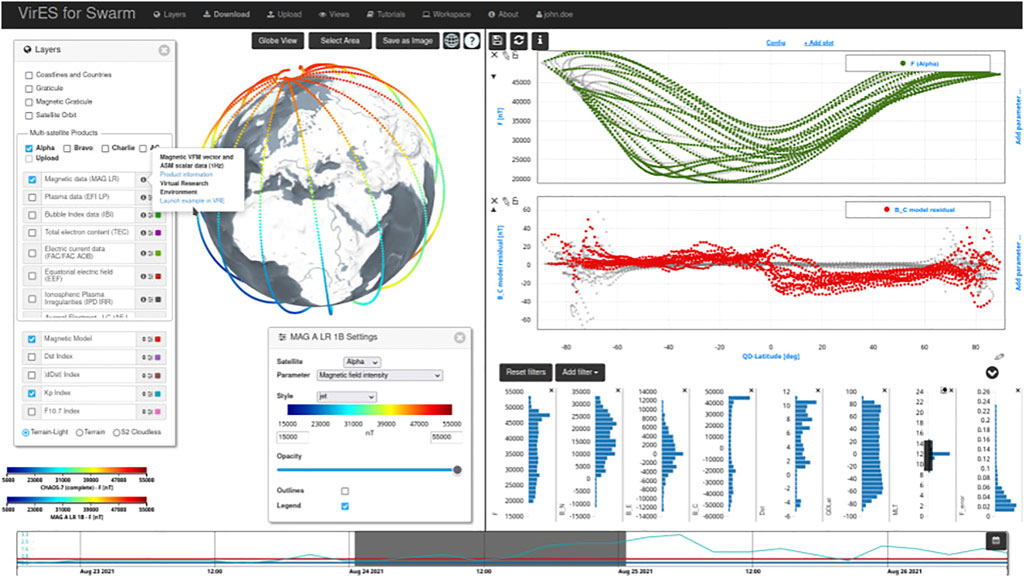
FIGURE 1. VirES web interface (https://vires.services): The layers panel on the left allows selection of multiple datasets together; the time slider on the bottom selects the time period of interest; a globe view and an “analytics” view can be used together to generate both 3D and 2D visualizations.
A large part of what gives the web interface its functionality, and makes the infrastructure as a whole more sustainable, is that it is backed by the VirES Server (see Figure 2) which holds a database of the data products synchronized to their latest versions and offers various ways to interact with them. The server is built in part on the Django framework and other open source projects. It implements Open Geospatial Consortium (OGC4) standards for its Application Programming Interface (API) which allows it to communicate not only with the web interface but also other clients in a robust way. In particular, a component of the server is based on the OGC Web Processing Service (WPS) interface standard. This allows an external element to trigger one of a number of predefined processes on the service, passing custom parameters to the process to control its behavior, and thus retrieve customized data on-demand. This allows users to query subsets of the data, for example, by filtering by a range in Latitude or other available parameters. Another way in which is this is used is to evaluate auxiliary parameters such as magnetic local time (MLT) or to perform forward evaluation of geomagnetic field models at the same sample points as the data, without the code for such needing to be available on the client side. In 2022 the server was extended with an additional API, the Heliophysics API (HAPI, Weigel R. et al., 2021)5, to allow smoother interoperability with other tools across heliophysics. Details of the HAPI implementation and the currently enabled datasets are available at the /hapi endpoint6.
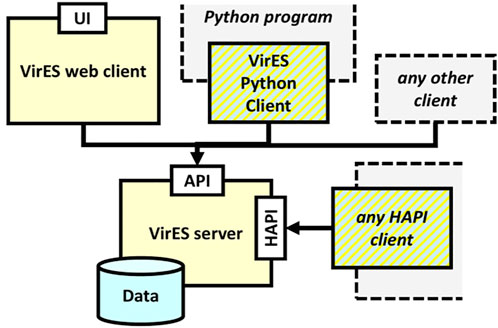
FIGURE 2. VirES architecture: The server holds data synchronized from external sources, which are accessible through the VirES API and the HAPI through a range of client software.
3 Tools and services to support scientific Python code
3.1 VirES Python client
Access to the VirES API was opened up in 2019 to allow machine-to-machine access outside of the graphical web interface. While it is possible to use the API directly, it is most convenient for the scientific audience to make use of the Python client which handles the communication with the server and loading of retrieved data into Python data types. This client is named viresclient (Smith et al., 2022)7 and is available on the Python Package Index. The package allows the user to retrieve any data from the VirES service and bring it into the Python data ecosystem in just a few lines of code. It is very similar in usage pattern and ethos to broader data access libraries such as hapiclient (Weigel B. et al., 2021) or speasy (Jeandet and Schulz, 2022), though with specific features to accommodate possibilities with VirES.
The goal of viresclient is to make the data portable (see Figure 3). A user only needs to copy a short code example to bring the data into their own system, and adjust it for their needs. This works best for small volumes of data, but is more challenging with larger volumes where processing times, file management, and memory limits can become an issue. We keep the scope of the package intentionally limited to keep dependencies simple and ensure that it can be a reliable building block. The package also supports access to the “VirES for Aeolus” service8.
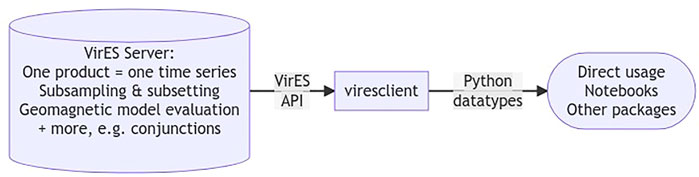
FIGURE 3. Connecting VirES to the Python ecosystem.
While there are a few other features of the library (supporting other processes on VirES), the core usage is shown in Figure 4, which is demonstrative of the capabilities of the server side. A user first specifies which collection (i.e., dataset) they wish to access using .set_collection(), then they specify some configuration for that data using .set_products(): parameters to select from the dataset (measurements=), geomagnetic models to evaluate along the orbits (models=), to only return the data-model residuals (residuals=True), some auxiliary parameters that otherwise wouldn’t be available within the source dataset (auxiliaries=), and an optional re-sampling of the data (sampling_step=). One can also specify to only retrieve a subset of the data according to values of a given parameter with .set_range_filter()—this can be useful for example for only retaining data with certain quality flags or to search within a geographical region. Finally one triggers the request to the server with .get_between(), specifying any time window desired. The request is processed on the server and if successful returns a data object which points to the downloaded data (stored as a temporary file, or set of files if a long time window was chosen). The user then has a choice about how to open the data for processing: currently we support the Pandas DataFrame and the Xarray Dataset, but more options could be added in the future.
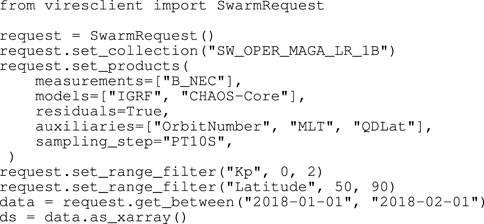
FIGURE 4. Example usage of viresclient .request refers to an object that configures the request to the server .data refers to an object pointing to temporary data that has been created on-disk, delivered from the server .ds is an in-memory representation of the data loaded using the Xarray package.
3.1.1 Metadata and ontologies
The set of available data and models (i.e., those which have been defined on the server) can be found by users of viresclient using built-in methods such as .available_collections() giving a list of datasets, termed “collections” within VirES, .available_measurements() giving a list of parameters available within a given collection, or .available_models() giving a list of the available geomagnetic model names. The names of these entities (for example the strings “SW_OPER_MAGA_LR_1B” or “IGRF”) are hard-coded into the server using either the official names of products as published by ESA, where available, or other names that can be understood by the user community (for example “IGRF” referring to the International Geomagnetic Reference Field). While these are defined systematically within the VirES database, they are not connected to a wider ontology such as those defined within ESPAS, the “near-Earth space data infrastructure for e-science” (Belehaki et al., 2016), or SPASE, Space Physics Archive Search and Extract (Roberts et al., 2018). This missing feature is likely to cause friction going forward as we anticipate to serve more datasets to more users, and seek interoperability with other systems to enable more multi-dataset multi-source science.
3.2 Swarm product algorithm laboratory and other thematic libraries
SwarmPAL (the Swarm Product Algorithm Laboratory) is currently in early development so the direction is highly likely to change, but it is worth outlining the current plan here. SwarmPAL is a new Python package containing a second level of tools over the top of data retrieved through viresclient and other sources, being developed openly on GitHub9. The goal of this package is to provide a range of analysis and visualization tools relevant to Swarm data products: it will hold proven algorithms that can be applied flexibly to the data, in effect producing new custom higher level data products on-demand, together with relevant visualizations for them. There are several Swarm DISC projects ongoing to deliver code-based toolboxes to work with Swarm products and SwarmPAL will be the home for these where appropriate. This will help us to centralize code quality improvements and maintenance, enable toolboxes to share elements, and present a coherent experience for the end users. Currently we are working on the addition of toolbox code from two Swarm DISC projects, TFA (time frequency analysis), and DSECS (dipolar spherical elementary current systems), with the potential to extend it further in the future.
As shown in Figure 5, the structure of the package is layered in order to support more flexible usage patterns. Swarm data may be loaded quasi-automatically and input directly to algorithms through special interfaces attached to internal data structures. This effectively allows users to follow a shortcut directly to a derived dataset and its visualization, where aspects of the processing details can be abstracted away. Underneath that, however, the more functionally-designed routines performing individual steps are also exposed. These may be used in a more manual fashion together with other packages or datasets.
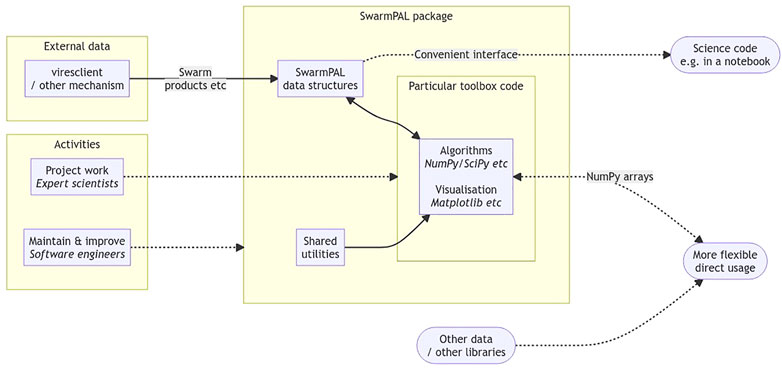
FIGURE 5. Schematic for the structure and usage patterns for SwarmPAL. While the package provides interfaces to run code immediately with Swarm data, hiding away the data access and processing steps, the underlying routines are accessible to use in more flexible ways through standard objects like NumPy arrays.
It should be noted at this point that there are several other Python packages closely related to Swarm, such as ChaosMagPy (Kloss, 2022)10, providing tools for working with the CHAOS model and other field modeling utilities, and pyAMPS (Laundal and Toresen, 2018)11, supporting the AMPS model. There is also eoxmagmod12 which is used internally in the VirES server to provide optimized forward evaluation of geomagnetic models, but can also be used externally though is not yet very accessible. SwarmPAL is not meant to replace such libraries as they have different goals and requirements, but they could be brought in as dependencies for SwarmPAL or vice versa. On a related note, development of SwarmPAL must be very cognizant of other domain-specific libraries (such as those described within this issue) and concerns may be raised about interoperability and sustainability, particularly where usage scenarios may involve combining multiple packages. Furthermore, there is a received wisdom that scientific codes have a longer life when they are part of a larger non-project specific framework, so it may be that functionalities within SwarmPAL migrate to a different package in the future.
3.3 Virtual research environment
The most accessible software services are those which are cross-platform and require no installation by the user. JupyterHub and related Jupyter technologies such as the Jupyter Notebook format and paradigm have risen to dominance in recent years, lowering the barrier of entry for data science (and similar) workflows where writing code is necessary and embedding the human element into the way we approach interactive computing (Granger and Perez, 2021). Researchers often spend a long time configuring software and face many challenges in sharing their code with other researchers, greatly impeding time which can be better spent focusing on research questions. These factors strongly motivate the usage of shared JupyterHub systems for user groups with similar needs where software and hardware configuration can be performed centrally, giving rise to quicker on-boarding of new researchers and smoother options for collaboration. As an extension of the VirES service we provide such a Jupyter environment free to anyone with a user account on VirES, furnished with a selection of thematic libraries, and operating on cloud infrastructure. This service is called the Virtual Research Environment (VRE, or Swarm-VRE)13, intended as a dynamic space to facilitate software development with Swarm. From the user perspective, it provides them with an Interactive Development Environment (IDE) in the form of JupyterLab that they can access directly through a web browser from any machine.
As an evolving service the future of the VRE depends on the users and their needs, and must strike a balance between ease of use (and ease of maintenance) and functionality when considering changes and additions to the environment. Likewise, it does not exist in a vacuum and will also be shaped by its surroundings. The system relies on many individual software components that themselves are evolving, from those supporting Jupyter (related to both the abstraction layers linking to the physical infrastructure, and the interface of the IDE and execution of notebooks), to the general-purpose Python scientific libraries, to the domain-specific libraries used within certain research areas. There are also many related initiatives, as different organizations move toward adoption of cloud-based services and/or containerization where they are useful for tackling the challenges of Big Data and collaboration in a world with increasingly complex software environments. Some of these are discussed in the Related Work section.
3.4 Swarm notebooks
A computational notebook, of which Jupyter Notebook is a prime contemporary example, is a natural way to express a research workflow where narrative, code, and results are interwoven in a medium which encourages rapid iteration and experimentation. There are also many more possibilities when combined with other utilities across the rapidly evolving Jupyter landscape, from parameterisation and automation with Papermill14 to publication with Jupyter Book15, as just two examples. Nevertheless, although achieving widespread adoption, notebooks do still present challenges in usability and sustainability. Here we discuss some of the ways in which we are using notebooks to support Swarm in the context of these challenges.
As part of the VRE, we include a collection of “Swarm Notebooks”16 as a cookbook of reproducible recipes to work with Swarm. These perform several roles to assist people in using a new dataset or tool, showing exactly how to access a dataset alongside references that describe it, and how to bring different packages together to make use of that dataset. A precise recipe that can be executed immediately can be of great benefit to discoverability and accessibility of tools and data. We make use of continuous integration to ensure that these notebooks continue to run correctly and reliably within the VRE, as libraries get updated and other changes occur. By using Jupyter Book to compile the executed notebooks into a website17, we enable them to be found on the web and connected to the infrastructure that allows them to be executed. This approach has already been replicated to support the Aeolus mission as well18. The architecture is indicated in Figure 6.
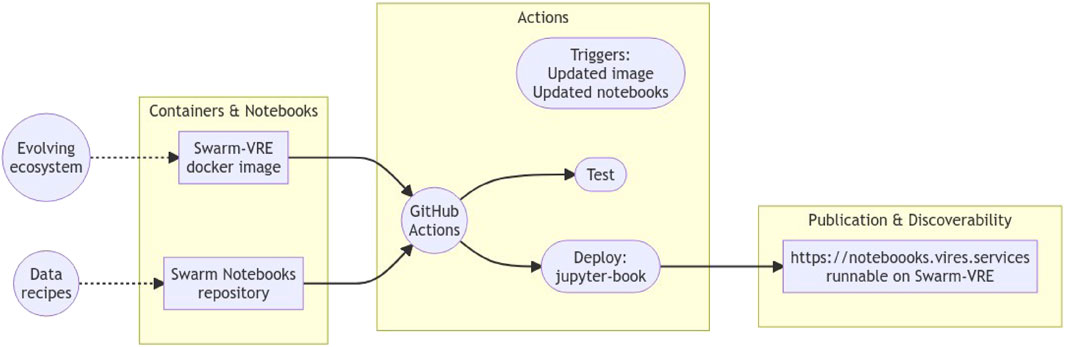
FIGURE 6. Architecture for maintaining notebooks. Containers provide a reliable execution environment both for testing the notebooks automatically and for end users interacting with notebooks on the JupyterHub. Notebooks are stored in a versioned repository to which multiple people can contribute, which are then tested on GitHub Actions and compiled into an HTML representation using Jupyter Book (verifying that they execute from top to bottom and allowing a human to manually review the output). The Jupyter Book deployment is the main way in which people can discover and read the notebooks, linked to the JupyterHub in order to interact with them.
In a similar fashion to the Swarm Notebooks repository, whose scope is to present a range of recipes to work with Swarm, we also extend the approach to other repositories with different goals. One example is FAC Exploration19 (an earlier iteration of the SwarmFACE package; see Blagau et al. in this special issue), which is closer in intention to an executable paper, where specific phenomena are investigated and presented in a reproducible way for anyone to adjust and extend. By employing automation similar to the main Swarm Notebooks, we pave the way to enable maintenance of such resources so that they can continue to be accessed through the VRE as the service evolves, and aim to provide instructions enabling portability to other platforms. The creation of notebooks, which may also be connected to importable modules or scripts distributed together with the notebooks, is a reasonably accessible way for scientists to share their computational research in comparison to building full libraries or applications. When coupled with a centralized service that enables execution of these materials (subject to their adequate maintenance), this approach can be quite powerful, though it does not negate the need for well-engineered scientific libraries to provide the more re-usable building blocks.
Instead of bundling all notebook resources into one repository that would be challenging to maintain, or having many isolated projects with dissimilar methods for maintenance, we identify some common patterns that can be re-used and adjusted slightly across inter-linked projects. Namely, the use of containers, actions/automation, and notebooks in combination, where the particular tools we use for these are Docker, GitHub Actions, and Jupyter respectively. We use containerization to provide the execution environment (i.e., using the Docker image backing the VRE) which is used by GitHub Actions to systematically execute notebooks (on changes to either the notebooks or the environment) which are published to the web with Jupyter Book. Any issues found during updates can then be highlighted by this process, while simultaneously providing the web resource that people can use to discover and use the content. Such resources can be interlinked to form a knowledge network.
4 Related work
We have presented our Swarm-VRE, but we have not yet discussed how this service fits into the wider landscape where many players are building and supporting similar services. Such initiatives include Pangeo20, a community platform for Big Data geoscience; HelioCloud21, similar in goals to Pangeo, but targeting heliophysics; Resen22 (Reproducible Software Environment, Bhatt et al., 2020); AMDA23 (Automated Multi-Dataset Analysis), a virtual research platform in operation since before the rise of Jupyter (Génot et al., 2021); PITHIA-NRF24 (Plasmasphere Ionosphere Thermosphere Integrated Research Environment and Access services: a Network of Research Facilities), an upcoming platform to support geospace science and services; and AuroraX25, a data platform for auroral science.
While the services listed above have different goals from Swarm-VRE (generally broader in scope, and domain-specific rather than mission-specific) and each has emerged from different frameworks and approaches, they share common threads. They aim to bridge the gap between complex layers of software and the end users, and they all rely on robust access to data, arriving at different solutions to provide that. The proliferation of different tools and services is inevitable, and we believe to achieve sustainability such projects always need to acknowledge that they exist within an ecosystem and so the sub-elements providing interoperability are the ones that will receive the greatest return on investment. Thus, while Swarm-VRE focuses on supporting applications with Swarm in particular, it should also be an engine for development and support of reusable components (i.e. libraries and notebooks) that can be utilized elsewhere, and its future will be shaped by close attention to and collaboration with other projects.
5 Future work
The evolution of VirES is directly connected to the expansion of the Swarm product portfolio and ongoing changes to the processing systems and publication and dissemination of these data.
ESA will soon launch a new “Swarm Data Handbook” as a tool for discovery and navigation of the Swarm products and their science level metadata (i.e., explanations of the data and links to other resources), giving a more convenient interface than the current documentation. Persistent identifiers (i.e., Digital Object Identifiers, DOI) and JSON-LD (JavaScript Object Notation for Linked Data) will be attached to each item, which will help these products to follow the FAIR (Findable, Accessible, Interoperable, and Reusable) data principles (as explained by, for example, Masson et al., 2021). This is also an important step toward strengthening the ontology of objects within VirES (by including these references) and potentially integrating the products within systems such as SPASE. We expect to expand the publishing of data within VirES over the HAPI interface and through the Handbook activity increase utility of metadata in connecting with other data systems. We also foresee expansion of capabilities in VirES around handling of geomagnetic models (and potentially other types of model).
In coordination with scientists we will increase the coverage of tools and examples available within the VRE, while focusing on the aspects of portability (one can run the code anywhere) and modularity (one can flexibly use individual components). Sometimes this will mean adding functionality to viresclient and SwarmPAL, and improving the available notebooks (and encouraging community contribution thereto); sometimes supporting Swarm-adjacent Python tools (i.e., those within the orbit of Swarm but remaining autonomous from the VRE project); and sometimes connecting with tools from the wider Python ecosystem. Meanwhile, the interface of JupyterLab and other tooling around Jupyter will improve to help make notebooks more accessible and maintainable but it will remain a community effort to provide training and share ideas around using the tools and the data to accomplish science tasks.
6 Conclusion
With Swarm being an explorer of both the solid Earth and geospace, its data environment and applications are diverse. VirES provides interfaces to the data and models which are cognizant of this, for example handling near-Earth geomagnetic models so that space physicists do not need to interact with them directly, and ability to sub-select data by geographic region or other parameters. By handling some common requirements like these on the server accessible through a request-driven interface, the burden on the user side can be lightened (i.e., users do not need to have the full dataset downloaded in order to access subsets, and do not need to have the ability to perform the model forward evaluations). The server can be accessed through viresclient but also (with more limitations) through HAPI, which opens up pathways for different usages and integration through the Python ecosystem. In this paper we have shown how we build on this and make it more accessible through development of libraries and Jupyter notebooks backed by the VRE, but to achieve a broader impact and sustainability ongoing integration with other tools and services will be needed.
It is widely appreciated that data science will bring further momentum to discovery in geospace (e.g., McGranaghan et al., 2017), a trend that will accelerate with a growing number of available data sources, and so research funders should recognize the criticality of data systems in driving and supporting research activities. Likewise, developers of data systems need to remain aware of and engage with related activities, which can happen through fora such as the International Heliophysics Data Environment Alliance (IHDEA26). As is evident from the other articles in this issue, researchers need the ability to write analysis code that may draw from a number of different data systems or software tools, and Python is the most popular language and ecosystem for this (e.g., Python in Heliophysics Community27), being accelerated by the interactive computing paradigm supported by Jupyter and broader appreciation of the benefits of open science driven by open code. The Python software environment for Swarm is being developed in this context and seeks further alignment with related projects.
Data availability statement
The original contributions presented in the study are included in the article/supplementary material, further inquiries can be directed to the corresponding author.
Author contributions
ARAS has written the content of this article summarizing activities supported by Swarm DISC. MP is the lead software engineer on the VirES project. Both authors contributed to manuscript revision and approved the submitted version.
Funding
This work has been supported by the Swarm DISC project, funded by ESA through contract No. 4000109587/13/I-NB.
Conflict of interest
MP was employed by EOX IT Services GmbH.
The remaining authors declare that the research was conducted in the absence of any commercial or financial relationships that could be construed as a potential conflict of interest.
Publisher’s note
All claims expressed in this article are solely those of the authors and do not necessarily represent those of their affiliated organizations, or those of the publisher, the editors and the reviewers. Any product that may be evaluated in this article, or claim that may be made by its manufacturer, is not guaranteed or endorsed by the publisher.
Footnotes
1https://earth.esa.int/eogateway/missions/swarm
7https://github.com/ESA-VirES/VirES-Python-Client
9https://github.com/Swarm-DISC/SwarmPAL
10https://github.com/ancklo/ChaosMagPy
11https://github.com/klaundal/pyAMPS/
12https://github.com/ESA-VirES/MagneticModel
13https://earth.esa.int/eogateway/tools/swarm-vre
14https://github.com/nteract/papermill
15https://github.com/executablebooks/jupyter-book
16https://github.com/Swarm-DISC/Swarm_notebooks
17https://notebooks.vires.services
18https://notebooks.aeolus.services
19https://github.com/Swarm-DISC/FAC_exploration
22https://ingeo.datatransport.org/home/resen
References
Belehaki, A., James, S., Hapgood, M., Ventouras, S., Galkin, I., Lembesis, A., et al. (2016). The ESPAS e-infrastructure: Access to data from near-Earth space. Adv. Space Res. 58, 1177–1200. doi:10.1016/J.ASR.2016.06.014
Bhatt, A., Valentic, T., Reimer, A., Lamarche, L., Reyes, P., and Cosgrove, R. (2020). Reproducible software environment: A tool enabling computational reproducibility in geospace sciences and facilitating collaboration. J. Space Weather Space Clim. 10, 12. doi:10.1051/swsc/2020011
Finlay, C. C., Kloss, C., Olsen, N., Hammer, M. D., Tøffner-Clausen, L., Grayver, A., et al. (2020). The CHAOS-7 geomagnetic field model and observed changes in the South Atlantic Anomaly. Earth Planets Space 72, 156–231. doi:10.1186/s40623-020-01252-9
Friis-Christensen, E., Luhr, H., and Hulot, G. (2006). Swarm: A constellation to study the Earth’s magnetic field. Earth Planets Space 58, 351–358. doi:10.1186/BF03351933
Génot, V., Budnik, E., Jacquey, C., Bouchemit, M., Renard, B., Dufourg, N., et al. (2021). Automated Multi-Dataset Analysis (AMDA): An on-line database and analysis tool for heliospheric and planetary plasma data. Planet. Space Sci. 201, 105214. doi:10.1016/J.PSS.2021.105214
Granger, B. E., and Perez, F. (2021). Jupyter: Thinking and storytelling with code and data. Comput. Sci. Eng. 23, 7–14. doi:10.1109/MCSE.2021.3059263
Laundal, K. M., Finlay, C. C., Olsen, N., and Reistad, J. P. (2018). Solar wind and seasonal influence on ionospheric currents from Swarm and CHAMP measurements. J. Geophys. Res. Space Phys. 123, 4402–4429. doi:10.1029/2018JA025387
Masson, A., De Marchi, G., Merin, B., Sarmiento, M. H., Wenzel, D. L., and Martinez, B. (2021). Google dataset search and DOI for data in the ESA space science archives. Adv. Space Res. 67, 2504–2516. doi:10.1016/J.ASR.2021.01.035
McGranaghan, R. M., Bhatt, A., Matsuo, T., Mannucci, A. J., Semeter, J. L., and Datta-Barua, S. (2017). Ushering in a new frontier in geospace through data science. JGR. Space Phys. 122, 12586–12590. doi:10.1002/2017JA024835
Olsen, N., Albini, G., Bouffard, J., Parrinello, T., and Tøffner-Clausen, L. (2020). Magnetic observations from CryoSat-2: Calibration and processing of satellite platform magnetometer data. Earth Planets Space 72, 48. doi:10.1186/S40623-020-01171-9
Olsen, N., Tøffner-Clausen, L., Kloss, C., and Finlay, C. (20192019). “Exploring earth from space – towards a true Swarm of magnetic satellites,” in Living Planet symposium (Milan: Italy).
Roberts, D. A., Thieman, J., Génot, V., King, T., Gangloff, M., Perry, C., et al. (2018). The SPASE data model: A metadata standard for registering, finding, accessing, and using heliophysics data obtained from observations and modeling. Space weather. 16, 1899–1911. doi:10.1029/2018SW002038
Smith, A. R. A., Pačes, M., and Santillan, D. (2022). ESA-VirES/VirES-Python-Client. Online, Zenodo. doi:10.5281/zenodo.2554162
Stolle, C., Michaelis, I., Xiong, C., Rother, M., Usbeck, T., Yamazaki, Y., et al. (2021). Observing Earth’s magnetic environment with the GRACE-FO mission. Earth Planets Space 73 (1 73), 51. doi:10.1186/S40623-021-01364-W
Weigel, B., Batta, H. N., Faden, J., and jvandegriff, (2021a). hapi-server/client-python. Online, Zenodo. doi:10.5281/zenodo.5553155
Keywords: swarm, python, space weather, geospace, geomagnetism
Citation: Smith ARA and Pačes M (2022) Python tools for ESA’s Swarm mission: VirES for Swarm and surrounding ecosystem. Front. Astron. Space Sci. 9:1002697. doi: 10.3389/fspas.2022.1002697
Received: 25 July 2022; Accepted: 03 October 2022;
Published: 31 October 2022.
Edited by:
K.-Michael Aye, Freie Universität Berlin, GermanyReviewed by:
Gabriele Pierantoni, University of Westminster, United KingdomBaptiste Cecconi, UMR8109 Laboratoire d'études spatiales et d’instrumentation en astrophysique (LESIA), France
Copyright © 2022 Smith and Pačes. This is an open-access article distributed under the terms of the Creative Commons Attribution License (CC BY). The use, distribution or reproduction in other forums is permitted, provided the original author(s) and the copyright owner(s) are credited and that the original publication in this journal is cited, in accordance with accepted academic practice. No use, distribution or reproduction is permitted which does not comply with these terms.
*Correspondence: A. R. A. Smith, YXNobGV5LnNtaXRoQGVkLmFjLnVr
‡ORCID: A. R. A. Smith, orcid.org/0000-0001-5198-9574
†The Swarm Data, Innovation, and Science Cluster